Triton International Ltd. · NYSE:TRTN/PA
Triton International — Investor Day (May 2018)
77 slides from Triton International's investor day presentation, May 31, 2018
Slide 1: Investor Day 2018
INVESTOR DAY 2018 May 31, 2018 1
Slide 2: Disclaimer
DISCLAIMER Forward-Looking Statements Certain statements in this presentation, other than purely historical information, are "forward-looking statements" within the meaning of the Private Securities Litigation Reform Act of 1995, Section 27A of the Securities Act of 1933, as amended, and Section 21E
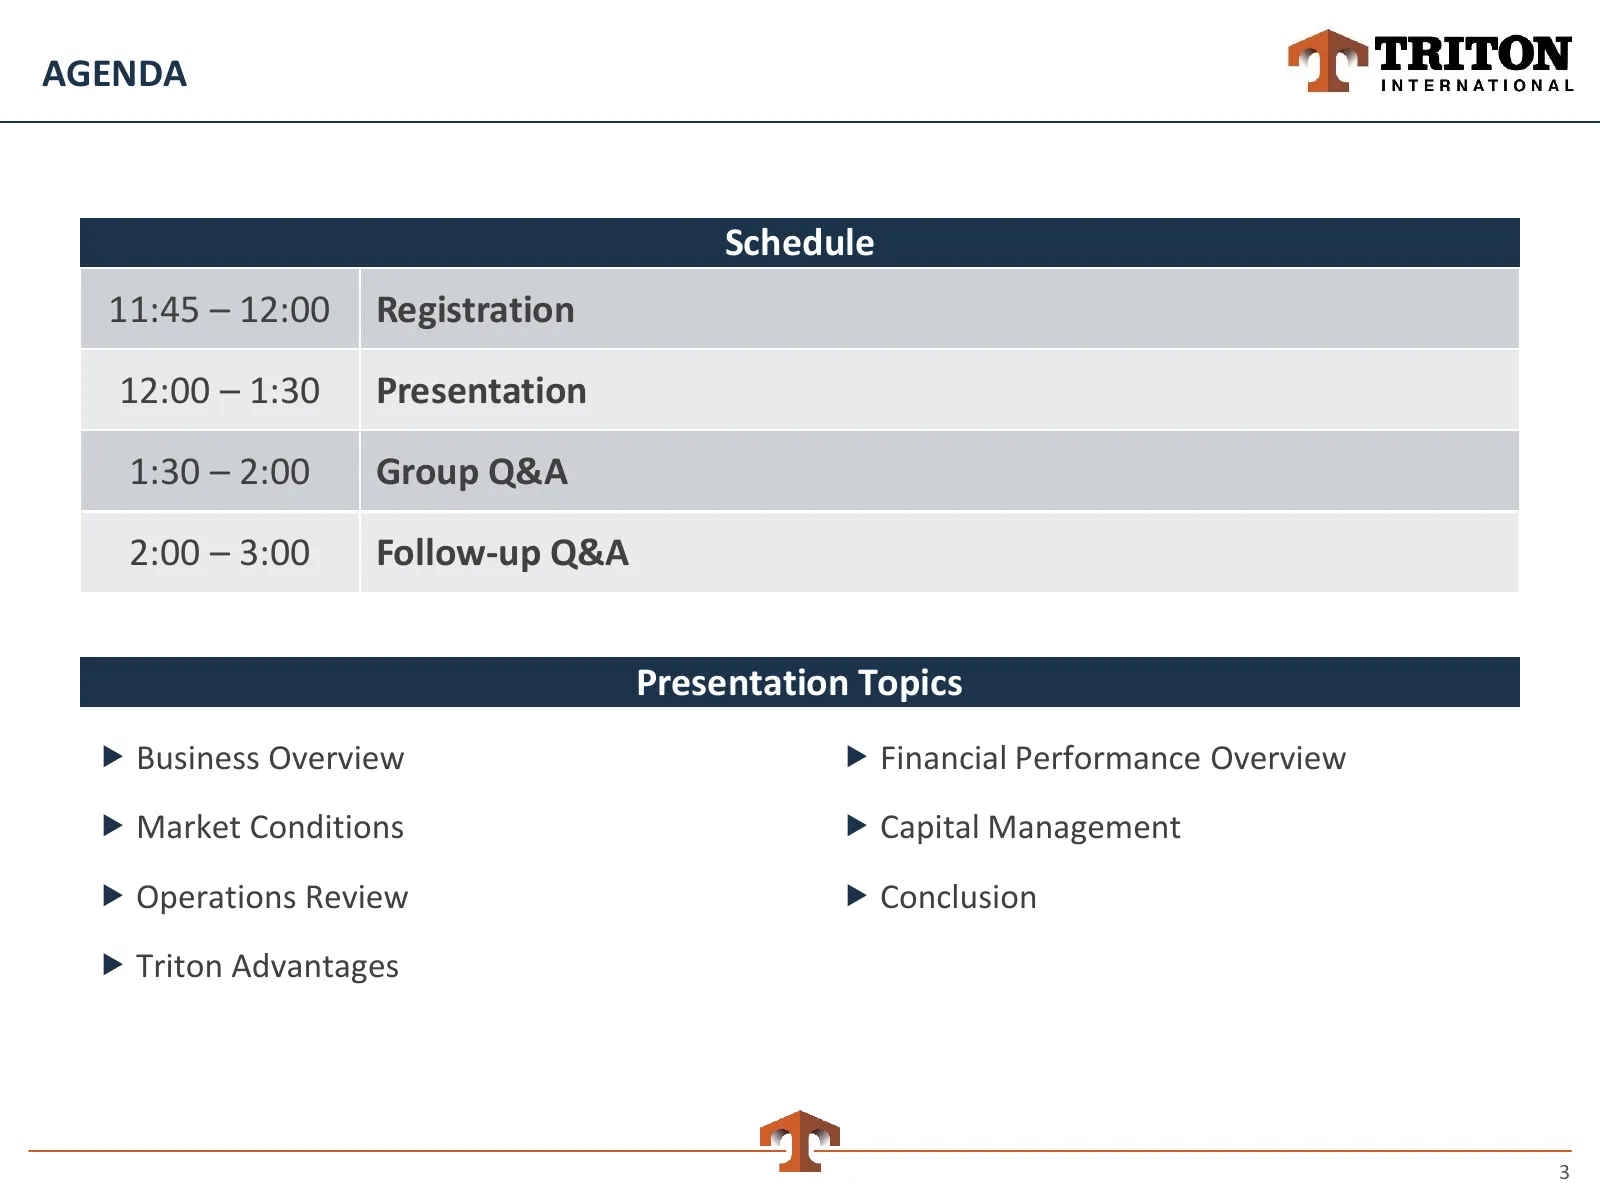
Slide 3: Agenda
AGENDA Schedule 11:45 – 12:00 Registration 12:00 – 1:30 Presentation 1:30 – 2:00 Group Q&A 2:00 – 3:00 Follow-up Q&A Presentation Topics Business Overview Financial Performance Overview Market Conditions Capital Management Operations Review Conclusion Triton Advantages 3

Slide 4: Presenters
PRESENTERS Brian Sondey John Burns Chairman and Chief Executive Officer Chief Financial Officer 21 years of industry experience 21 years of industry experience Formerly Chief Executive Officer of TAL Formerly Chief Financial Officer of TAL International, since 1999 International, since 2009
Slide 5: Business Overview
Business Overview ef’ TRITON INTERNATIONAL
Slide 6: Introduction
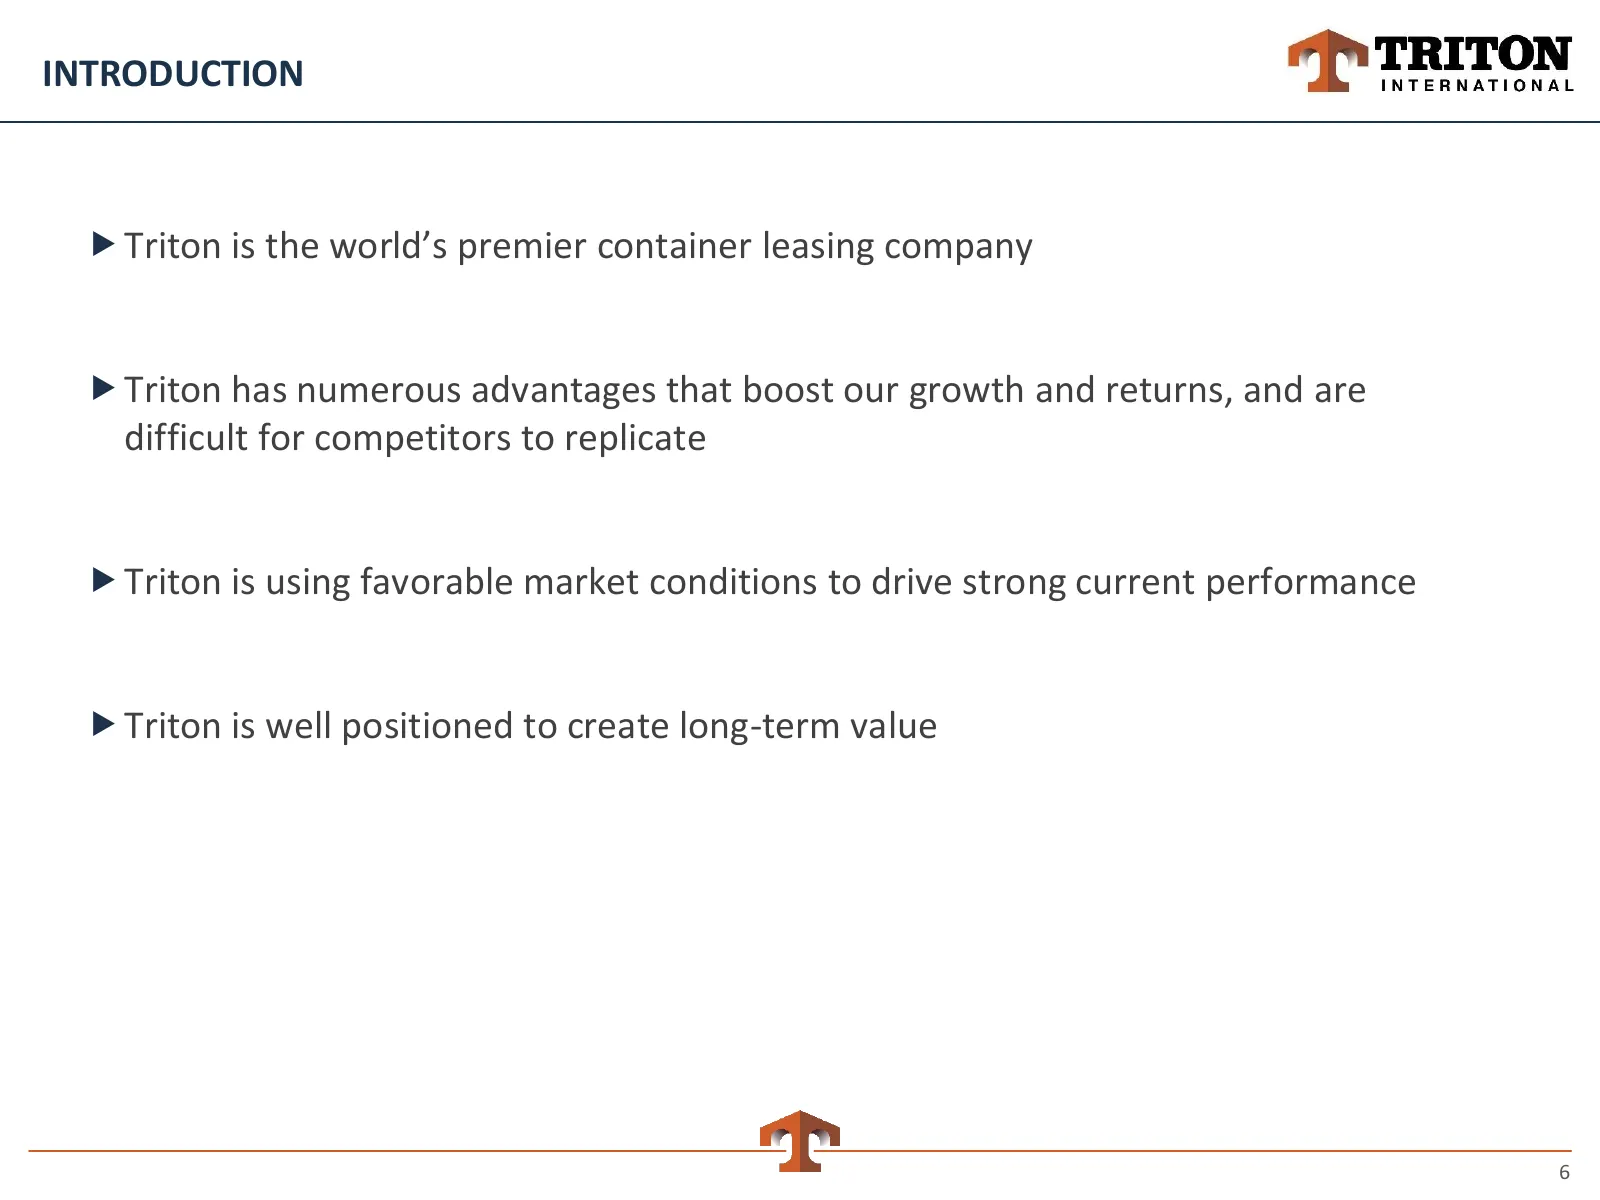
INTRODUCTION Triton is the world’s premier container leasing company Triton has numerous advantages that boost our growth and returns, and are difficult for competitors to replicate Triton is using favorable market conditions to drive strong current performance Triton is well positioned to c
Slide 7: Corporate Snapshot
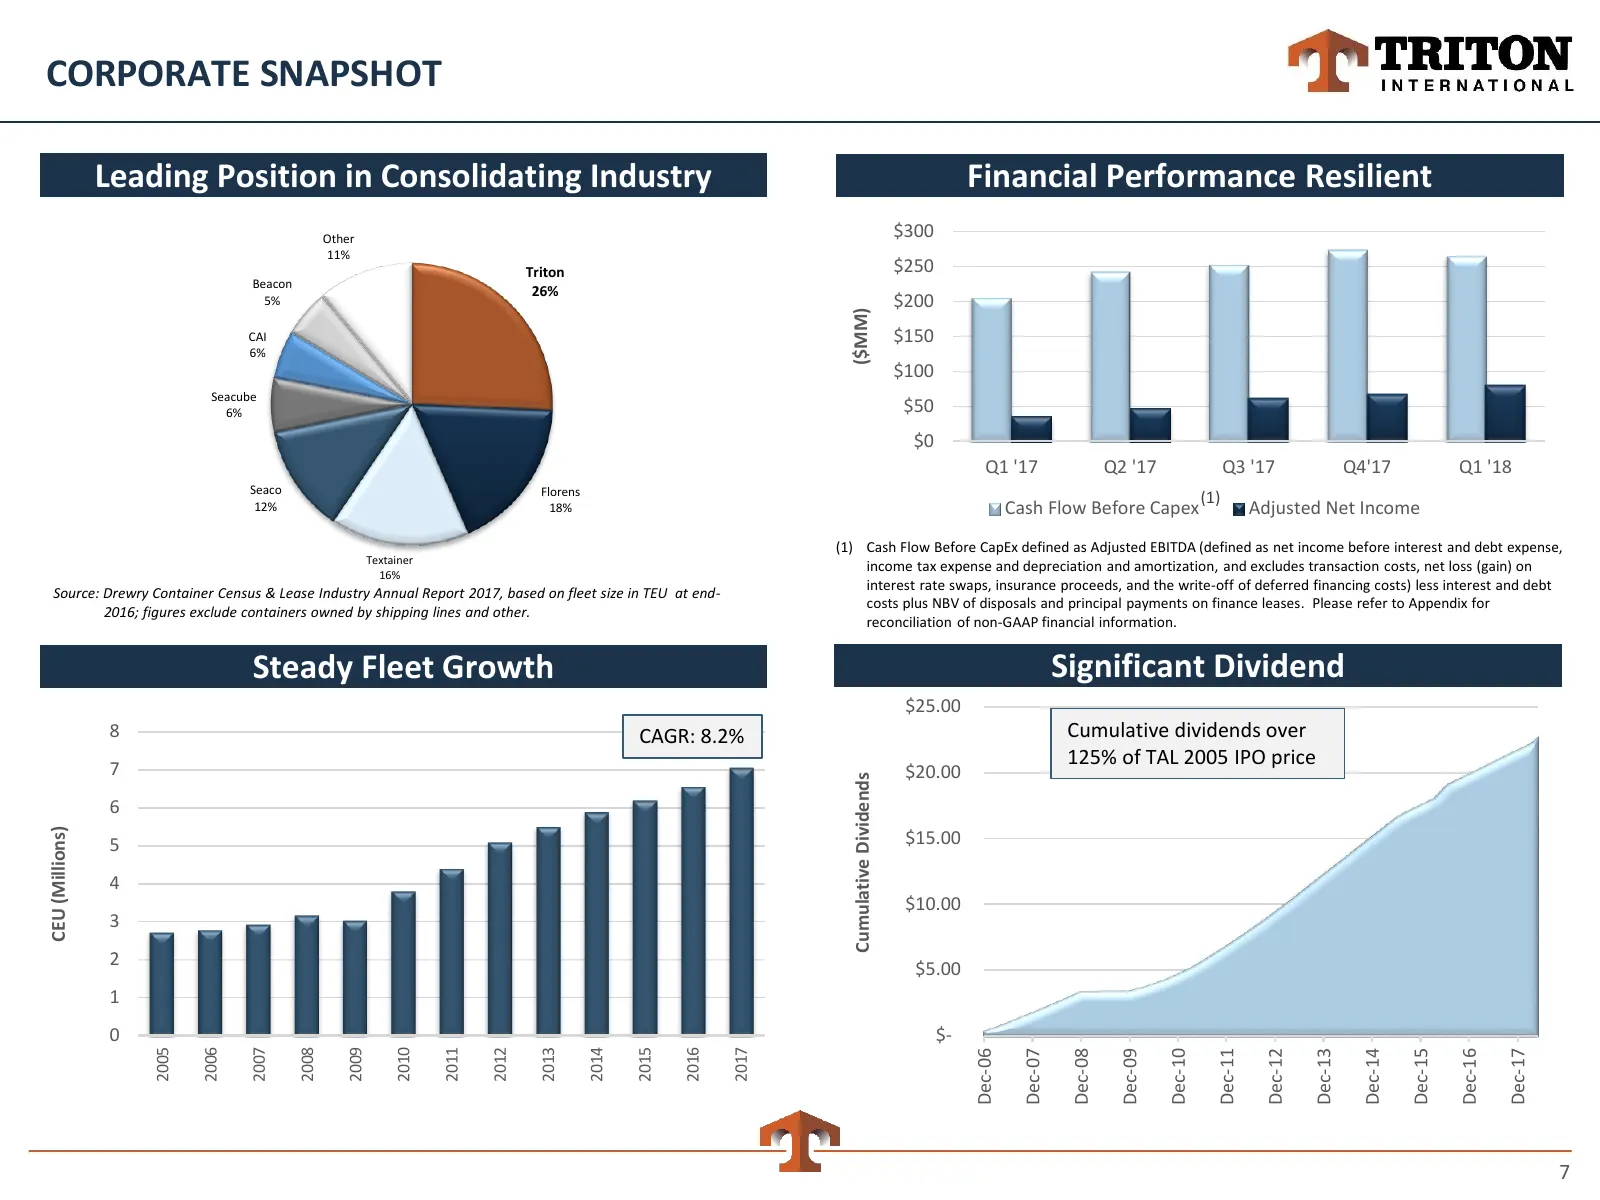
CORPORATE SNAPSHOT Leading Position in Consolidating Industry Financial Performance Resilient Other $300 11% Triton $250 Beacon 26% 5% $200 ($MM) CAI $150 6% $100 Seacube 6% $50 $0 Q1 '17 Q2 '17 Q3 '17 Q4'17 Q1 '18 Seaco Florens (1) 12% 18% Cash Flow Before Capex Adjusted Net Income (1) Cash Flow Be
Slide 8: Triton Container Fleet and Lease Portfolio
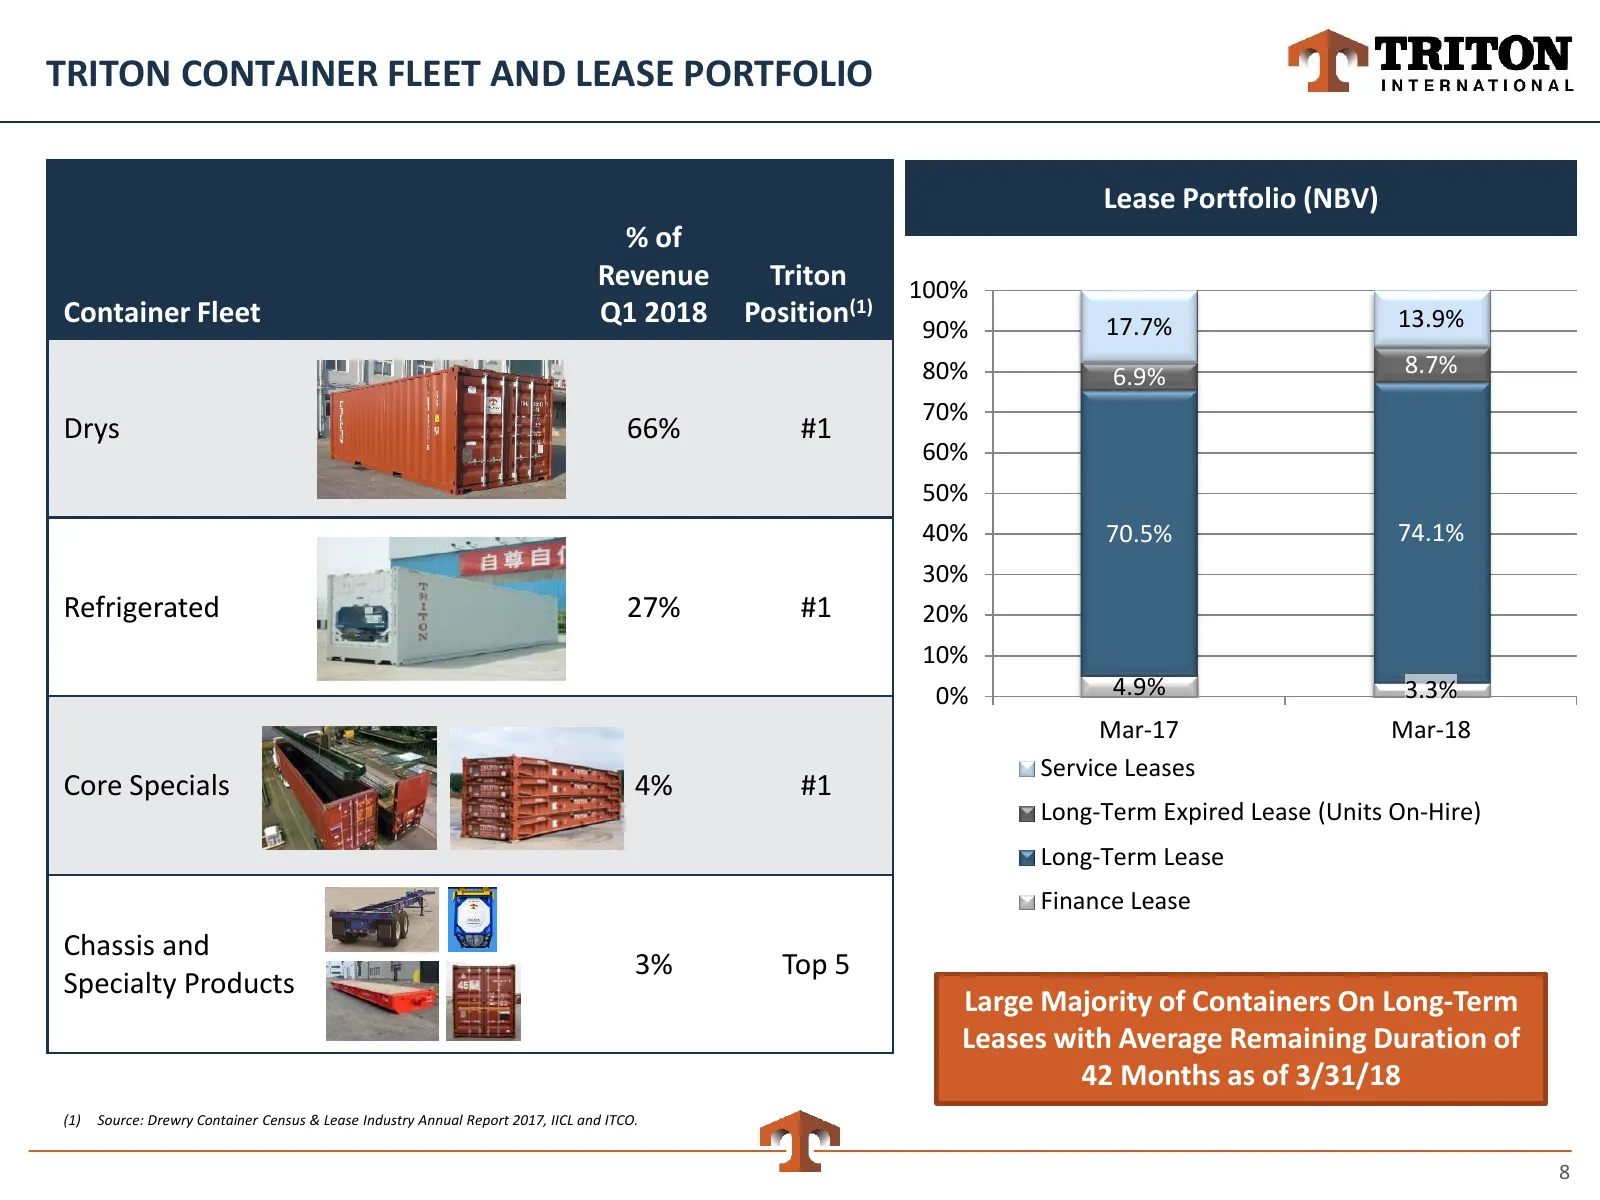
TRITON CONTAINER FLEET AND LEASE PORTFOLIO Lease Portfolio (NBV) % of Revenue Triton 100% Container Fleet Q1 2018 Position(1) 17.7% 13.9% 90% 80% 6.9% 8.7% 70% Drys 66% #1 60% 50% 40% 70.5% 74.1% 30% Refrigerated 27% #1 20% 10% 0% 4.9% 3.3% Mar-17 Mar-18 Service Leases Core Specials 4% #1 Long-Term
Slide 9: Current Performance Strong
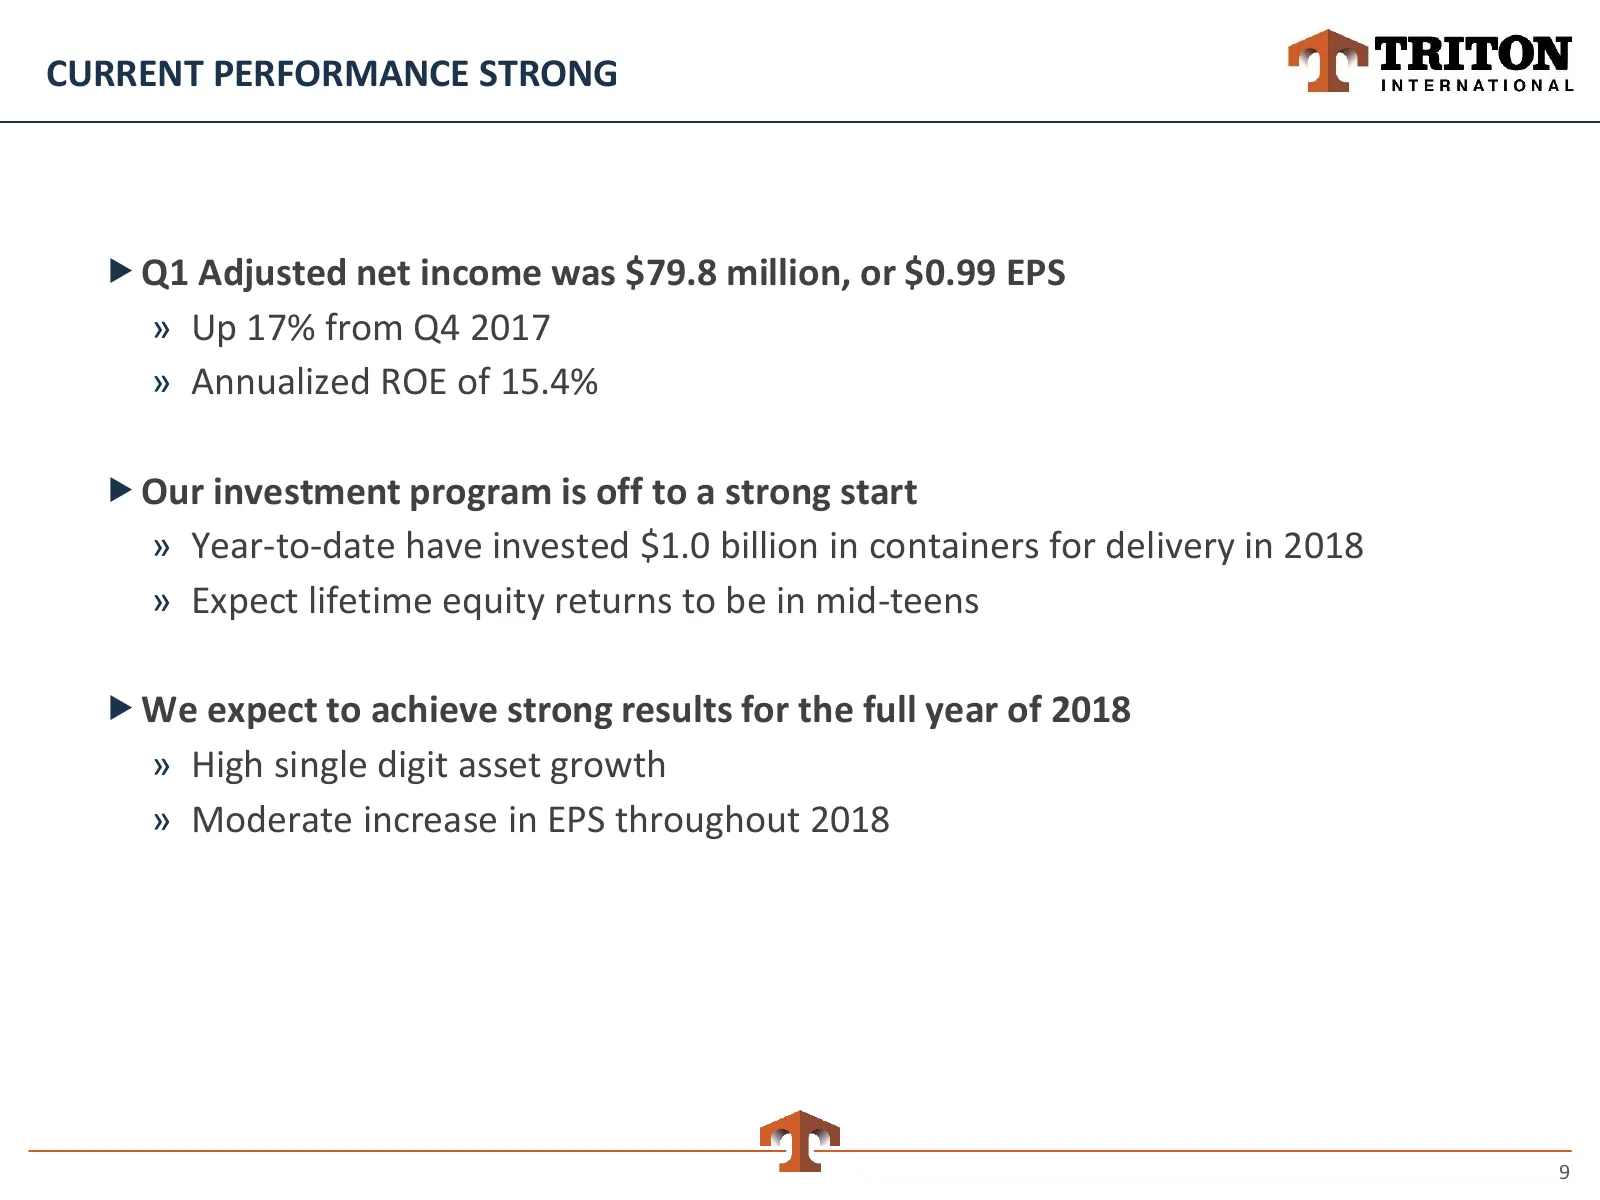
CURRENT PERFORMANCE STRONG Q1 Adjusted net income was $79.8 million, or $0.99 EPS » Up 17% from Q4 2017 » Annualized ROE of 15.4% Our investment program is off to a strong start » Year-to-date have invested $1.0 billion in containers for delivery in 2018 » Expect lifetime equity returns to be in
Slide 10: Well Positioned to Create Long-Term Value
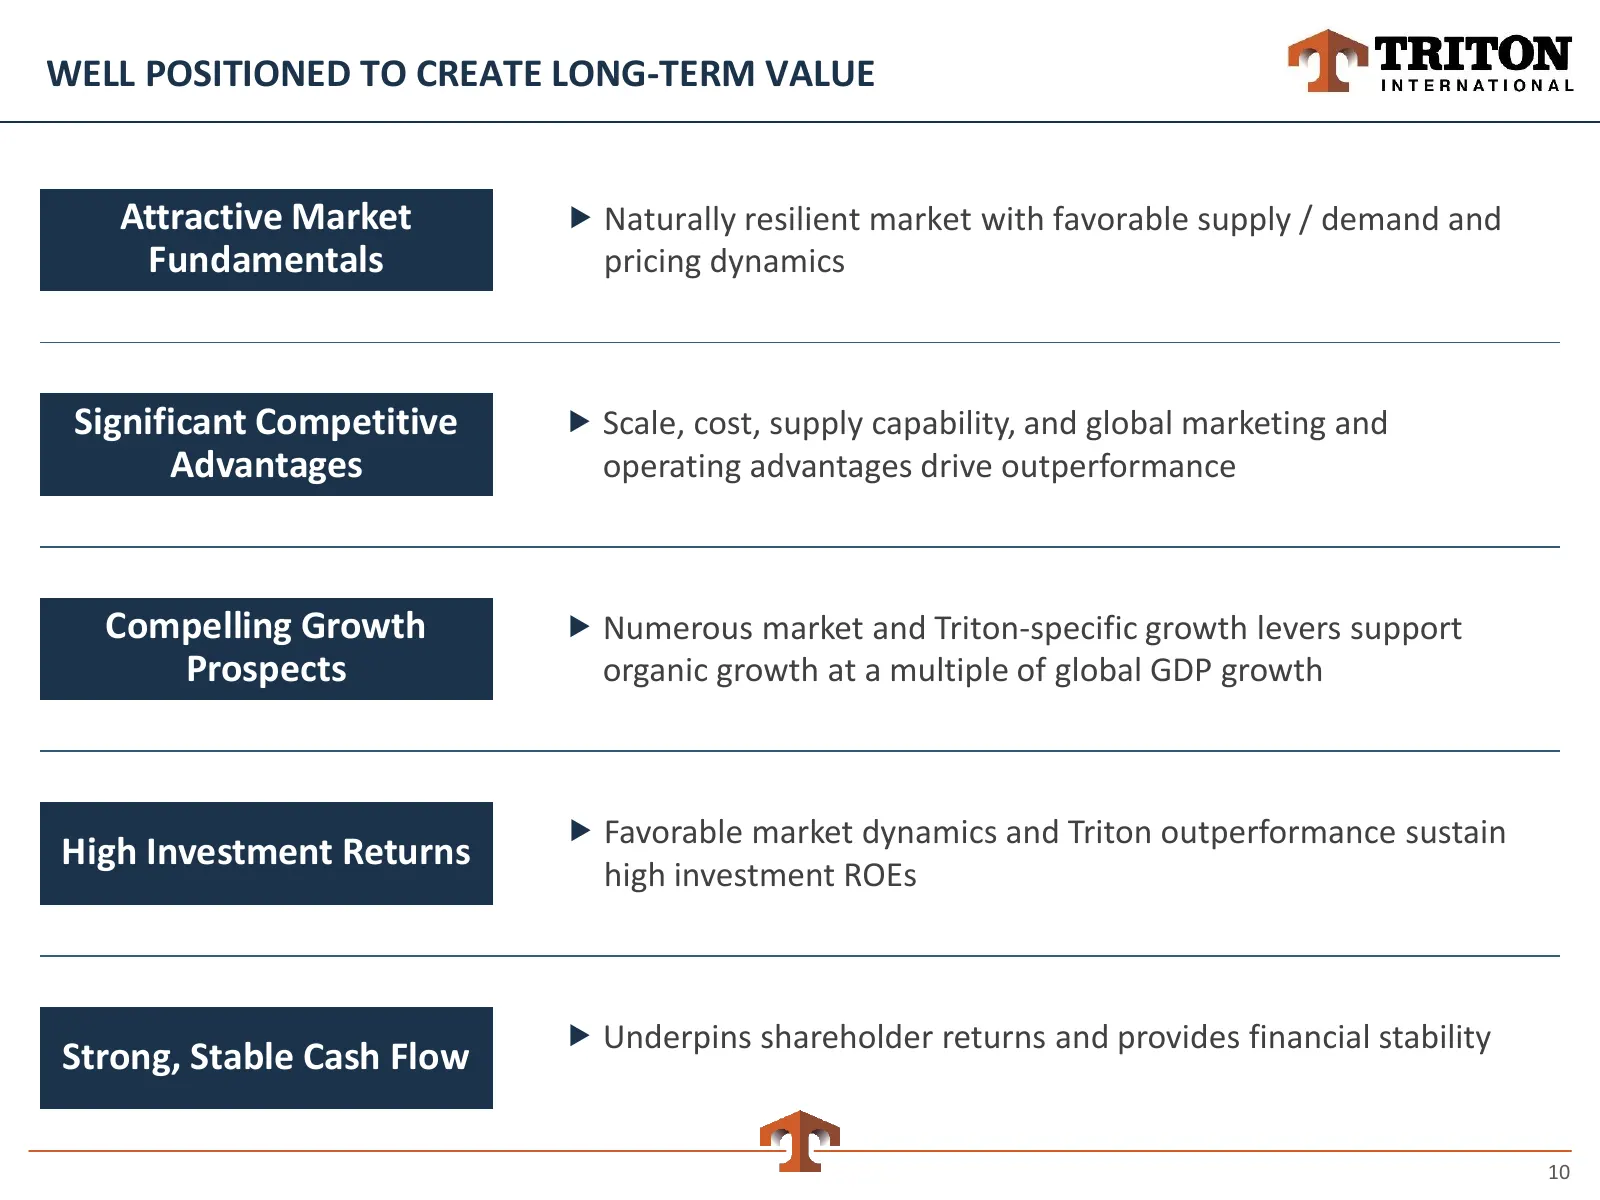
WELL POSITIONED TO CREATE LONG-TERM VALUE Attractive Market Naturally resilient market with favorable supply / demand and Fundamentals pricing dynamics Significant Competitive Scale, cost, supply capability, and global marketing and Advantages operating advantages drive outperformance Compelling
Slide 11: Market Conditions
Market Conditions ag Pp TRITON INTERNATIONAL
Slide 12: Market Overview
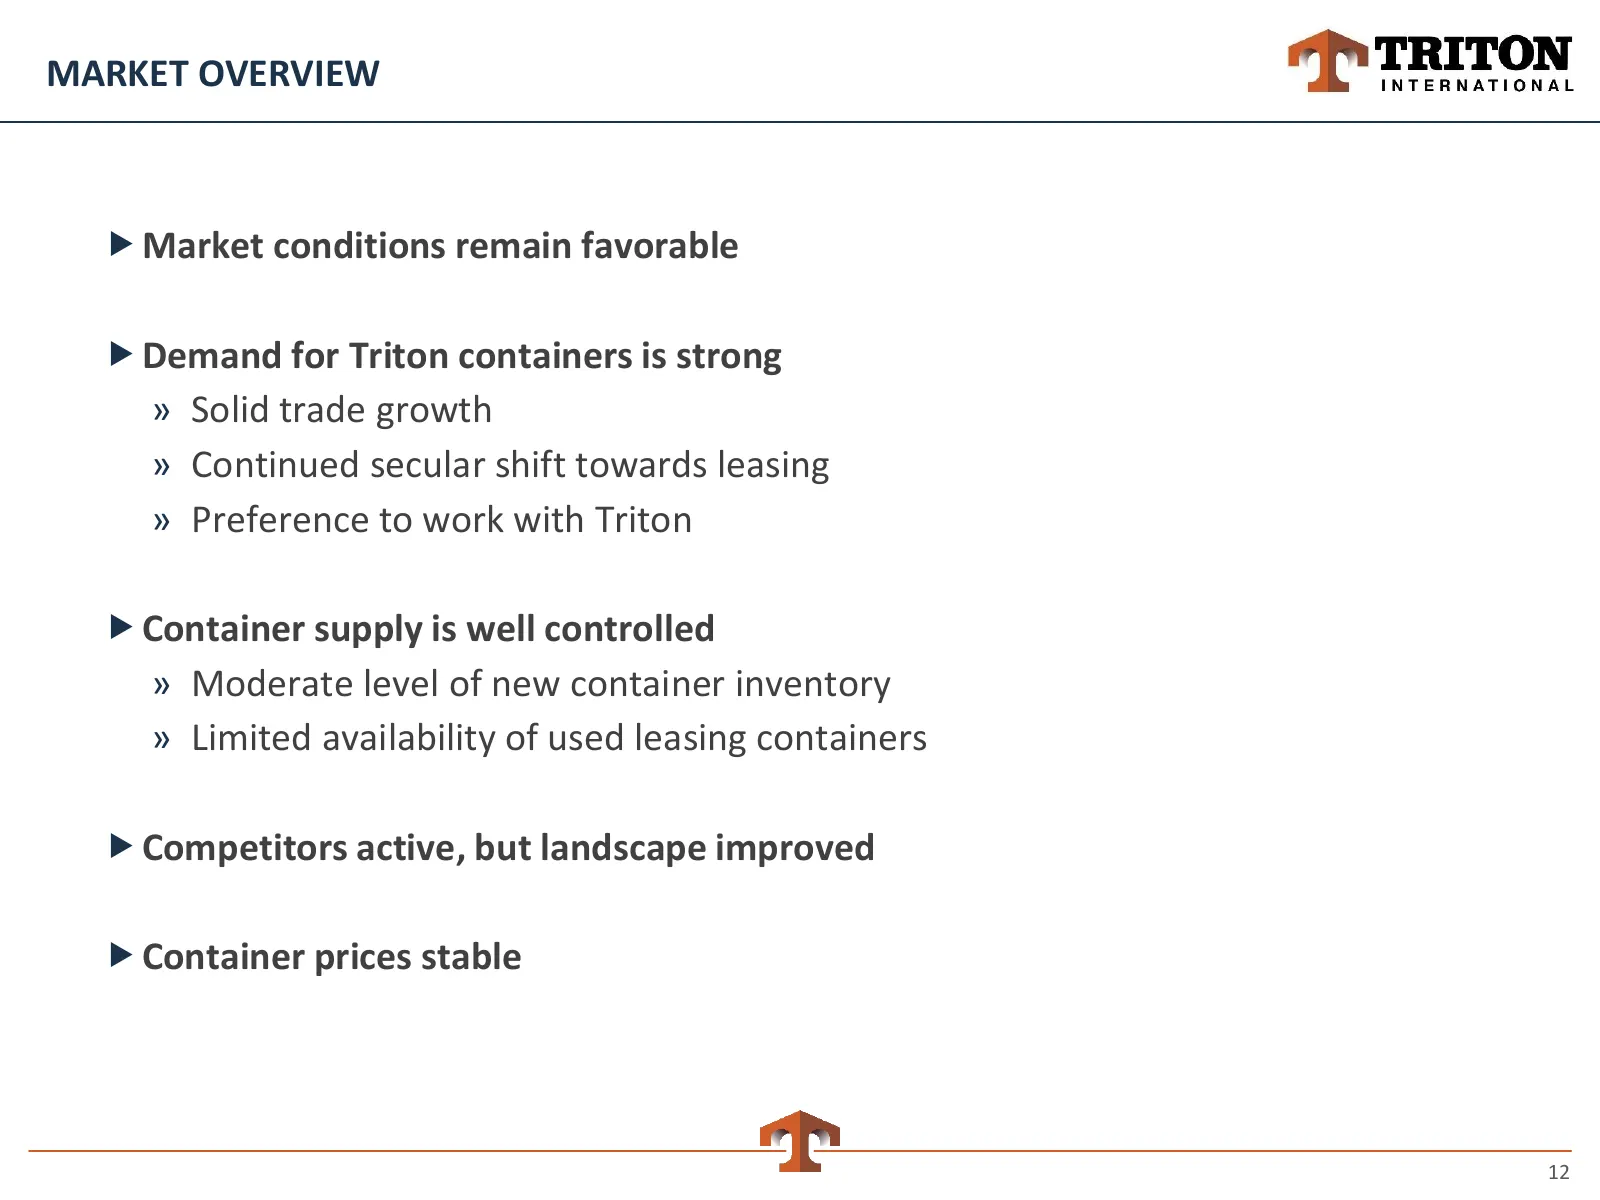
MARKET OVERVIEW Market conditions remain favorable Demand for Triton containers is strong » Solid trade growth » Continued secular shift towards leasing » Preference to work with Triton Container supply is well controlled » Moderate level of new container inventory » Limited availability of us
Slide 13: Containerized Trade Growth Projected to Remain Solid
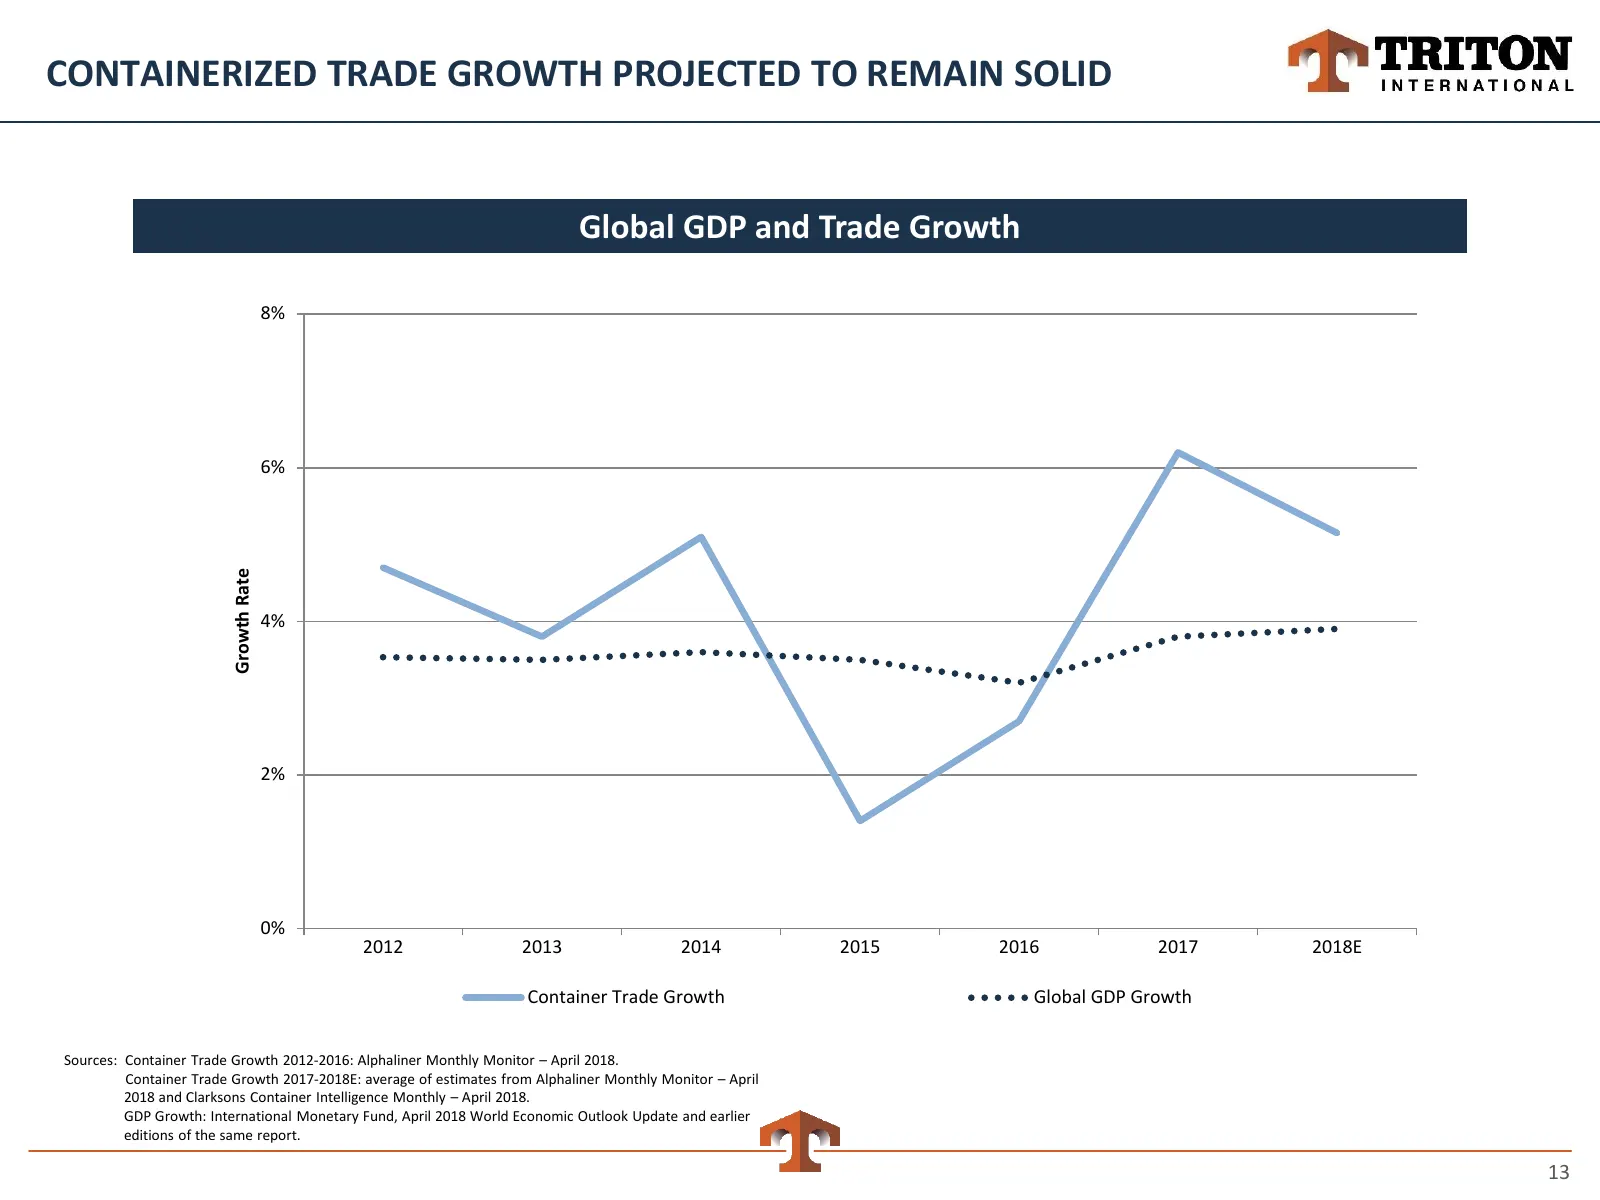
CONTAINERIZED TRADE GROWTH PROJECTED TO REMAIN SOLID Global GDP and Trade Growth 8% 6% Growth Rate 4% 2% 0% 2012 2013 2014 2015 2016 2017 2018E Container Trade Growth Global GDP Growth Sources: Container Trade Growth 2012-2016: Alphaliner Monthly Monitor – April 2018. Container Trade Growth 2017-201
Slide 14: All Major Trades Performing Well
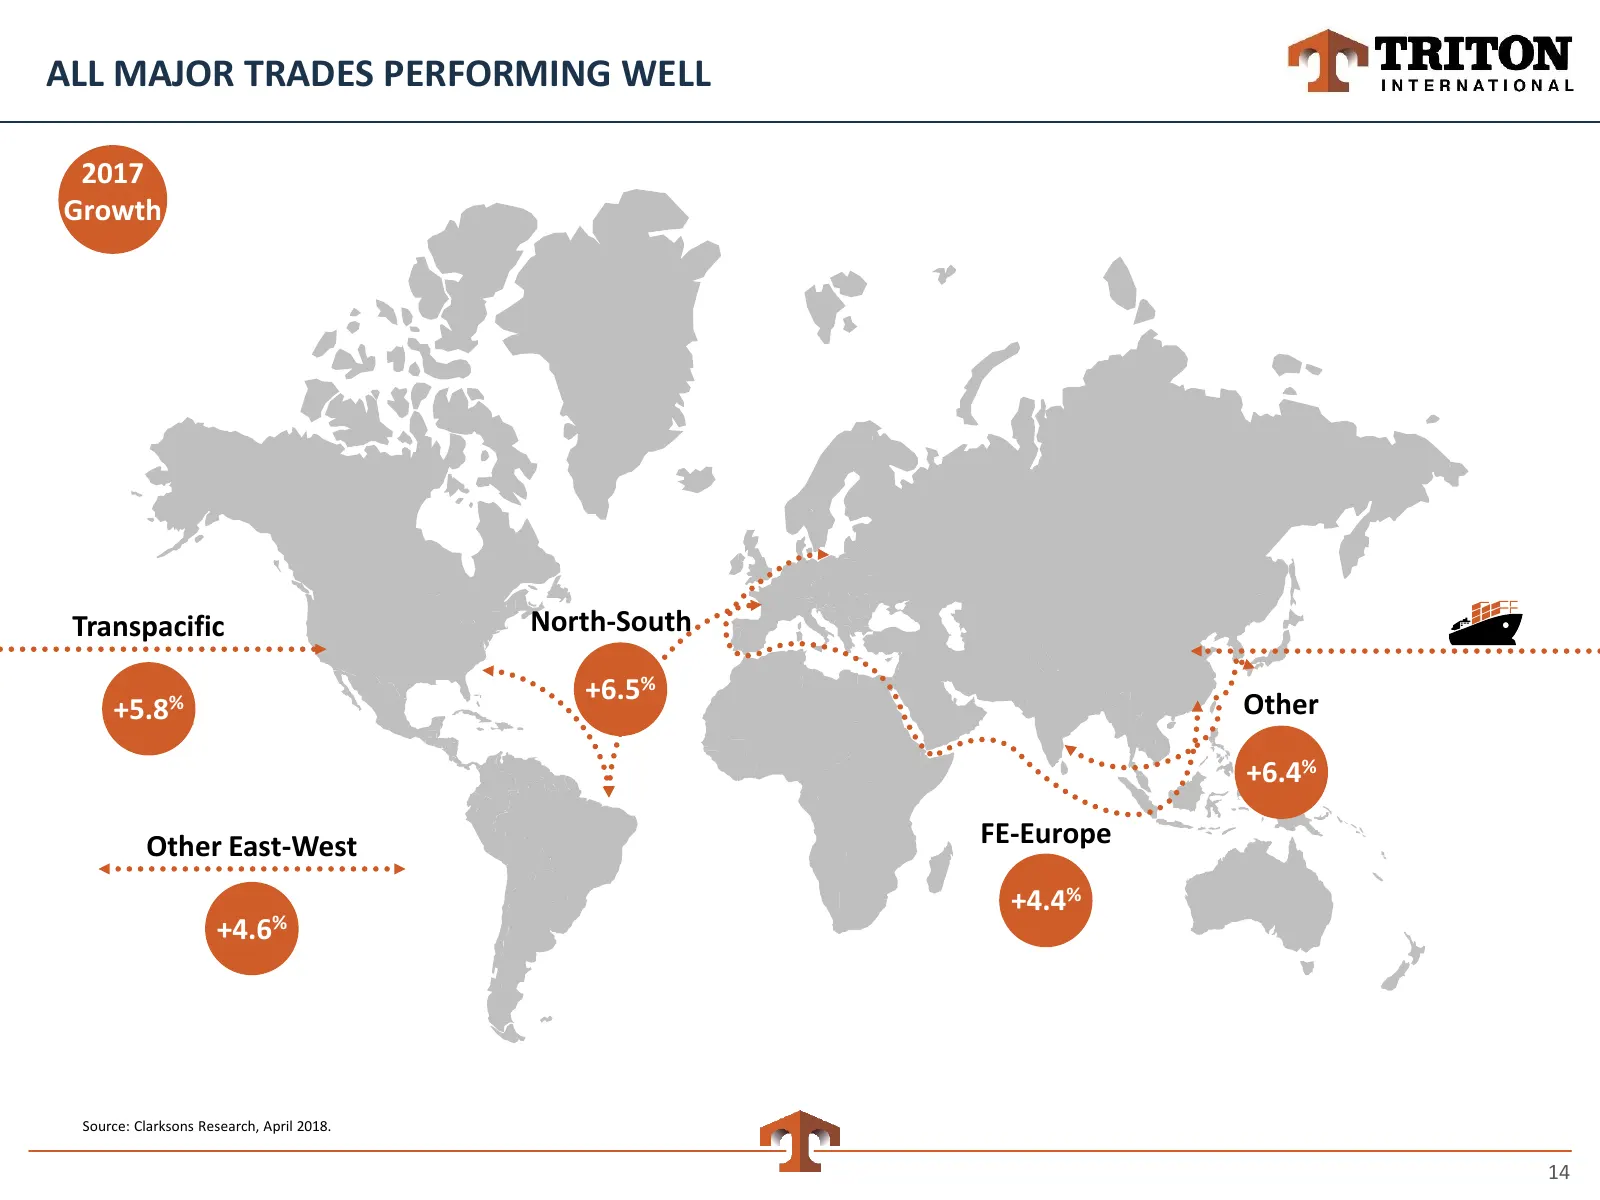
ALL MAJOR TRADES PERFORMING WELL 2017 Growth Transpacific North-South +6.5% Other +5.8% +6.4% Other East-West FE-Europe +4.4% +4.6% Source: Clarksons Research, April 2018. 14
Slide 15: U.S.-China Trade Important, But Not the Major Driver
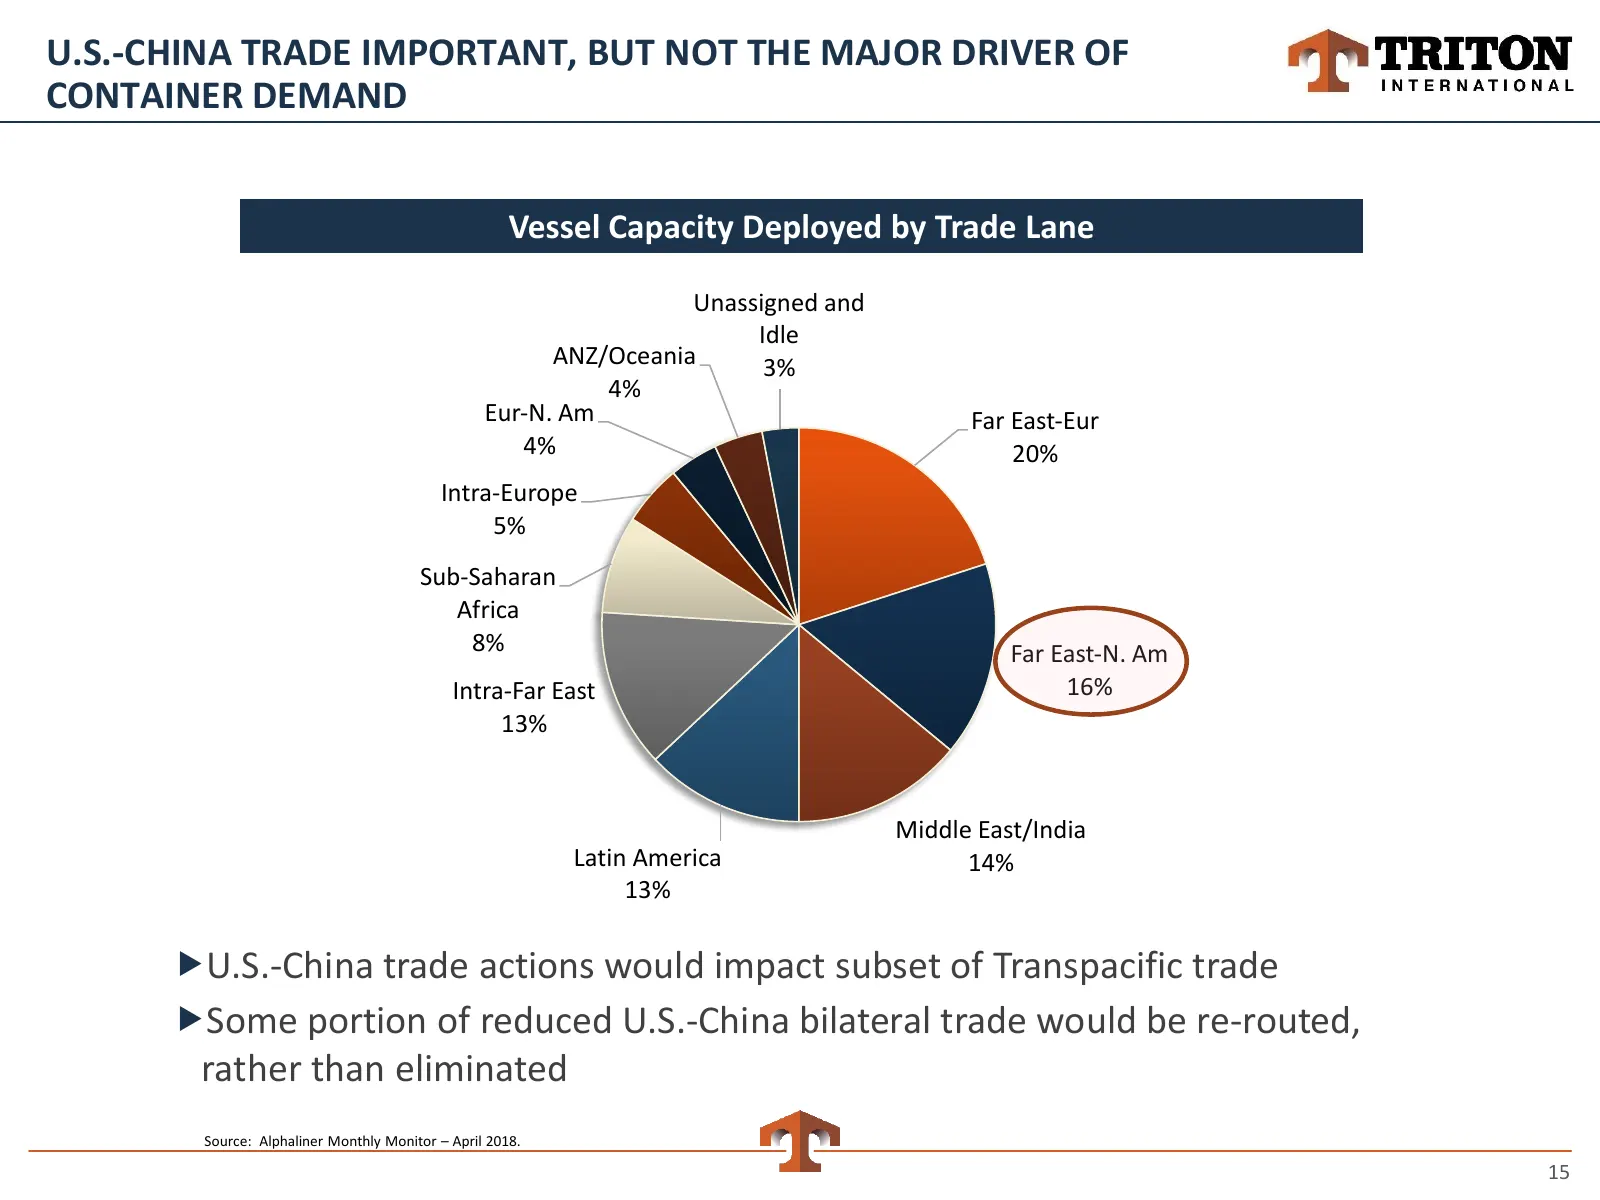
U.S.-CHINA TRADE IMPORTANT, BUT NOT THE MAJOR DRIVER OF CONTAINER DEMAND Vessel Capacity Deployed by Trade Lane Unassigned and Idle ANZ/Oceania 3% 4% Eur‐N. Am Far East‐Eur 4% 20% Intra‐Europe 5% Sub‐Saharan Africa 8% Far East‐N. Am Intra‐Far East 16% 13% Middle East/India Latin America 14% 13% U.S
Slide 16: Increasing Share for Leasing
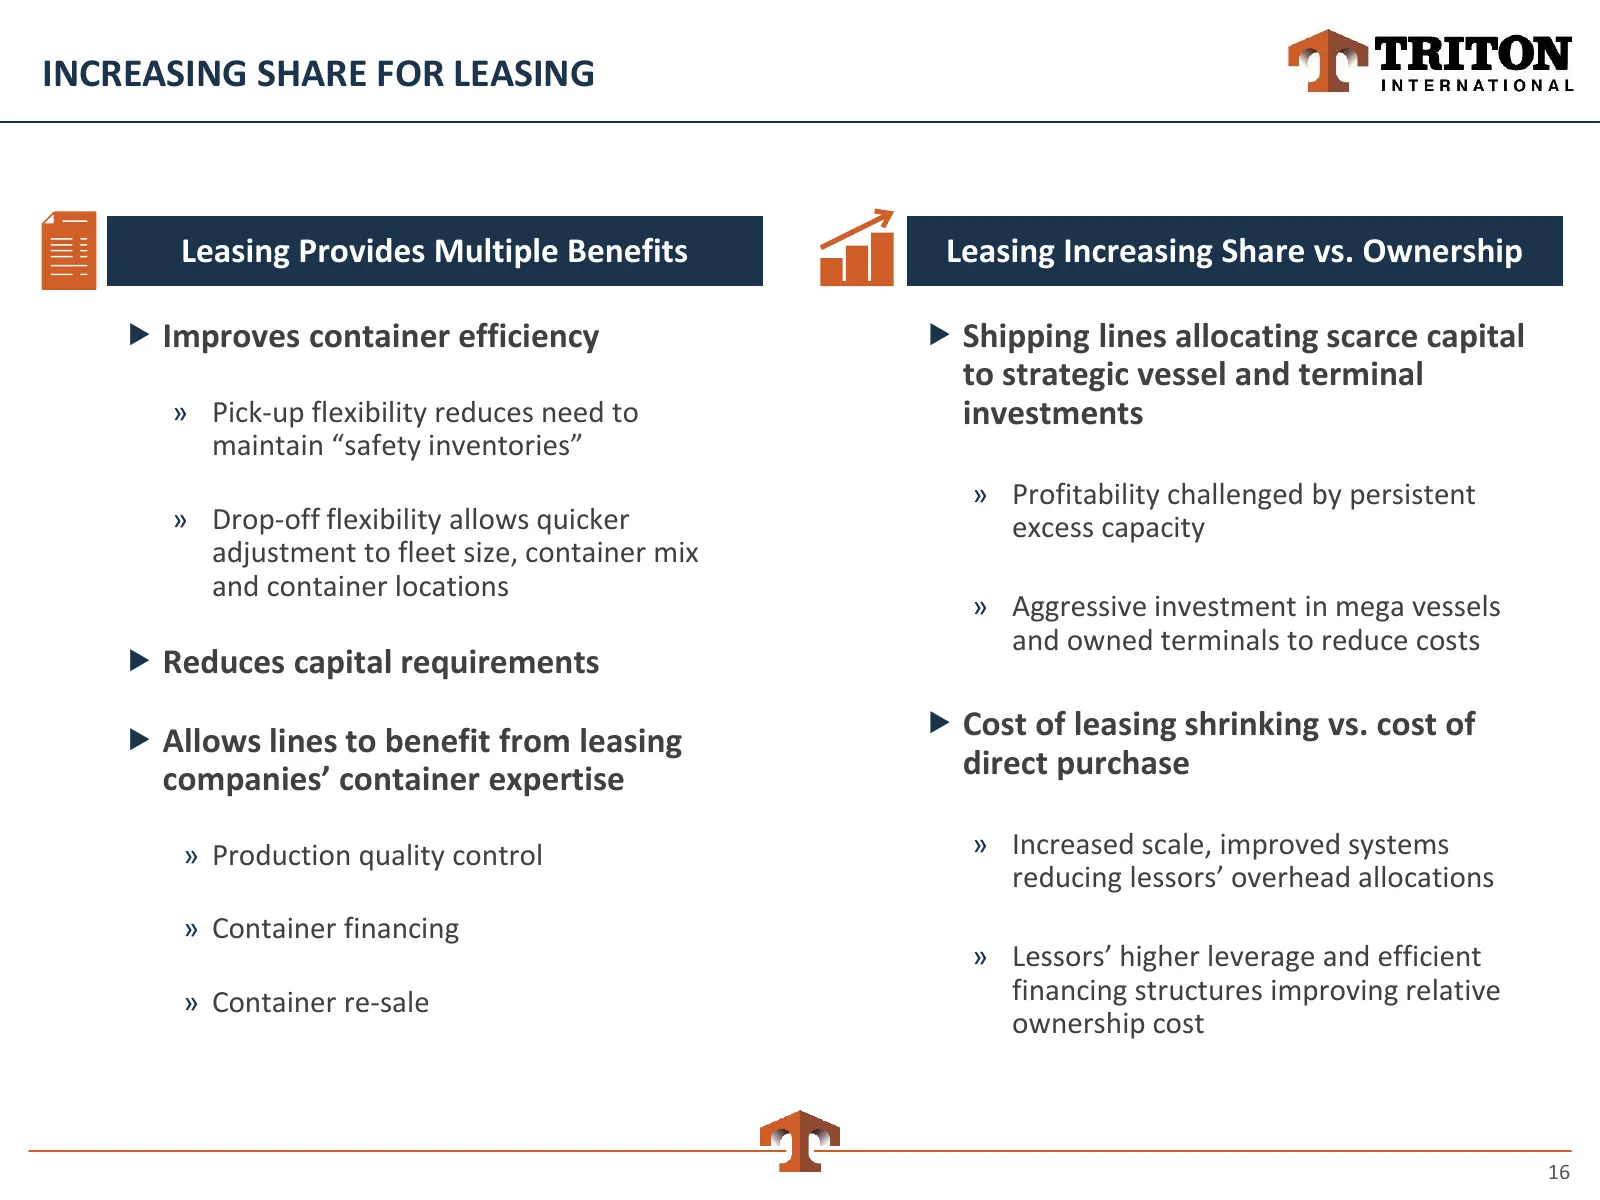
INCREASING SHARE FOR LEASING Leasing Provides Multiple Benefits Leasing Increasing Share vs. Ownership Improves container efficiency Shipping lines allocating scarce capital to strategic vessel and terminal » Pick-up flexibility reduces need to investments maintain “safety inventories” » Profita
Slide 17: Conversion to Leasing Generates Incremental Demand
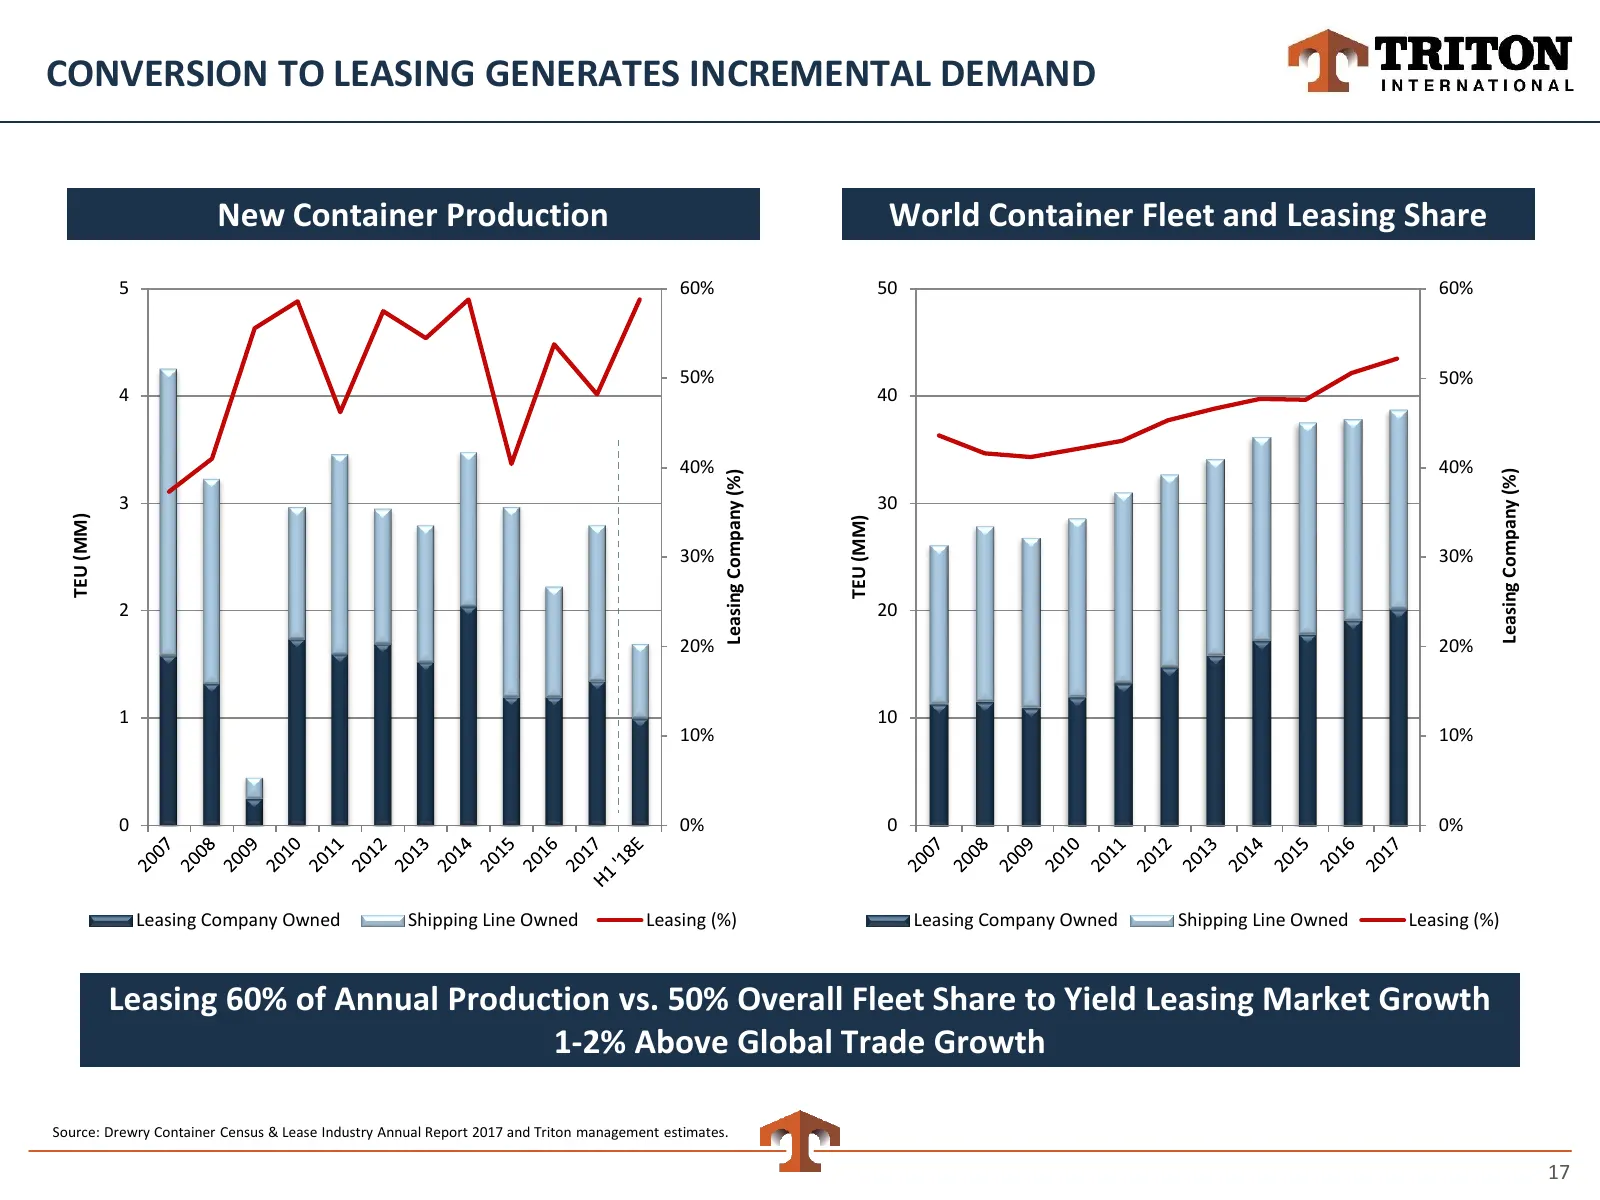
CONVERSION TO LEASING GENERATES INCREMENTAL DEMAND New Container Production World Container Fleet and Leasing Share 5 60% 50 60% 50% 50% 4 40 40% 40% Leasing Company (%) Leasing Company (%) 3 30 TEU (MM) TEU (MM) 30% 30% 2 20 20% 20% 1 10 10% 10% 0 0% 0 0% Leasing Company Owned Shipping Line Owned L
Slide 18: Customer Consolidation Favors Largest Suppliers
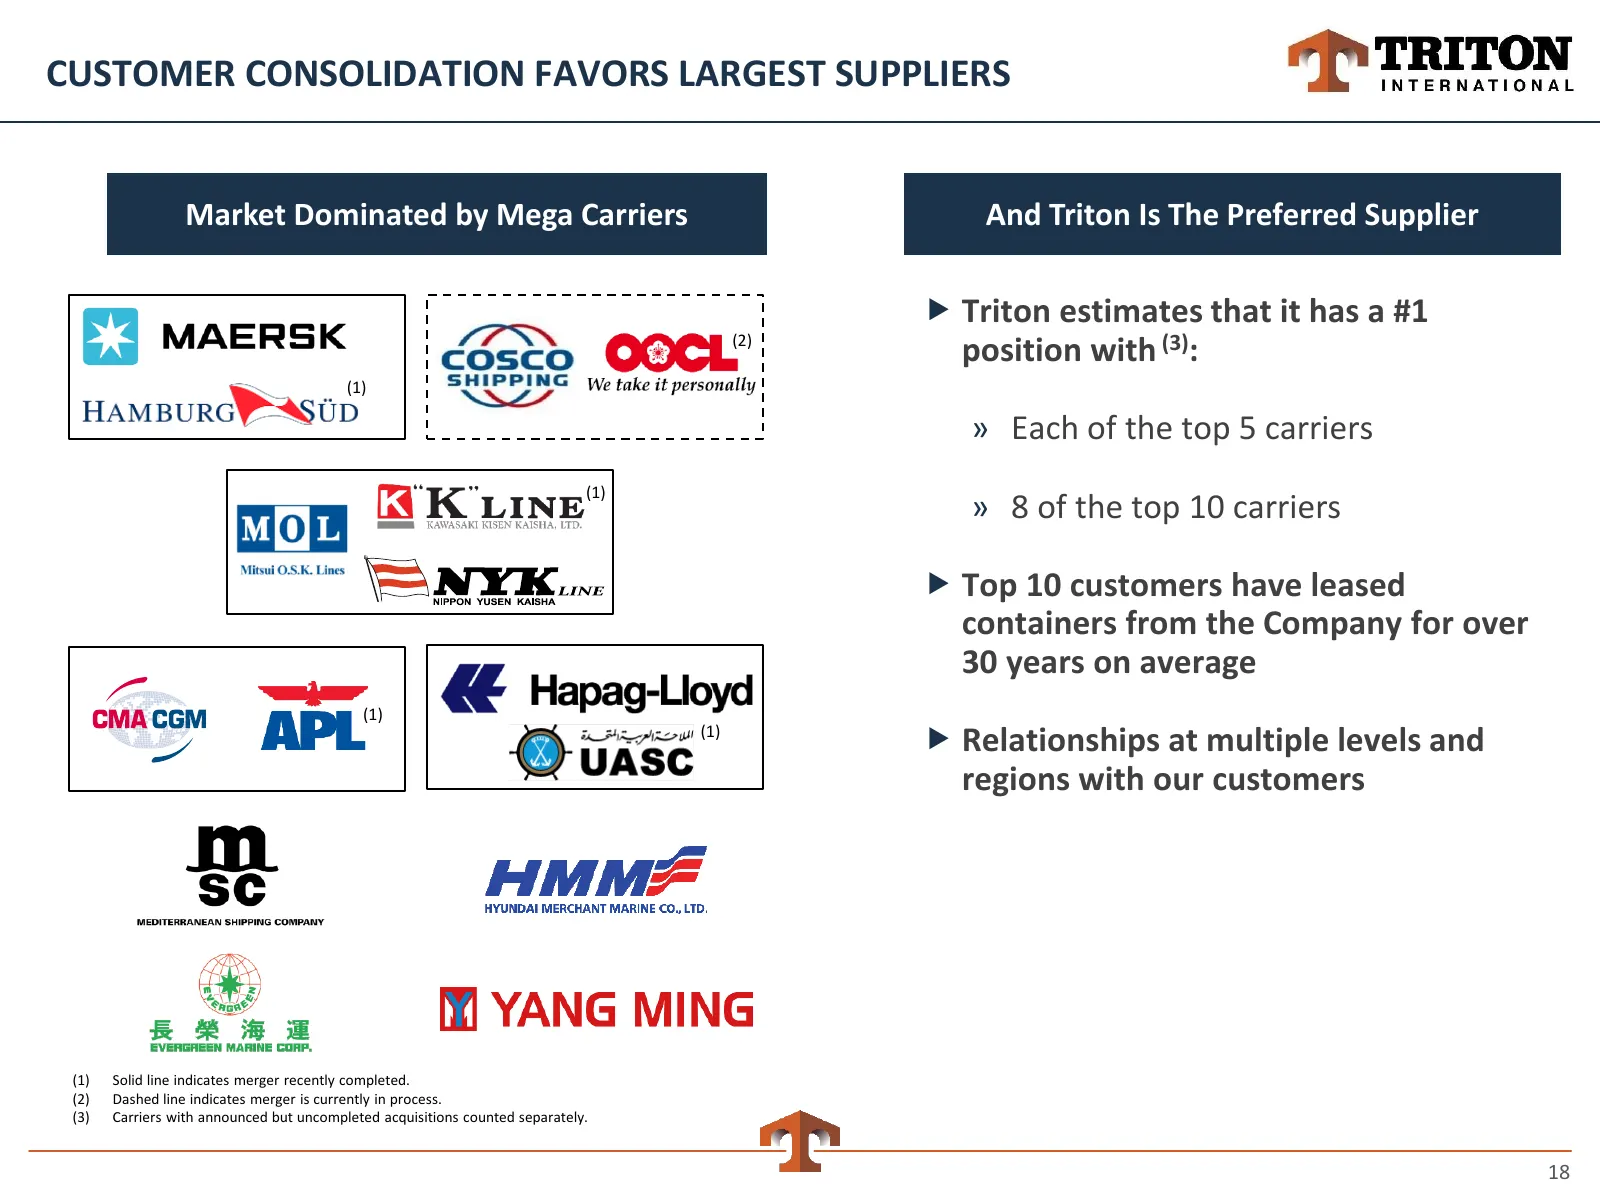
CUSTOMER CONSOLIDATION FAVORS LARGEST SUPPLIERS Market Dominated by Mega Carriers And Triton Is The Preferred Supplier Triton estimates that it has a #1 (2) position with (3): (1) » Each of the top 5 carriers (1) » 8 of the top 10 carriers Top 10 customers have leased containers from the Company
Slide 19: Container Supply Well Controlled
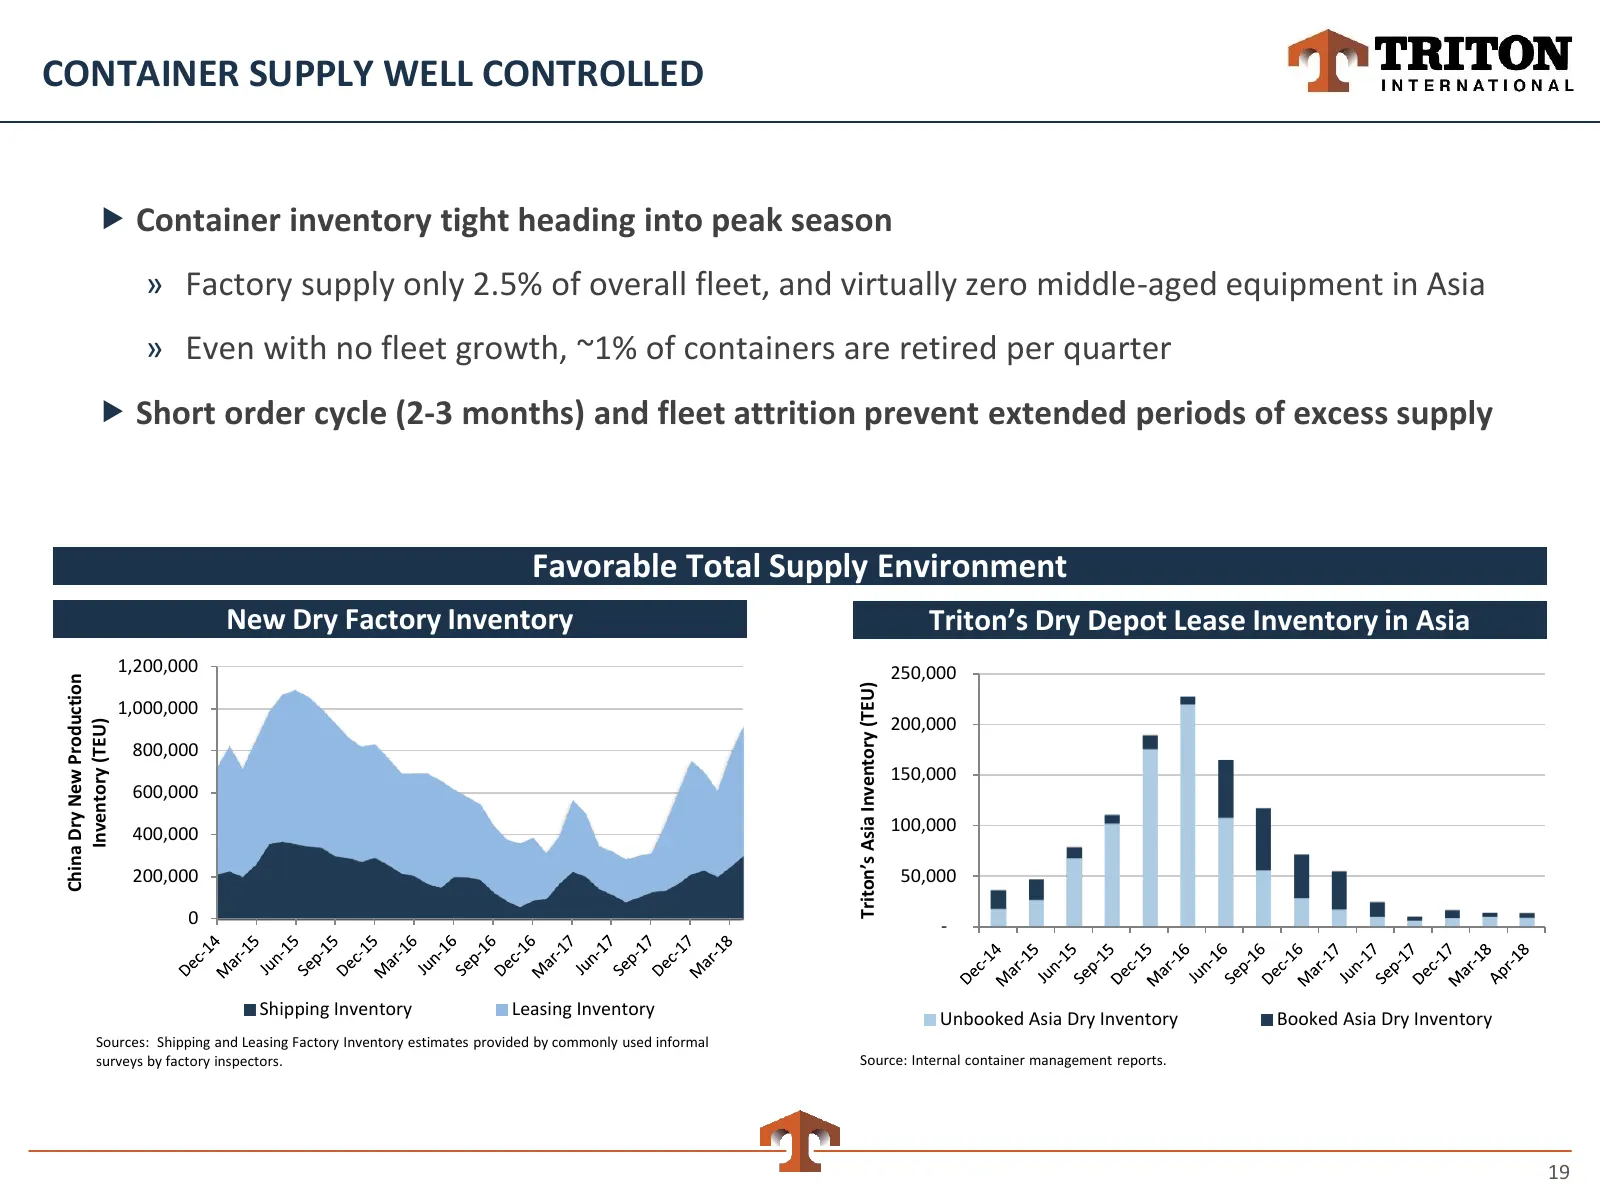
CONTAINER SUPPLY WELL CONTROLLED Container inventory tight heading into peak season » Factory supply only 2.5% of overall fleet, and virtually zero middle-aged equipment in Asia » Even with no fleet growth, ~1% of containers are retired per quarter Short order cycle (2-3 months) and fleet attrit
Slide 20: Merger Set a New Standard Across Consolidating Landscape
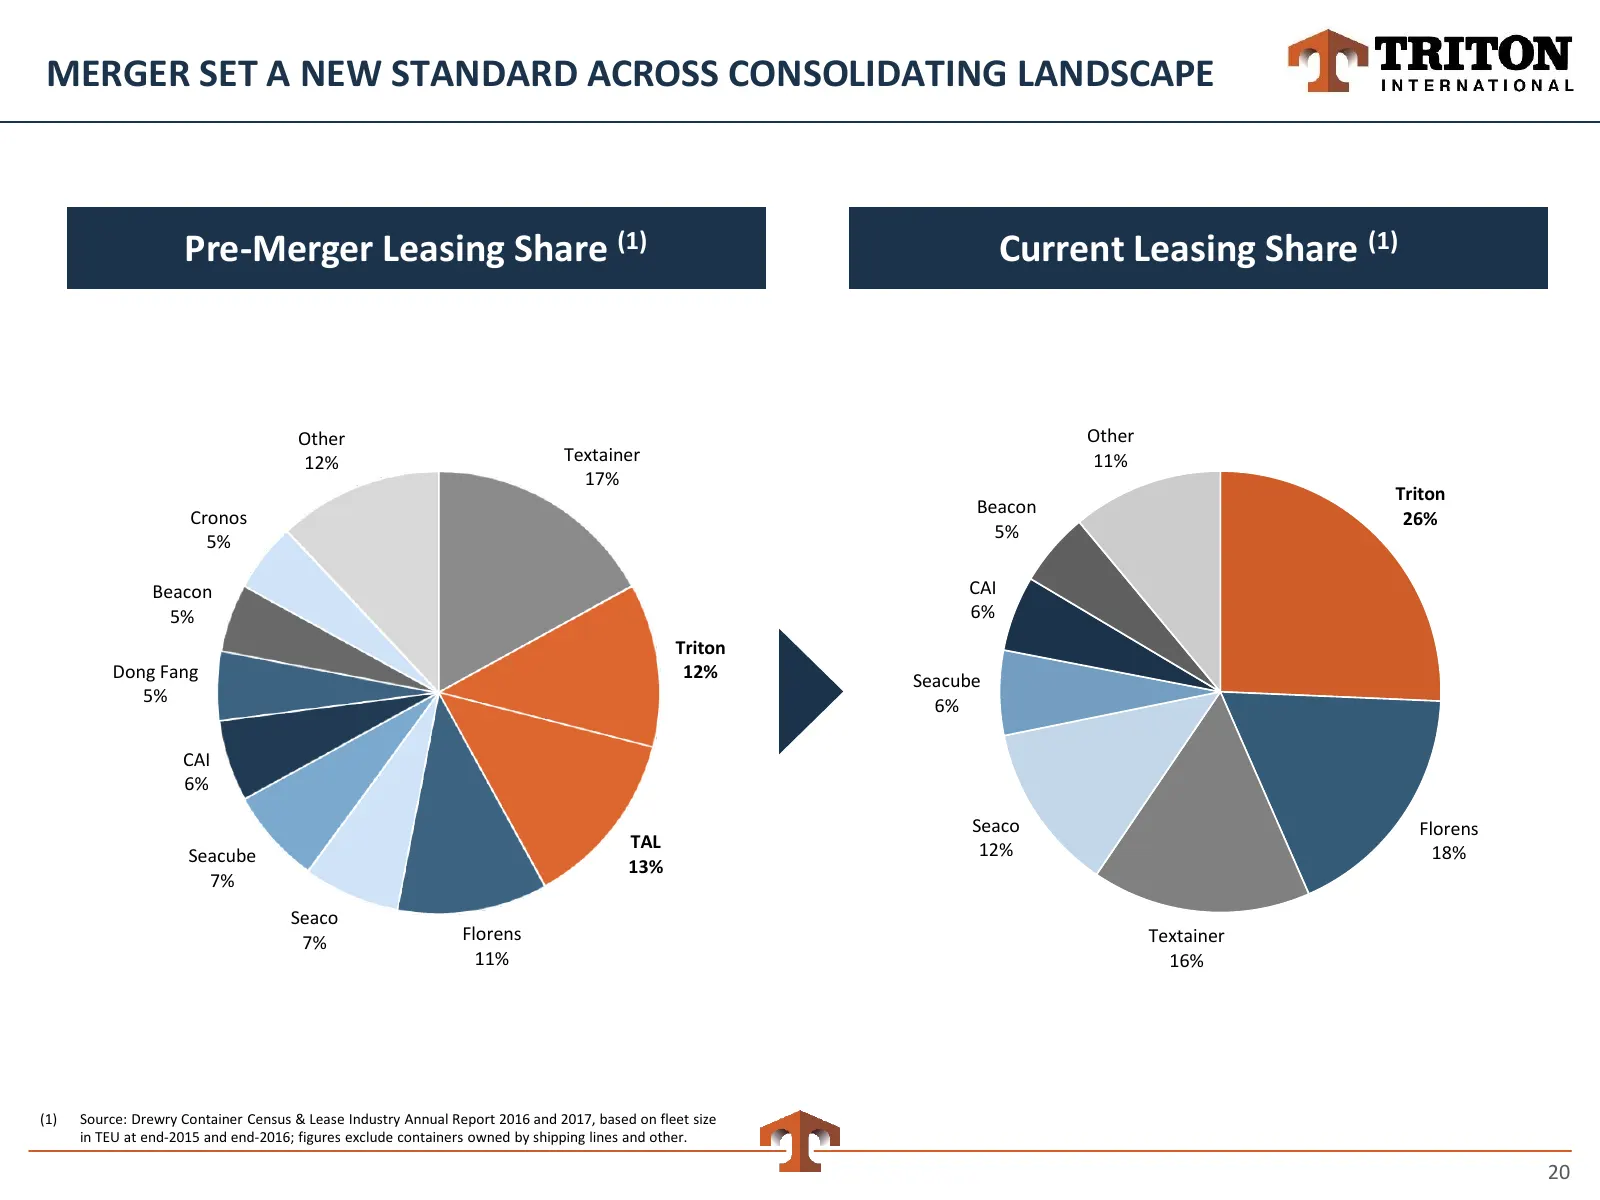
MERGER SET A NEW STANDARD ACROSS CONSOLIDATING LANDSCAPE Pre-Merger Leasing Share (1) Current Leasing Share (1) Other Other 12% Textainer 11% 17% Triton Beacon Cronos 26% 5% 5% Beacon CAI 5% 6% Triton Dong Fang 12% Seacube 5% 6% CAI 6% Seaco Florens TAL 12% Seacube 18% 13% 7% Seaco 7% Florens Textai
Slide 21: Container Prices Stable, But Could Increase in Peak Season
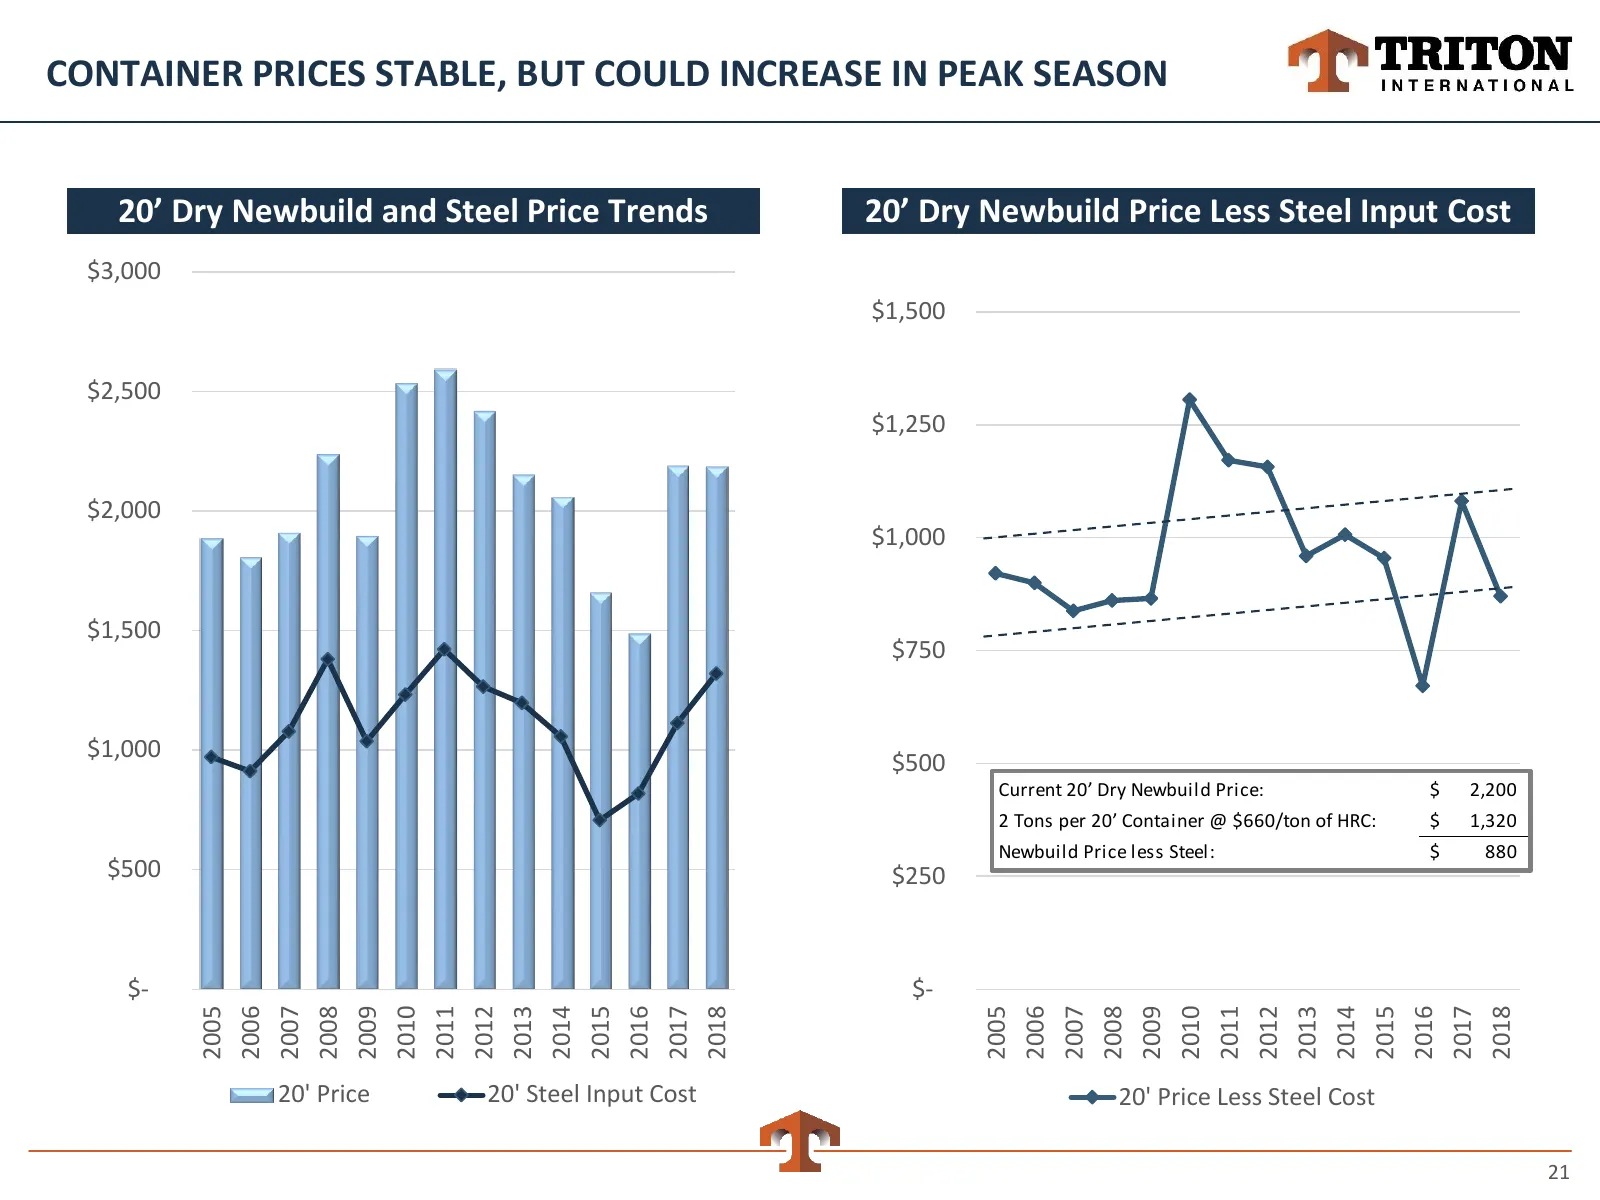
CONTAINER PRICES STABLE, BUT COULD INCREASE IN PEAK SEASON 20’ Dry Newbuild and Steel Price Trends 20’ Dry Newbuild Price Less Steel Input Cost $3,000 $1,500 $2,500 $1,250 $2,000 $1,000 $1,500 $750 $1,000 $500 Current 20’ Dry Newbuild Price: $ 2,200 2 Tons per 20’ Container @ $660/ton of HRC: $ 1,32
Slide 22: Operations Review
Operations Review Tt TRITON INTERNATIONAL
Slide 23: Overview of Triton Operations
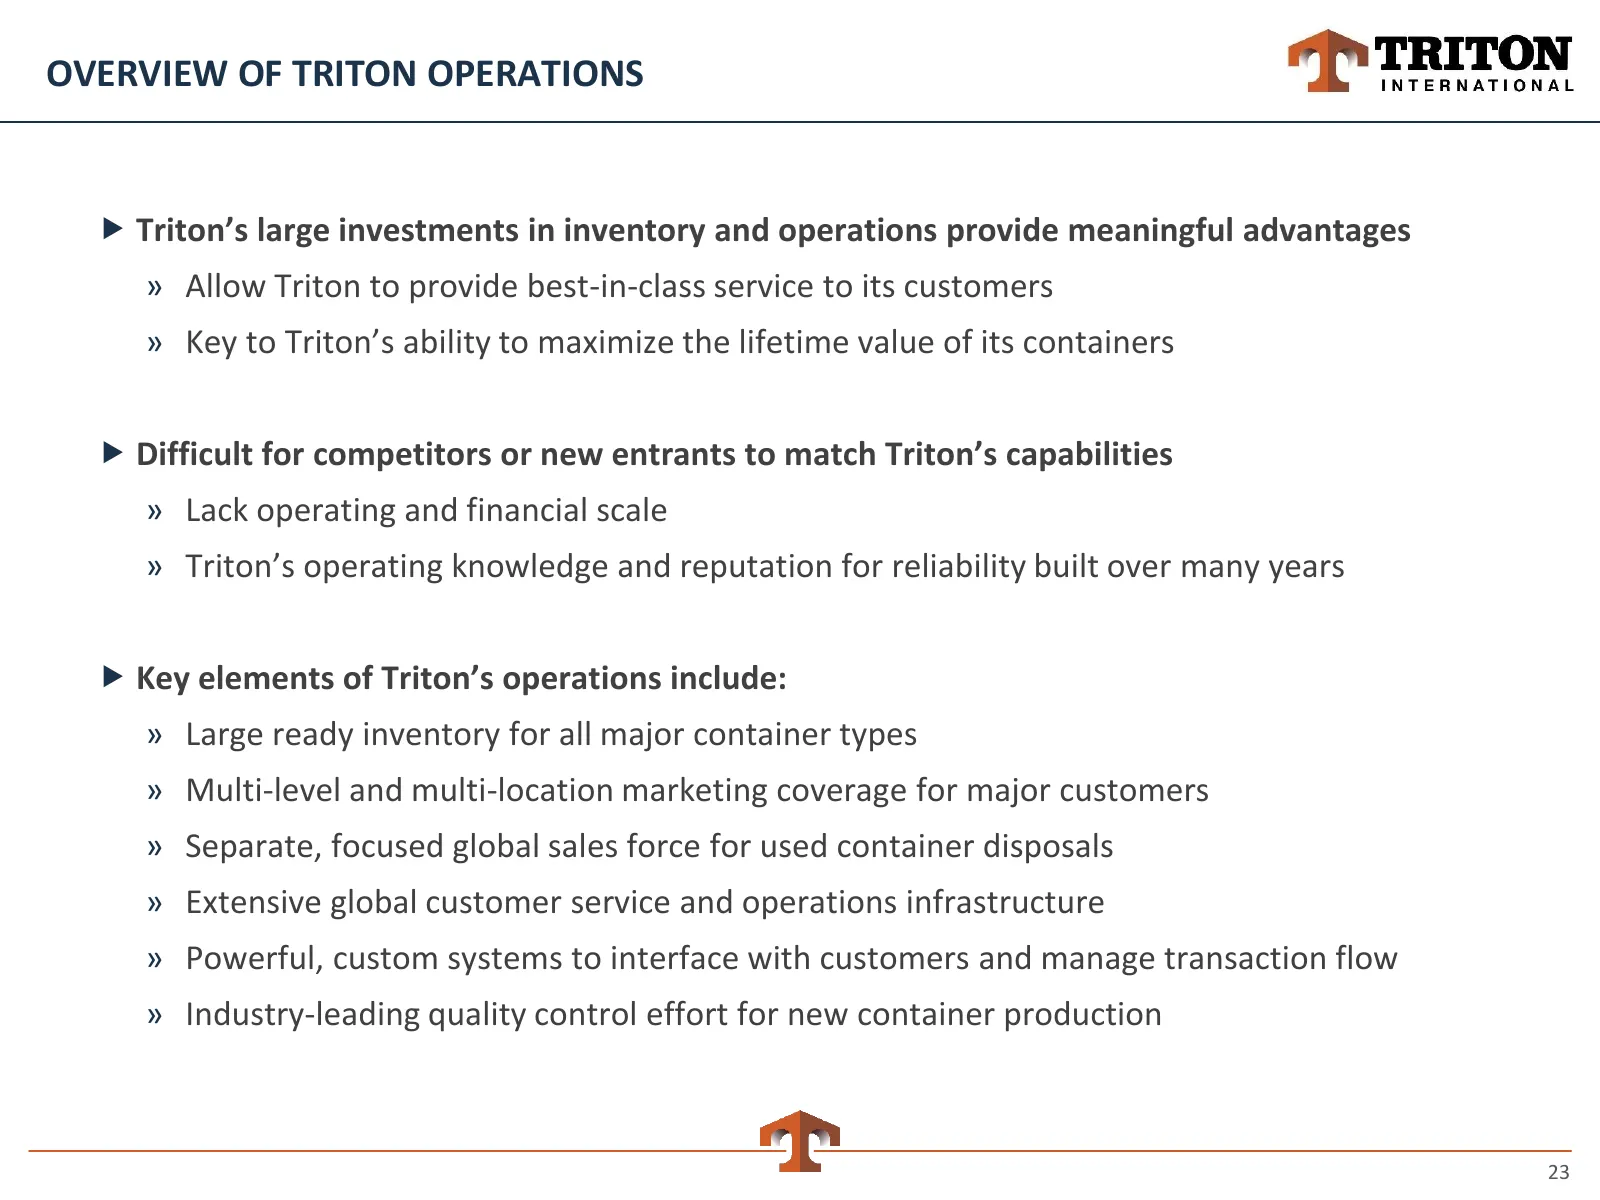
OVERVIEW OF TRITON OPERATIONS Triton’s large investments in inventory and operations provide meaningful advantages » Allow Triton to provide best-in-class service to its customers » Key to Triton’s ability to maximize the lifetime value of its containers Difficult for competitors or new entrants
Slide 24: Container Lifecycle
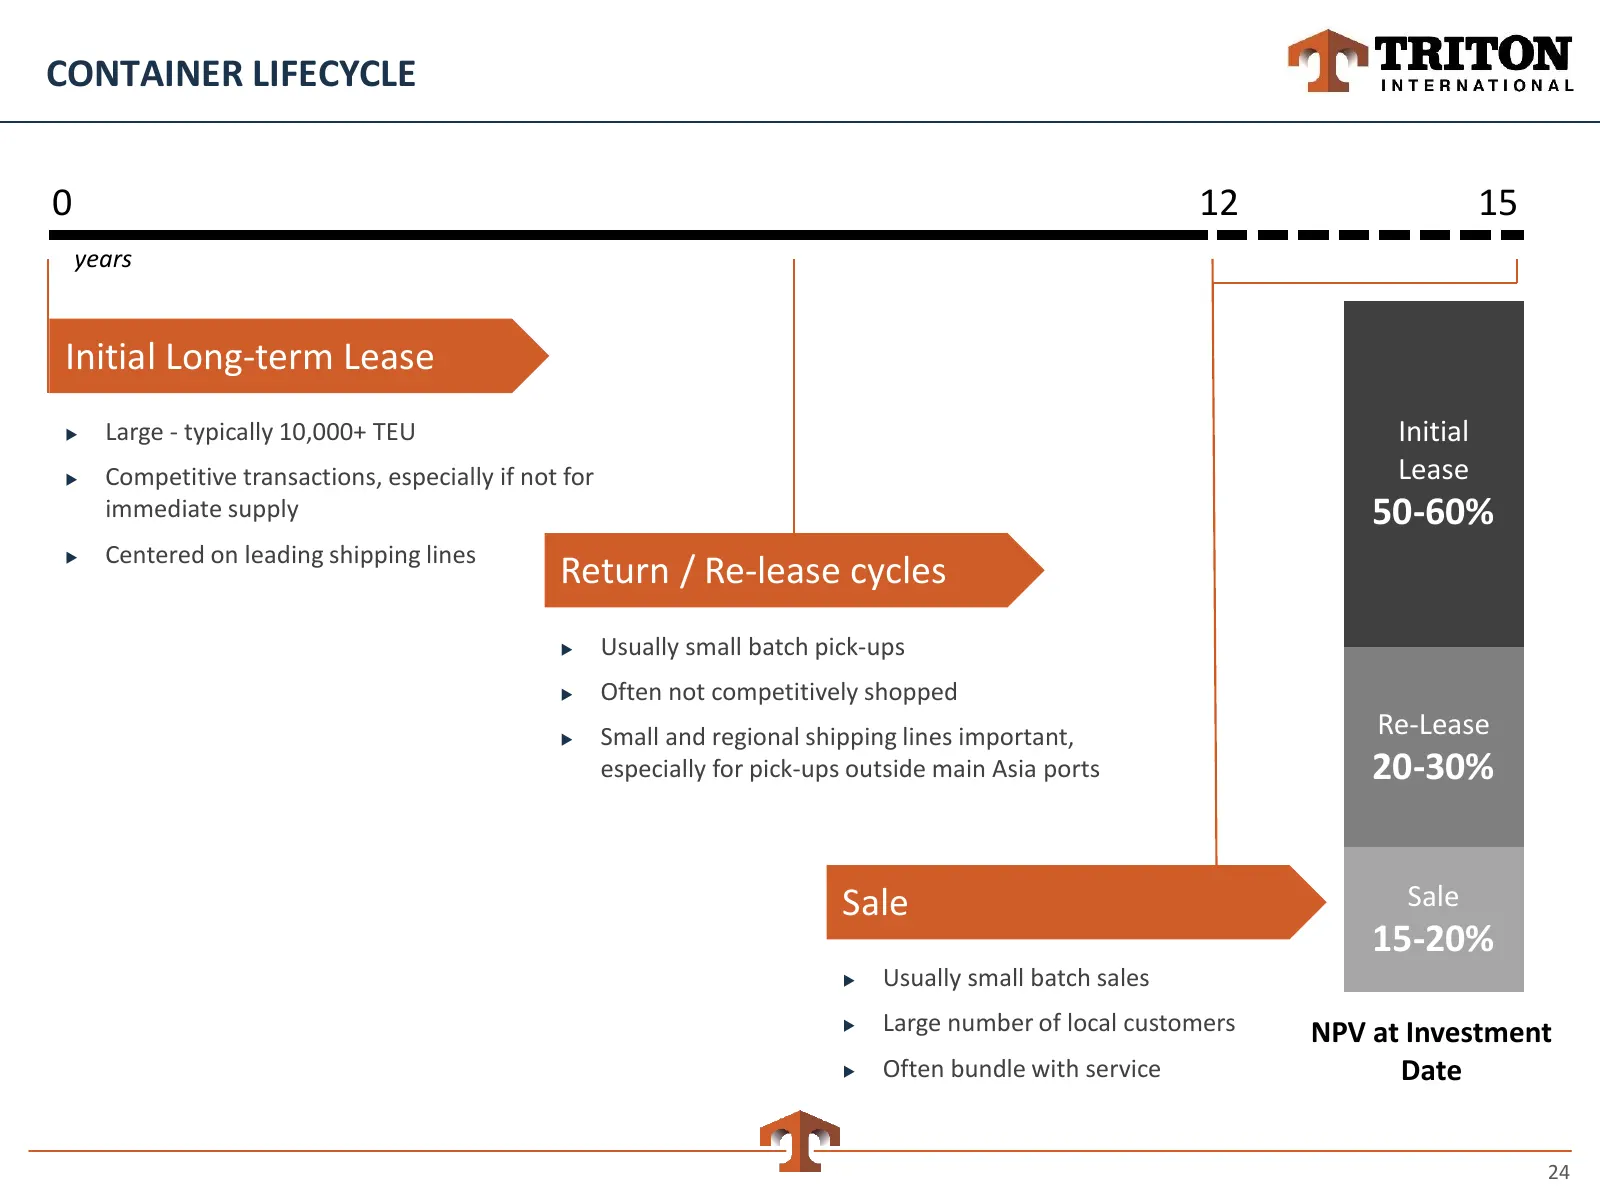
CONTAINER LIFECYCLE 0 12 15 years Initial Long-term Lease Large - typically 10,000+ TEU Initial Competitive transactions, especially if not for Lease immediate supply 50-60% Centered on leading shipping lines Return / Re-lease cycles Usually small batch pick-ups Often not competitively sho
Slide 25: Triton Makes Significant Investment in Ready Inventory
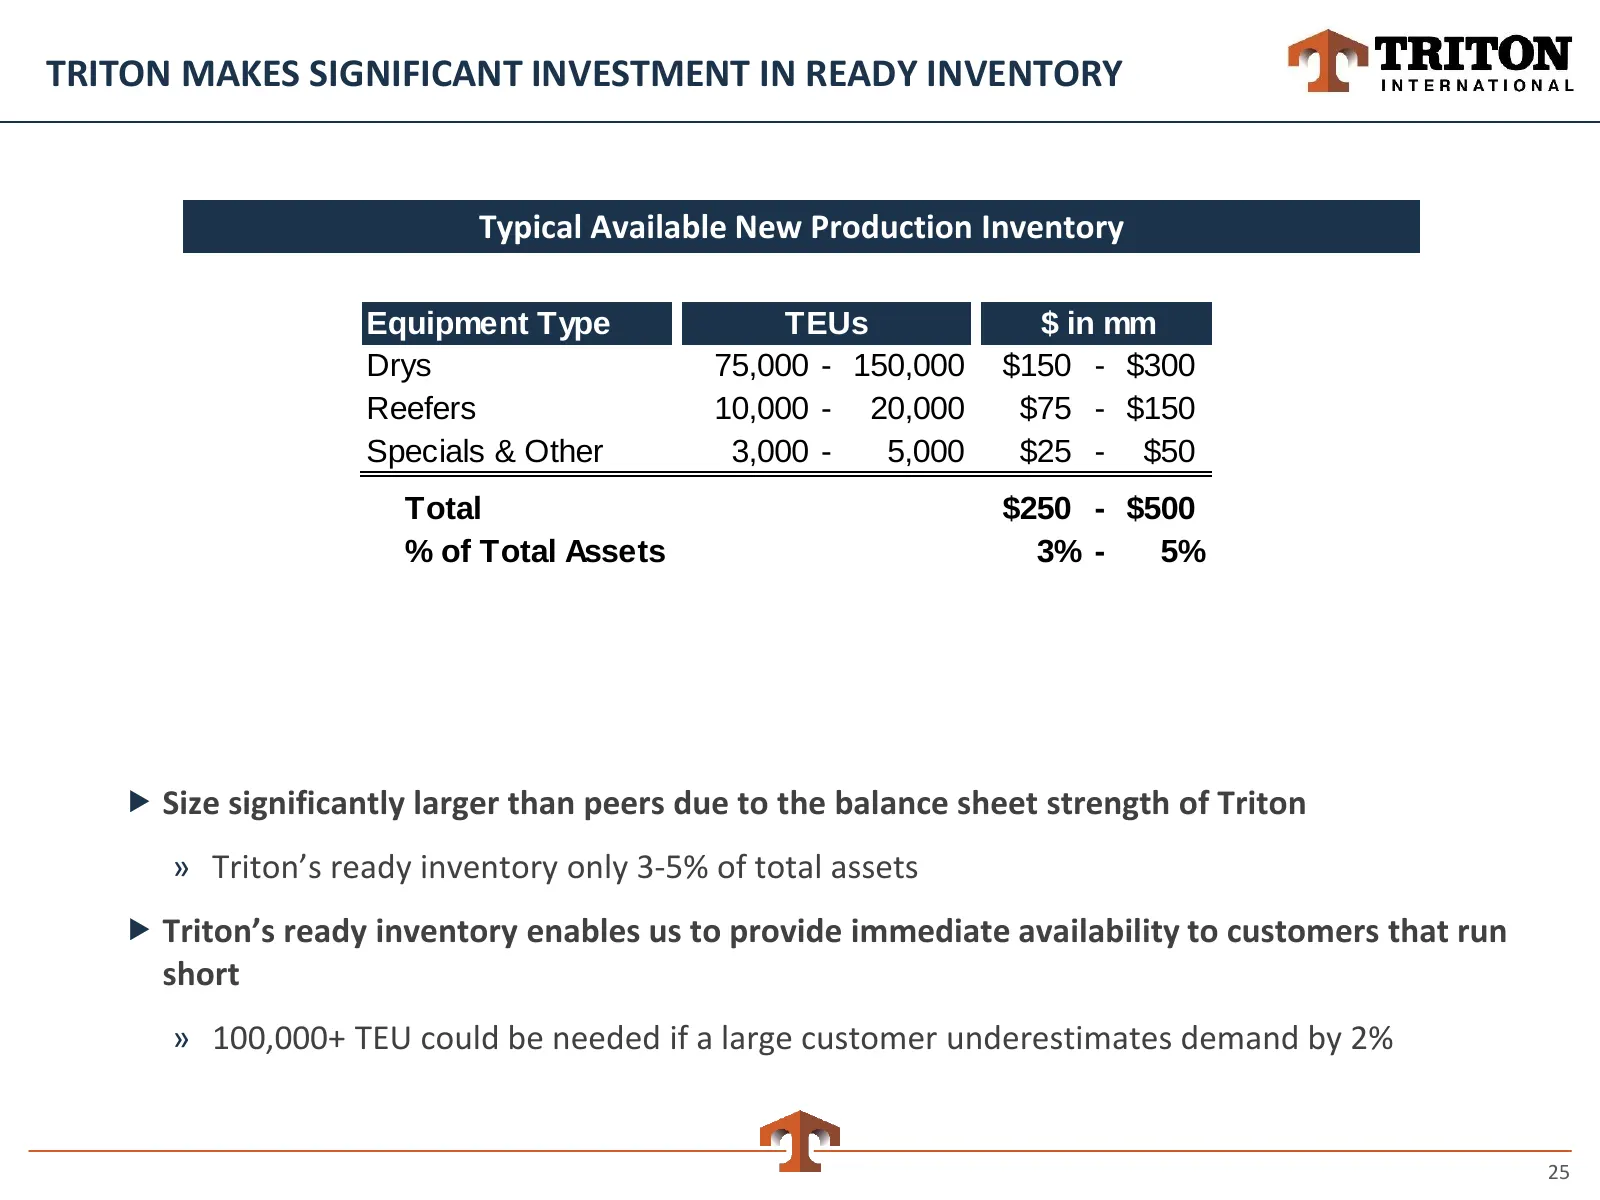
TRITON MAKES SIGNIFICANT INVESTMENT IN READY INVENTORY Typical Available New Production Inventory Equipment Type TEUs $ in mm Drys 75,000 - 150,000 $150 - $300 Reefers 10,000 - 20,000 $75 - $150 Specials & Other 3,000 - 5,000 $25 - $50 Total $250 - $500 % of Total Assets 3% - 5% Size significantly
Slide 26: Triton Covers Customers at Many Levels
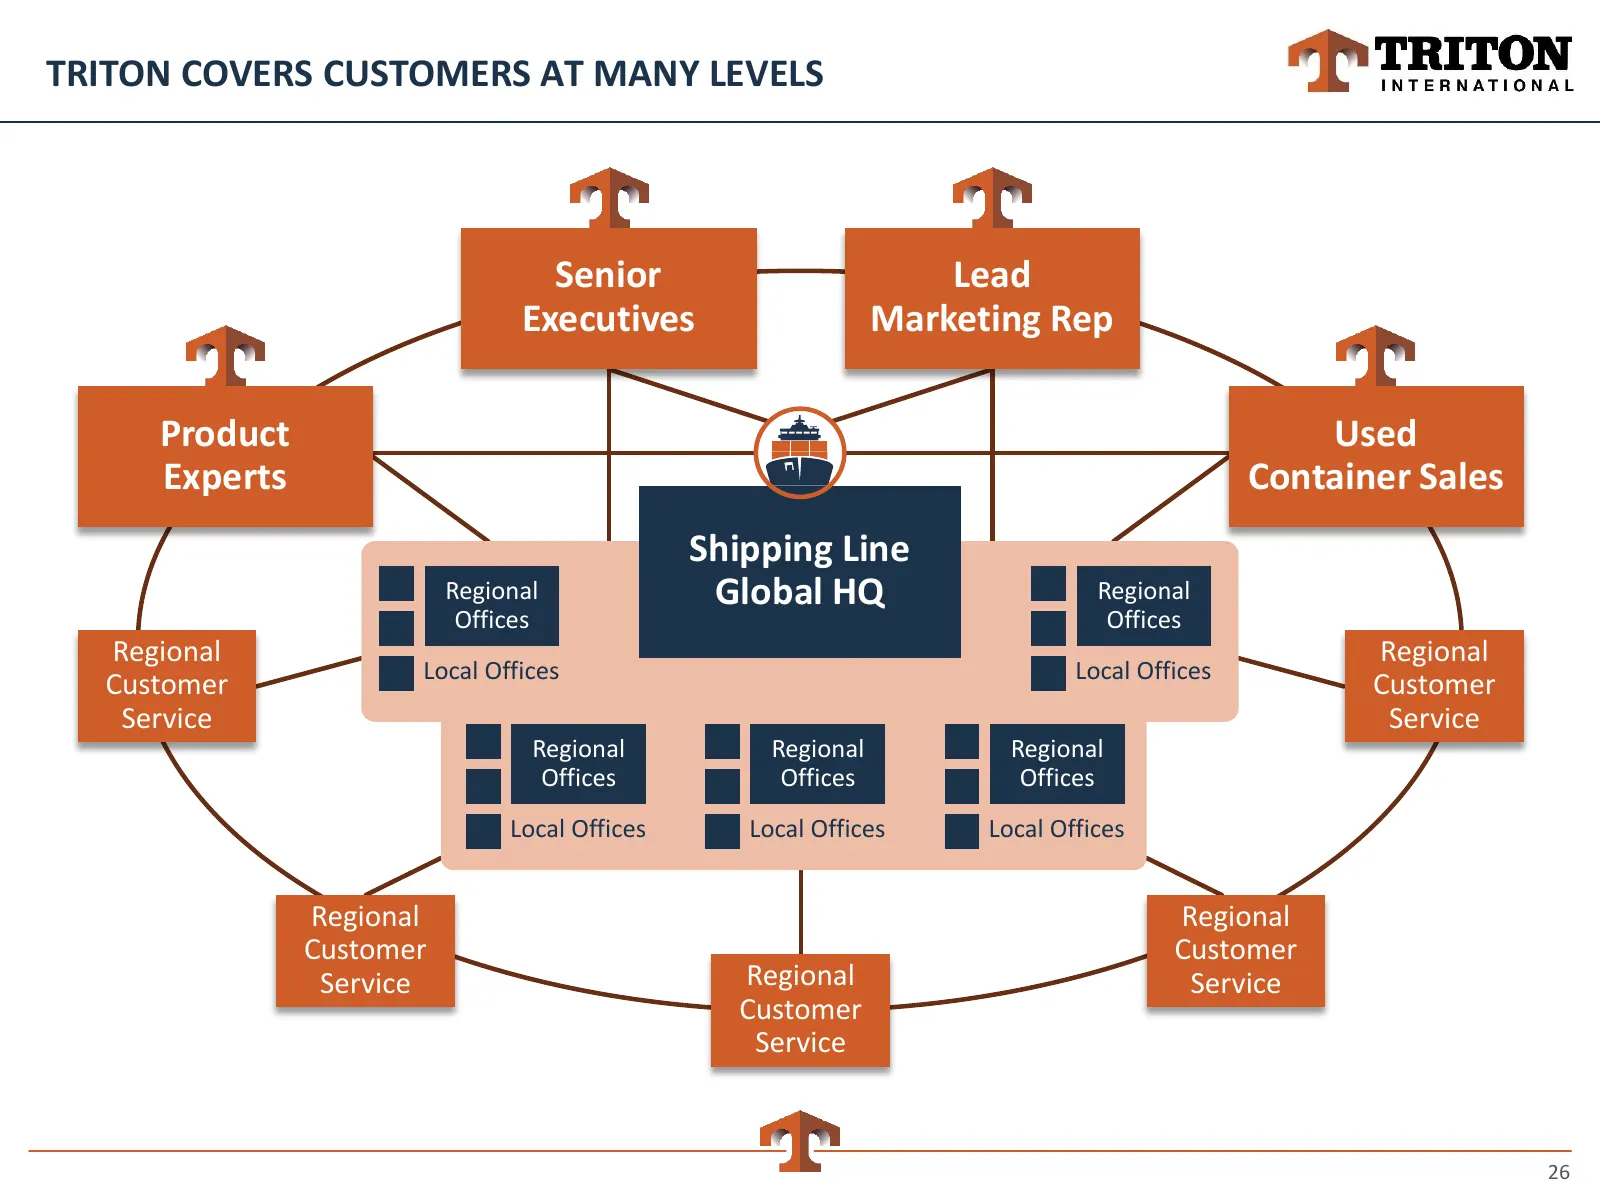
TRITON COVERS CUSTOMERS AT MANY LEVELS Senior Lead Executives Marketing Rep Product Used Experts Container Sales Shipping Line Regional Global HQ Regional Offices Offices Regional Regional Local Offices Local Offices Customer Customer Service Service Regional Regional Regional Offices Offices Office
Slide 27: Most Extensive and Capable Global Operating Infrastructure
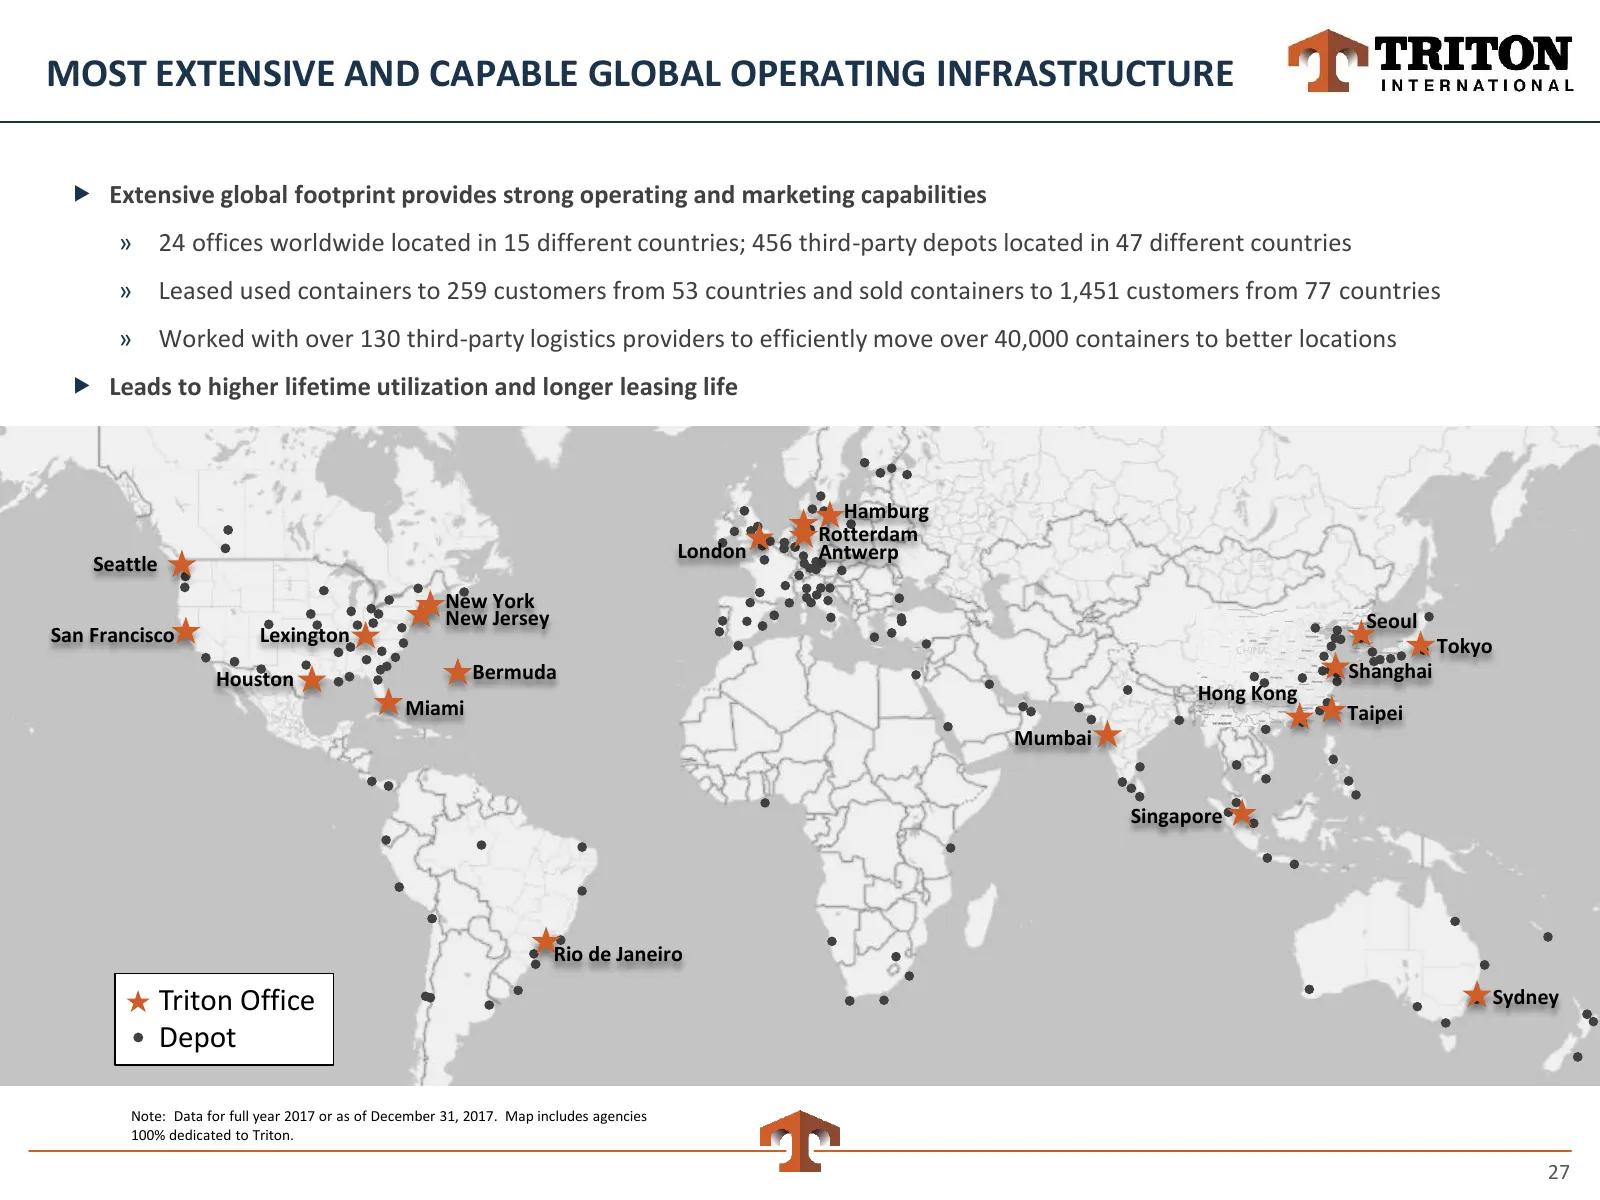
MOST EXTENSIVE AND CAPABLE GLOBAL OPERATING INFRASTRUCTURE Extensive global footprint provides strong operating and marketing capabilities » 24 offices worldwide located in 15 different countries; 456 third-party depots located in 47 different countries » Leased used containers to 259 customers fr
Slide 28: Purchase Containers from Factories in China
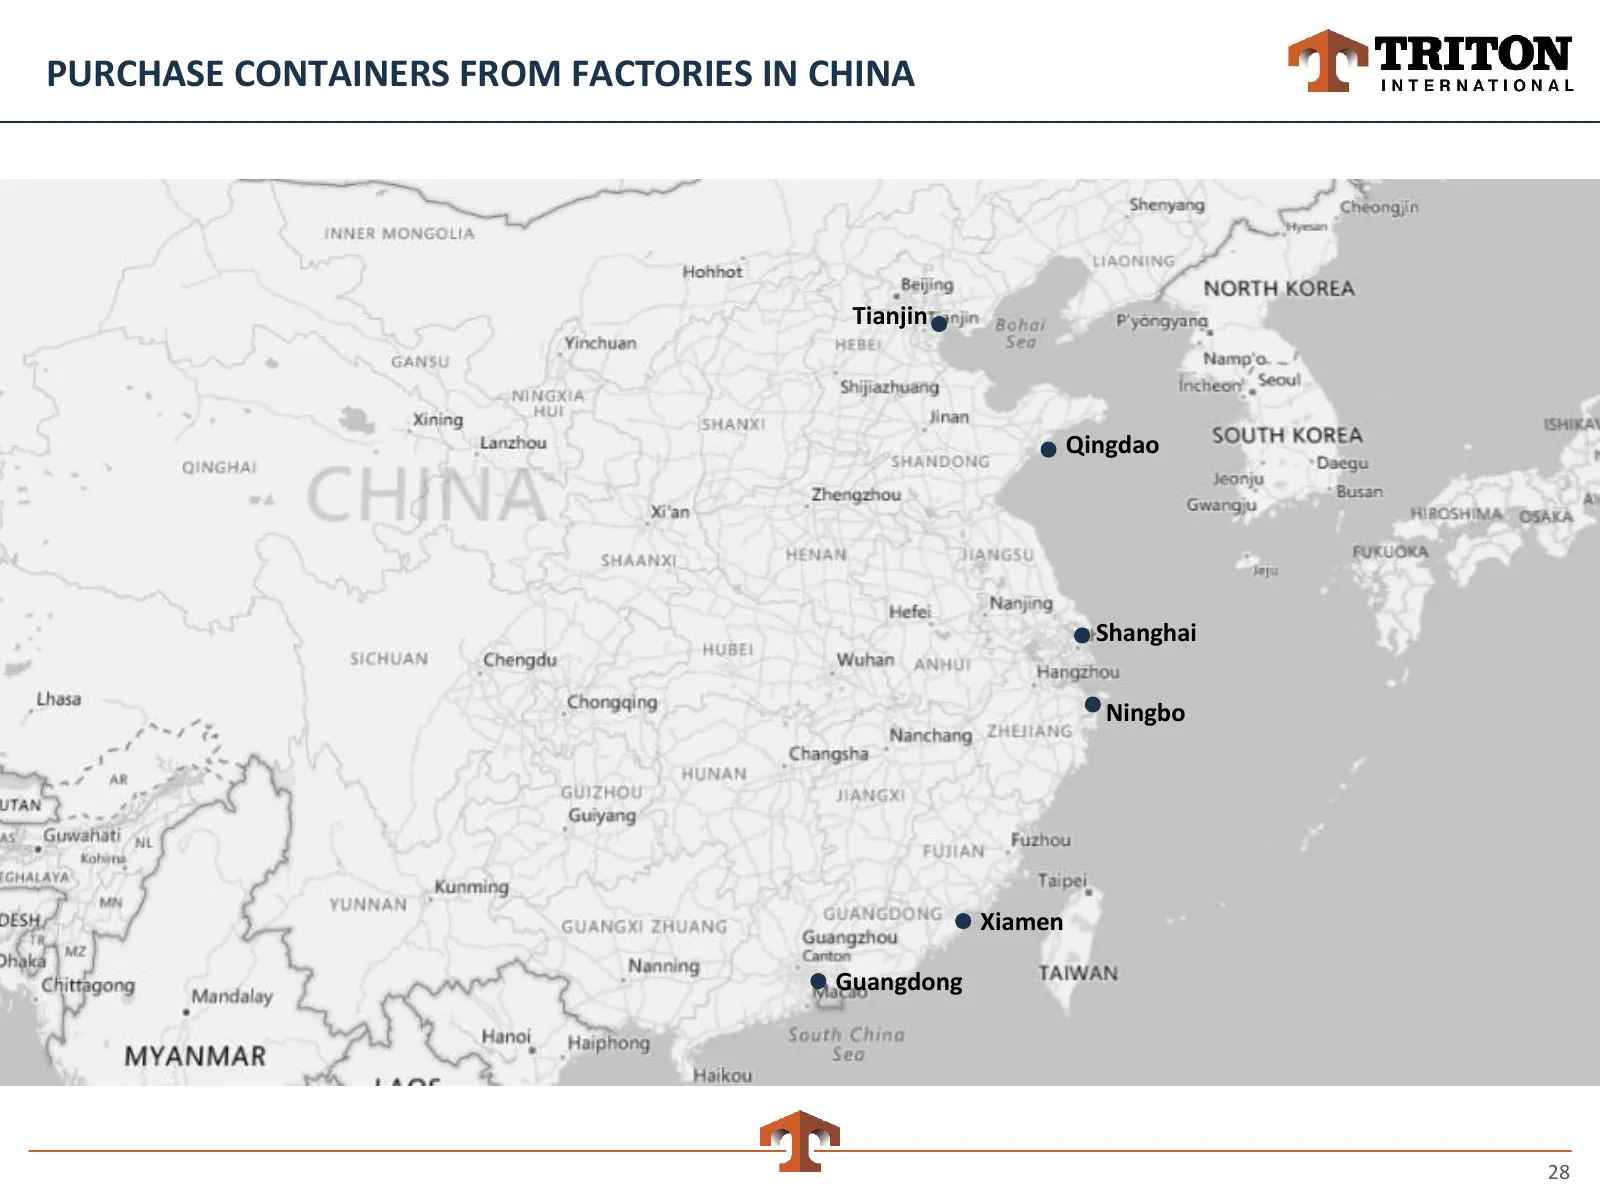
PURCHASE CONTAINERS FROM FACTORIES IN CHINA Tianjin Qingdao Shanghai Ningbo Xiamen Guangdong 28
Slide 29: Typical Dry Container Return Locations After First Lease
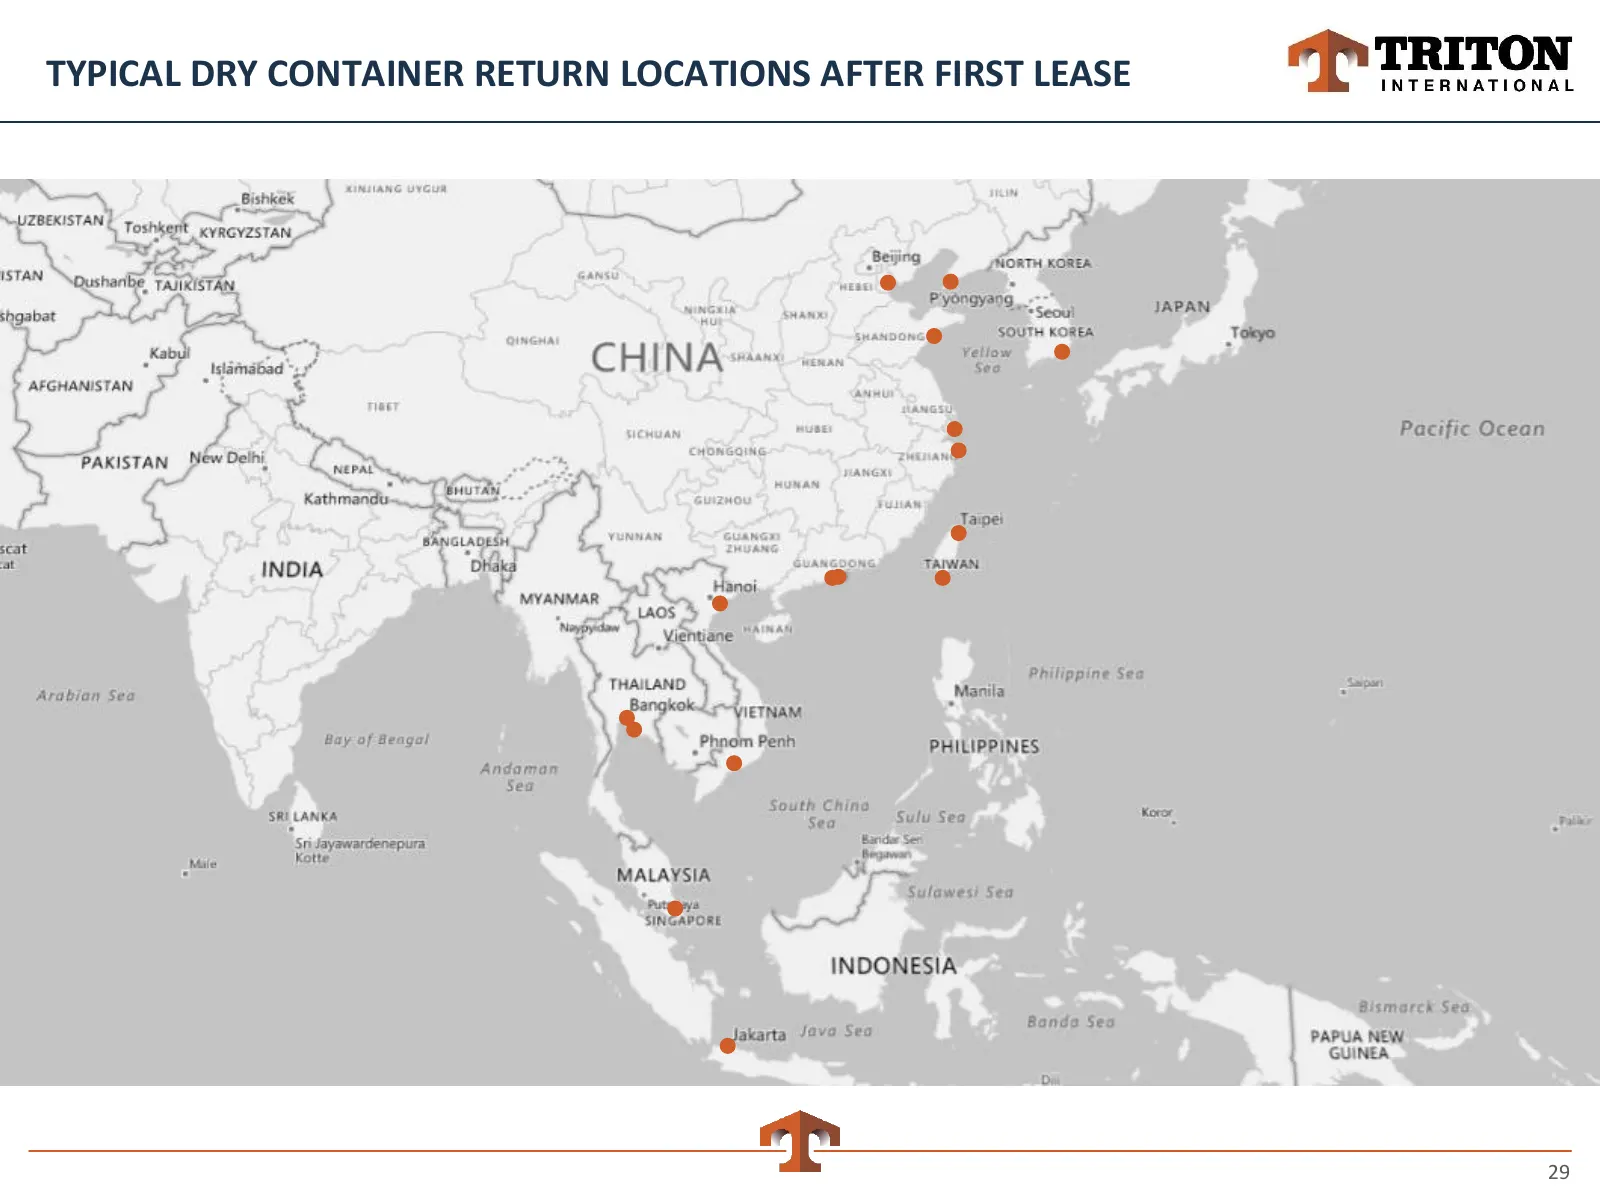
TYPICAL DRY CONTAINER RETURN LOCATIONS AFTER FIRST LEASE 29
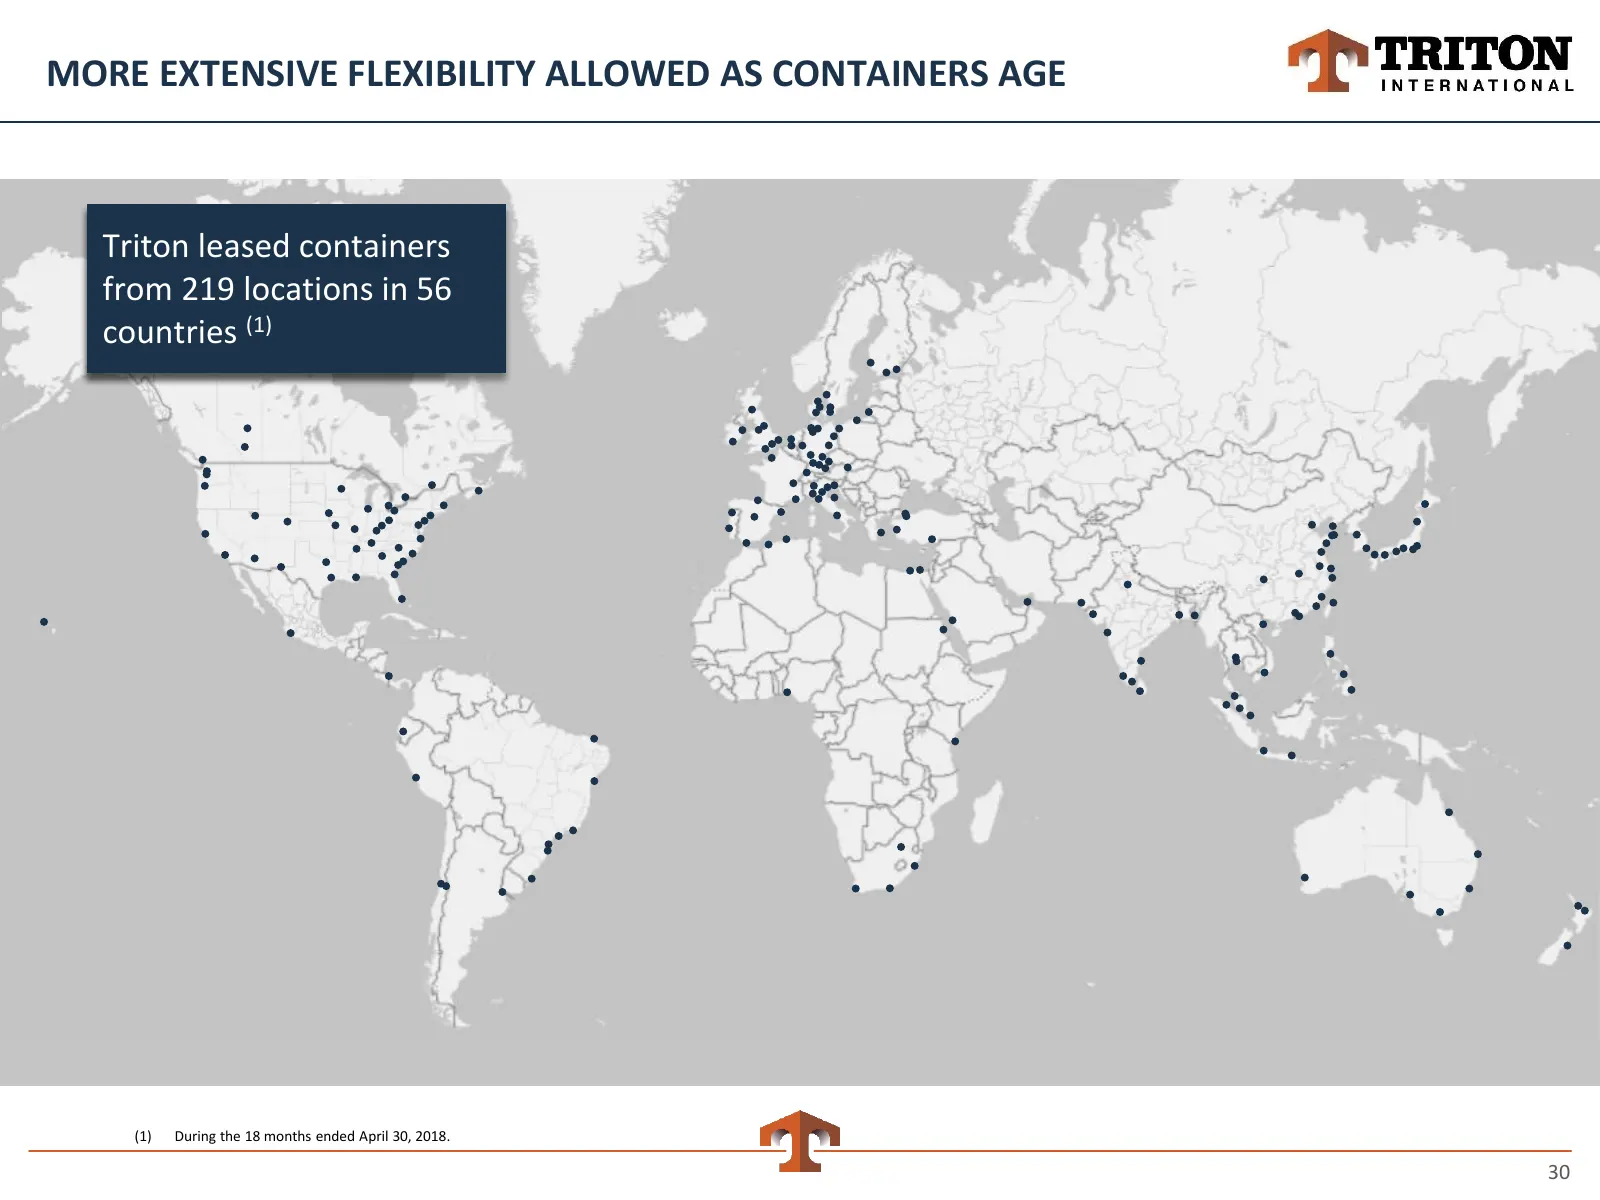
Slide 30: More Extensive Flexibility Allowed as Containers Age
MORE EXTENSIVE FLEXIBILITY ALLOWED AS CONTAINERS AGE Triton leased sold containers containers from 219 364 locations ports in 82in 56 (1) different countries countries (1) (1) During the 18 months ended April 30, 2018. 30
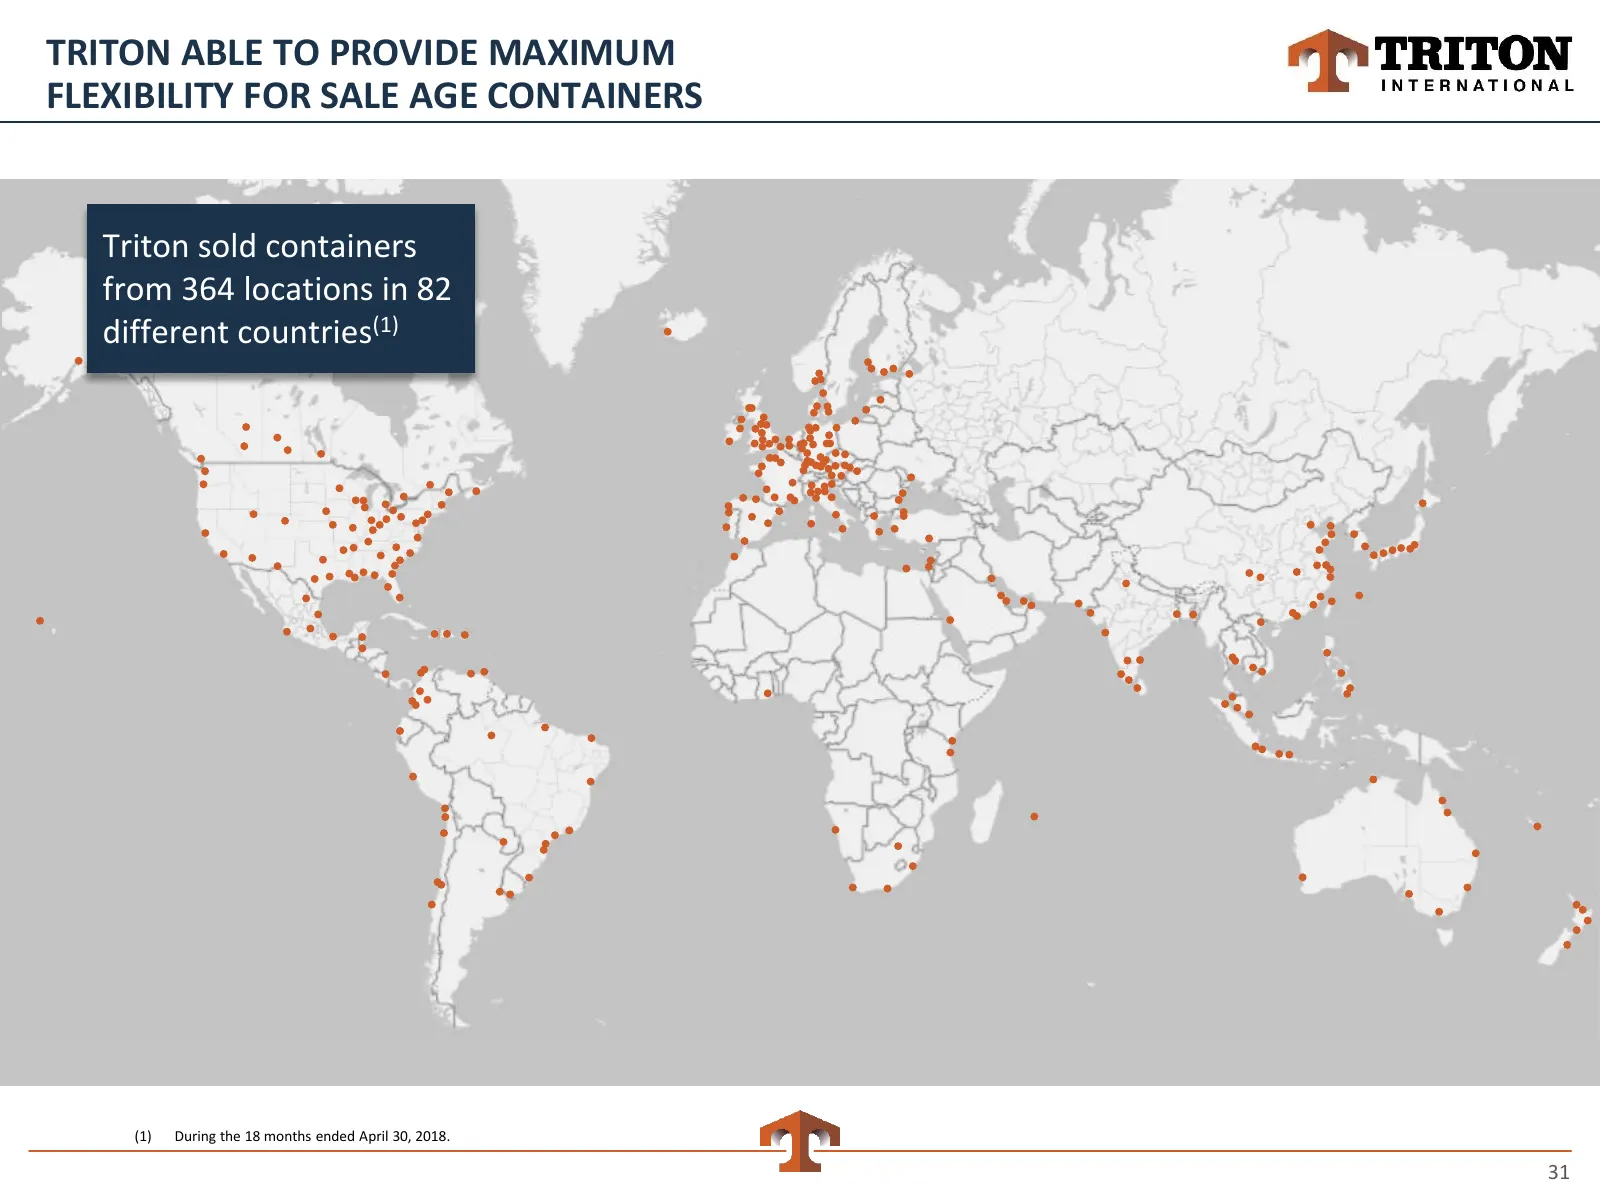
Slide 31: Triton Able to Provide Maximum Flexibility for Sale Age Containers
TRITON ABLE TO PROVIDE MAXIMUM FLEXIBILITY FOR SALE AGE CONTAINERS Triton sold containers from 364 locations in 82 different countries(1) (1) During the 18 months ended April 30, 2018. 31
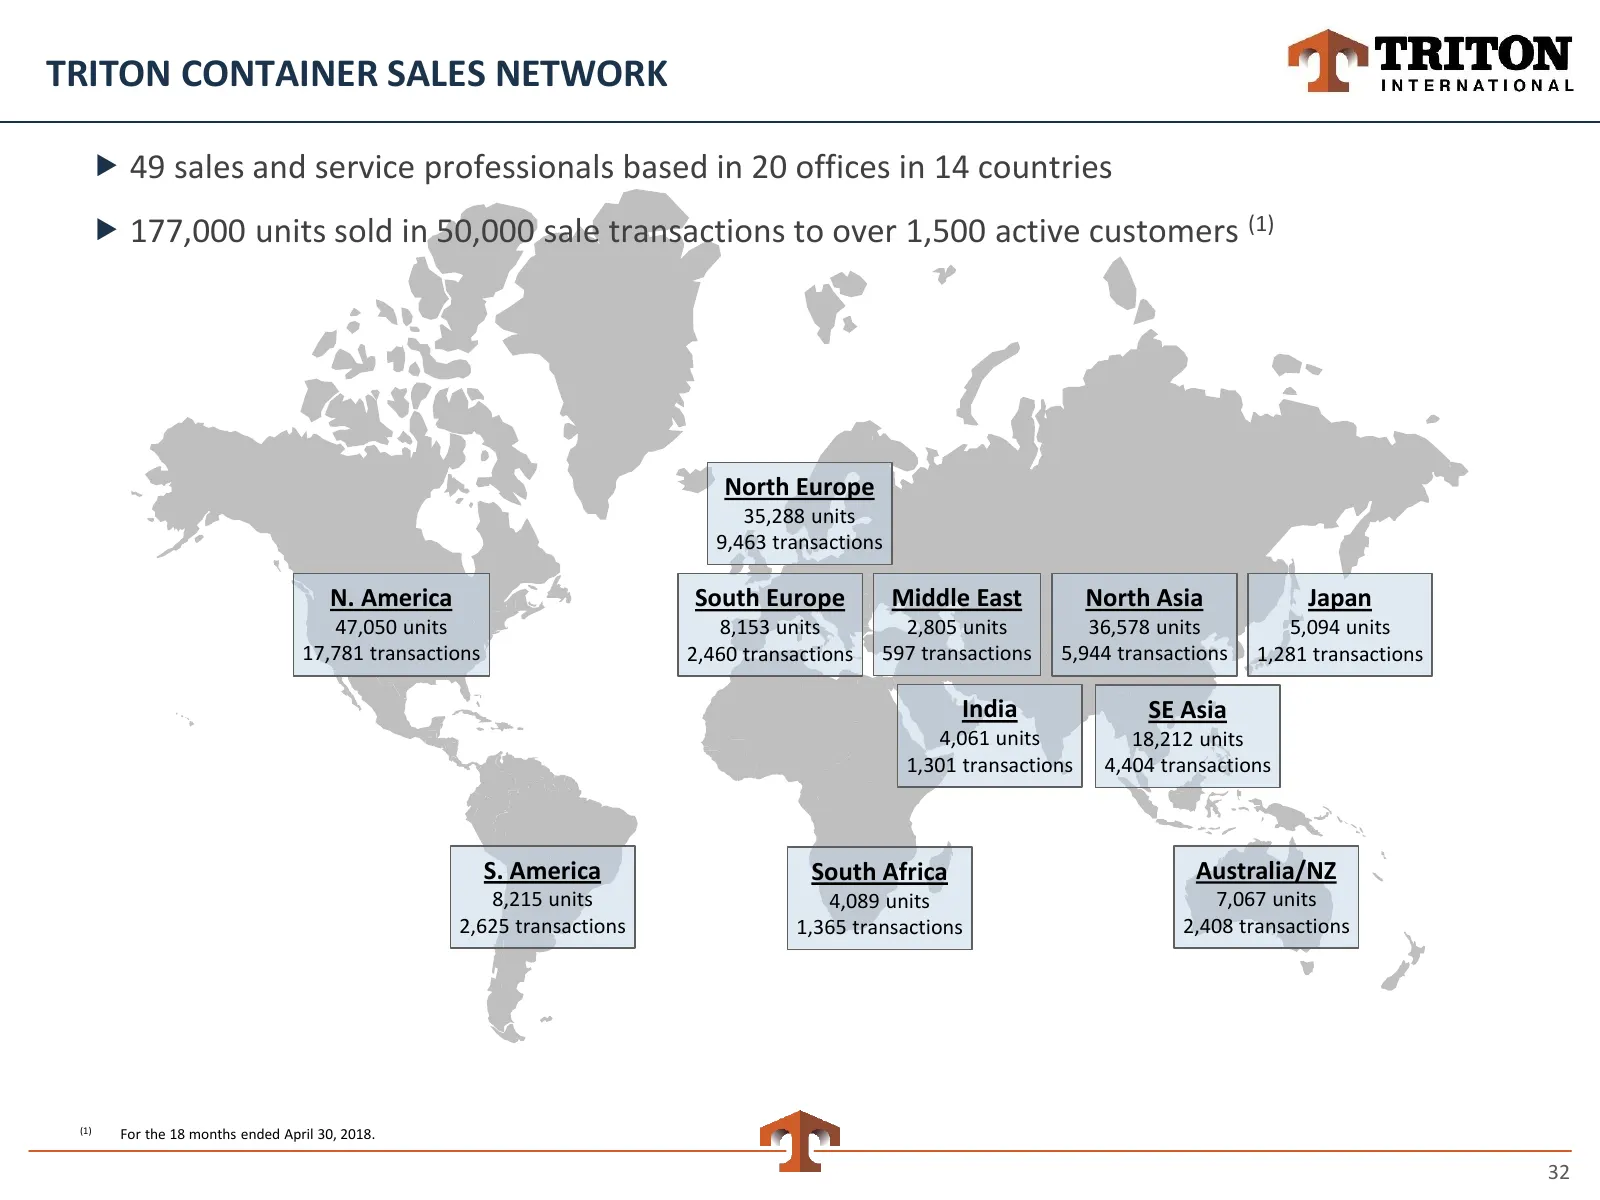
Slide 32: Triton Container Sales Network
TRITON CONTAINER SALES NETWORK 49 sales and service professionals based in 20 offices in 14 countries 177,000 units sold in 50,000 sale transactions to over 1,500 active customers (1) North Europe 35,288 units 9,463 transactions N. America South Europe Middle East North Asia Japan 47,050 units 8
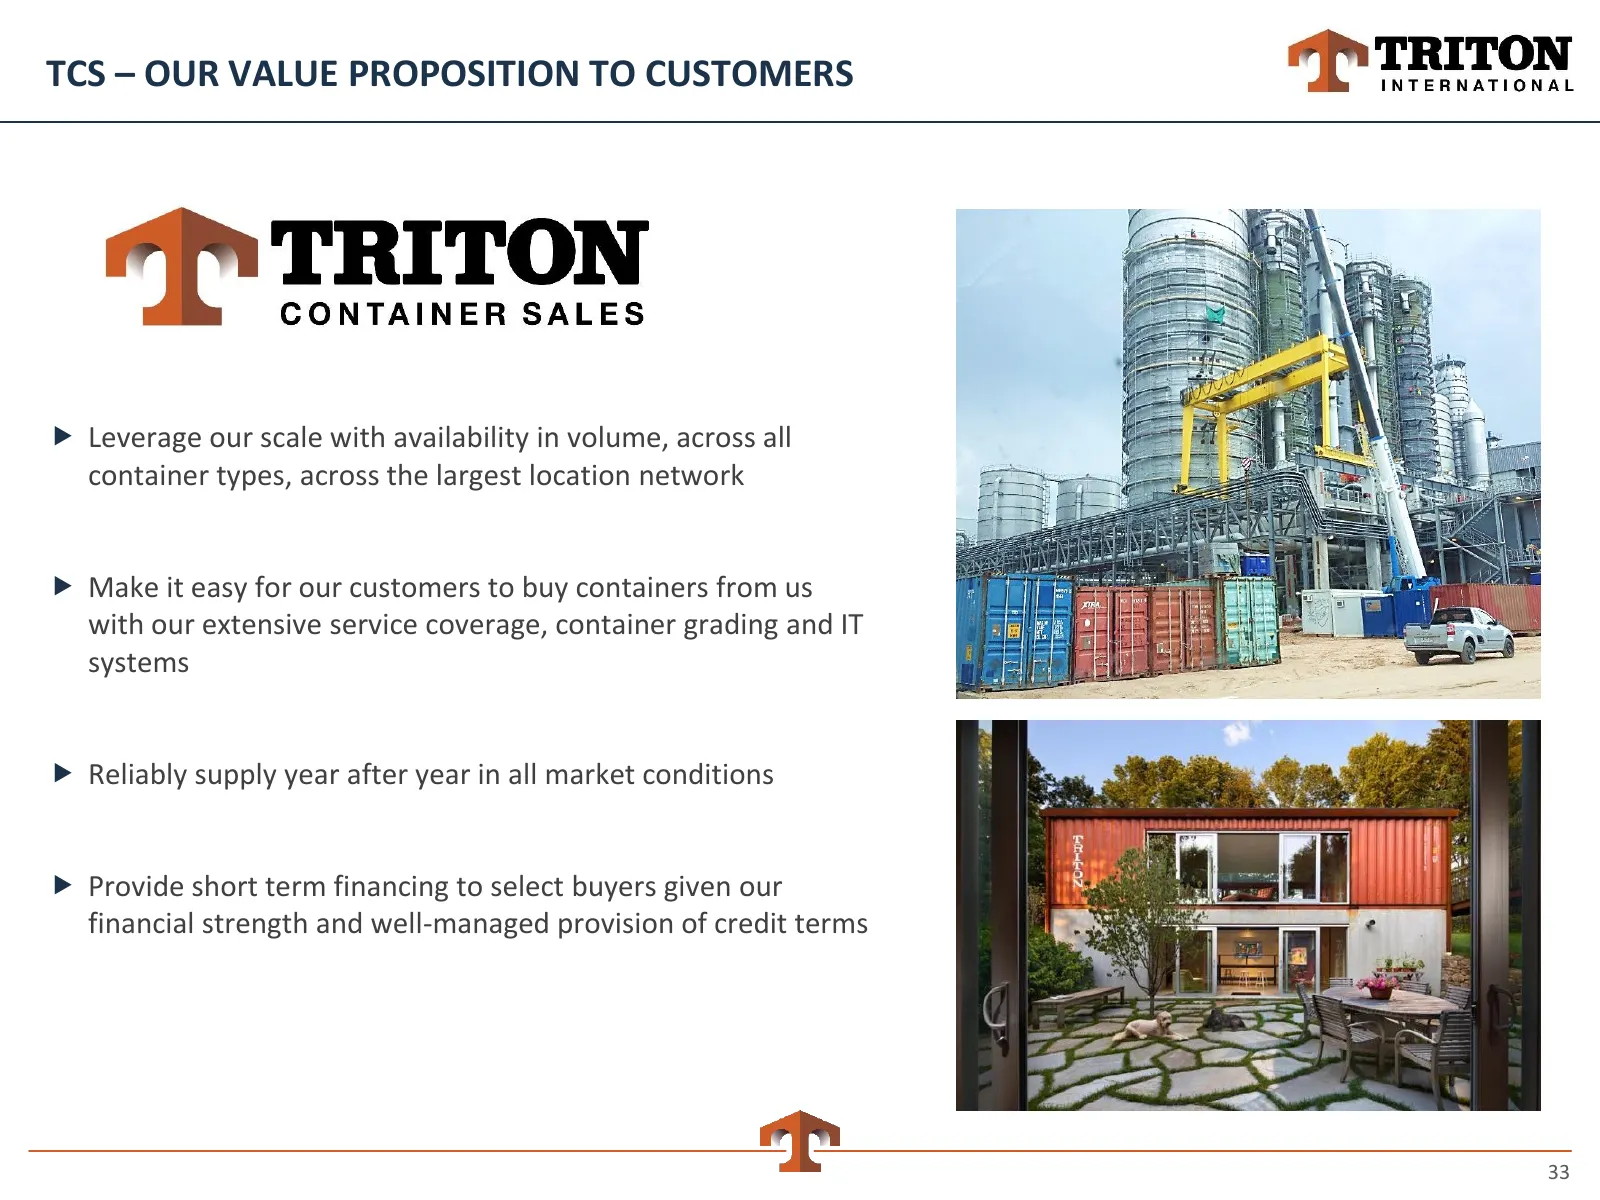
Slide 33: TCS – Our Value Proposition to Customers
TCS – OUR VALUE PROPOSITION TO CUSTOMERS Leverage our scale with availability in volume, across all container types, across the largest location network Make it easy for our customers to buy containers from us with our extensive service coverage, container grading and IT systems Reliably suppl
Slide 34: Consistently Strong Relative Pricing for Older Containers
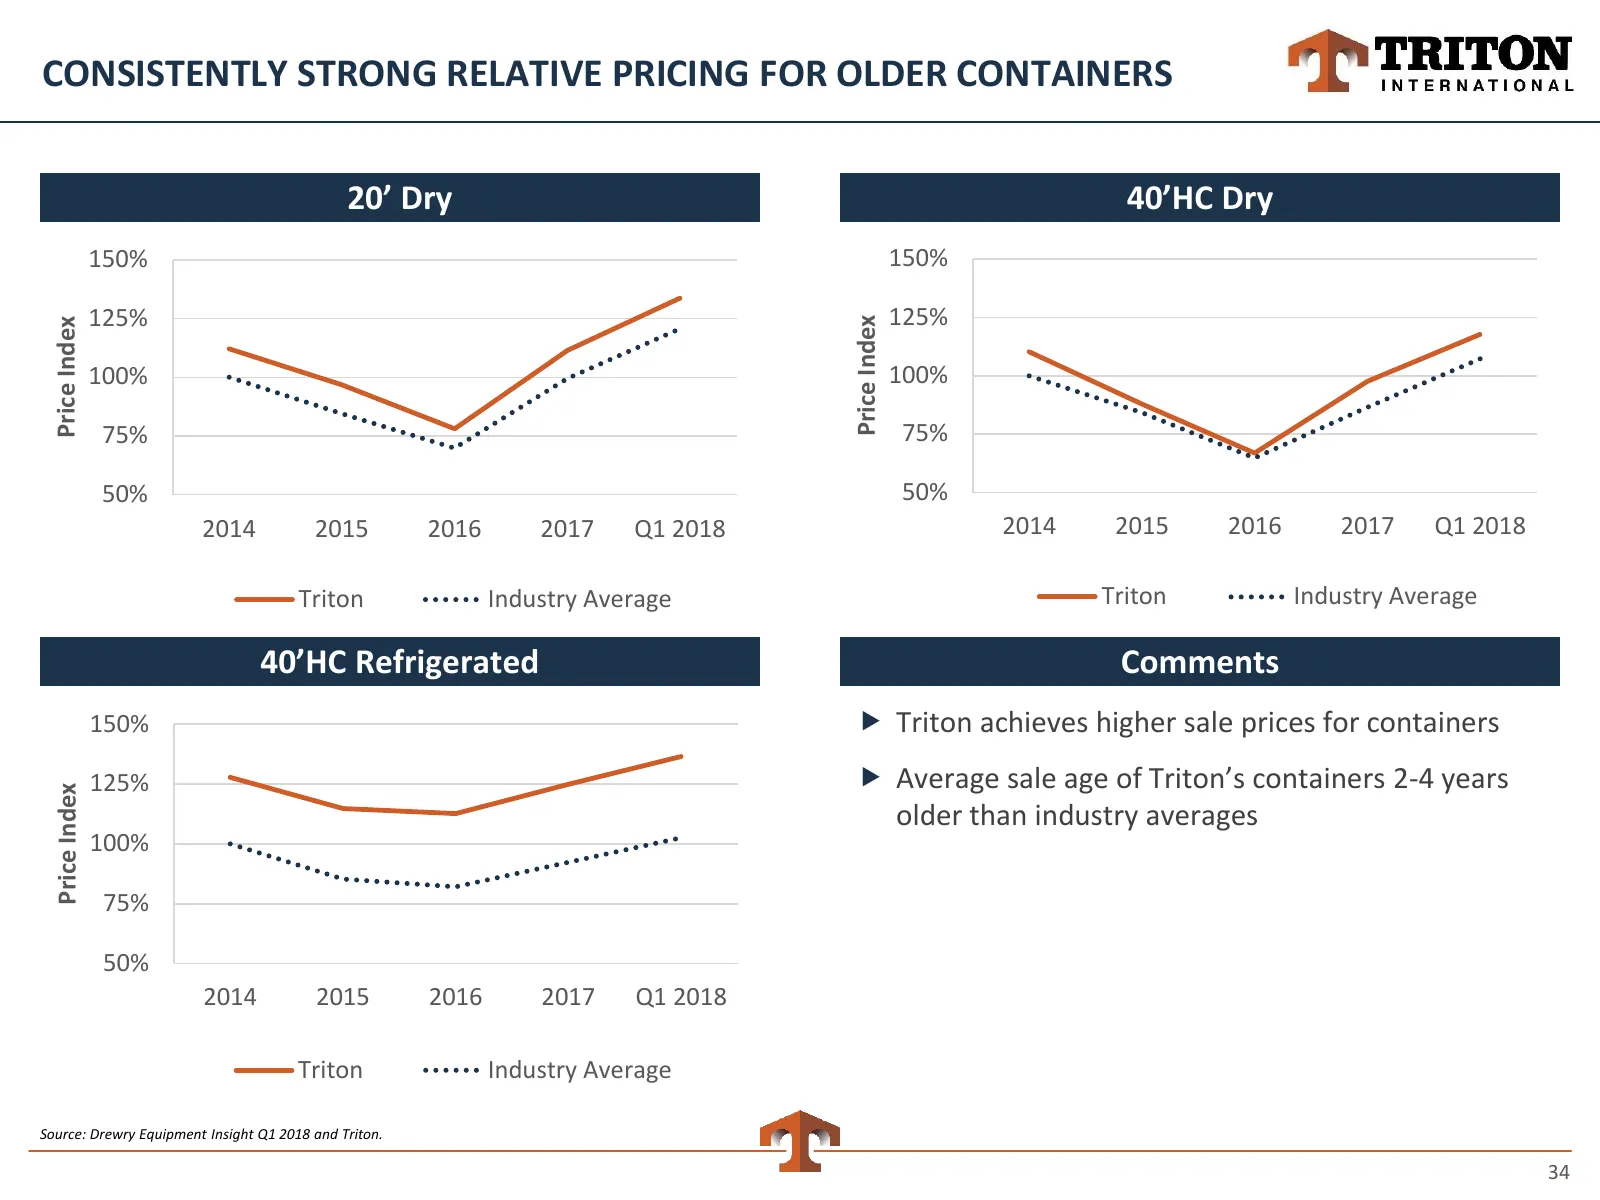
CONSISTENTLY STRONG RELATIVE PRICING FOR OLDER CONTAINERS 20’ Dry 20’ Dry 40’HC Dry 40’HC Dry 150% 150% 125% 125% Price Index Price Index 100% 100% 75% 75% 50% 50% 2014 2015 2016 2017 Q1 2018 2014 2015 2016 2017 Q1 2018 Triton Industry Average Triton Industry Average 40’HC 40’ Dry Refrigerated Comme
Slide 35: Sale-Leaseback Transactions
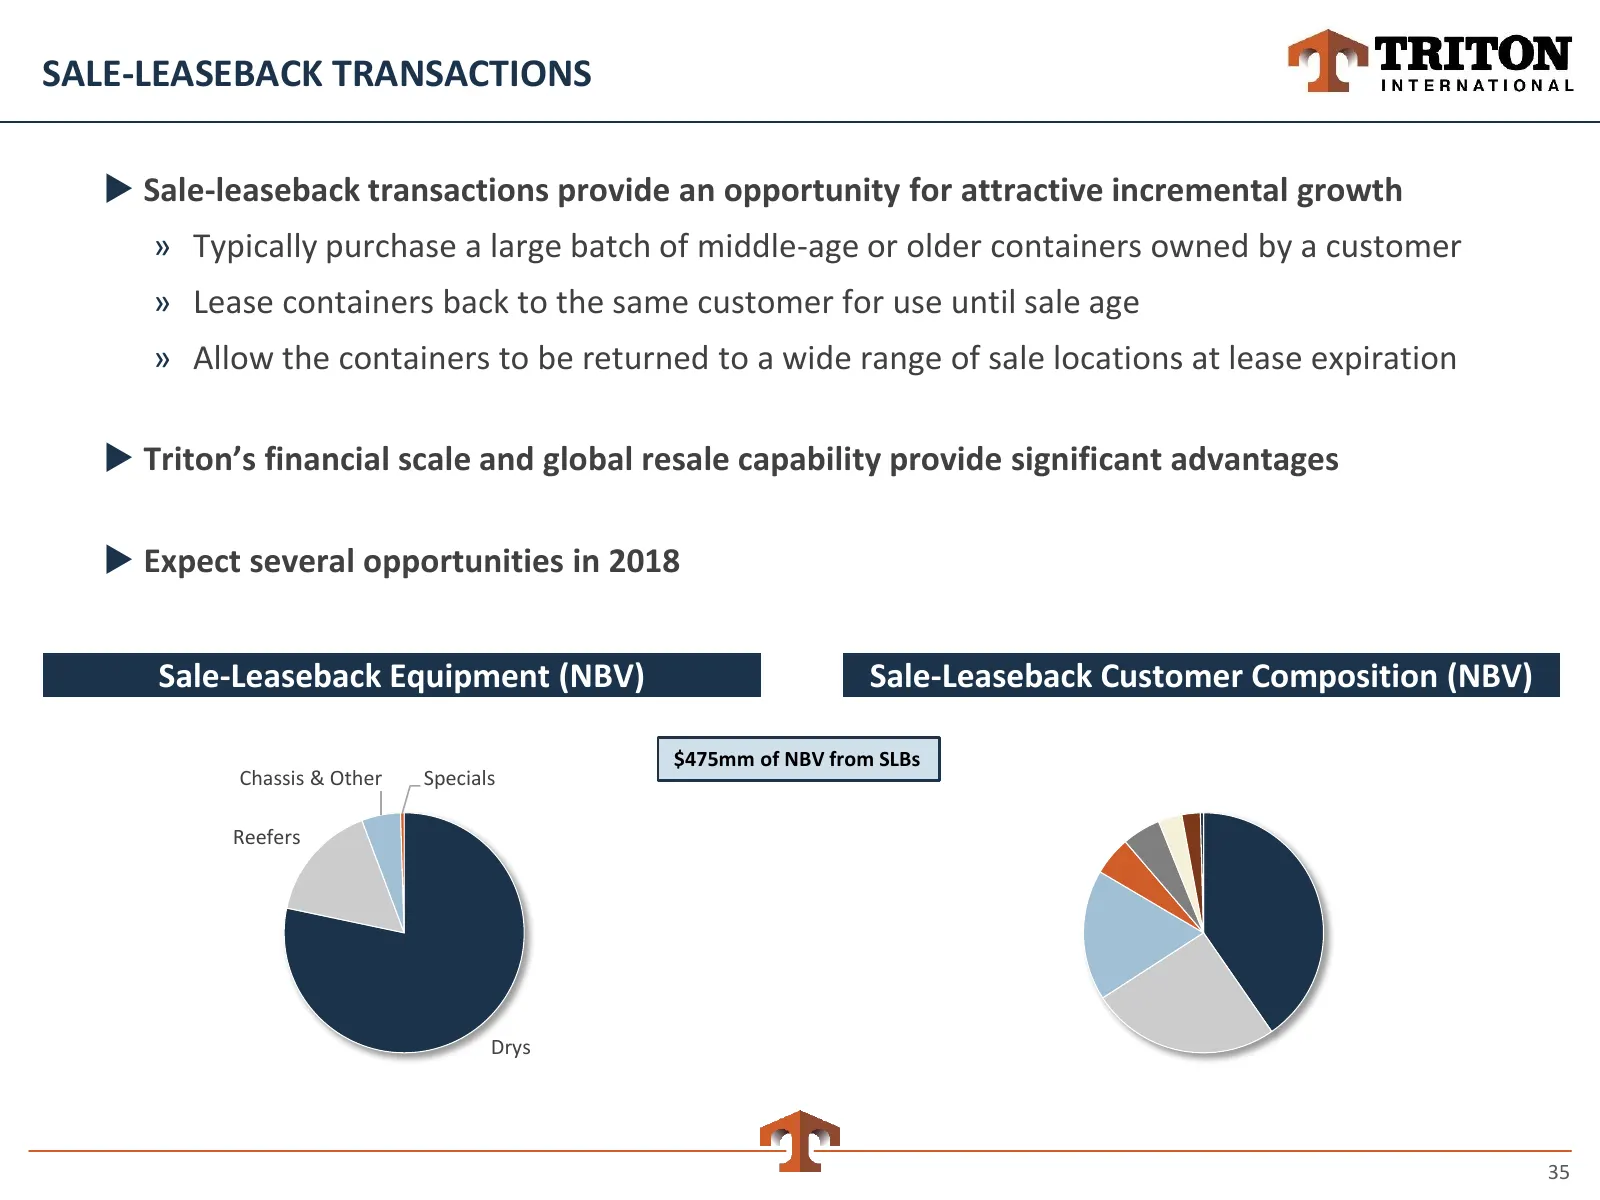
SALE-LEASEBACK TRANSACTIONS Sale-leaseback transactions provide an opportunity for attractive incremental growth » Typically purchase a large batch of middle-age or older containers owned by a customer » Lease containers back to the same customer for use until sale age » Allow the containers to be
Slide 36: Triton's Global Cost Control
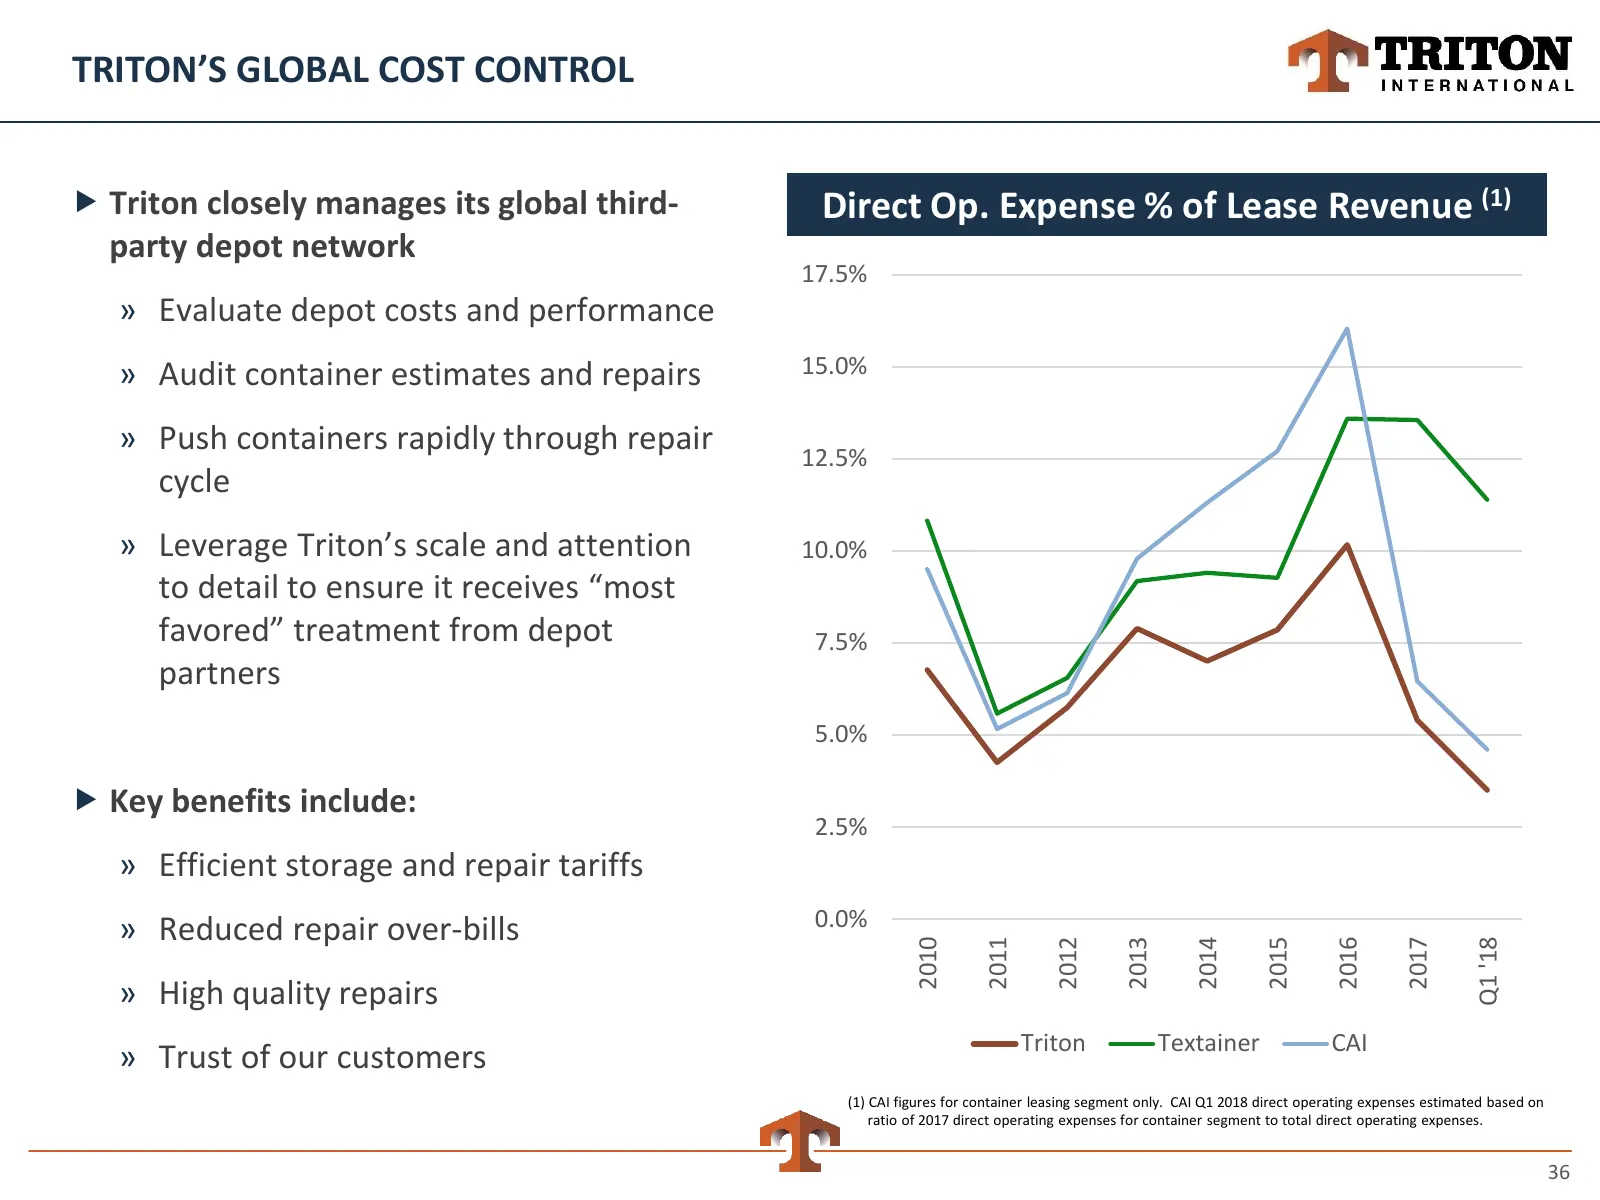
TRITON’S GLOBAL COST CONTROL Triton closely manages its global third- Direct Op. Expense % of Lease Revenue (1) party depot network 17.5% » Evaluate depot costs and performance » Audit container estimates and repairs 15.0% » Push containers rapidly through repair 12.5% cycle » Leverage Triton’s sc
Slide 37: Triton Has Powerful Customized Systems
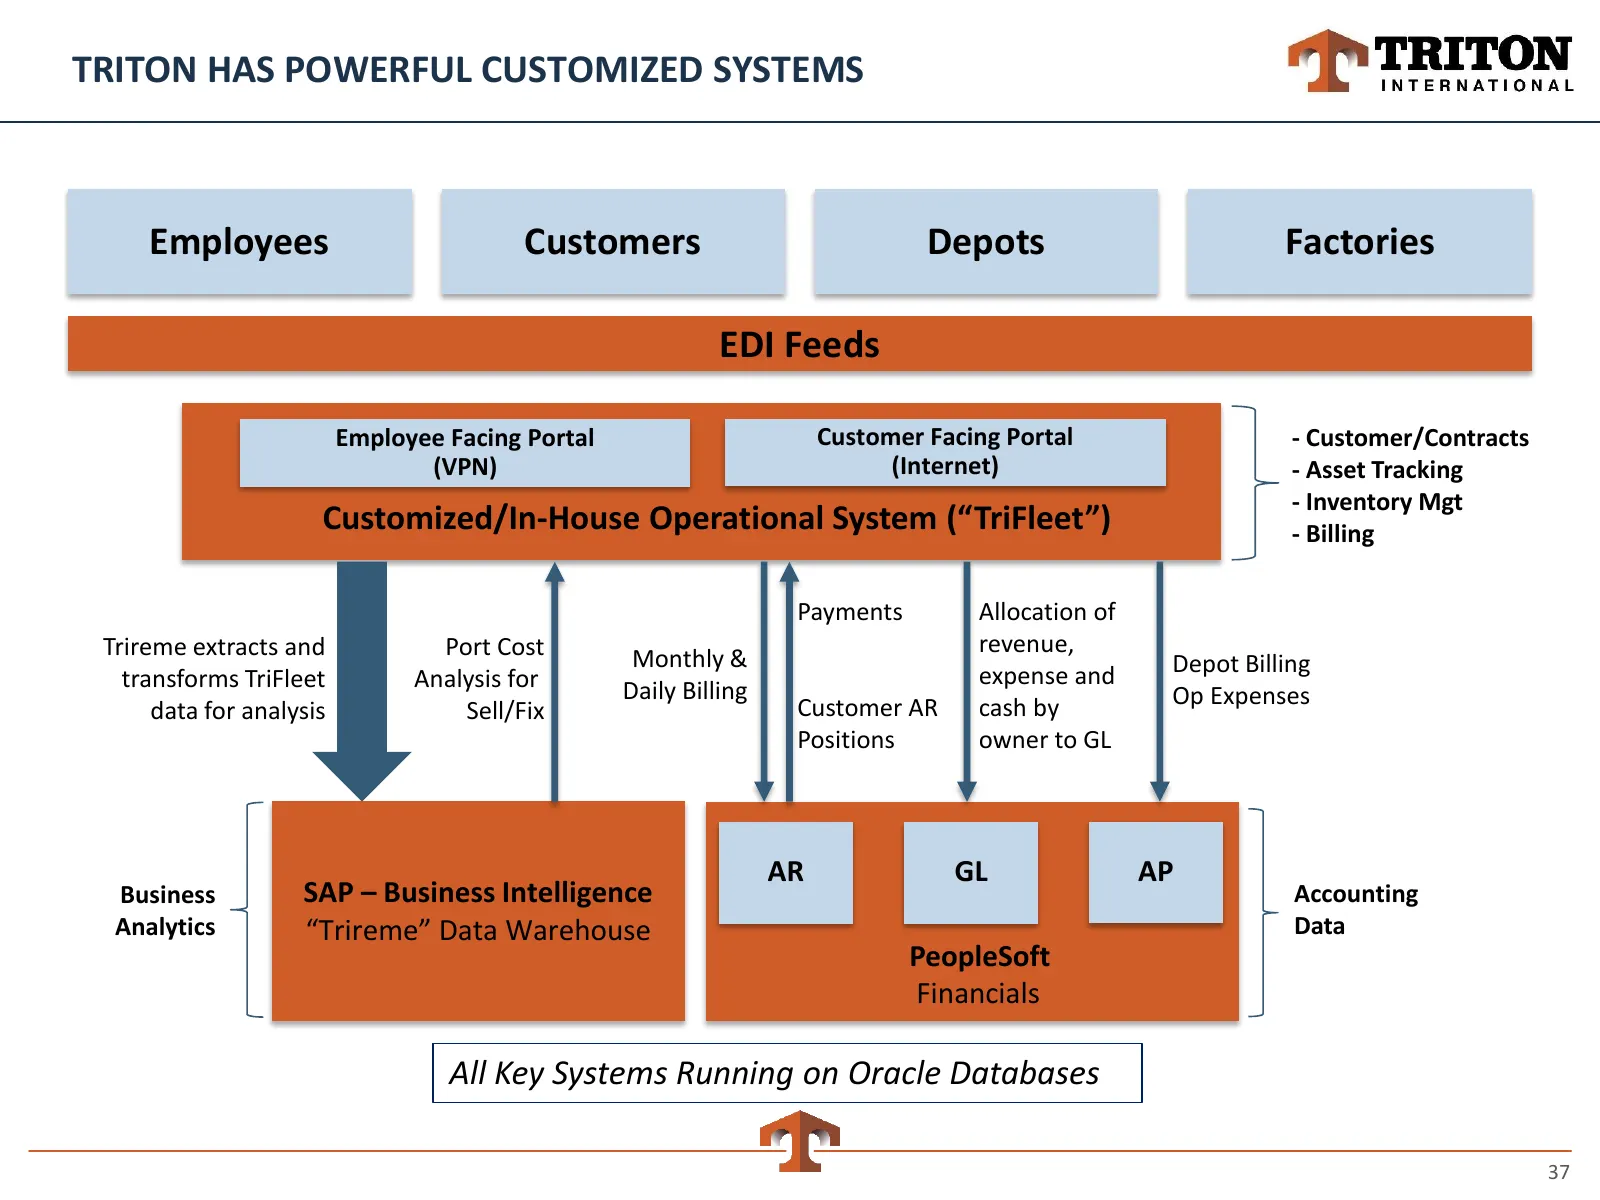
TRITON HAS POWERFUL CUSTOMIZED SYSTEMS Employees Customers Depots Factories EDI Feeds Employee Facing Portal Customer Facing Portal - Customer/Contracts (VPN) (Internet) - Asset Tracking - Inventory Mgt Customized/In-House Operational System (“TriFleet”) - Billing Payments Allocation of Trireme extr
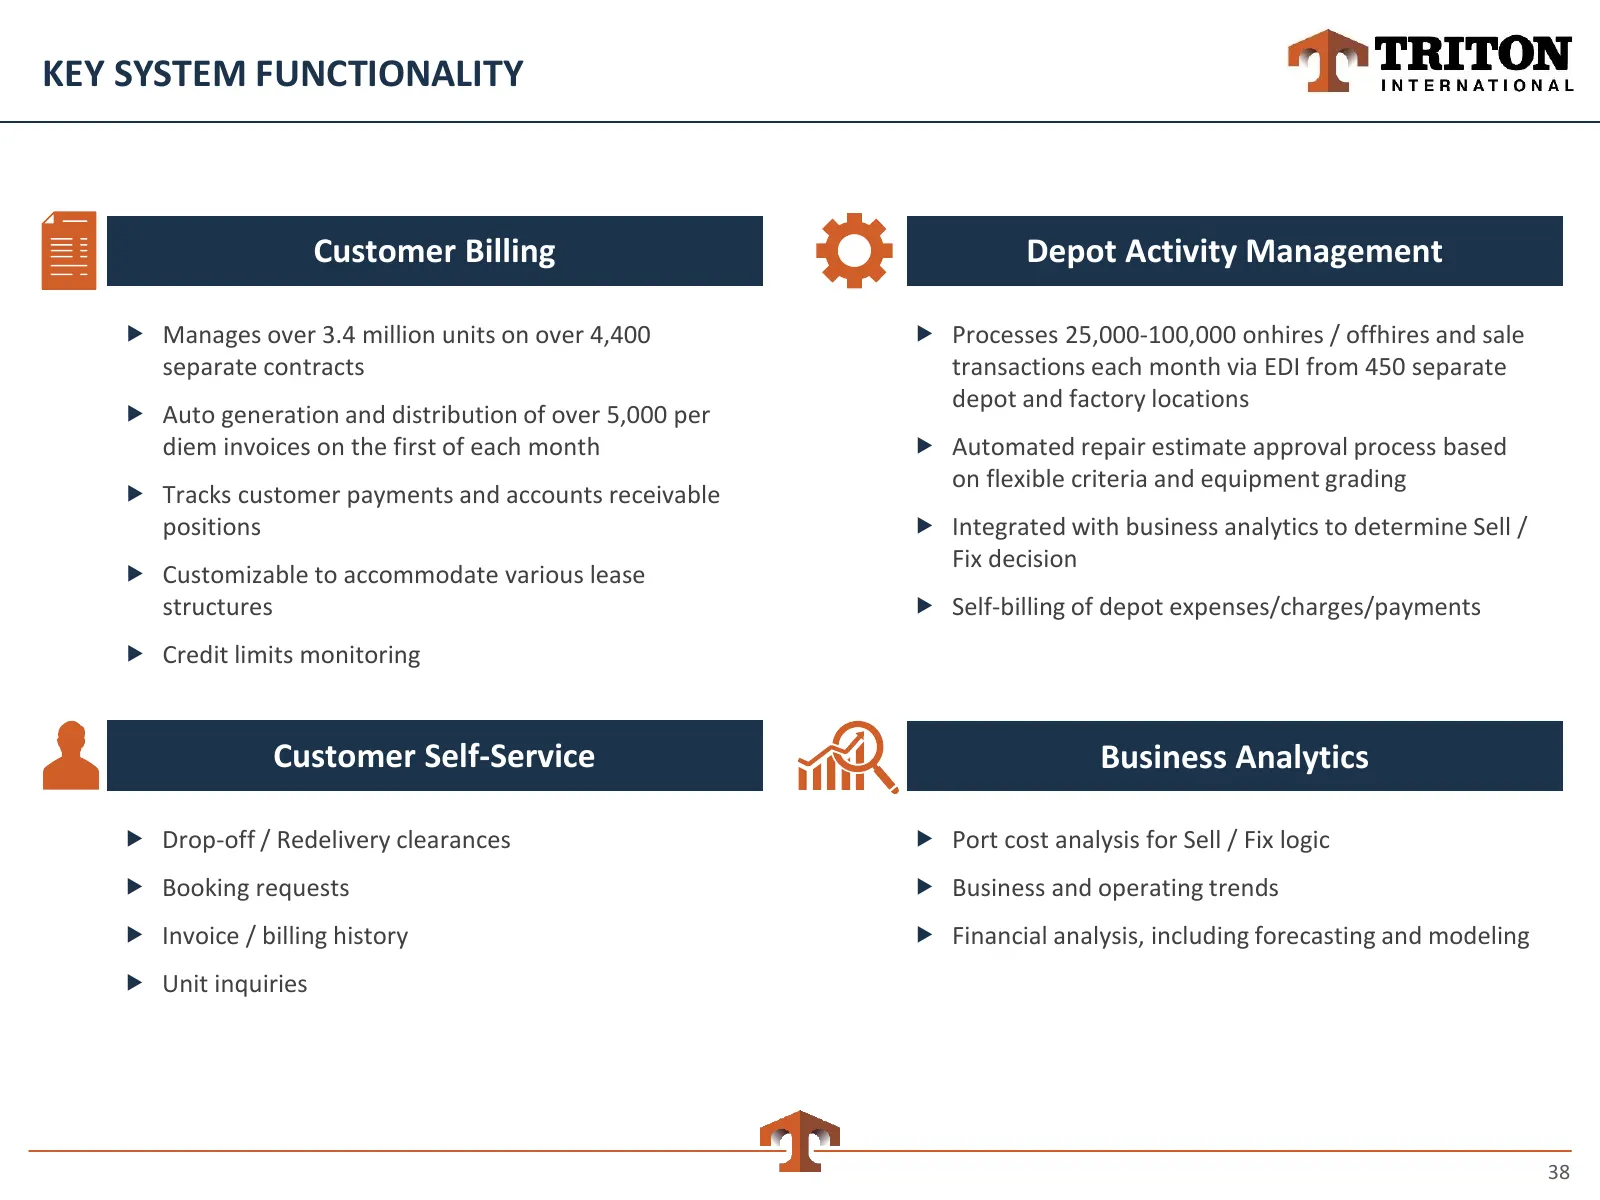
Slide 38: Key System Functionality
KEY SYSTEM FUNCTIONALITY Customer Billing Depot Activity Management Manages over 3.4 million units on over 4,400 Processes 25,000-100,000 onhires / offhires and sale separate contracts transactions each month via EDI from 450 separate depot and factory locations Auto generation and distributio
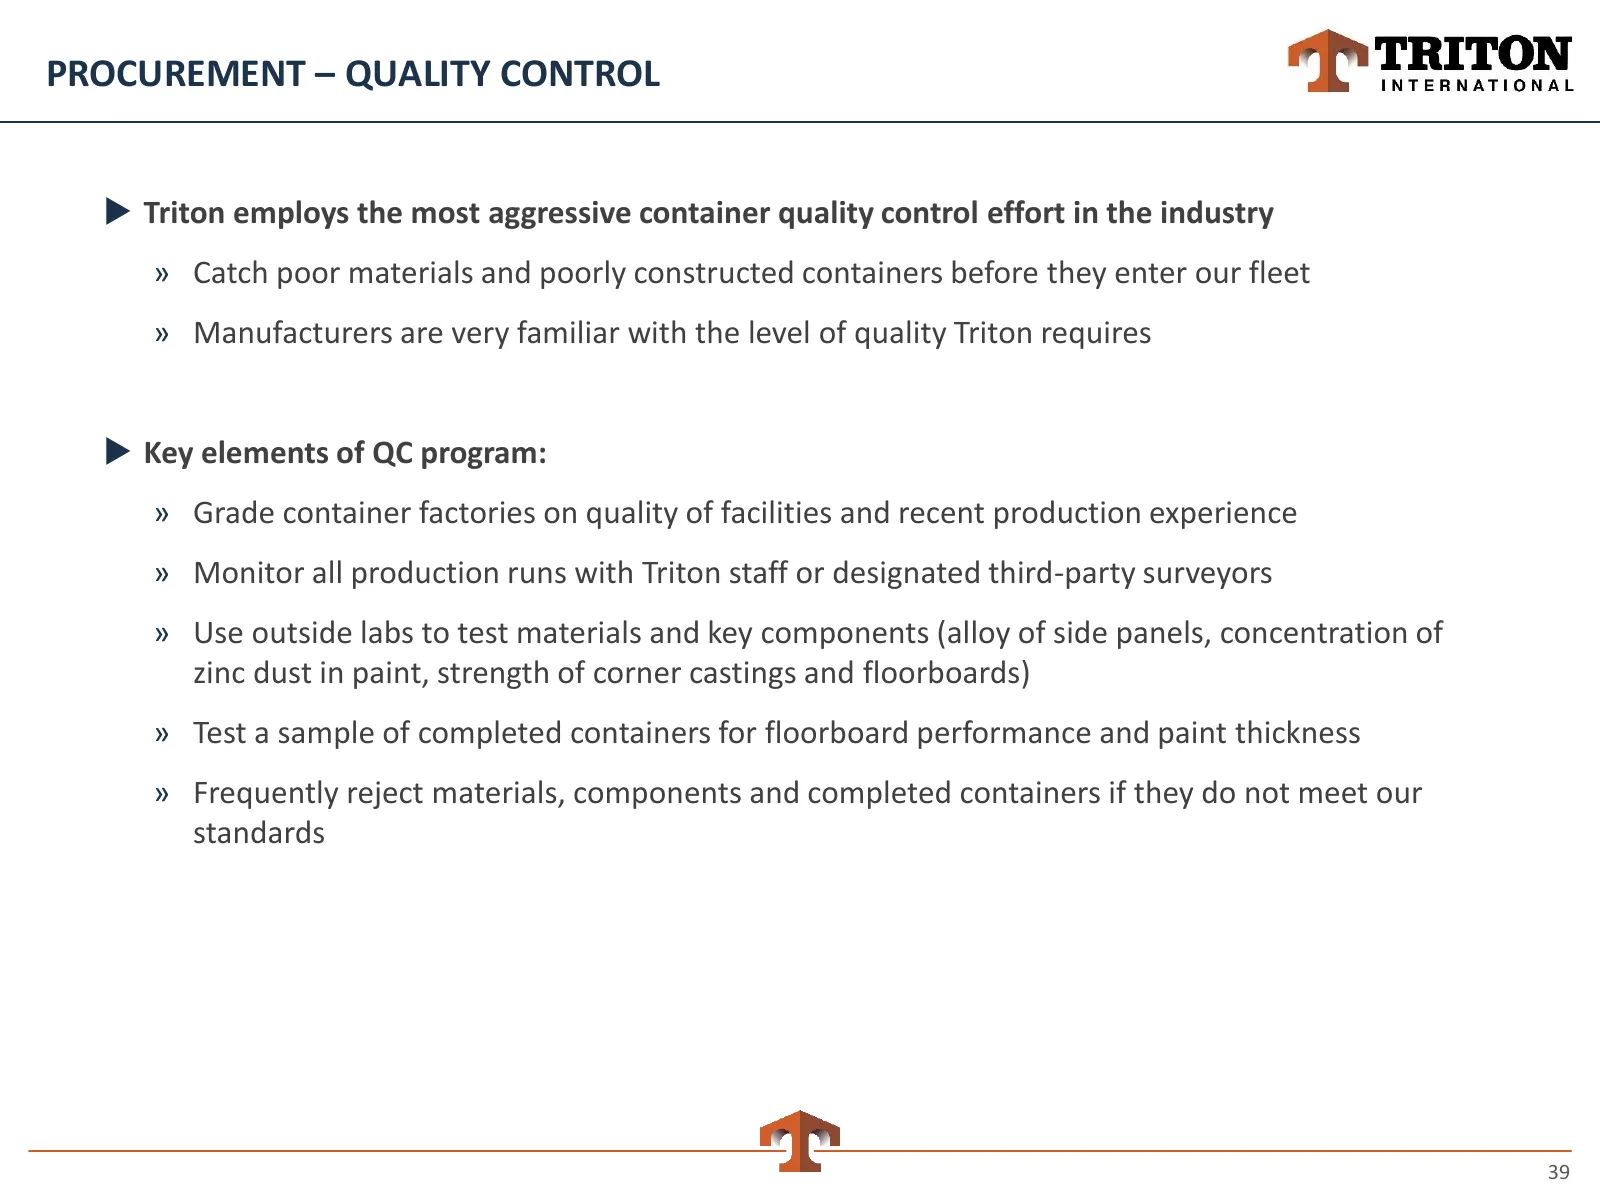
Slide 39: Procurement – Quality Control
PROCUREMENT – QUALITY CONTROL Triton employs the most aggressive container quality control effort in the industry » Catch poor materials and poorly constructed containers before they enter our fleet » Manufacturers are very familiar with the level of quality Triton requires Key elements of QC pr
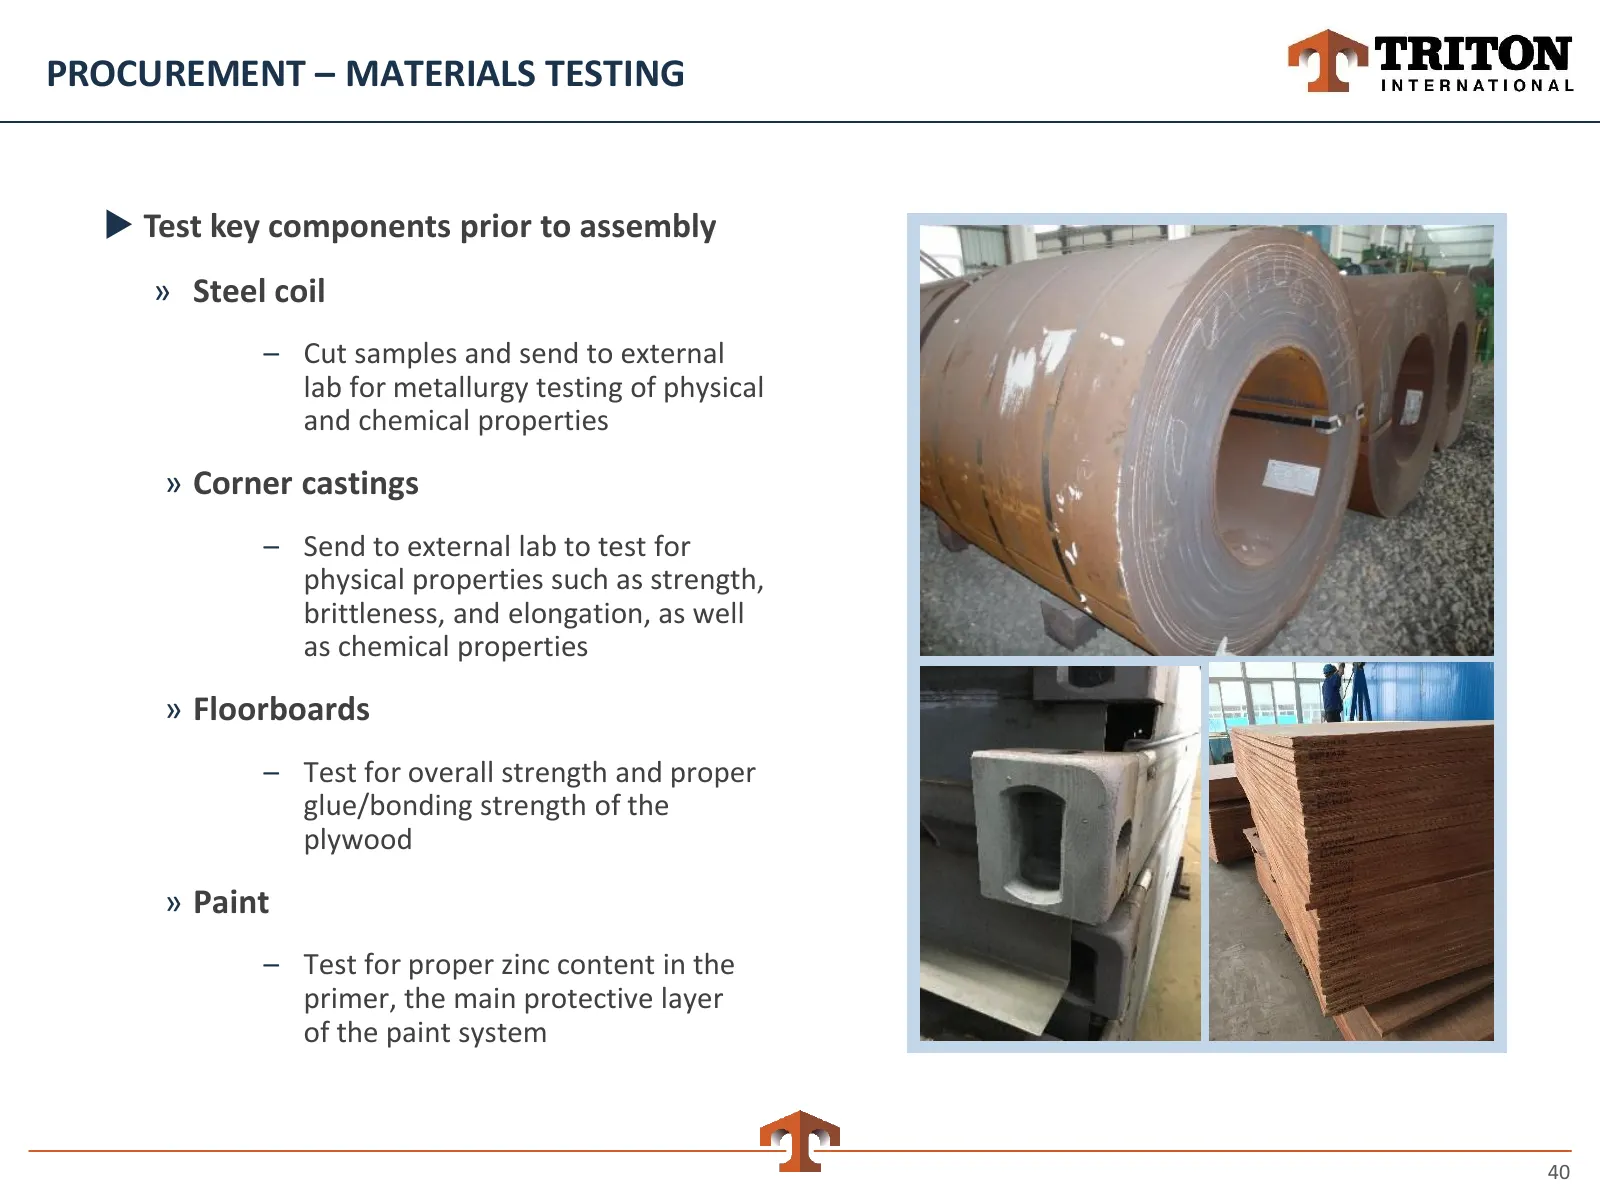
Slide 40: Procurement – Materials Testing
PROCUREMENT – MATERIALS TESTING Test key components prior to assembly » Steel coil – Cut samples and send to external lab for metallurgy testing of physical and chemical properties » Corner castings – Send to external lab to test for physical properties such as strength, brittleness, and elongatio
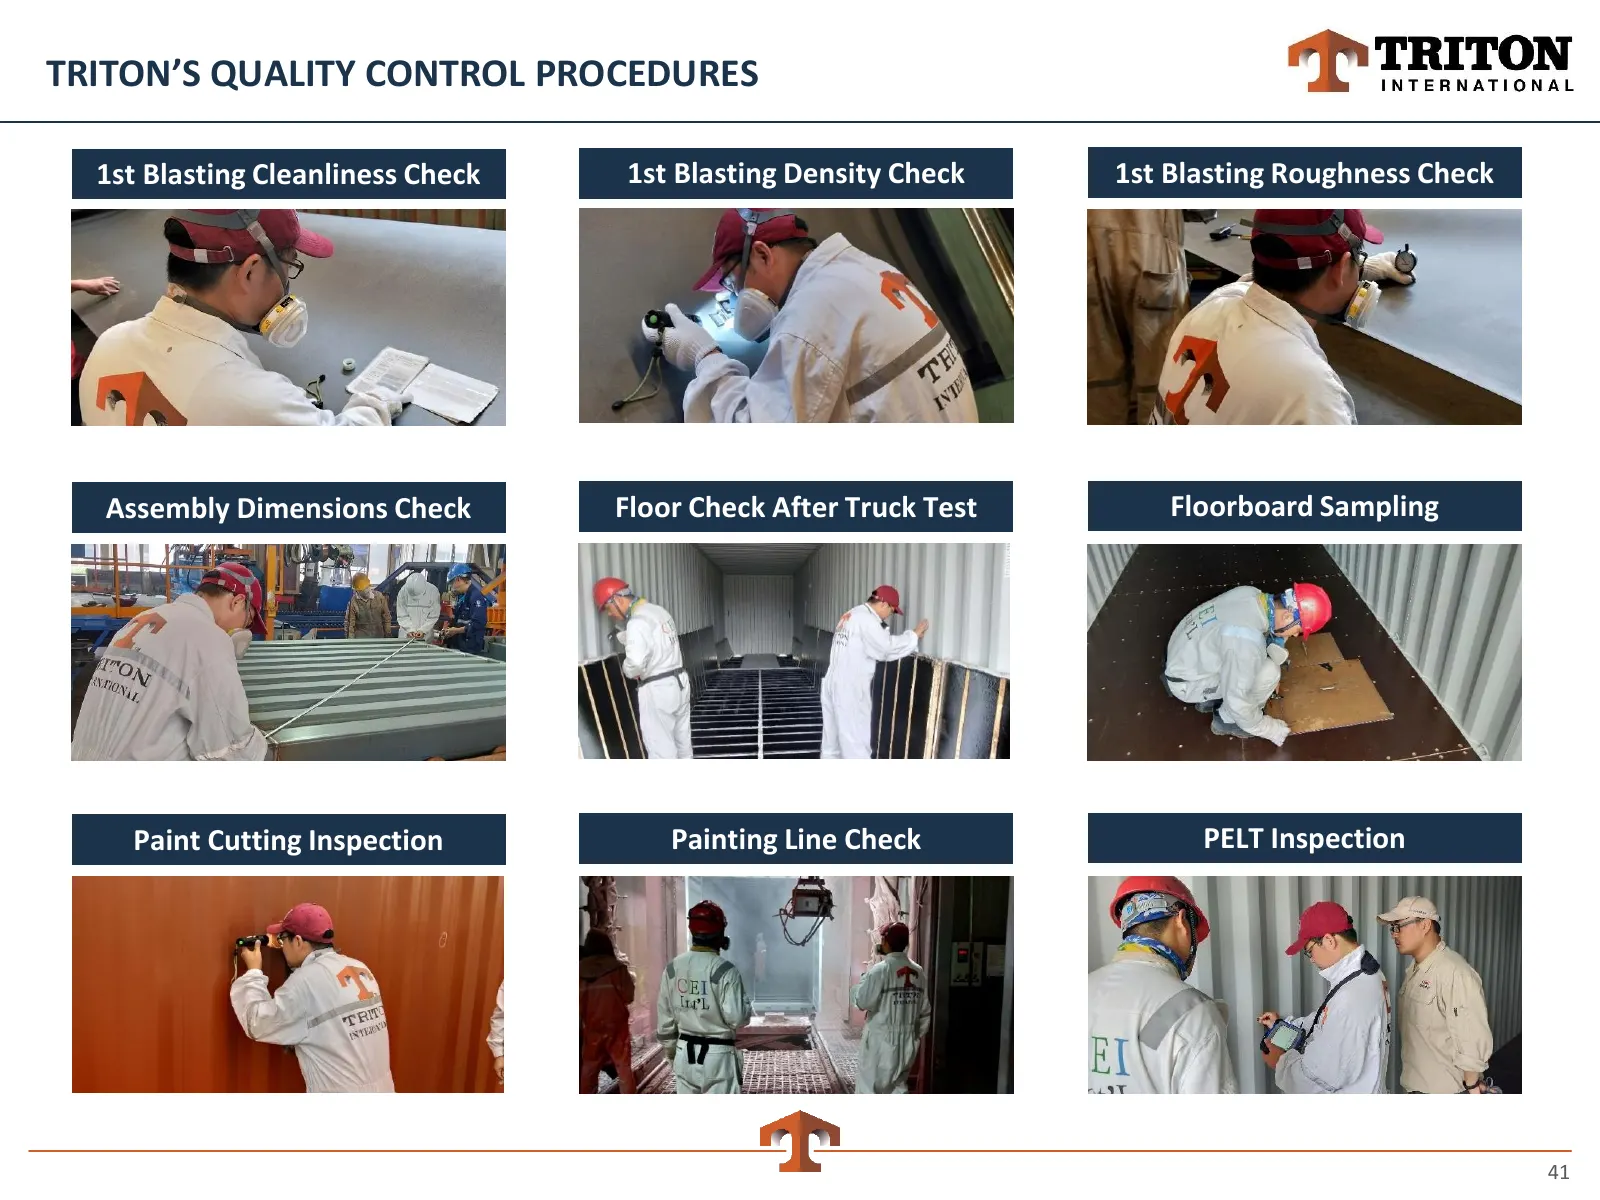
Slide 41: Triton's Quality Control Procedures
TRITON’S QUALITY CONTROL PROCEDURES 1st Blasting Cleanliness Check 1st Blasting Density Check 1st Blasting Roughness Check Assembly Dimensions Check Floor Check After Truck Test Floorboard Sampling Paint Cutting Inspection Painting Line Check PELT Inspection 41
Slide 42: Triton Advantages
Triton Advantages Tt TRITON INTERNATIONAL
Slide 43: Triton Investment Advantages
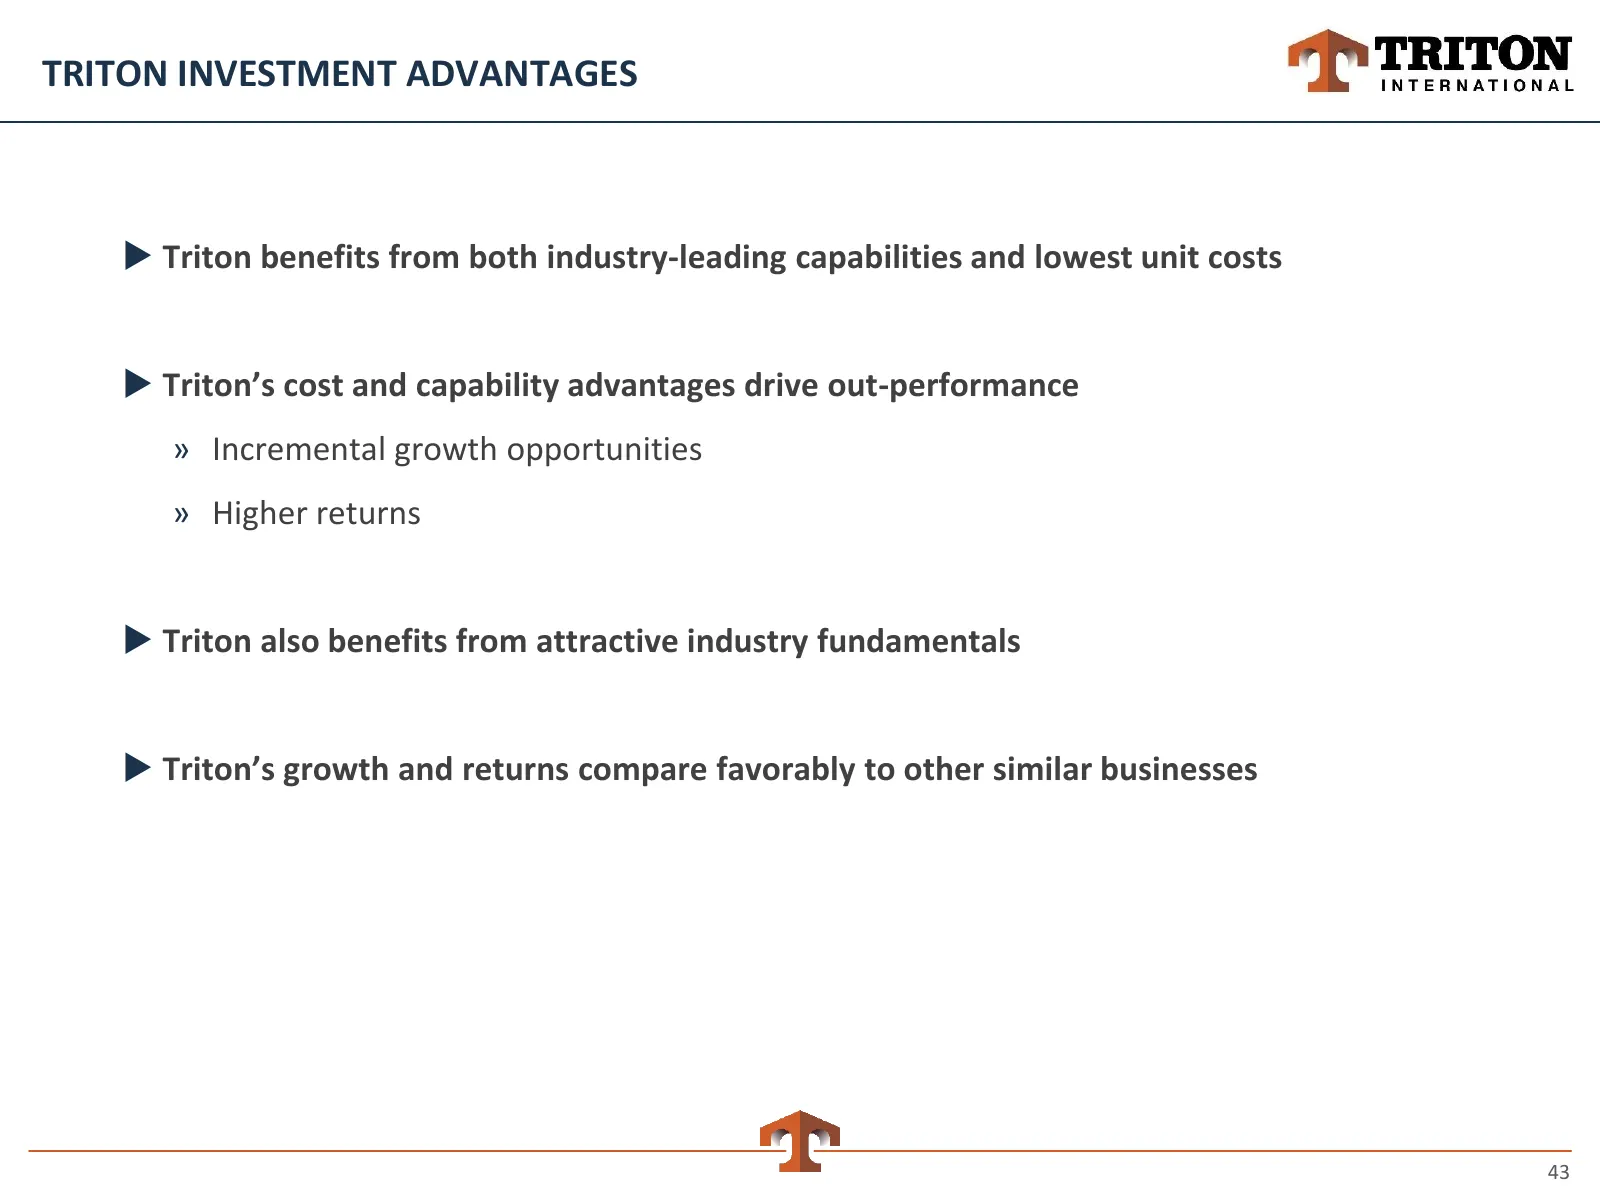
TRITON INVESTMENT ADVANTAGES Triton benefits from both industry-leading capabilities and lowest unit costs Triton’s cost and capability advantages drive out-performance » Incremental growth opportunities » Higher returns Triton also benefits from attractive industry fundamentals Triton’s gro
Slide 44: Multiple Drivers of Organic Growth
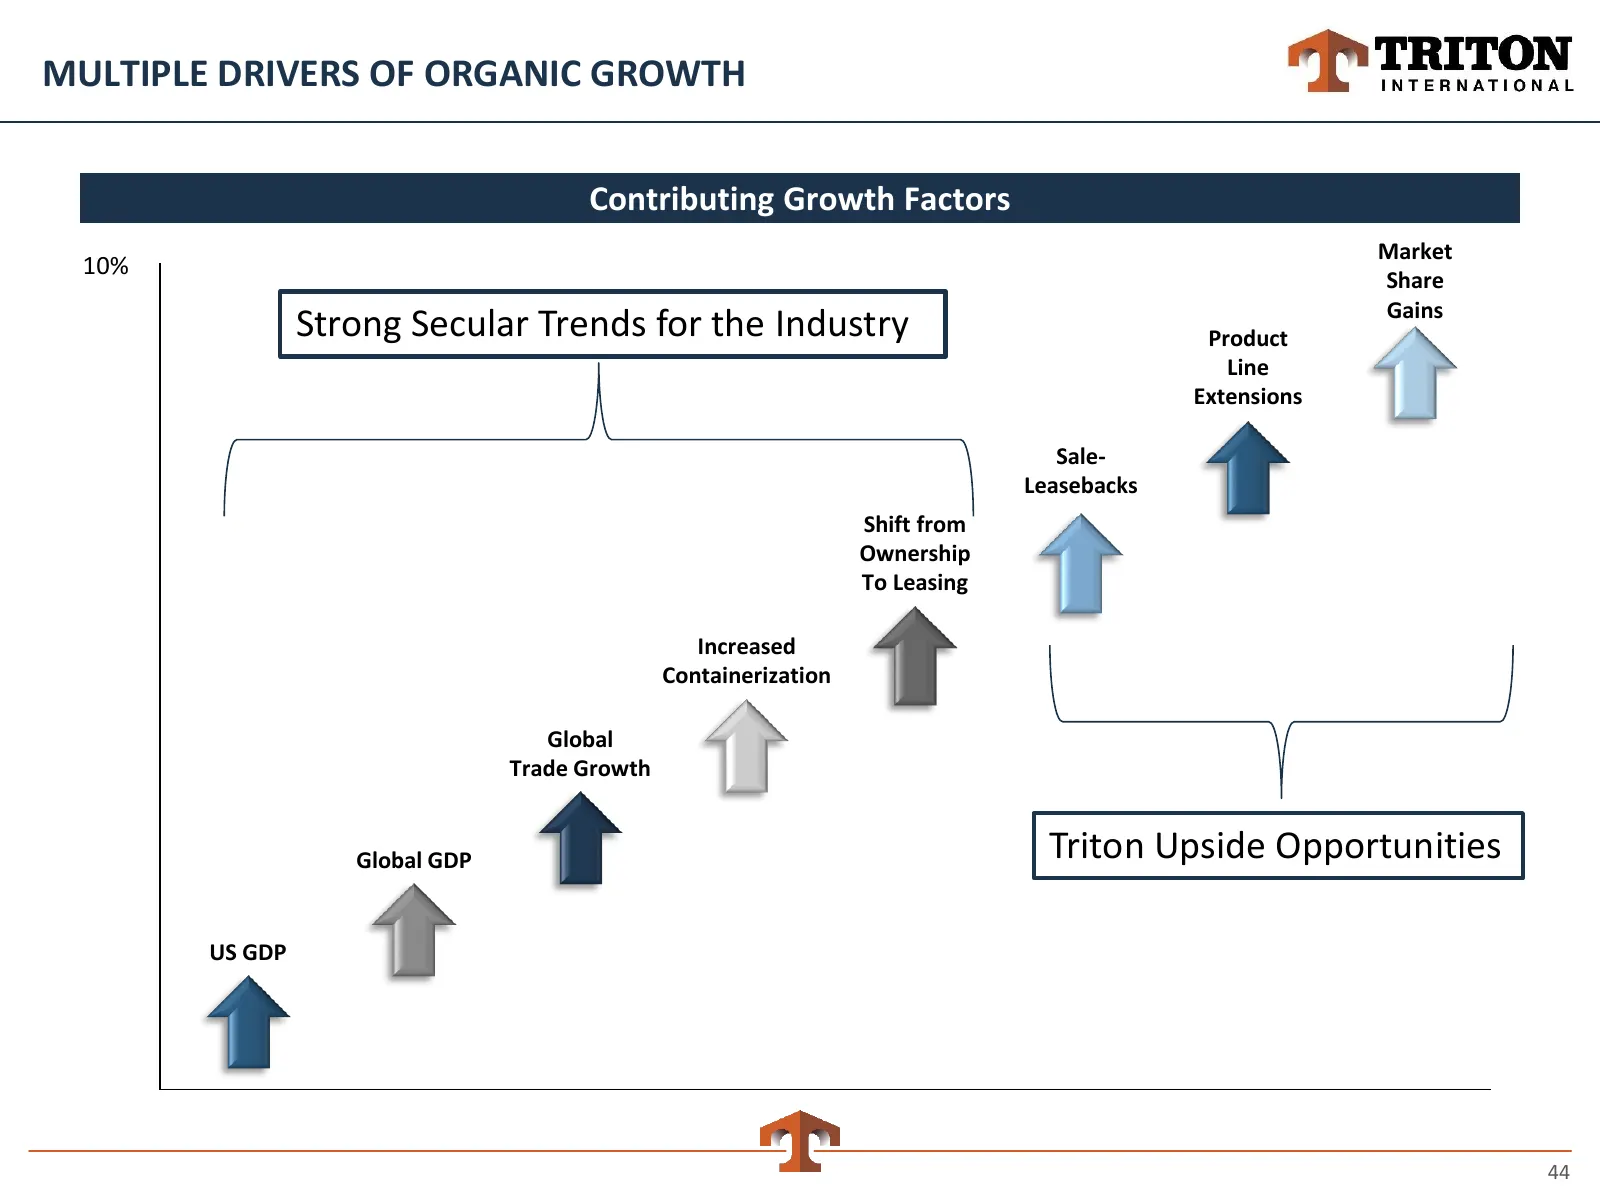
MULTIPLE DRIVERS OF ORGANIC GROWTH Contributing Growth Factors Market 10% Share Gains Strong Secular Trends for the Industry Product Line Extensions Sale- Leasebacks Shift from Ownership To Leasing Increased Containerization Global Trade Growth Global GDP Triton Upside Opportunities US GDP 44
Slide 45: Most Capable Global Infrastructure at the Lowest Unit Cost
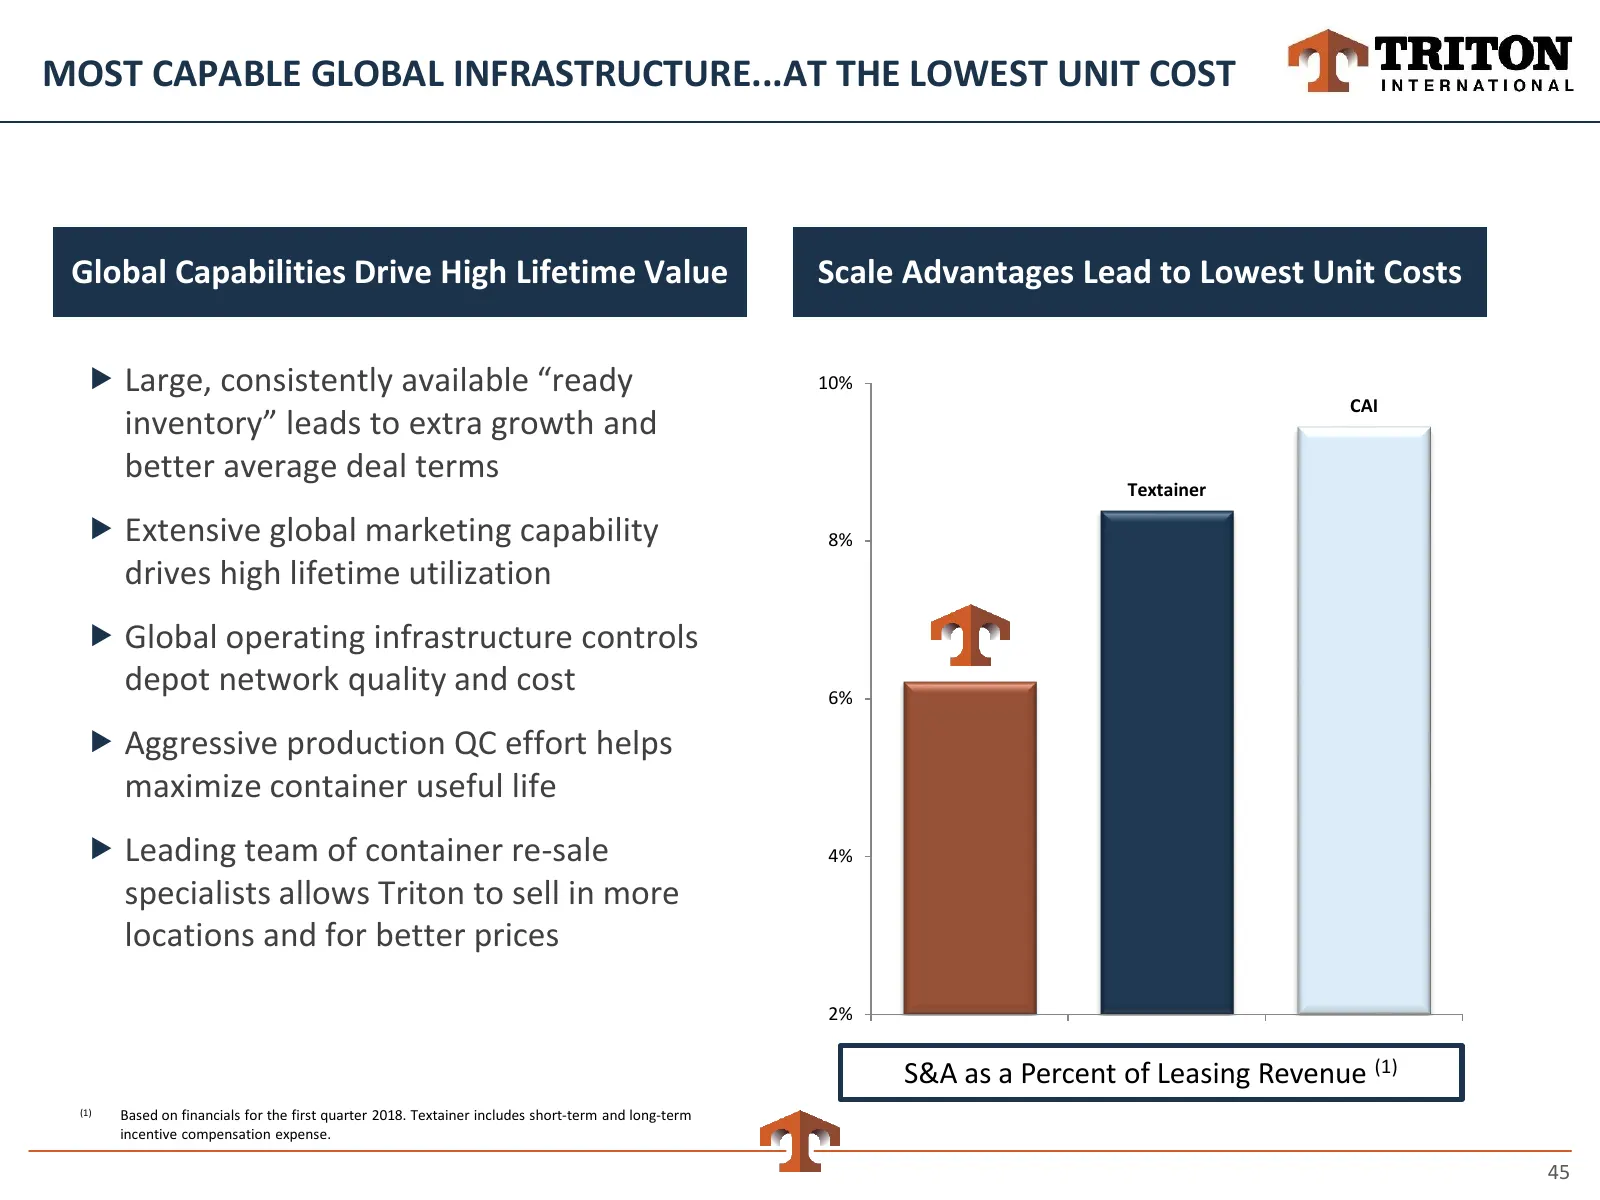
MOST CAPABLE GLOBAL INFRASTRUCTURE...AT THE LOWEST UNIT COST Global Capabilities Drive High Lifetime Value Scale Advantages Lead to Lowest Unit Costs Large, consistently available “ready 10% CAI inventory” leads to extra growth and better average deal terms Textainer Extensive global marketing c
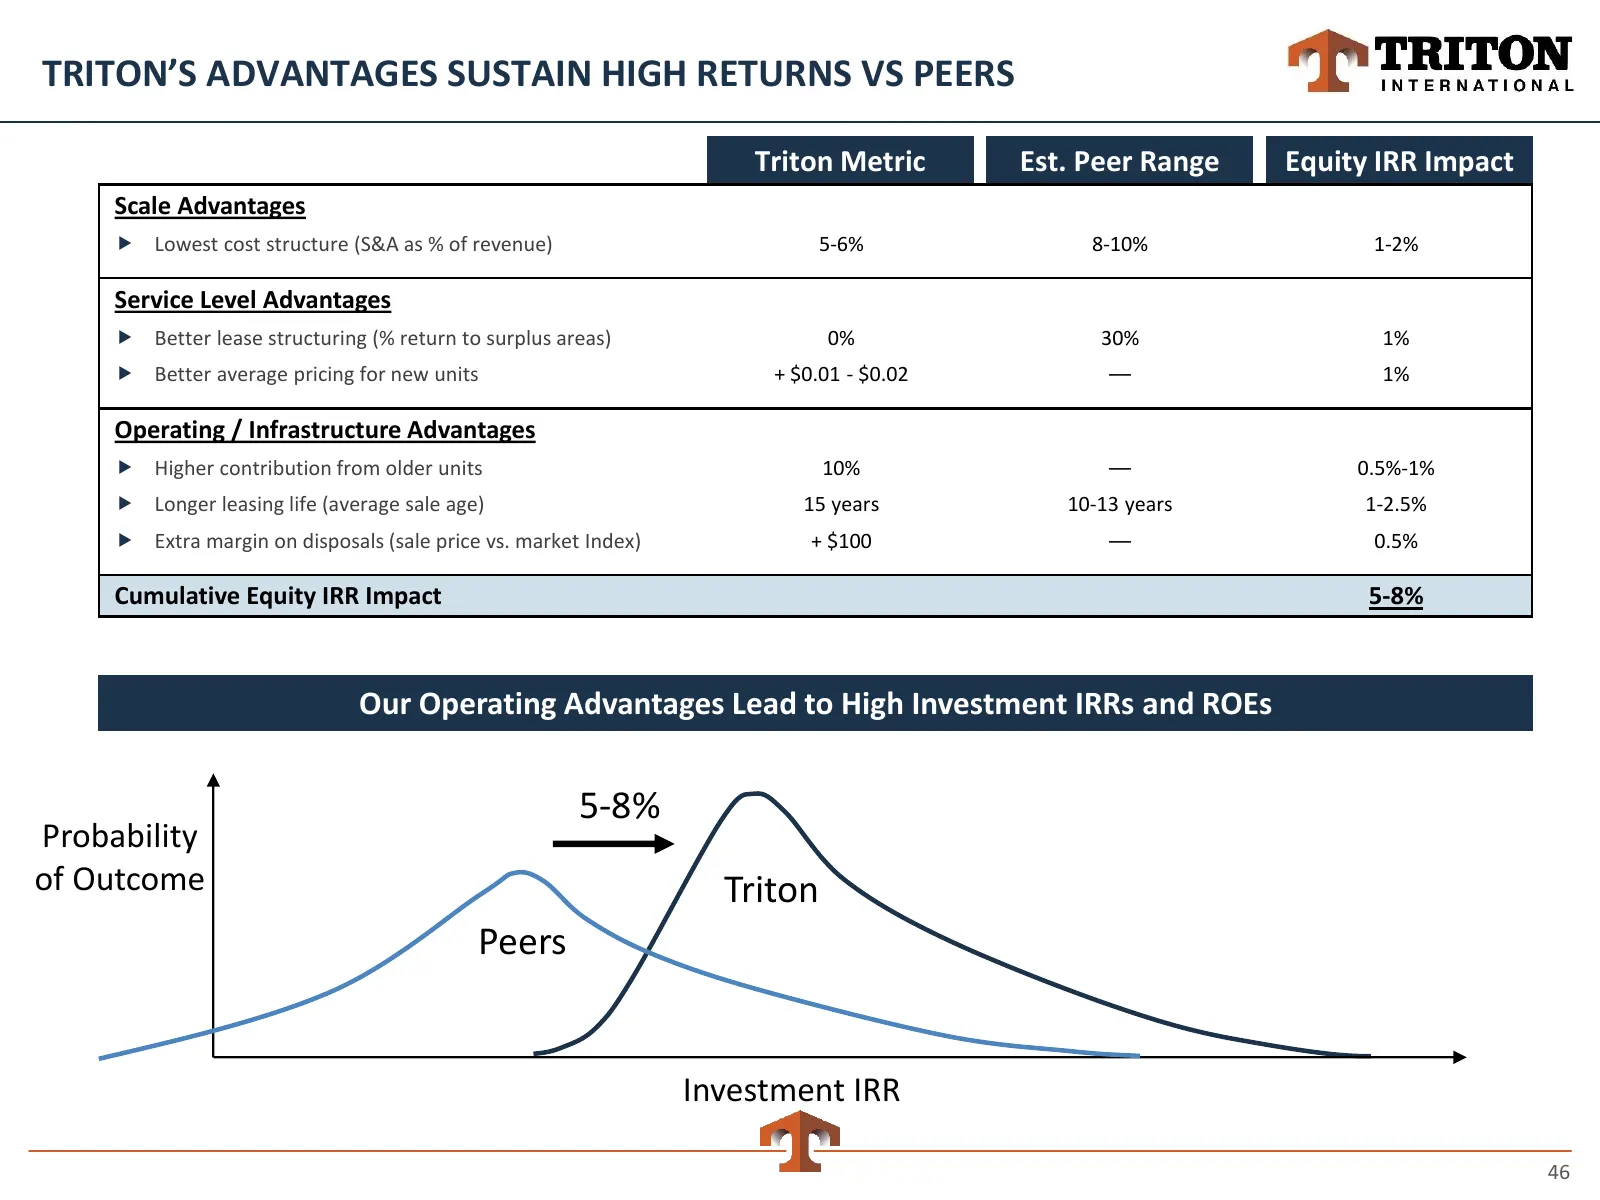
Slide 46: Triton's Advantages Sustain High Returns vs Peers
TRITON’S ADVANTAGES SUSTAIN HIGH RETURNS VS PEERS Triton Metric Est. Peer Range Equity IRR Impact Scale Advantages Lowest cost structure (S&A as % of revenue) 5-6% 8-10% 1-2% Service Level Advantages Better lease structuring (% return to surplus areas) 0% 30% 1% Better average pricing for new
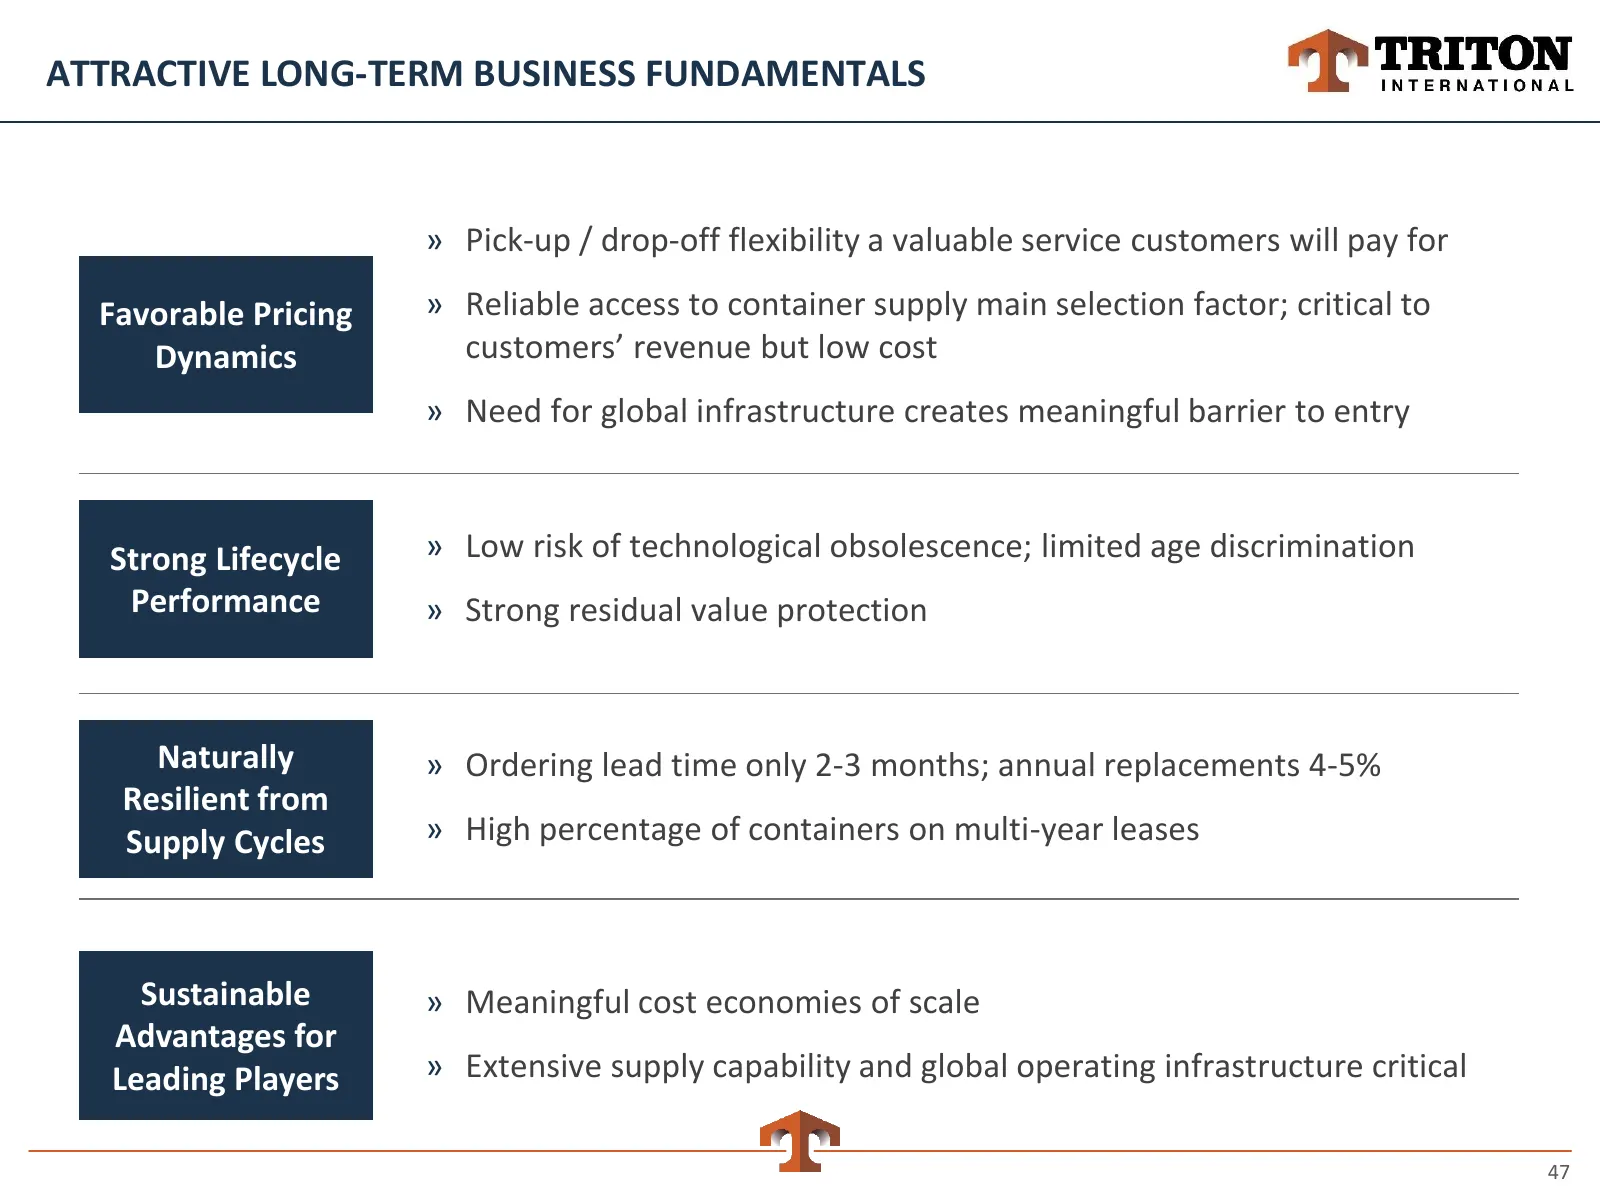
Slide 47: Attractive Long-Term Business Fundamentals
ATTRACTIVE LONG-TERM BUSINESS FUNDAMENTALS » Pick-up / drop-off flexibility a valuable service customers will pay for Favorable Pricing » Reliable access to container supply main selection factor; critical to Dynamics customers’ revenue but low cost » Need for global infrastructure creates meaningfu
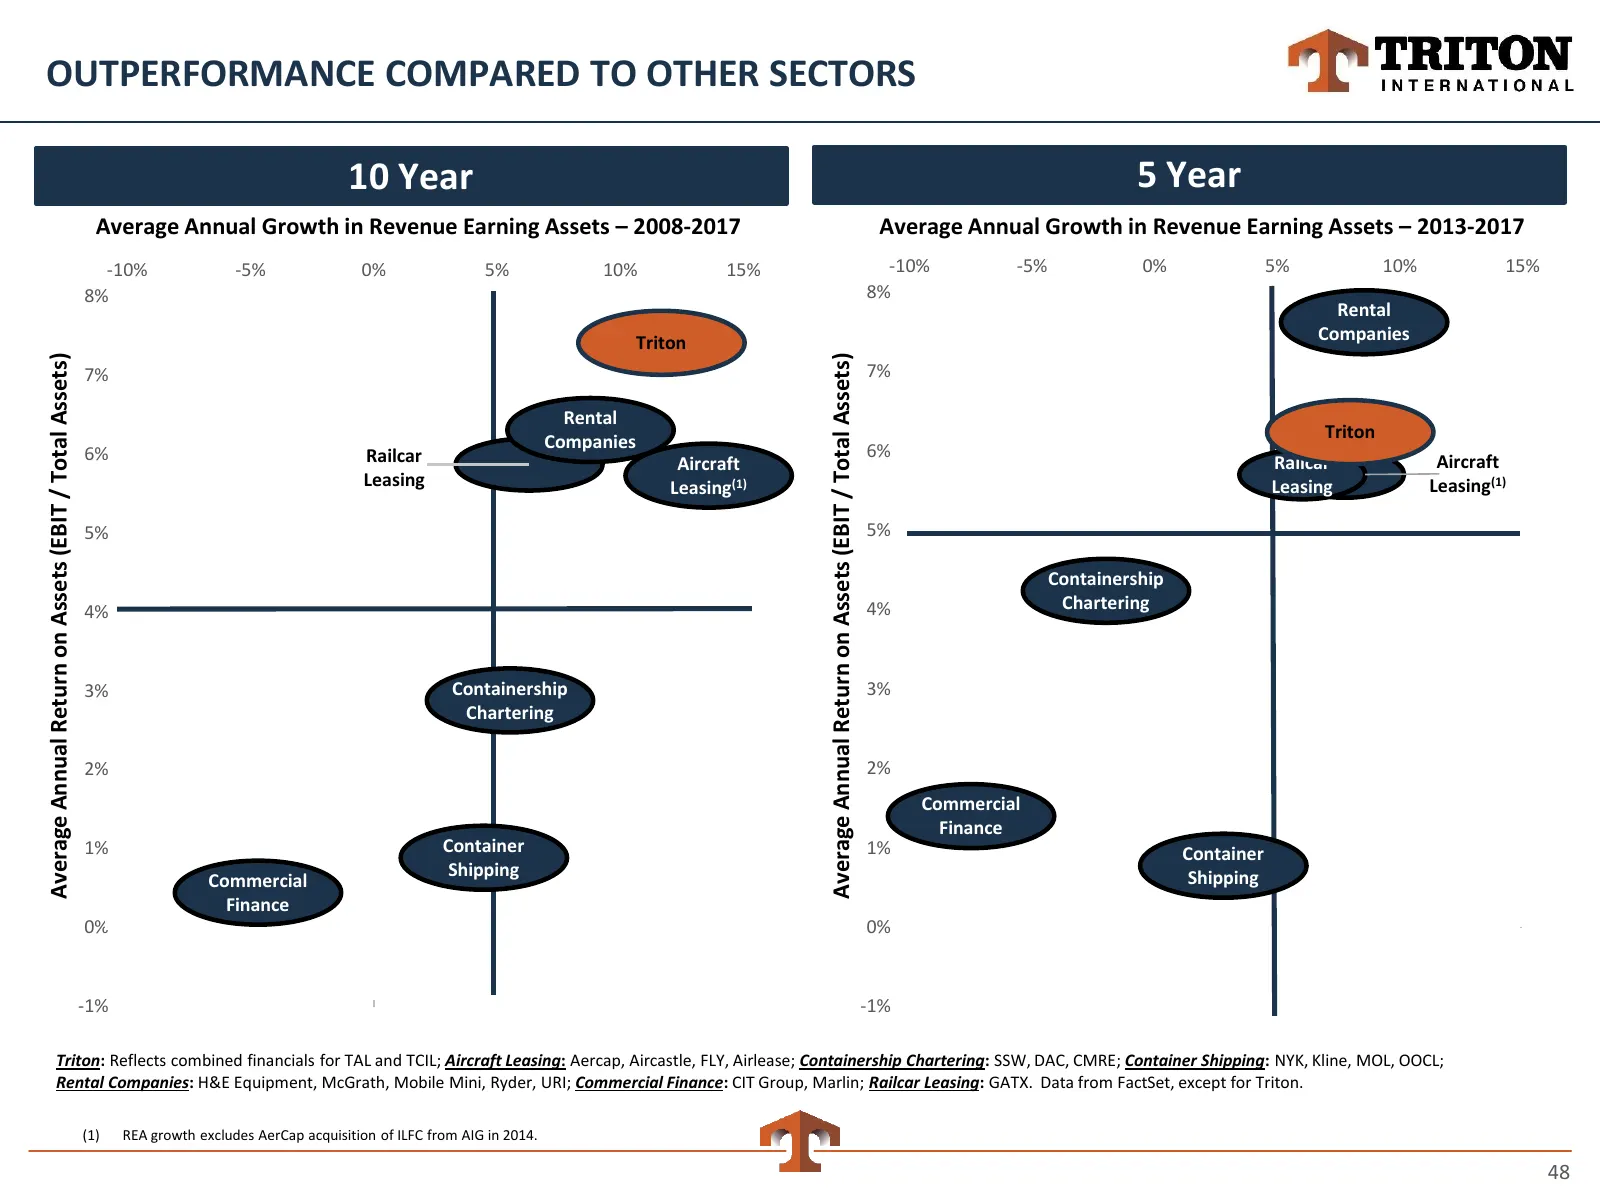
Slide 48: Outperformance Compared to Other Sectors
OUTPERFORMANCE COMPARED TO OTHER SECTORS 10 Year 5 Year Average Annual Growth in Revenue Earning Assets – 2008-2017 Average Annual Growth in Revenue Earning Assets – 2013-2017 -10% -5% 0% 5% 10% 15% -10% -5% 0% 5% 10% 15% 8% 8% Rental Triton Companies Average Annual Return on Assets (EBIT / Total As
Slide 49: Financial Performance Overview
Financial Performance Overview 49
Slide 50: Financial Performance Overview
FINANCIAL PERFORMANCE OVERVIEW All of our product lines are performing well » Key metrics strong » Trends positive Triton’s current financial performance strong » Rapid sequential growth in profitability since Q3 2016 » Generating attractive return on investment Strong and stable cash flow dri
Slide 51: Triton's Financial Performance Back on Track
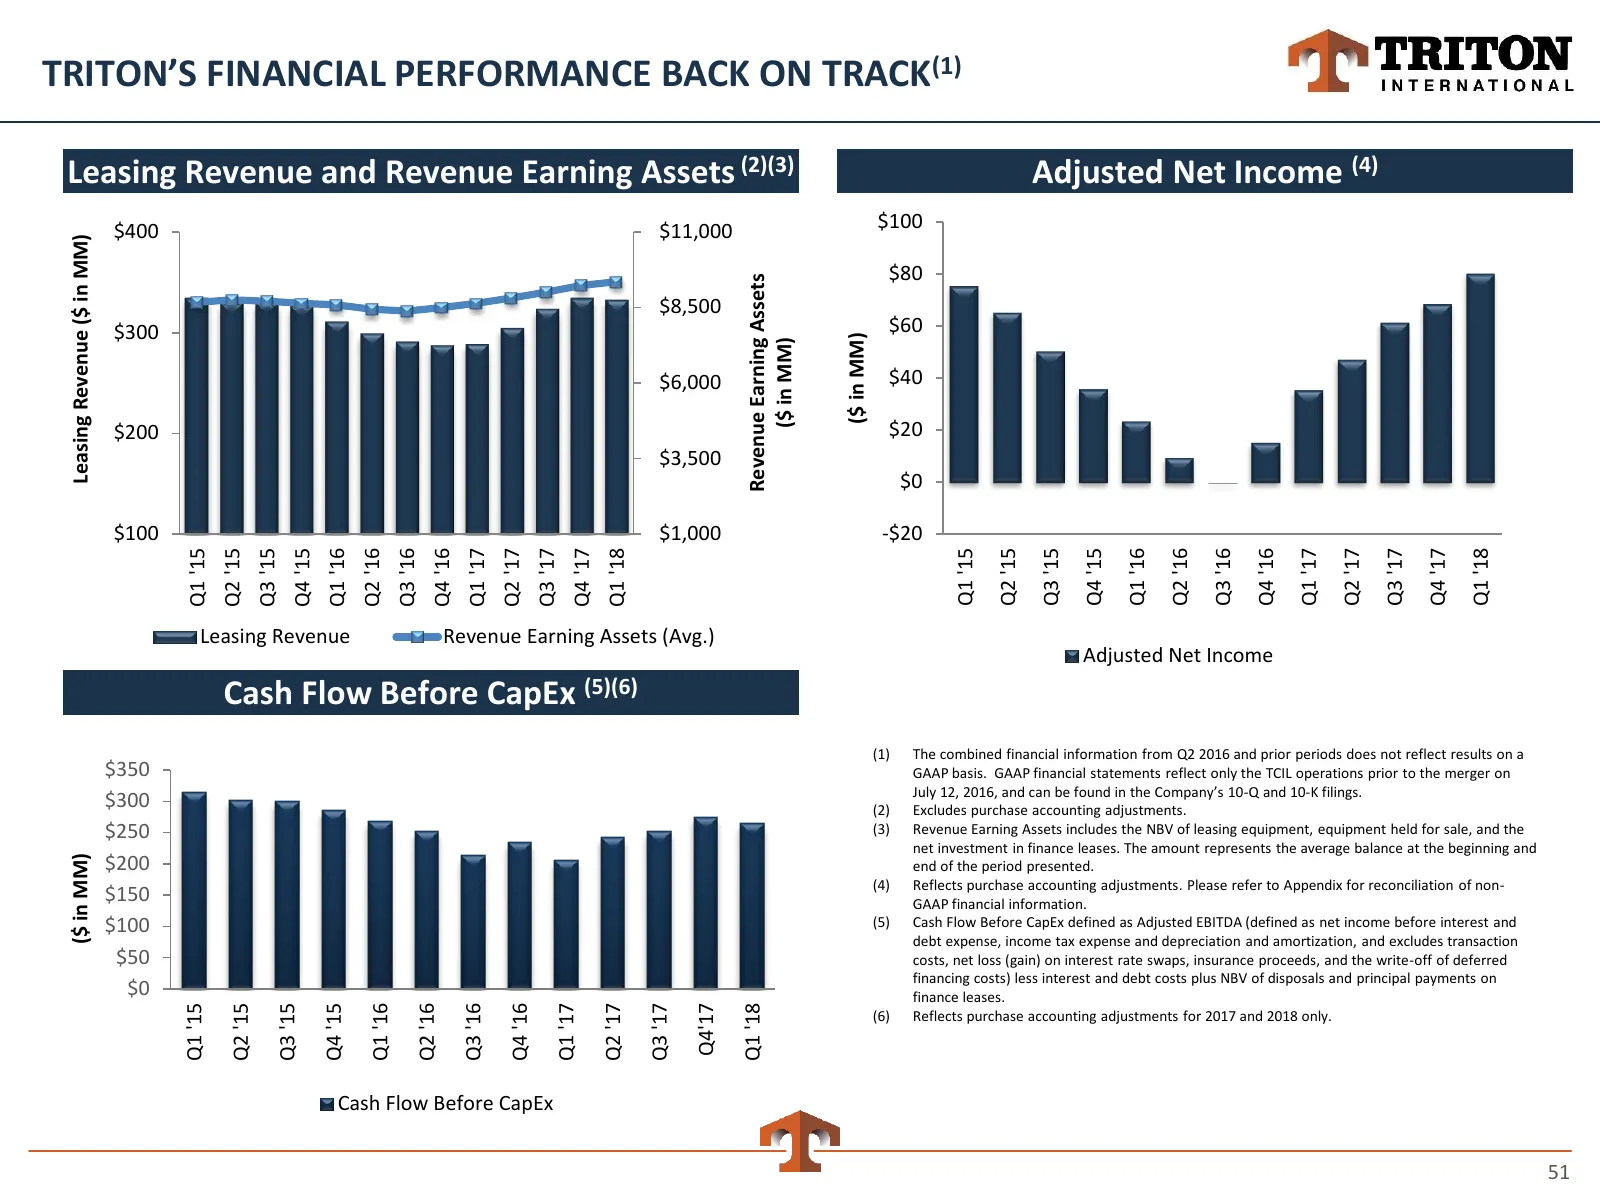
TRITON’S FINANCIAL PERFORMANCE BACK ON TRACK(1) Leasing Revenue and Revenue Earning Assets (2)(3) Adjusted Net Income (4) $400 $11,000 $100 Leasing Revenue ($ in MM) $80 Revenue Earning Assets $8,500 $300 $60 ($ in MM) ($ in MM) $6,000 $40 $200 $20 $3,500 $0 $100 $1,000 -$20 Q4 '15 Q1 '18 Q1 '15 Q2
Slide 52: Strong, Stable Operating Cash Flow Drives Long-Term Value
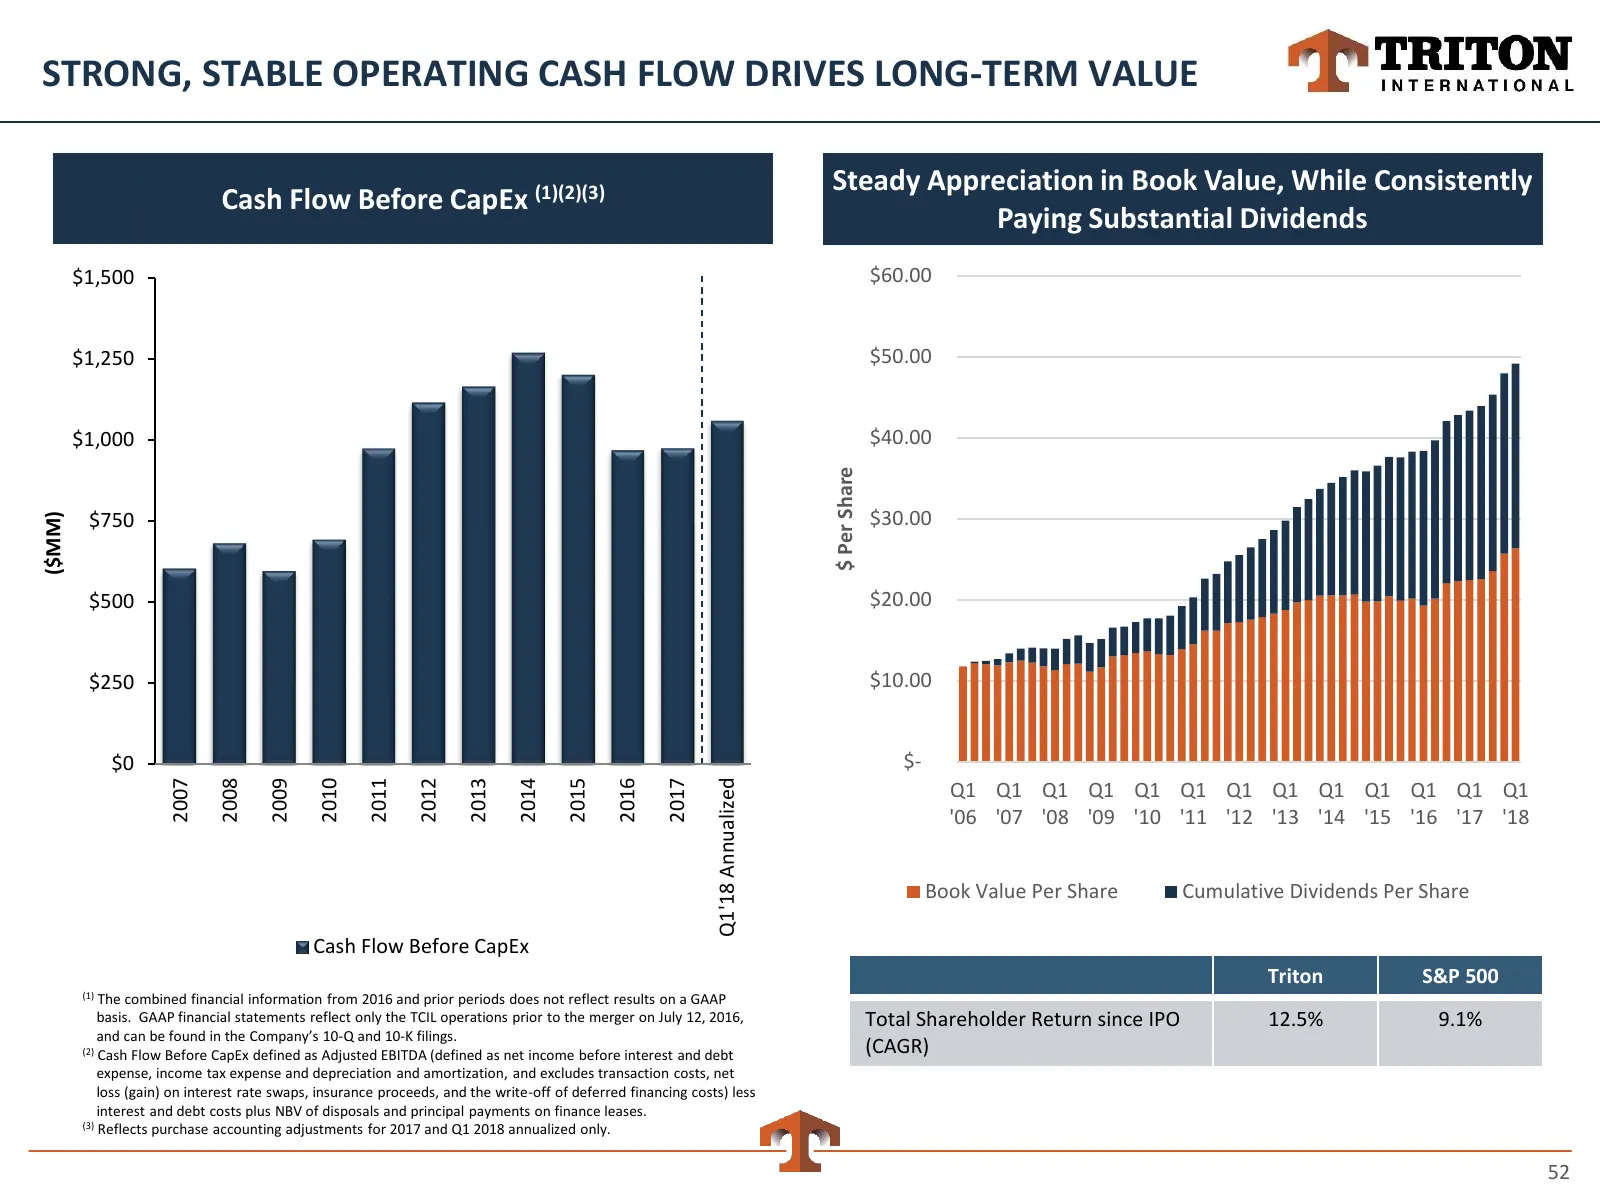
STRONG, STABLE OPERATING CASH FLOW DRIVES LONG-TERM VALUE Steady Appreciation in Book Value, While Consistently Cash Flow Before CapEx (1)(2)(3) Paying Substantial Dividends $1,500 $60.00 $1,250 $50.00 $1,000 $40.00 $ Per Share $750 $30.00 ($MM) $500 $20.00 $250 $10.00 $0 $- 2010 2007 2008 2009 2011
Slide 53: Short Order Cycle Provides Financial Stability and Market Resilience
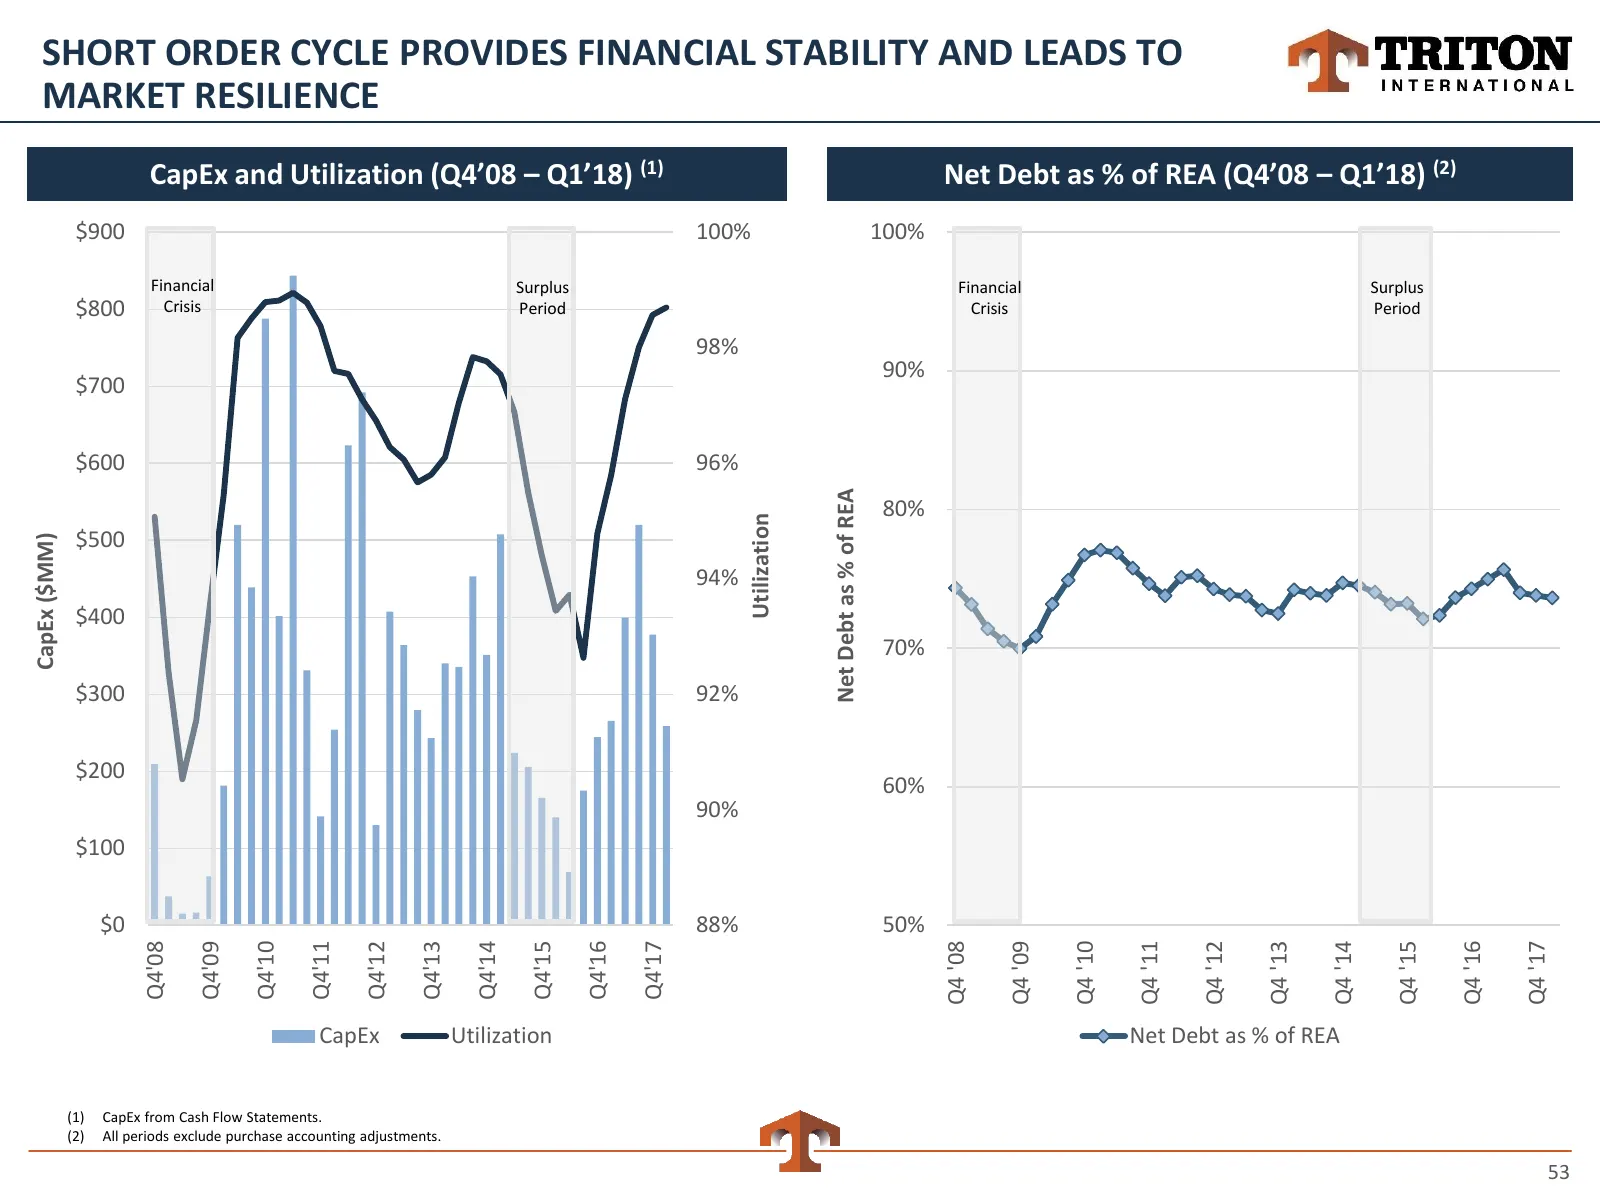
SHORT ORDER CYCLE PROVIDES FINANCIAL STABILITY AND LEADS TO MARKET RESILIENCE CapEx and Utilization (Q4’08 – Q1’18) (1) Net Debt as % of REA (Q4’08 – Q1’18) (2) $900 100% 100% Financial Surplus Financial Surplus $800 Crisis Period Crisis Period 98% 90% $700 $600 96% Net Debt as % of REA 80% Utilizat
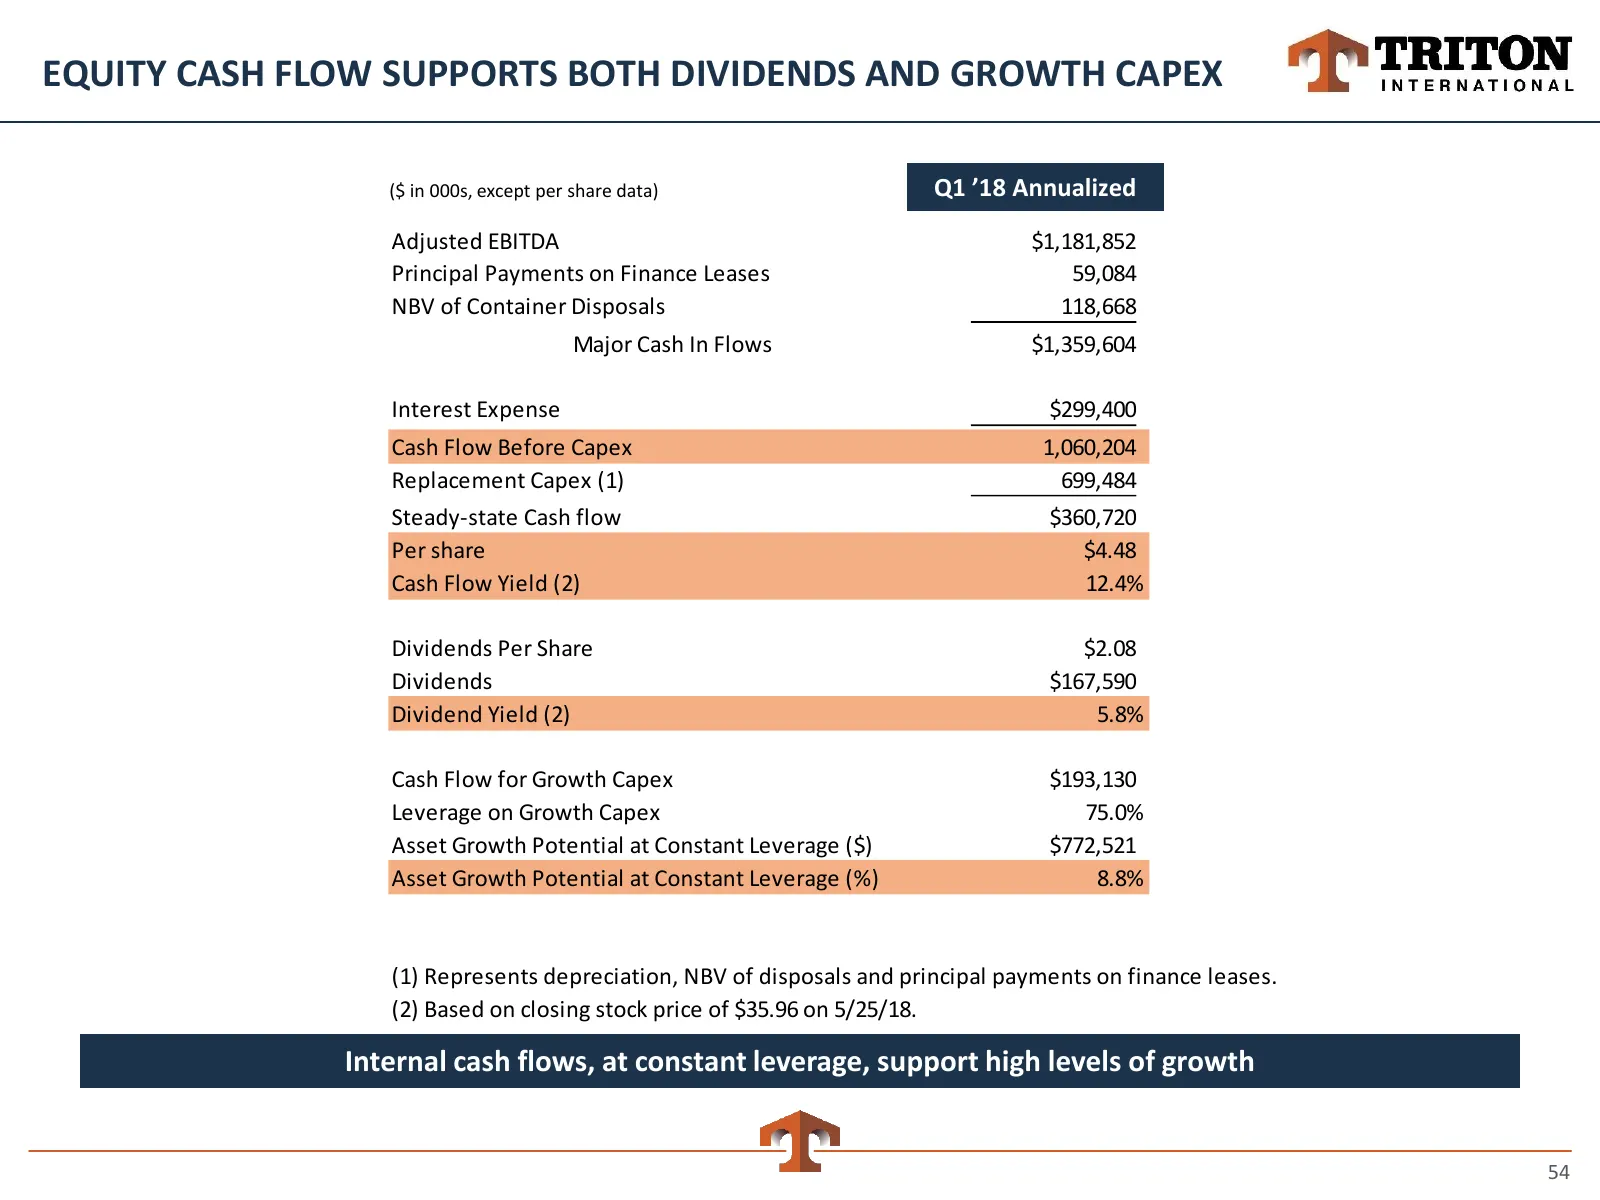
Slide 54: Equity Cash Flow Supports Both Dividends and Growth Capex
EQUITY CASH FLOW SUPPORTS BOTH DIVIDENDS AND GROWTH CAPEX ($ in 000s, except per share data) Q1 ’18 Annualized Adjusted EBITDA $1,181,852 Principal Payments on Finance Leases 59,084 NBV of Container Disposals 118,668 Major Cash In Flows $1,359,604 Interest Expense $299,400 Cash Flow Before Capex 1,0
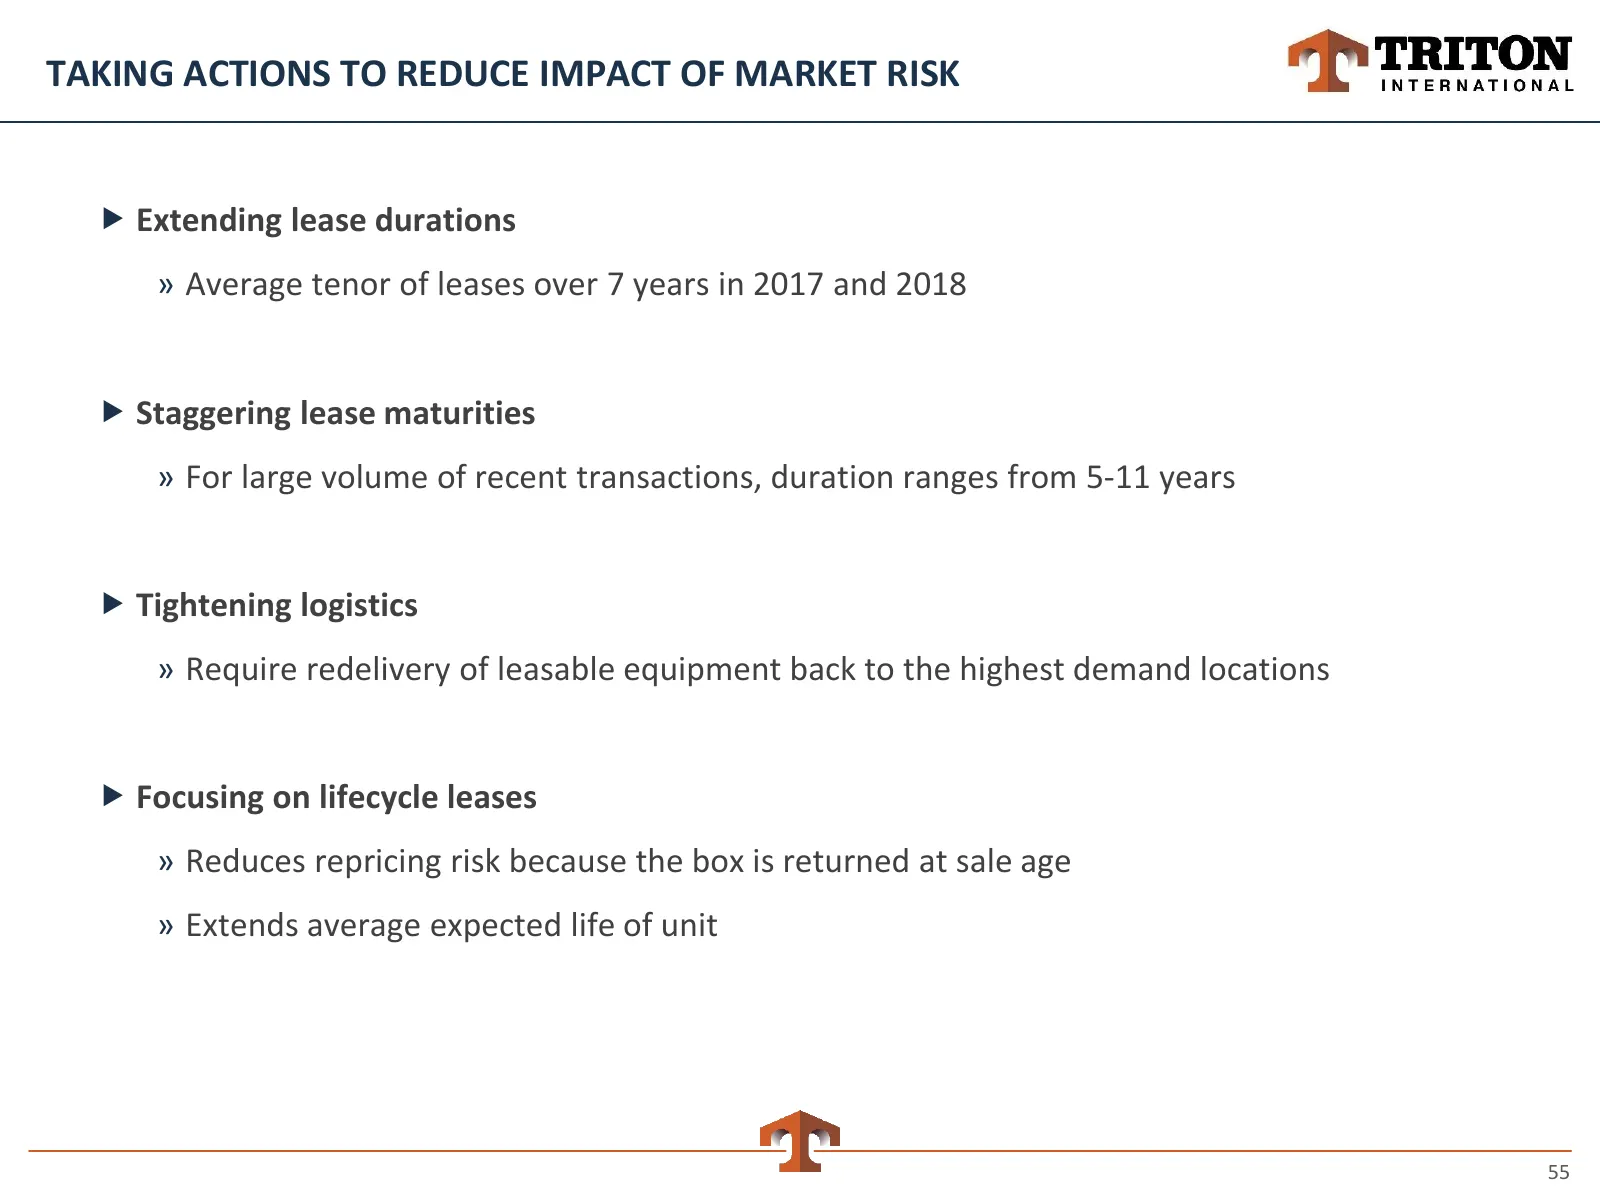
Slide 55: Taking Actions to Reduce Impact of Market Risk
TAKING ACTIONS TO REDUCE IMPACT OF MARKET RISK Extending lease durations » Average tenor of leases over 7 years in 2017 and 2018 Staggering lease maturities » For large volume of recent transactions, duration ranges from 5-11 years Tightening logistics » Require redelivery of leasable equipmen
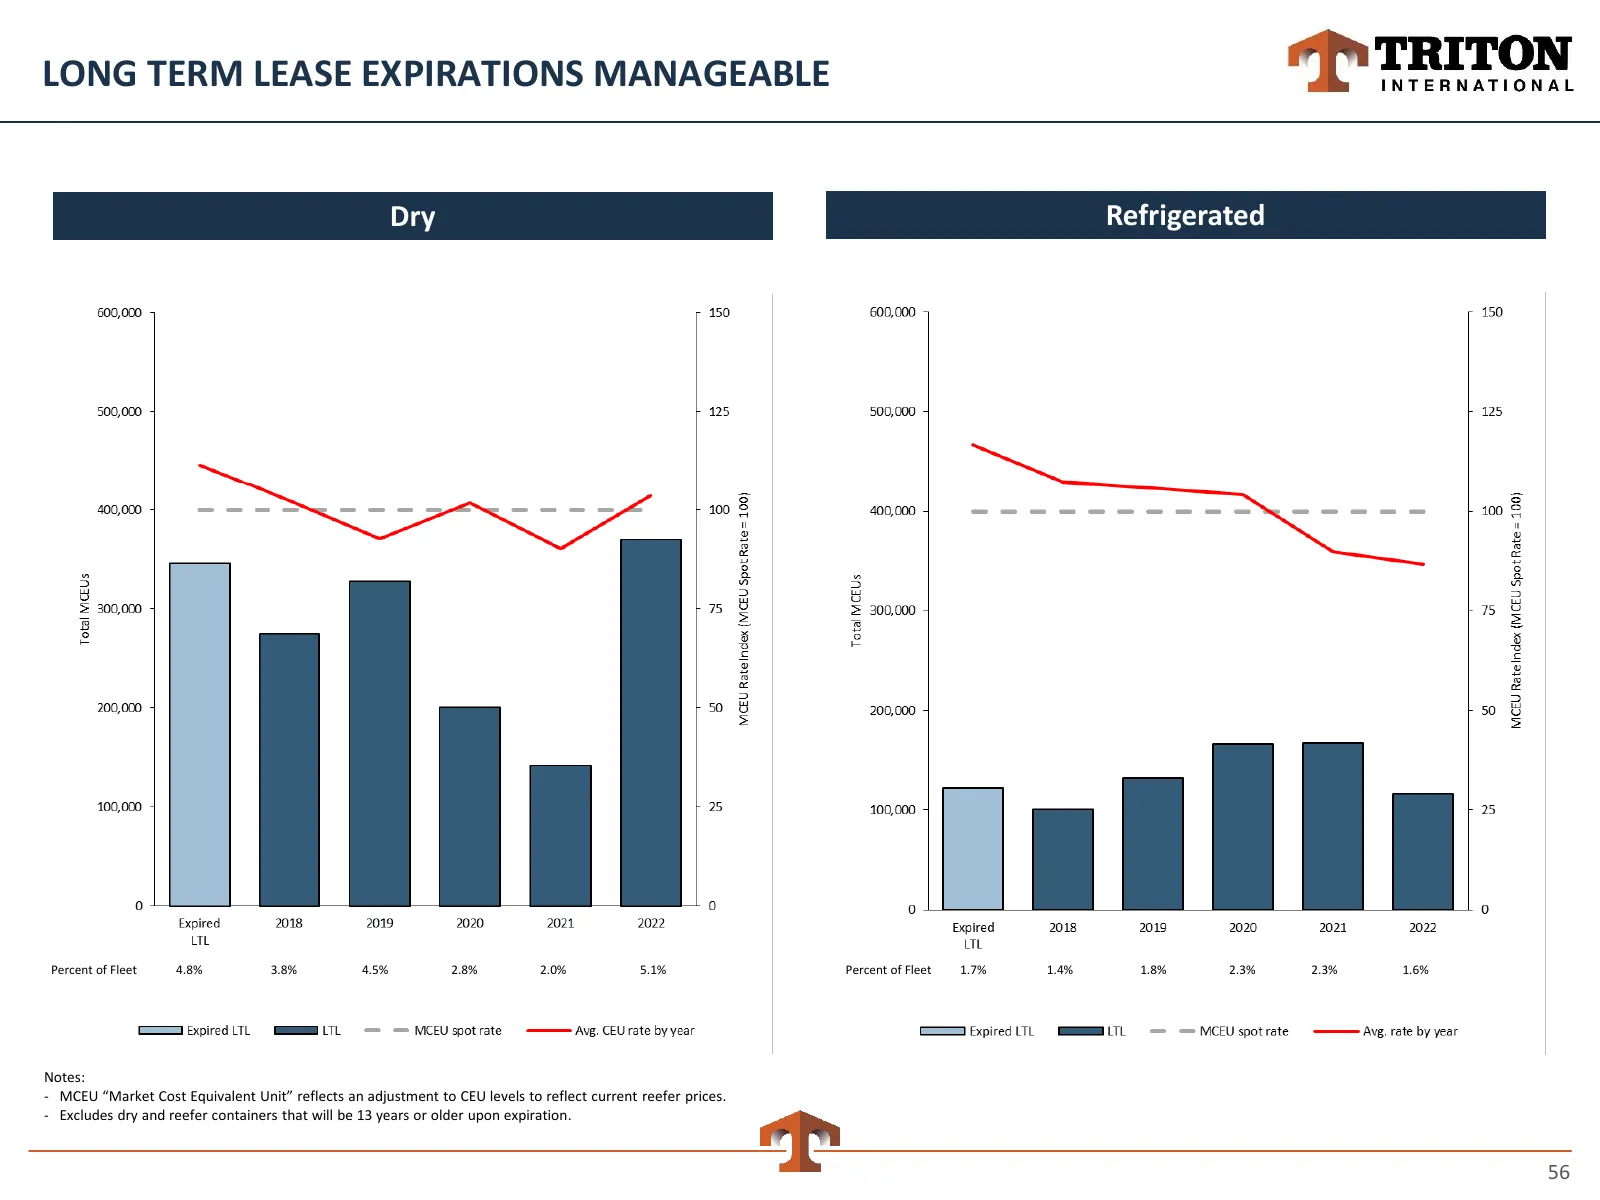
Slide 56: Long Term Lease Expirations Manageable
LONG TERM LEASE EXPIRATIONS MANAGEABLE Dry Refrigerated Percent of Fleet 4.8% 3.8% 4.5% 2.8% 2.0% 5.1% Percent of Fleet 1.7% 1.4% 1.8% 2.3% 2.3% 1.6% Notes: - MCEU “Market Cost Equivalent Unit” reflects an adjustment to CEU levels to reflect current reefer prices. - Excludes dry and reefer container
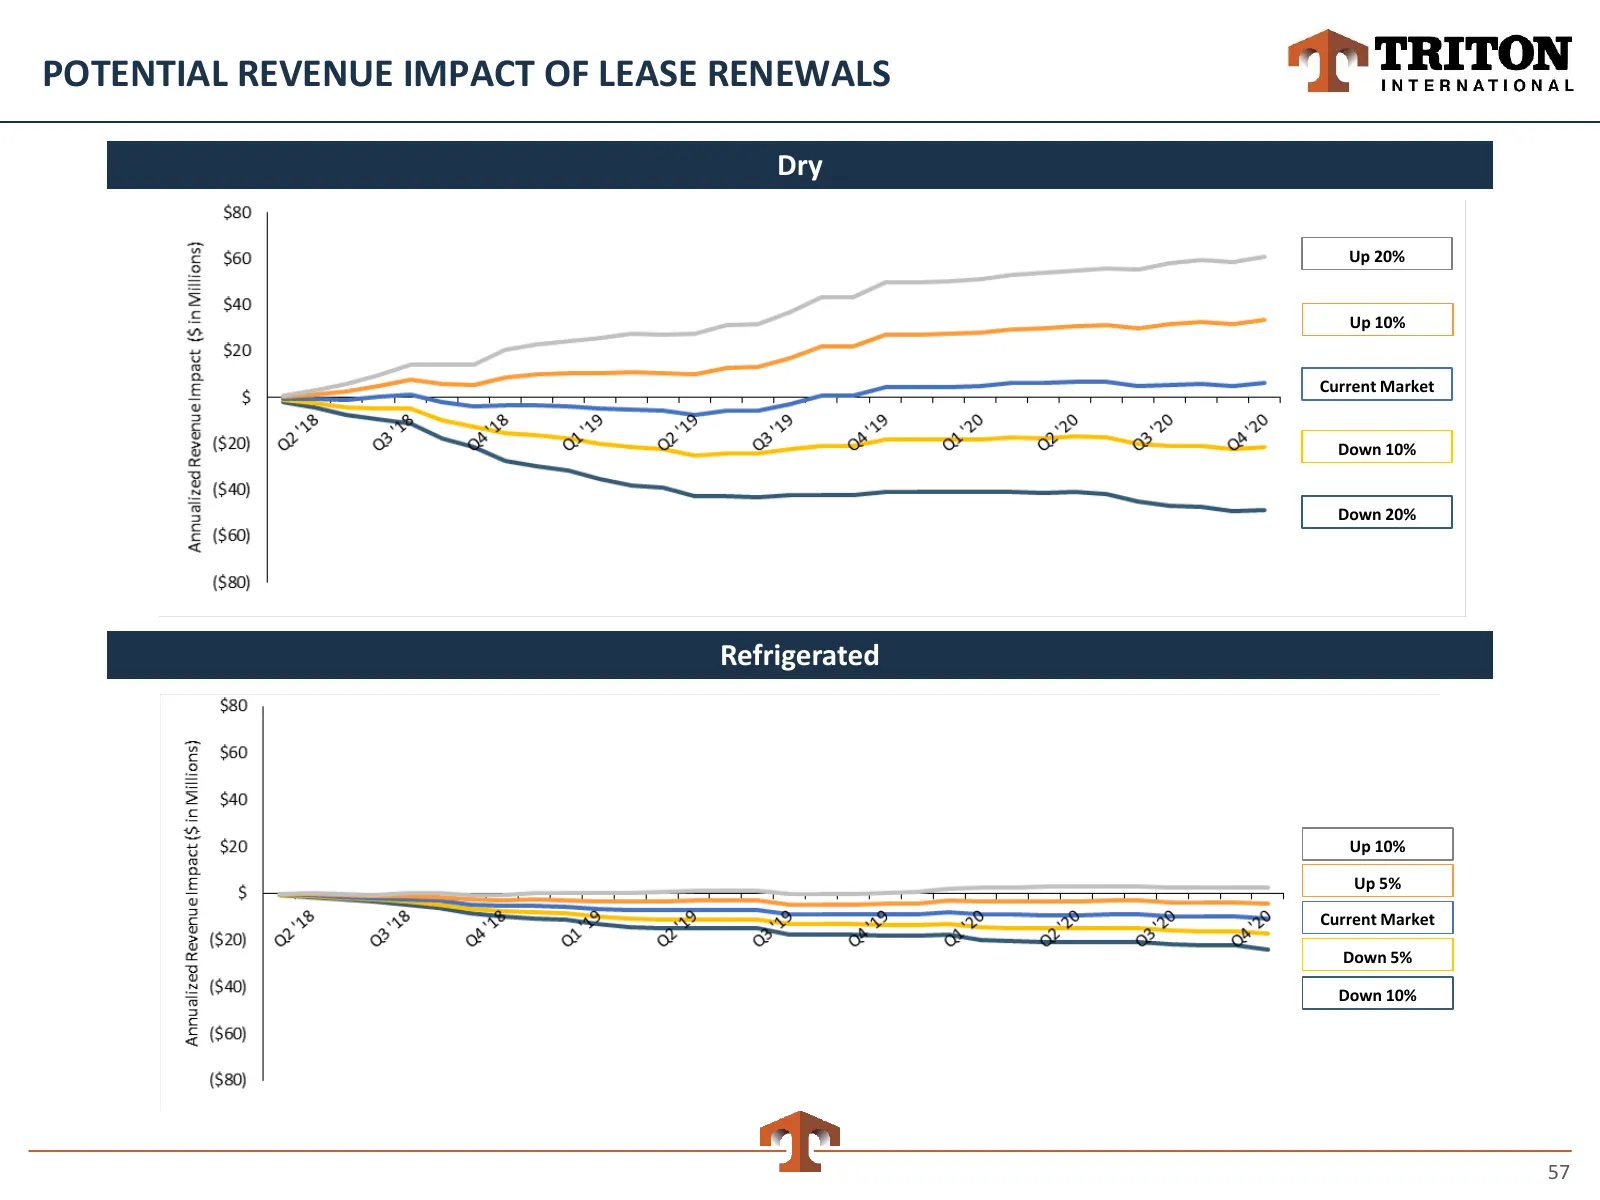
Slide 57: Potential Revenue Impact of Lease Renewals
POTENTIAL REVENUE IMPACT OF LEASE RENEWALS Dry Up 20% Up 10% Current Market Down 10% Down 20% Refrigerated Up 10% Up 5% Current Market Down 5% Down 10% 57
Slide 58: Near-Term Outlook and Key Earnings Drivers
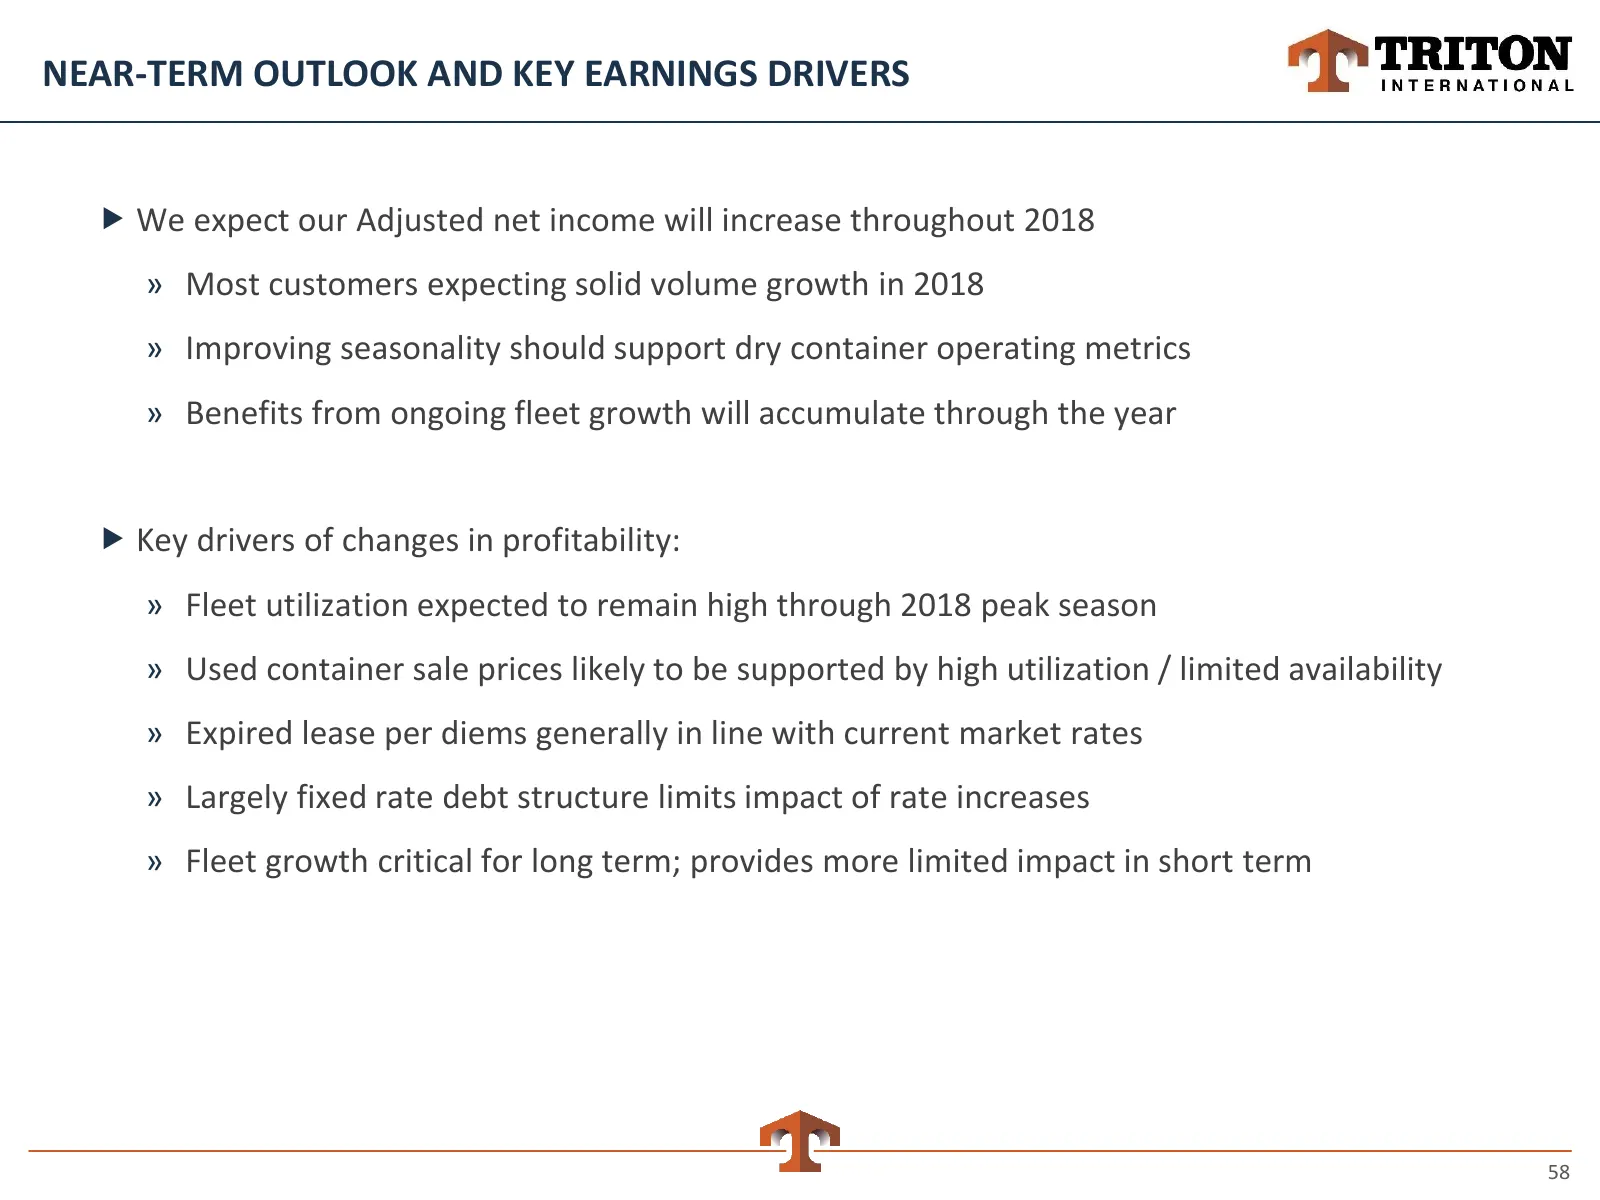
NEAR-TERM OUTLOOK AND KEY EARNINGS DRIVERS We expect our Adjusted net income will increase throughout 2018 » Most customers expecting solid volume growth in 2018 » Improving seasonality should support dry container operating metrics » Benefits from ongoing fleet growth will accumulate through the
Slide 59: Performance Targets
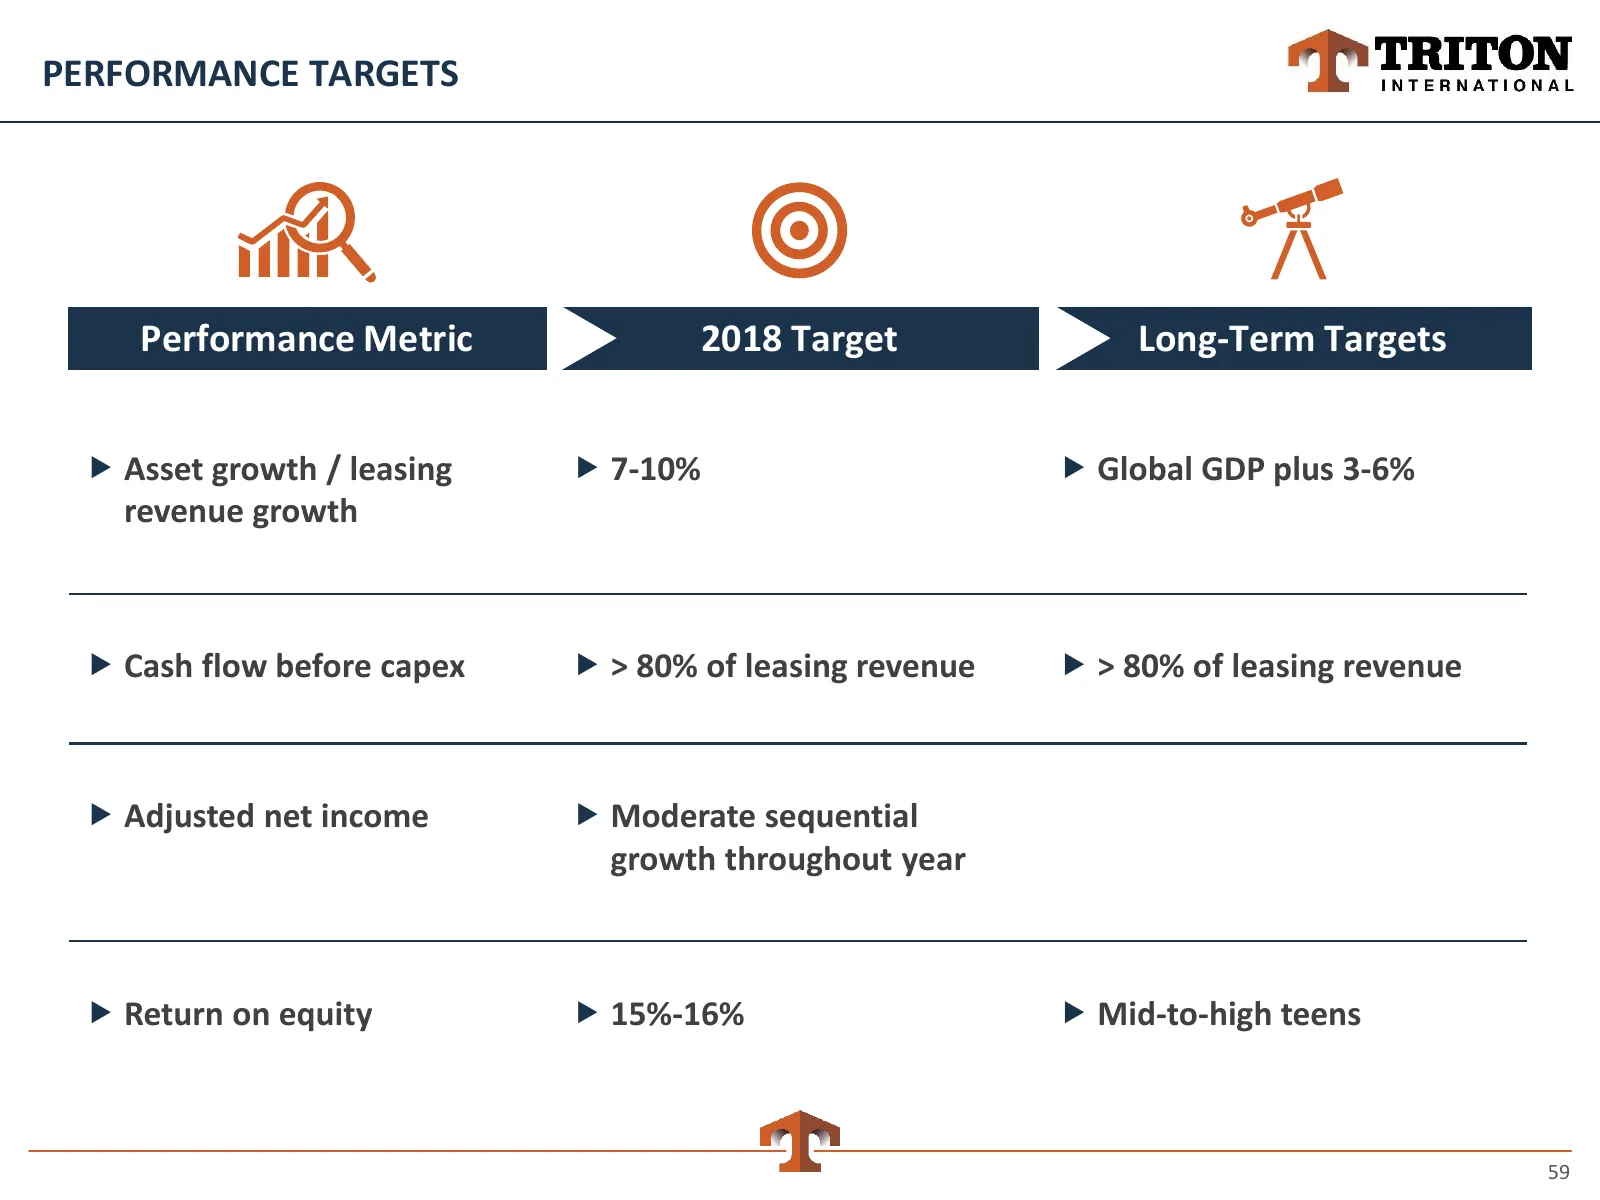
PERFORMANCE TARGETS Performance Metric 2018 Target Long-Term Targets Asset growth / leasing 7-10% Global GDP plus 3-6% revenue growth Cash flow before capex > 80% of leasing revenue > 80% of leasing revenue Adjusted net income Moderate sequential growth throughout year Return on eq
Slide 60: Capital Management
Capital Management ”) PY TRITON INTERNATIONAL
Slide 61: Capital Management
CAPITAL MANAGEMENT Triton’s strong and stable cash flow provides capital allocation flexibility Triton maintains a well protected capital structure » Moderate leverage » Minimal interest rate risk » Staggered debt maturities Triton has access to a variety of efficient funding channels and is e
Slide 62: Capital Allocation Priorities
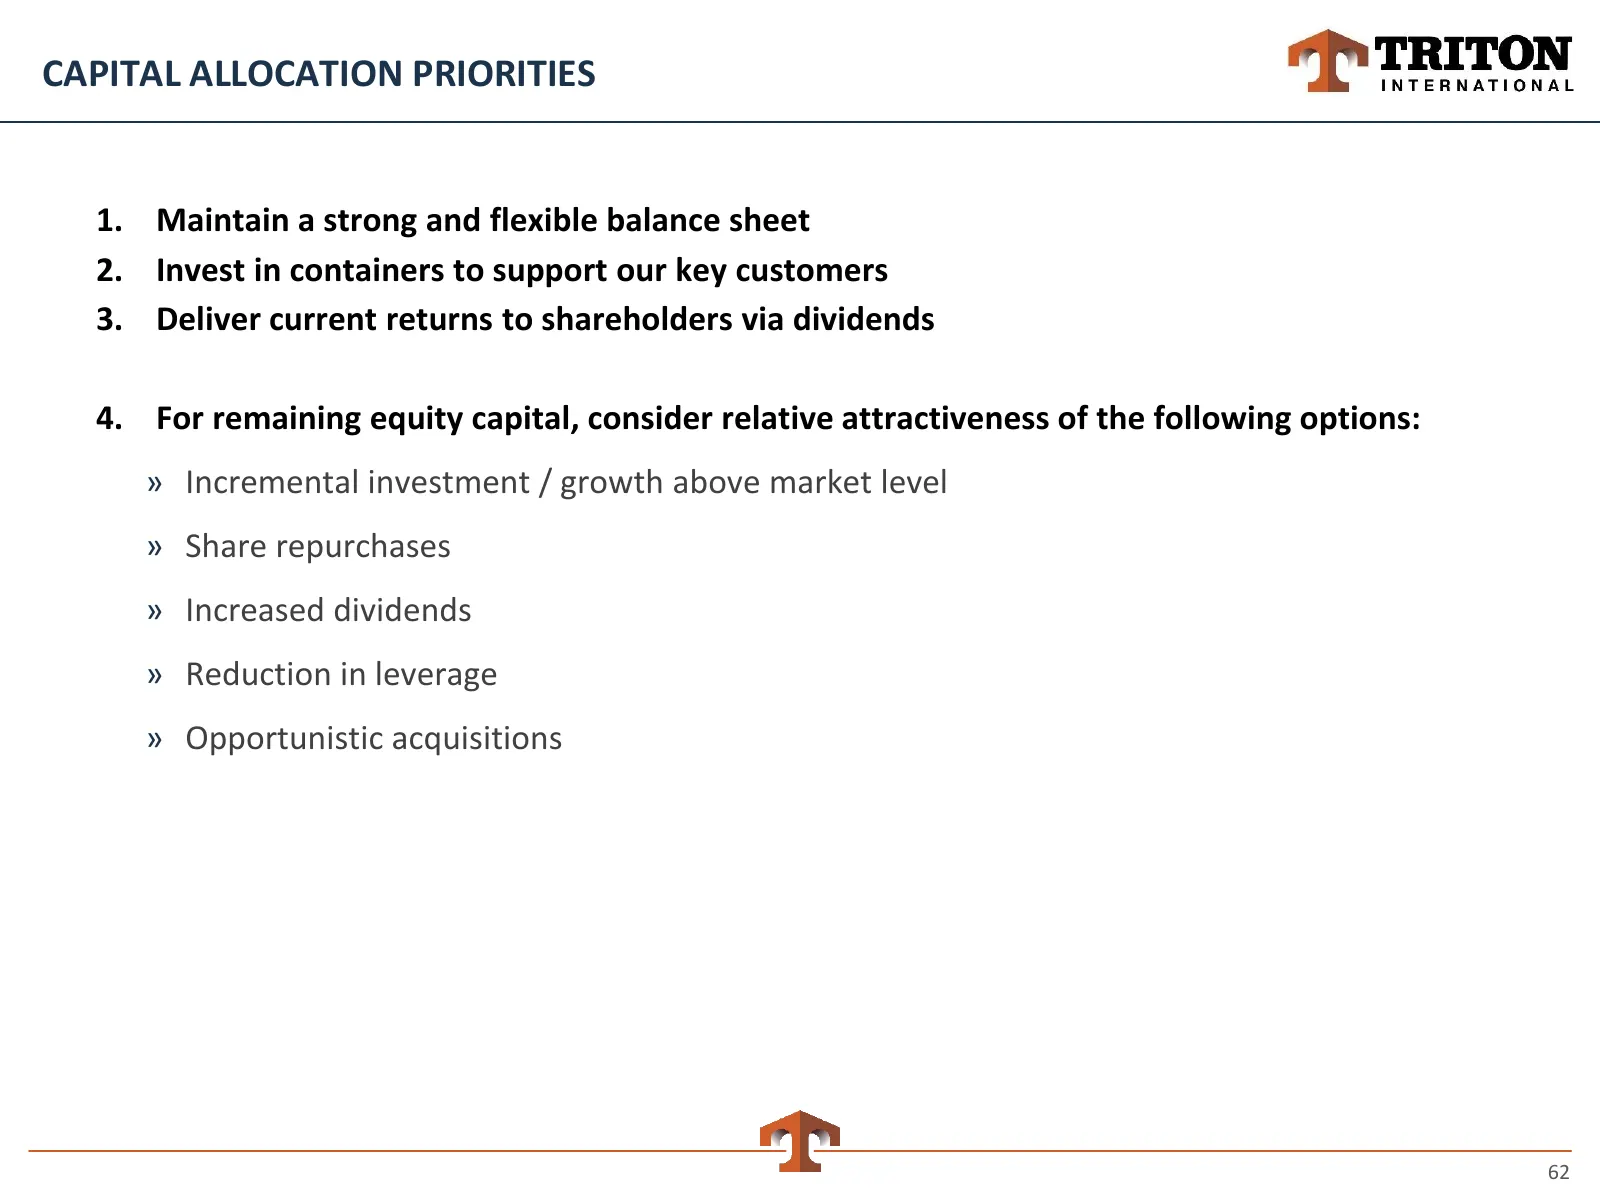
CAPITAL ALLOCATION PRIORITIES 1. Maintain a strong and flexible balance sheet 2. Invest in containers to support our key customers 3. Deliver current returns to shareholders via dividends 4. For remaining equity capital, consider relative attractiveness of the following options: » Incremental invest
Slide 63: Conservative Balance Sheet
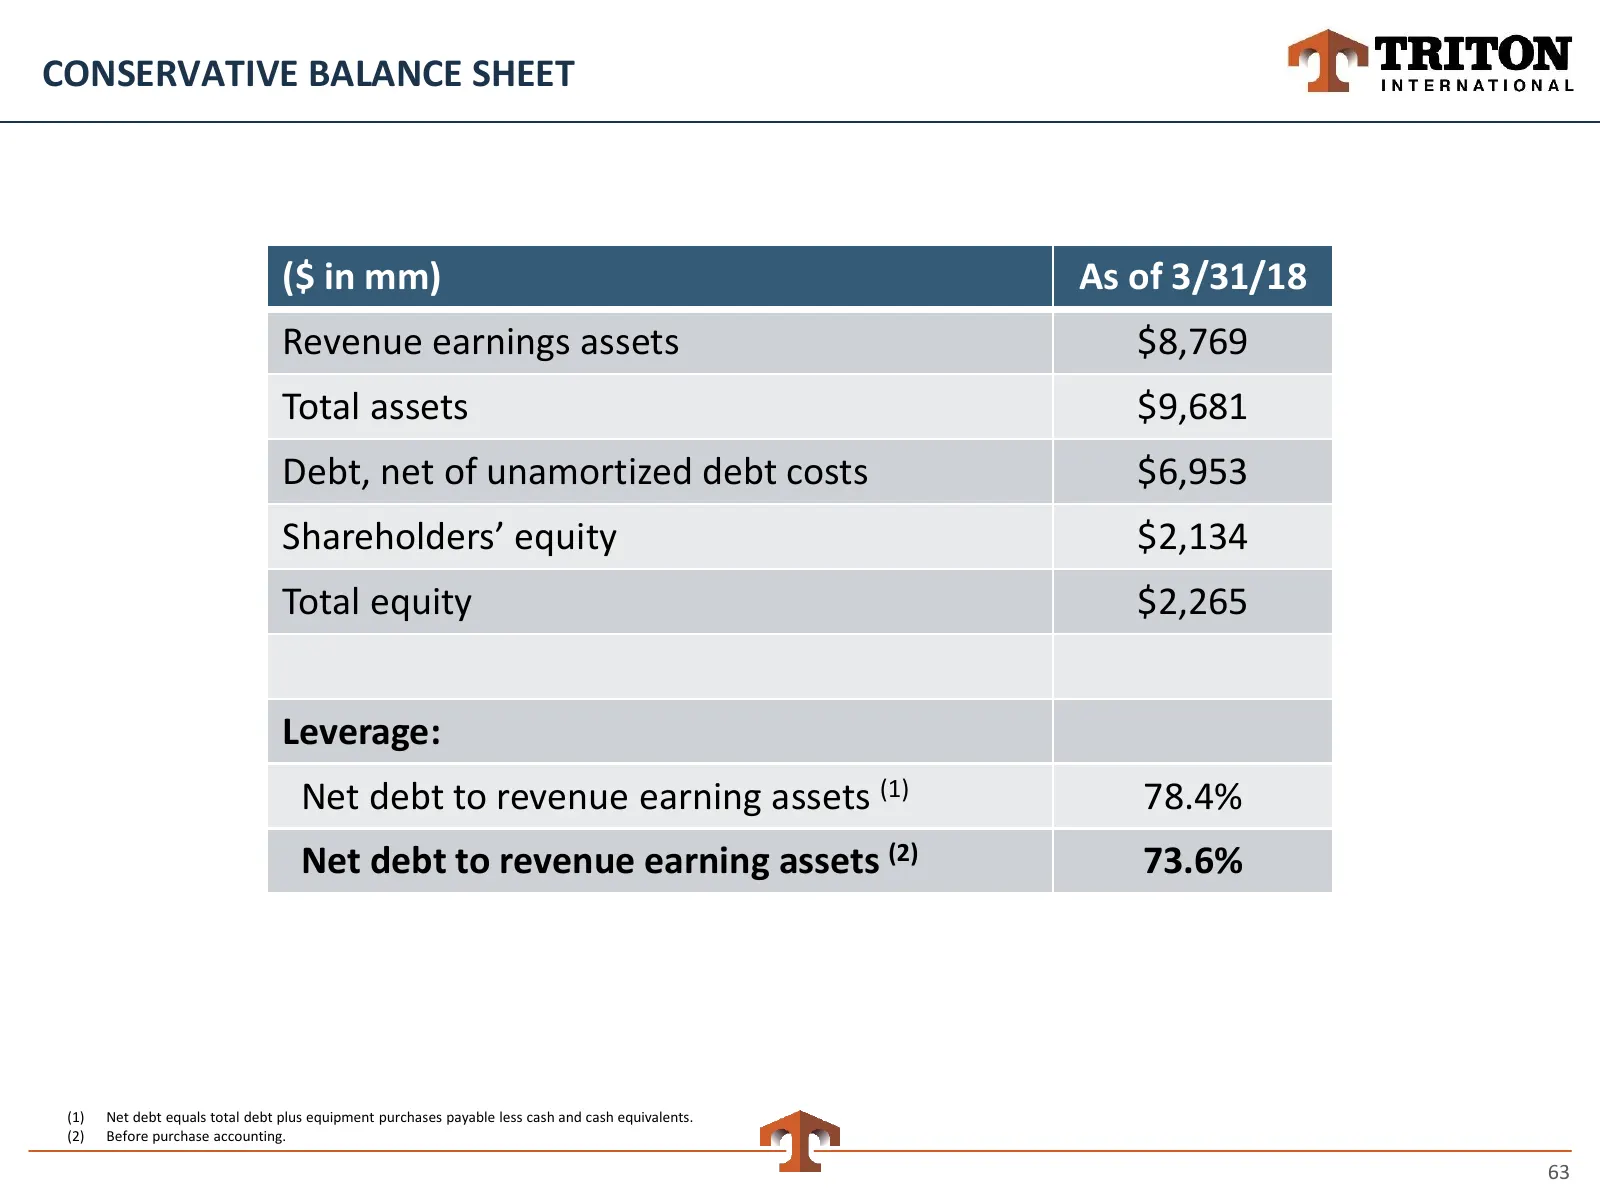
CONSERVATIVE BALANCE SHEET ($ in mm) As of 3/31/18 Revenue earnings assets $8,769 Total assets $9,681 Debt, net of unamortized debt costs $6,953 Shareholders’ equity $2,134 Total equity $2,265 Leverage: Net debt to revenue earning assets (1) 78.4% Net debt to revenue earning assets (2) 73.6% (1) Net
Slide 64: Well Protected Capital Structure
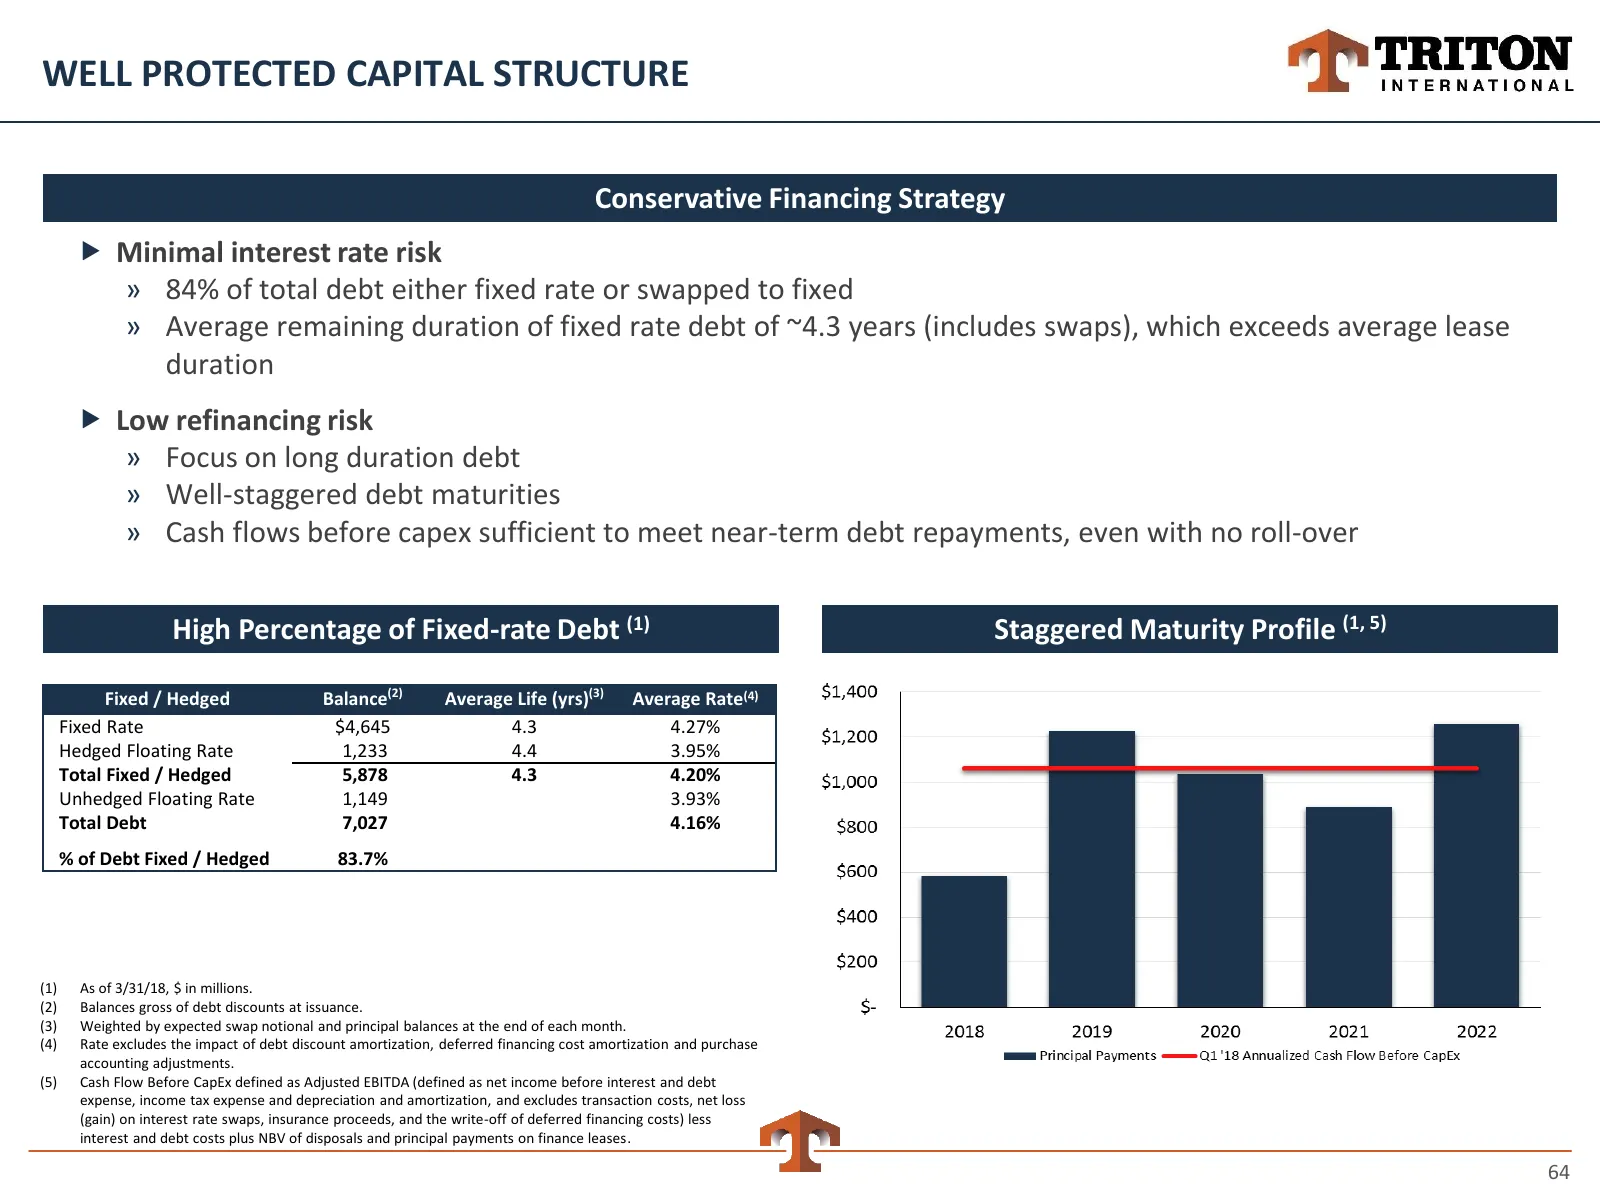
WELL PROTECTED CAPITAL STRUCTURE Conservative Financing Strategy Minimal interest rate risk » 84% of total debt either fixed rate or swapped to fixed » Average remaining duration of fixed rate debt of ~4.3 years (includes swaps), which exceeds average lease duration Low refinancing risk » Focus
Slide 65: Hedges Protect Against Rising Interest Rates
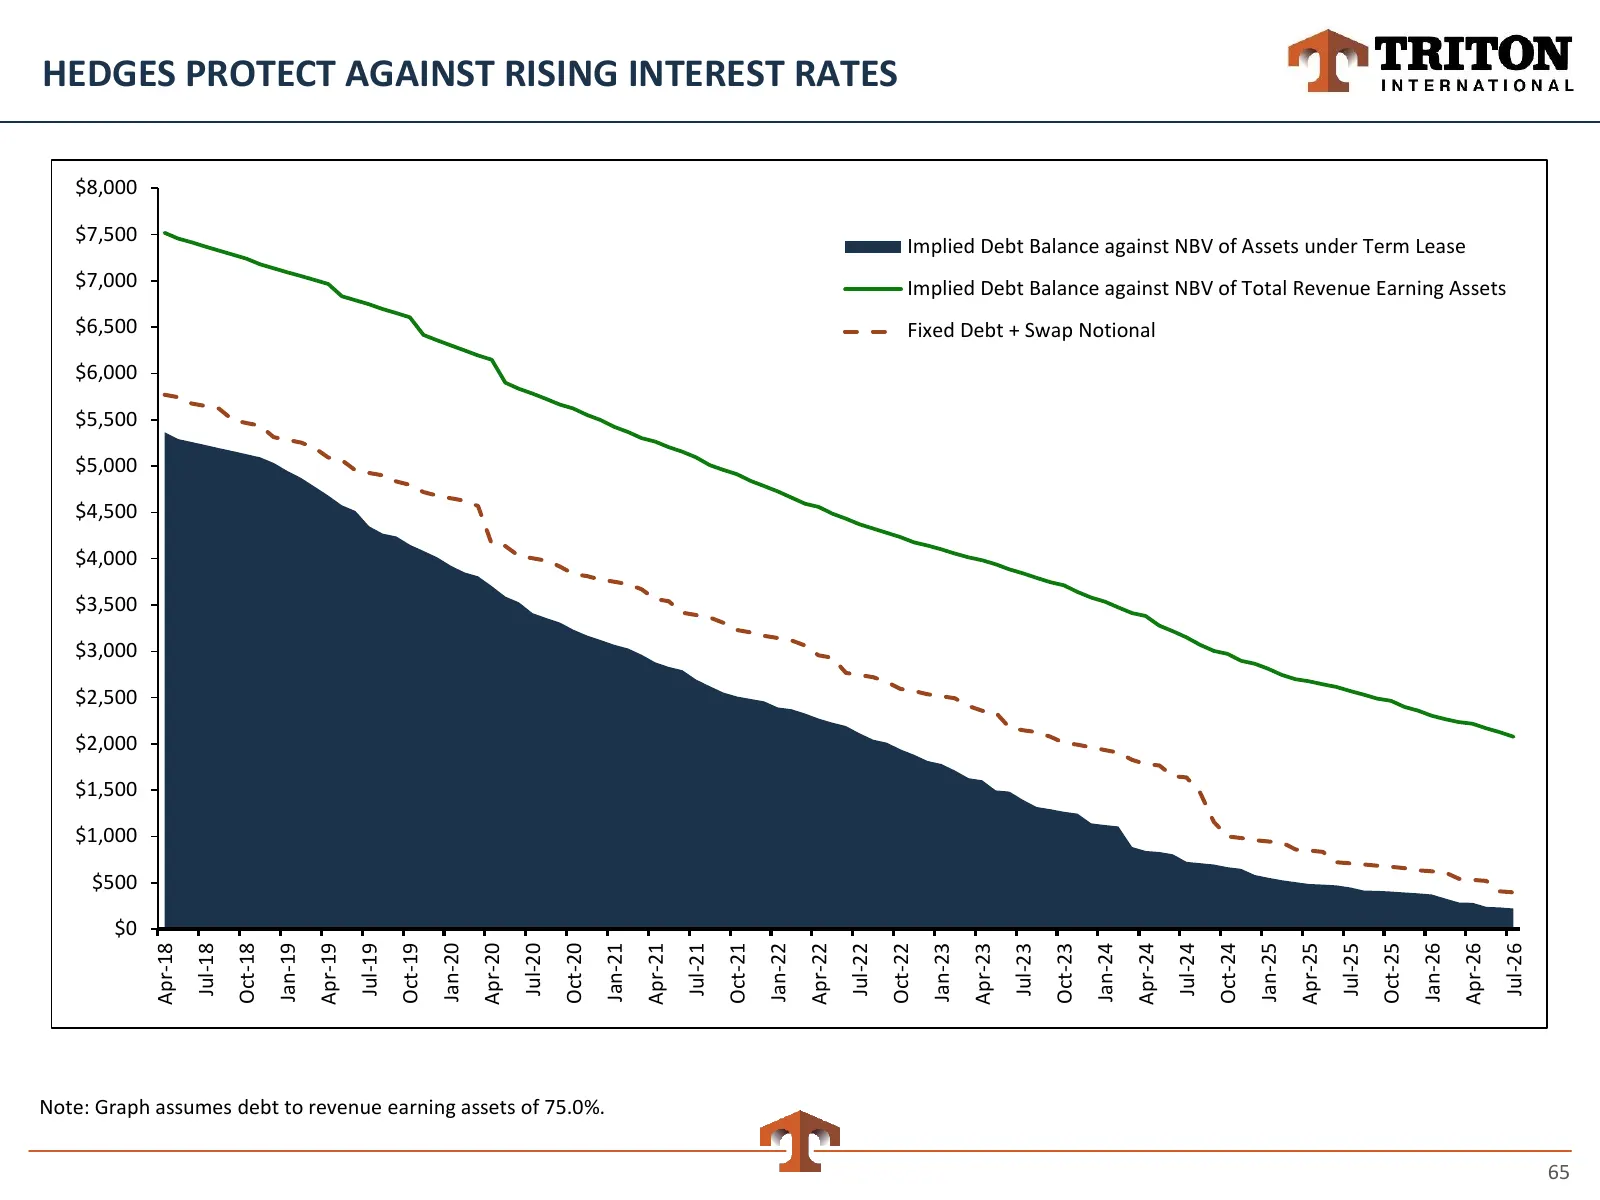
HEDGES PROTECT AGAINST RISING INTEREST RATES $8,000 $7,500 Implied Debt Balance against NBV of Assets under Term Lease $7,000 Implied Debt Balance against NBV of Total Revenue Earning Assets $6,500 Fixed Debt + Swap Notional $6,000 $5,500 $5,000 $4,500 $4,000 $3,500 $3,000 $2,500 $2,000 $1,500 $1,00
Slide 66: Triton Has Access to Multiple Funding Channels
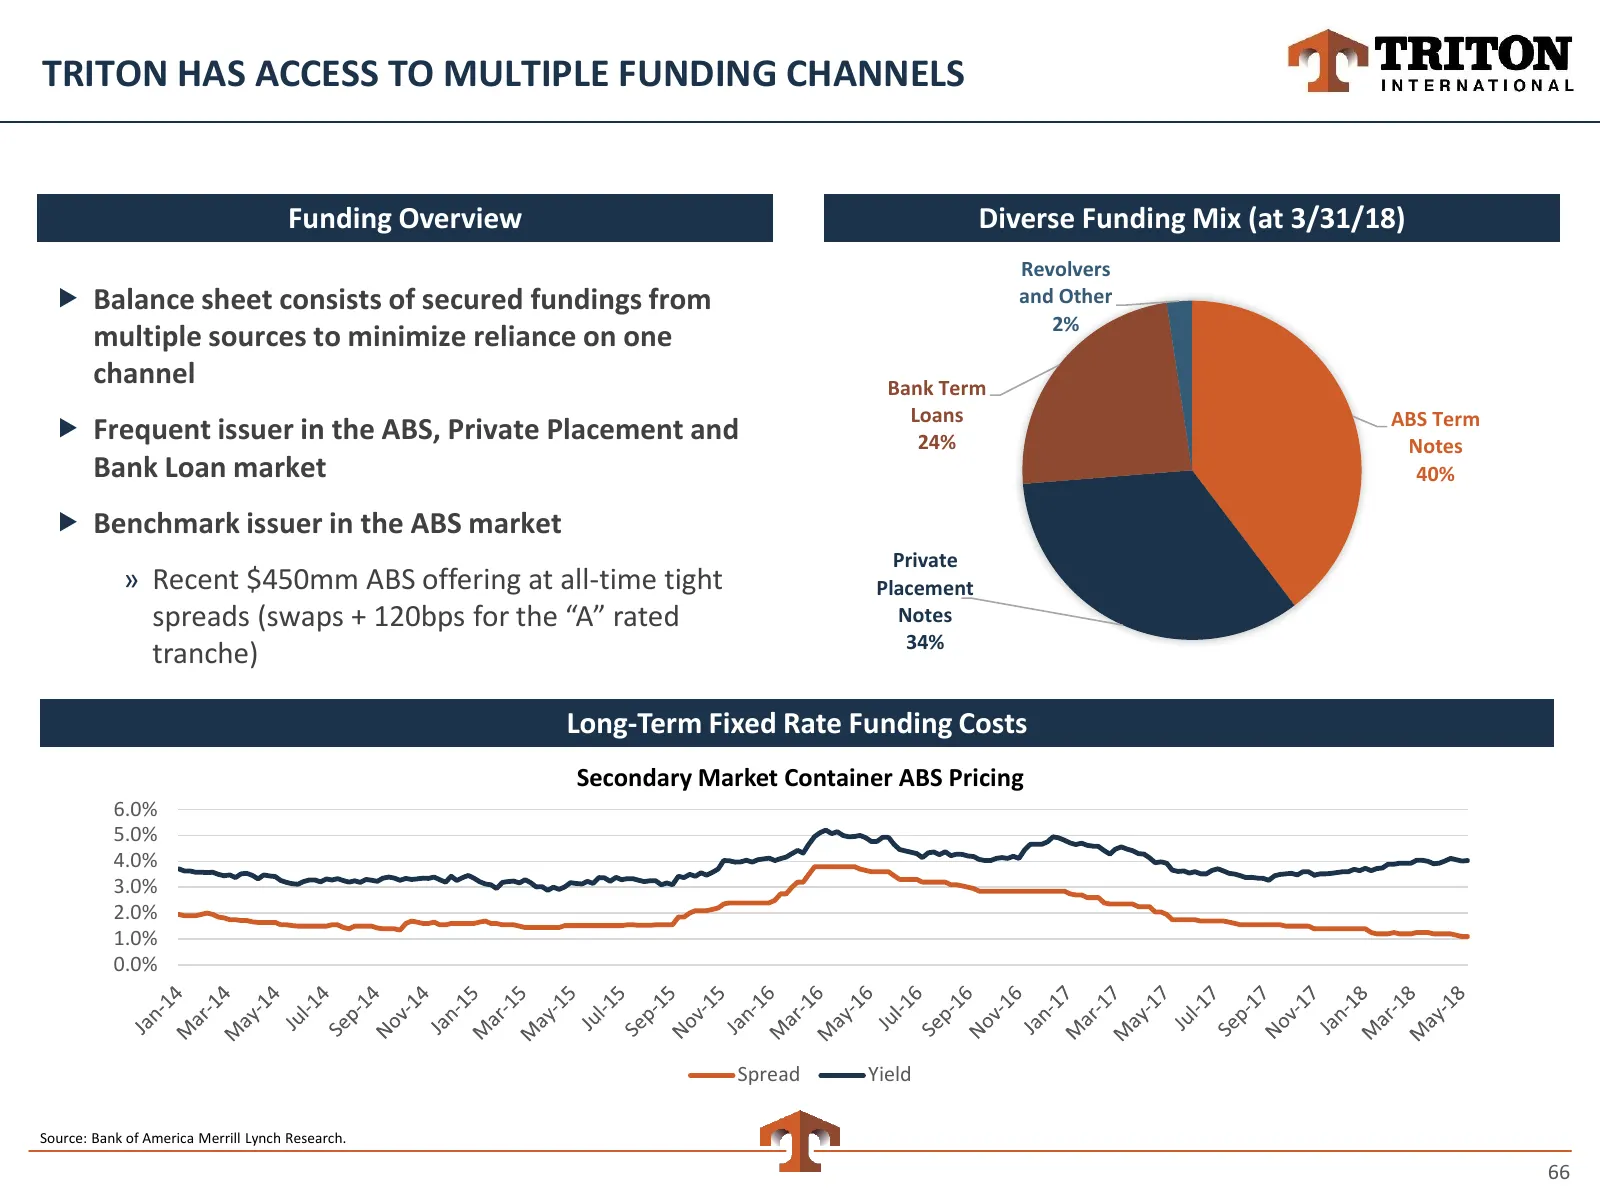
TRITON HAS ACCESS TO MULTIPLE FUNDING CHANNELS Funding Overview Diverse Funding Mix (at 3/31/18) Revolvers Balance sheet consists of secured fundings from and Other 2% multiple sources to minimize reliance on one channel Bank Term Loans ABS Term Frequent issuer in the ABS, Private Placement and
Slide 67: Conclusion
Conclusion ag Pp TRITON INTERNATIONAL
Slide 68: Strategic Priorities
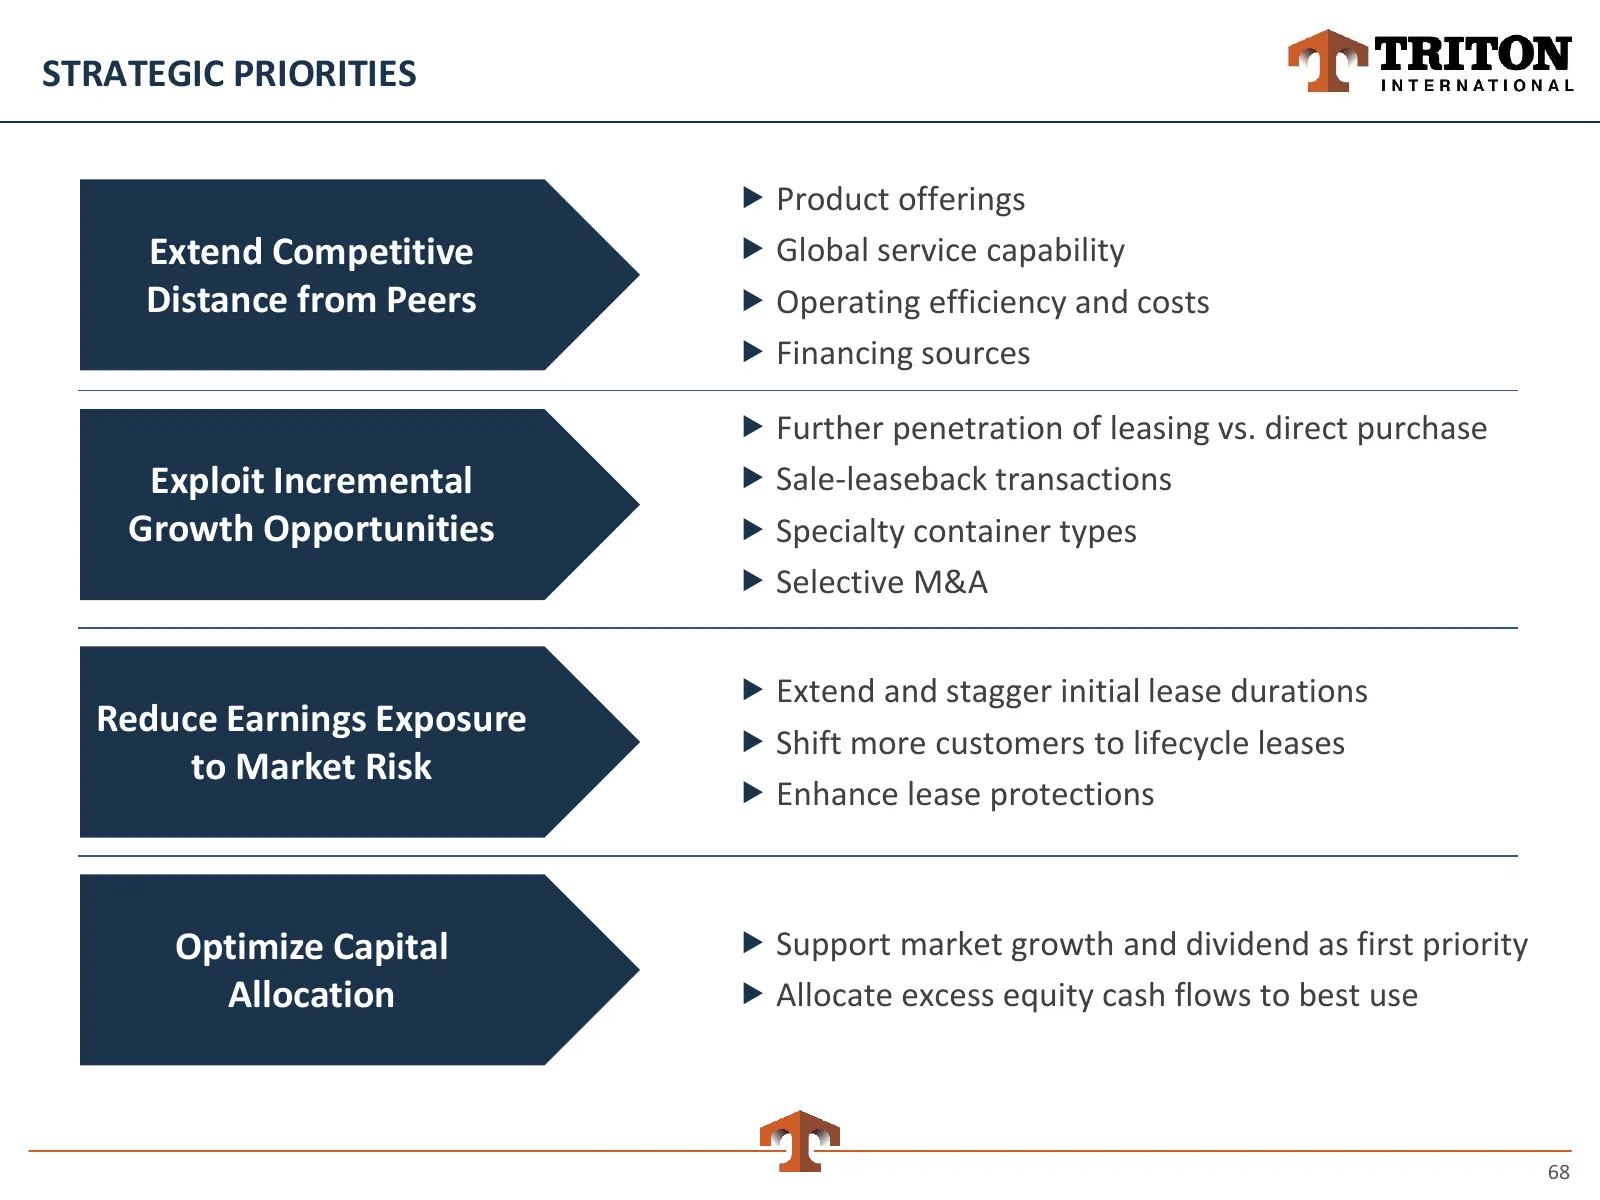
STRATEGIC PRIORITIES Product offerings Extend Competitive Global service capability Distance from Peers Operating efficiency and costs Financing sources Further penetration of leasing vs. direct purchase Exploit Incremental Sale-leaseback transactions Growth Opportunities Specialty con
Slide 69: Investment Highlights
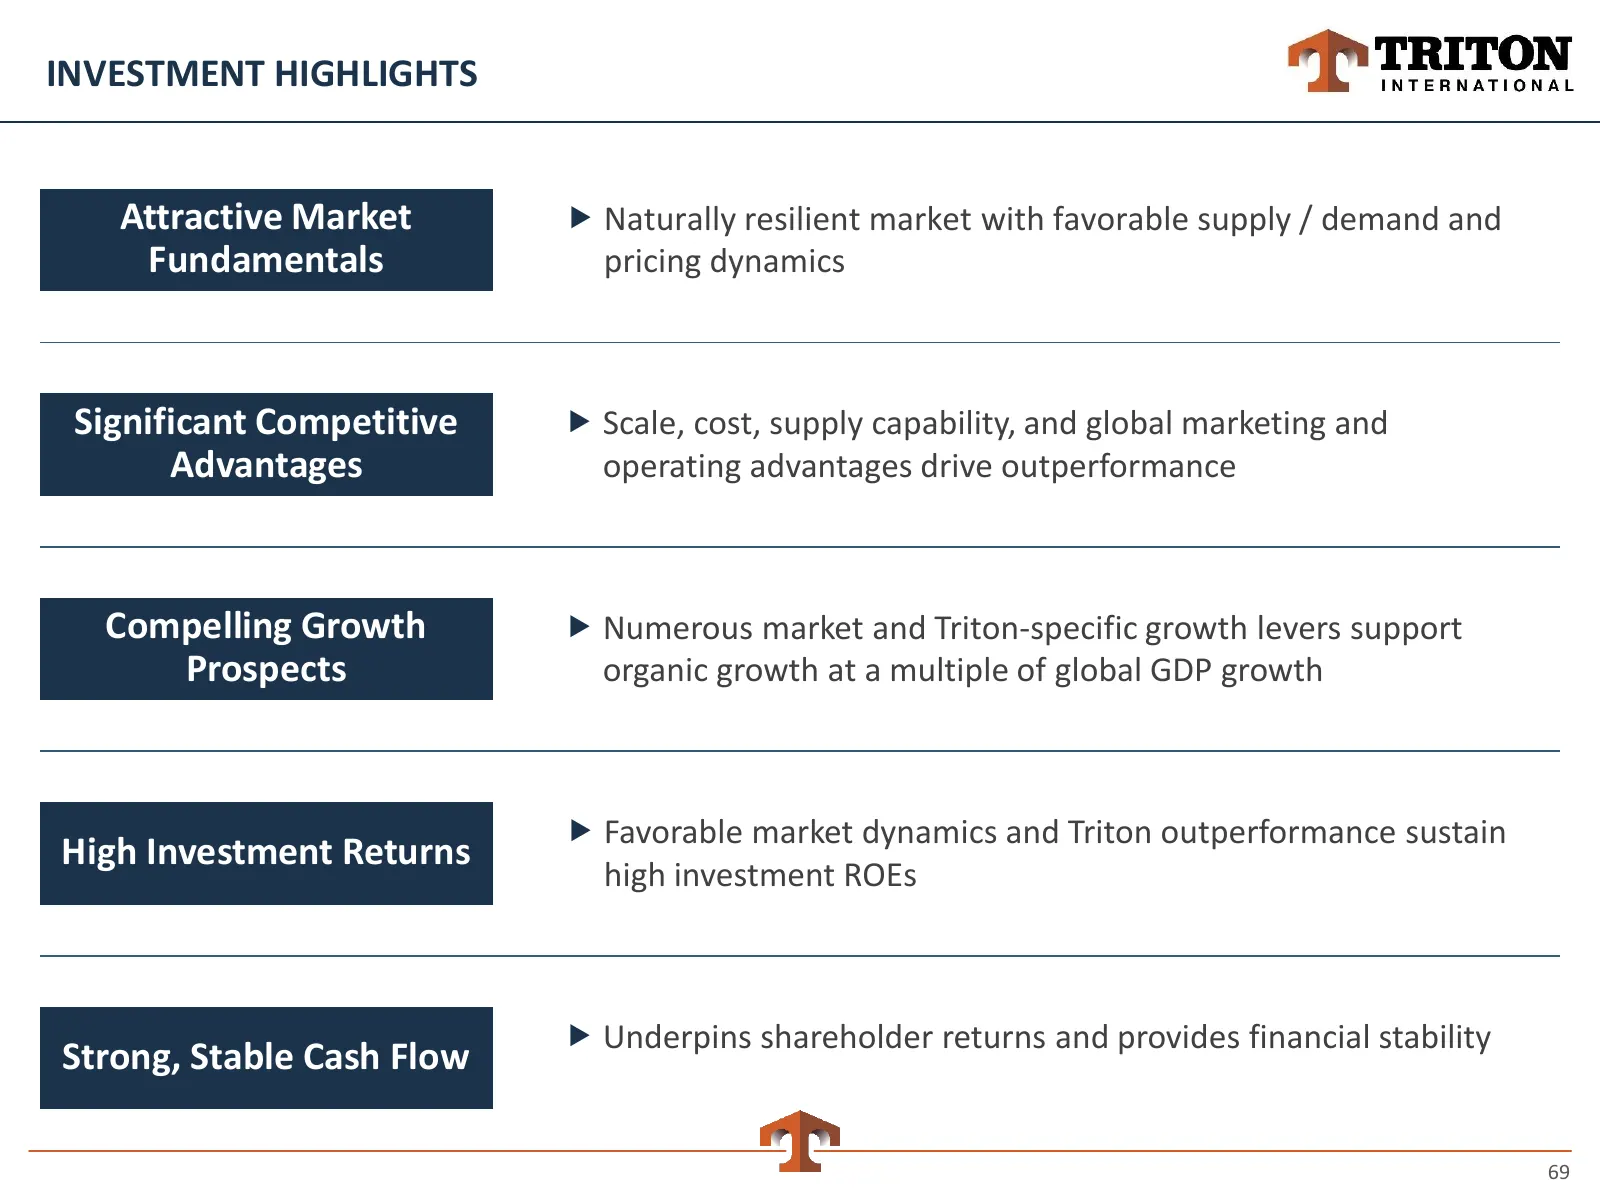
INVESTMENT HIGHLIGHTS Attractive Market Naturally resilient market with favorable supply / demand and Fundamentals pricing dynamics Significant Competitive Scale, cost, supply capability, and global marketing and Advantages operating advantages drive outperformance Compelling Growth Numerous m
Slide 70: Q&A
Q&A INTERNATIONAL
Slide 71: Appendix
Appendix if Pp TRITON INTERNATIONAL
Slide 72: Drys
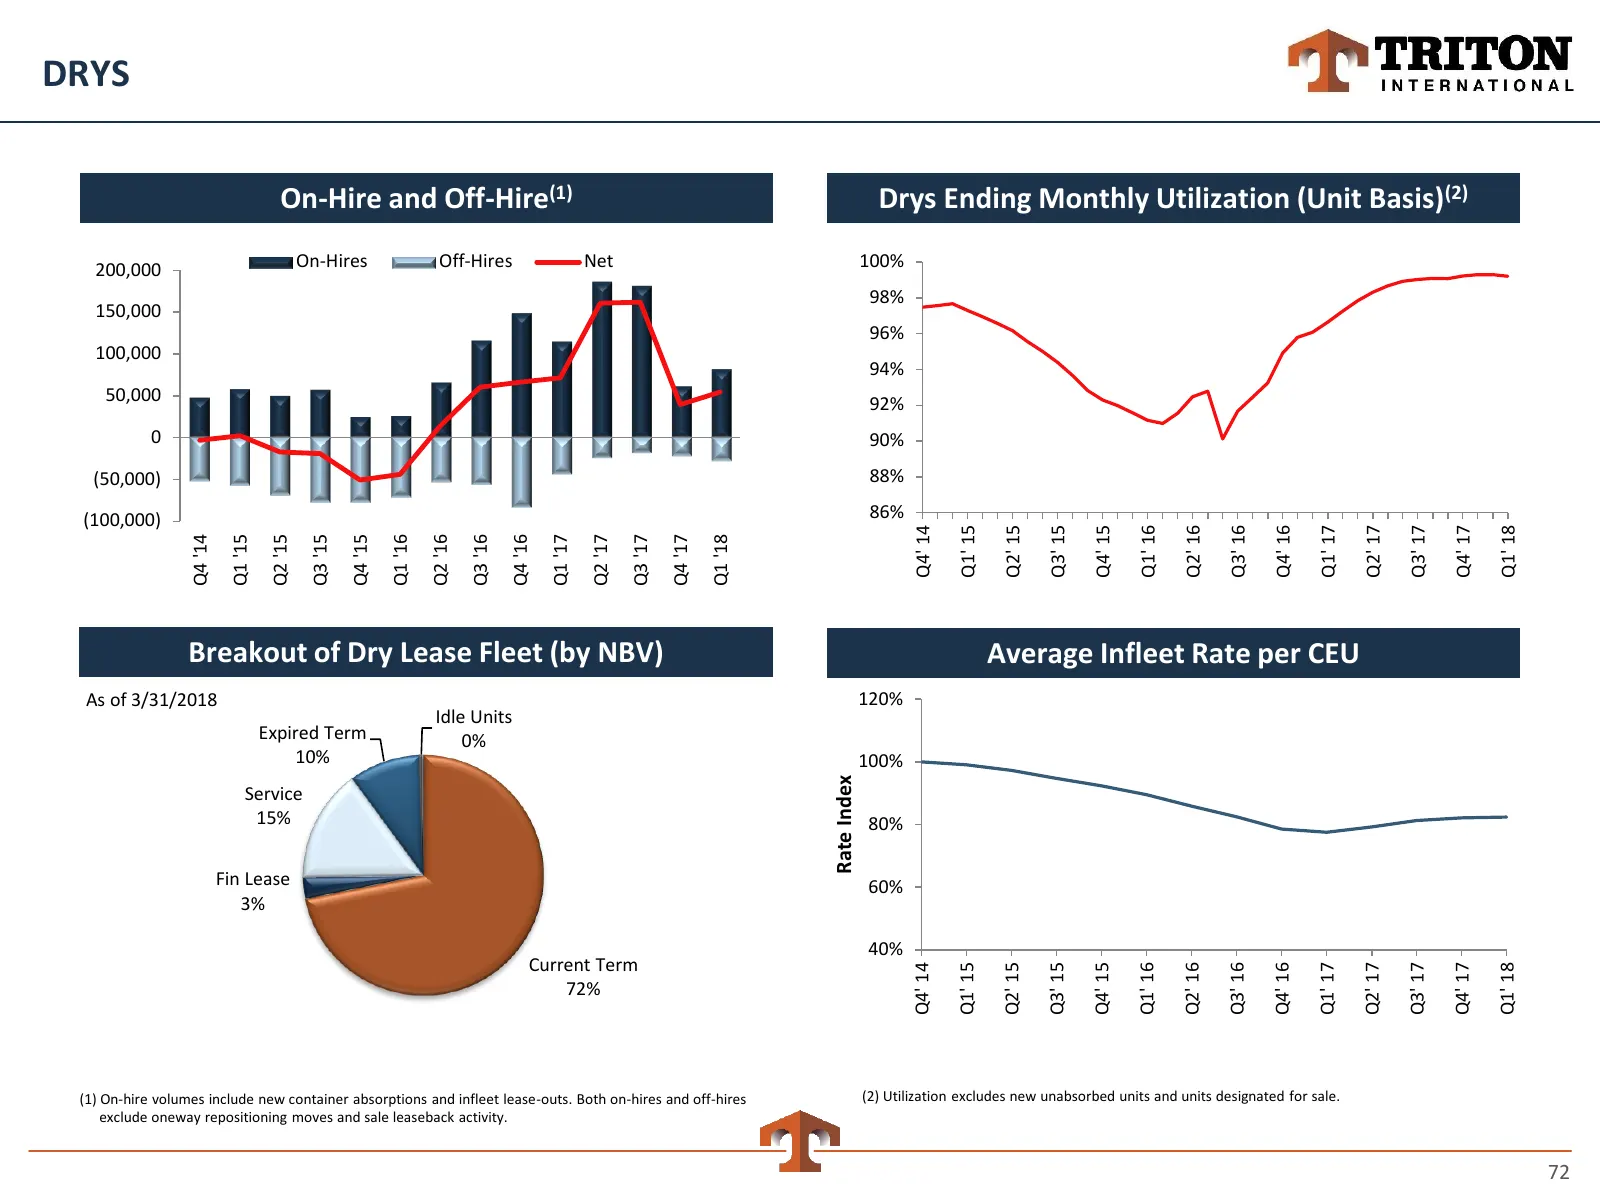
DRYS On-Hire and Off-Hire(1) Drys Ending Monthly Utilization (Unit Basis)(2) 200,000 On-Hires Off-Hires Net 100% 98% 150,000 96% 100,000 94% 50,000 92% 0 90% (50,000) 88% (100,000) 86% Q1' 16 Q4' 14 Q1' 15 Q2' 15 Q3' 15 Q4' 15 Q2' 16 Q3' 16 Q4' 16 Q1' 17 Q2' 17 Q3' 17 Q4' 17 Q1' 18 Q4 '14 Q1 '15 Q2
Slide 73: Refers
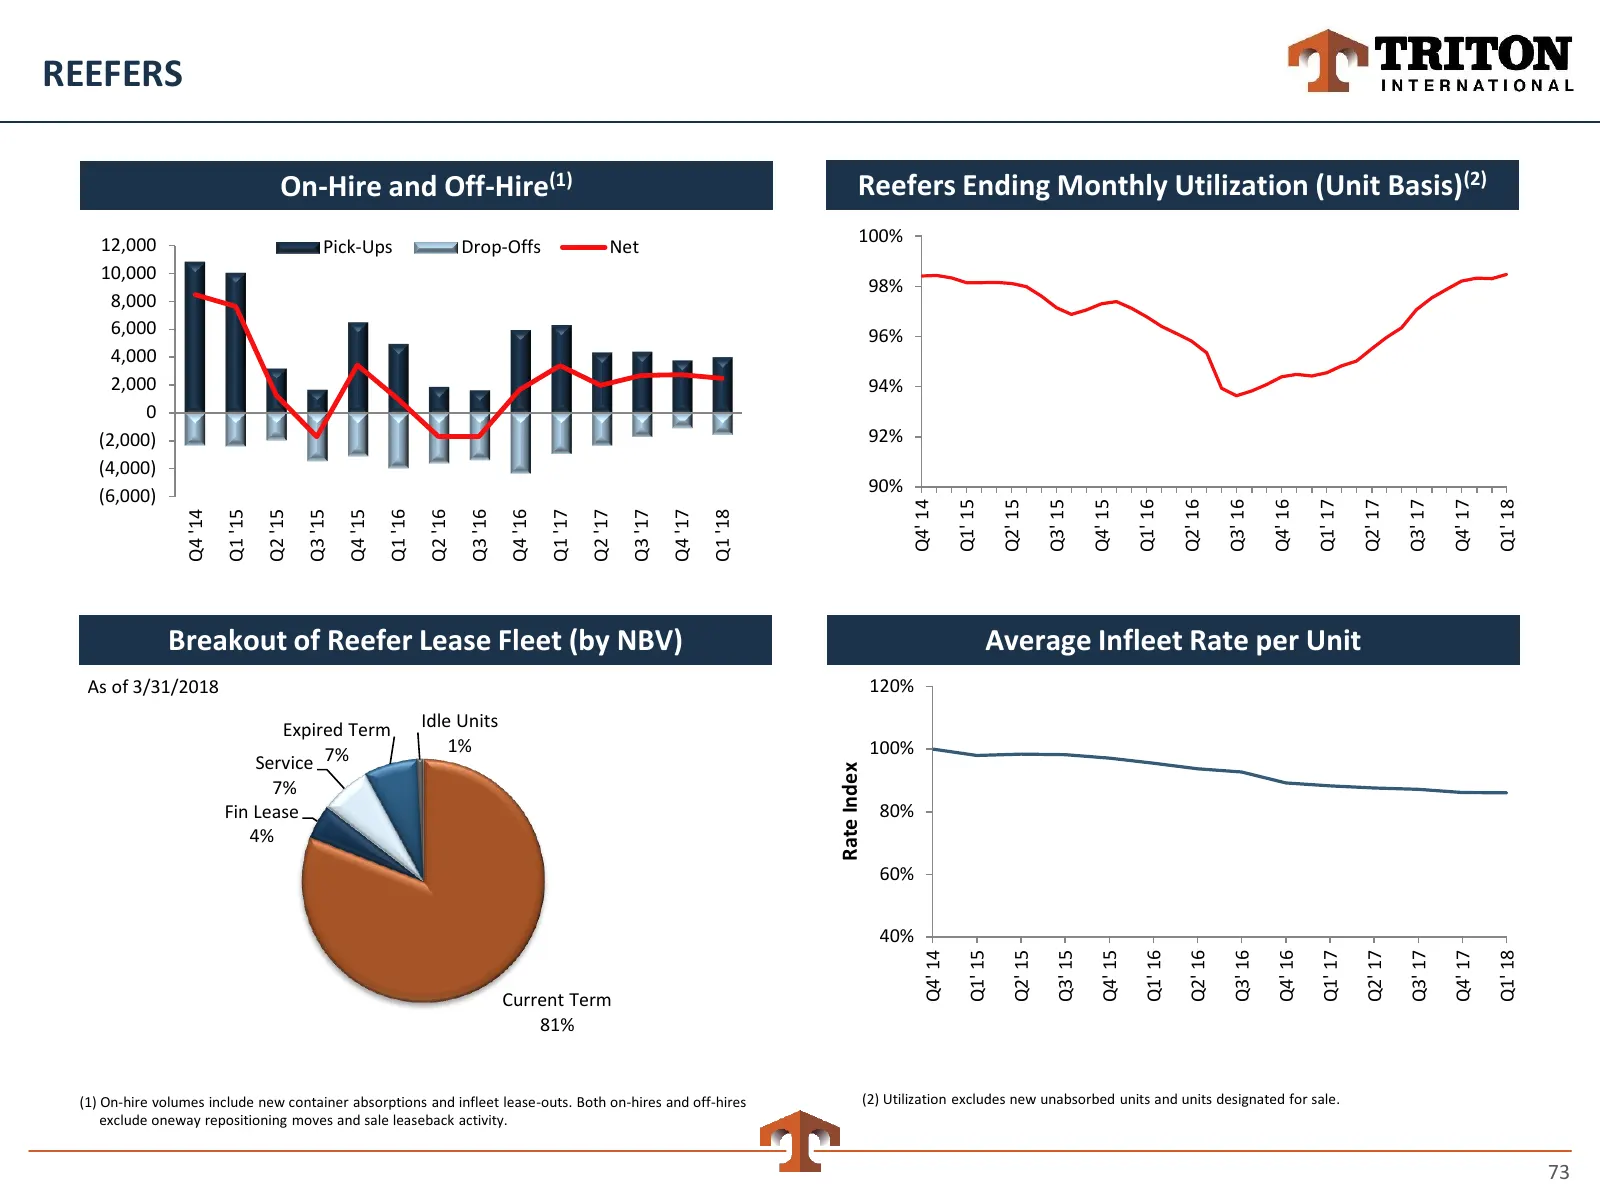
REEFERS On-Hire and Off-Hire(1) Reefers Ending Monthly Utilization (Unit Basis)(2) 12,000 100% Pick-Ups Drop-Offs Net 10,000 98% 8,000 6,000 96% 4,000 2,000 94% 0 (2,000) 92% (4,000) (6,000) 90% Q1' 15 Q4' 14 Q2' 15 Q3' 15 Q4' 15 Q1' 16 Q2' 16 Q3' 16 Q4' 16 Q1' 17 Q2' 17 Q3' 17 Q4' 17 Q1' 18 Q3 '15
Slide 74: Core Specials
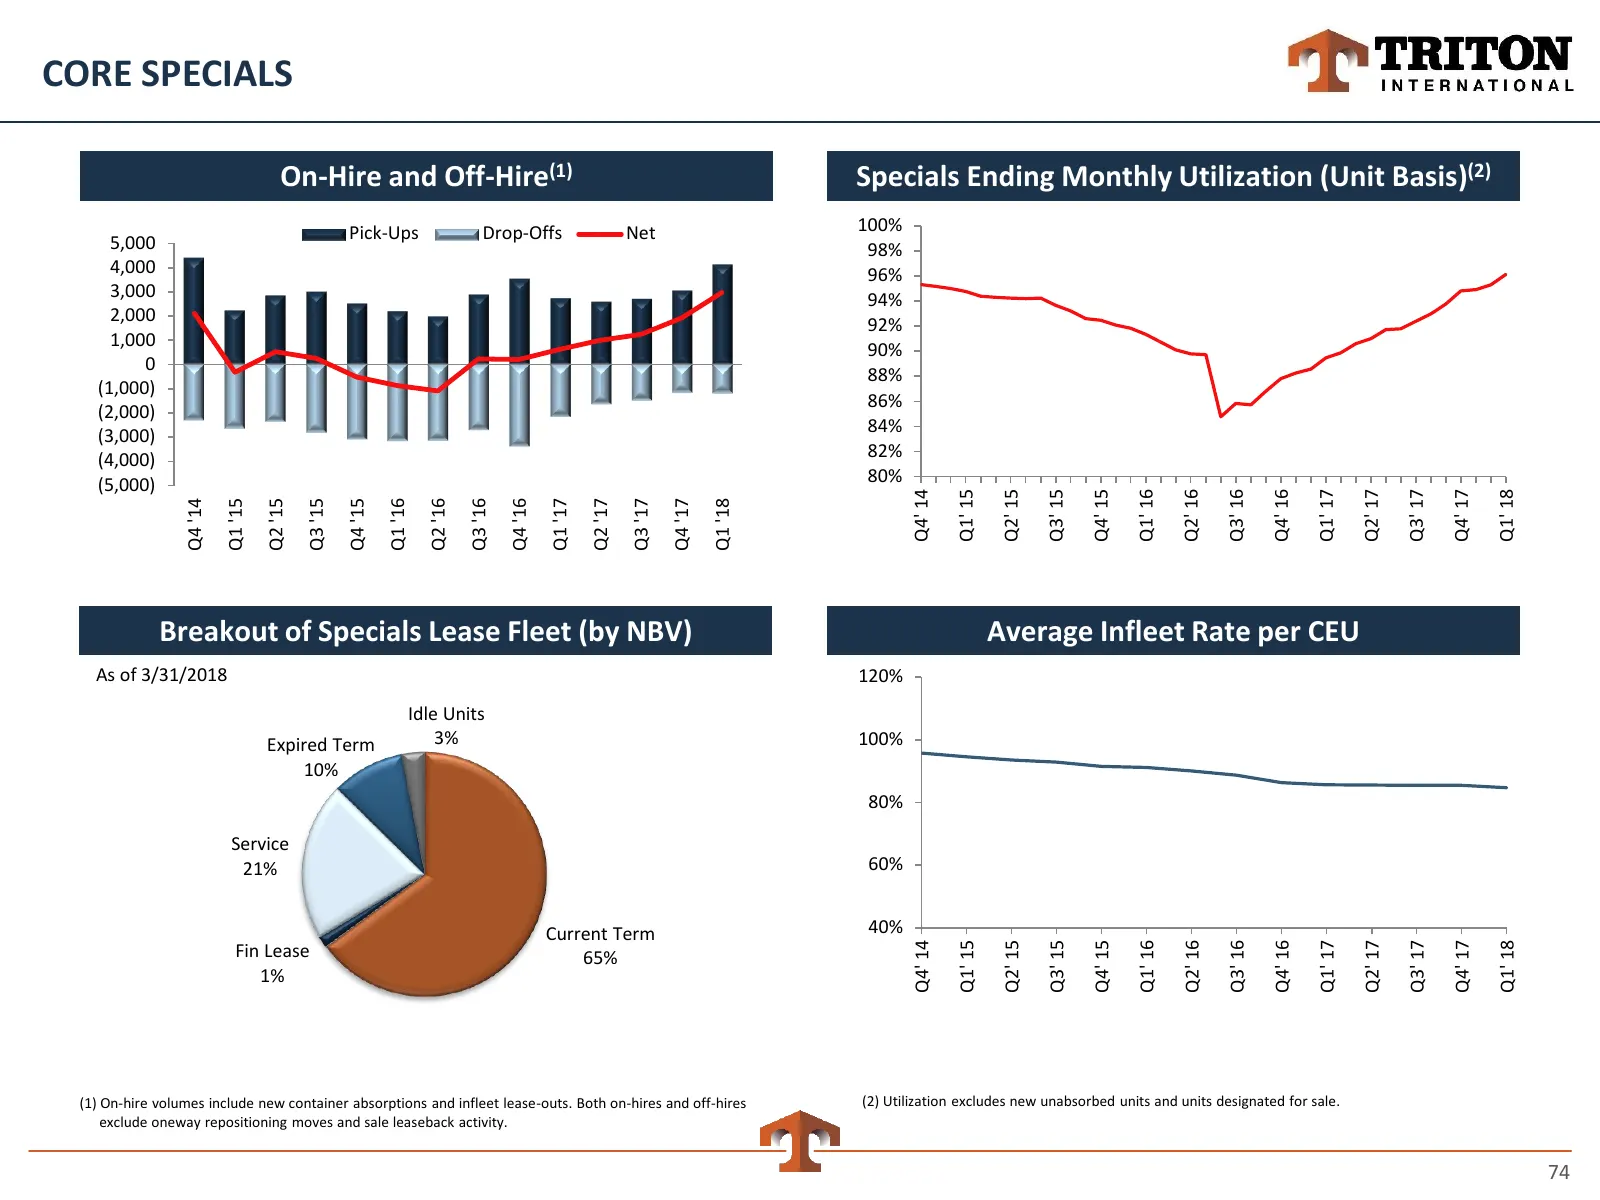
CORE SPECIALS On-Hire and Off-Hire(1) Specials Ending Monthly Utilization (Unit Basis)(2) Pick-Ups Drop-Offs Net 100% 5,000 98% 4,000 96% 3,000 94% 2,000 92% 1,000 90% 0 88% (1,000) 86% (2,000) 84% (3,000) (4,000) 82% (5,000) 80% Q2' 16 Q4' 14 Q1' 15 Q2' 15 Q3' 15 Q4' 15 Q1' 16 Q3' 16 Q4' 16 Q1' 17
Slide 75: Other Product Lines
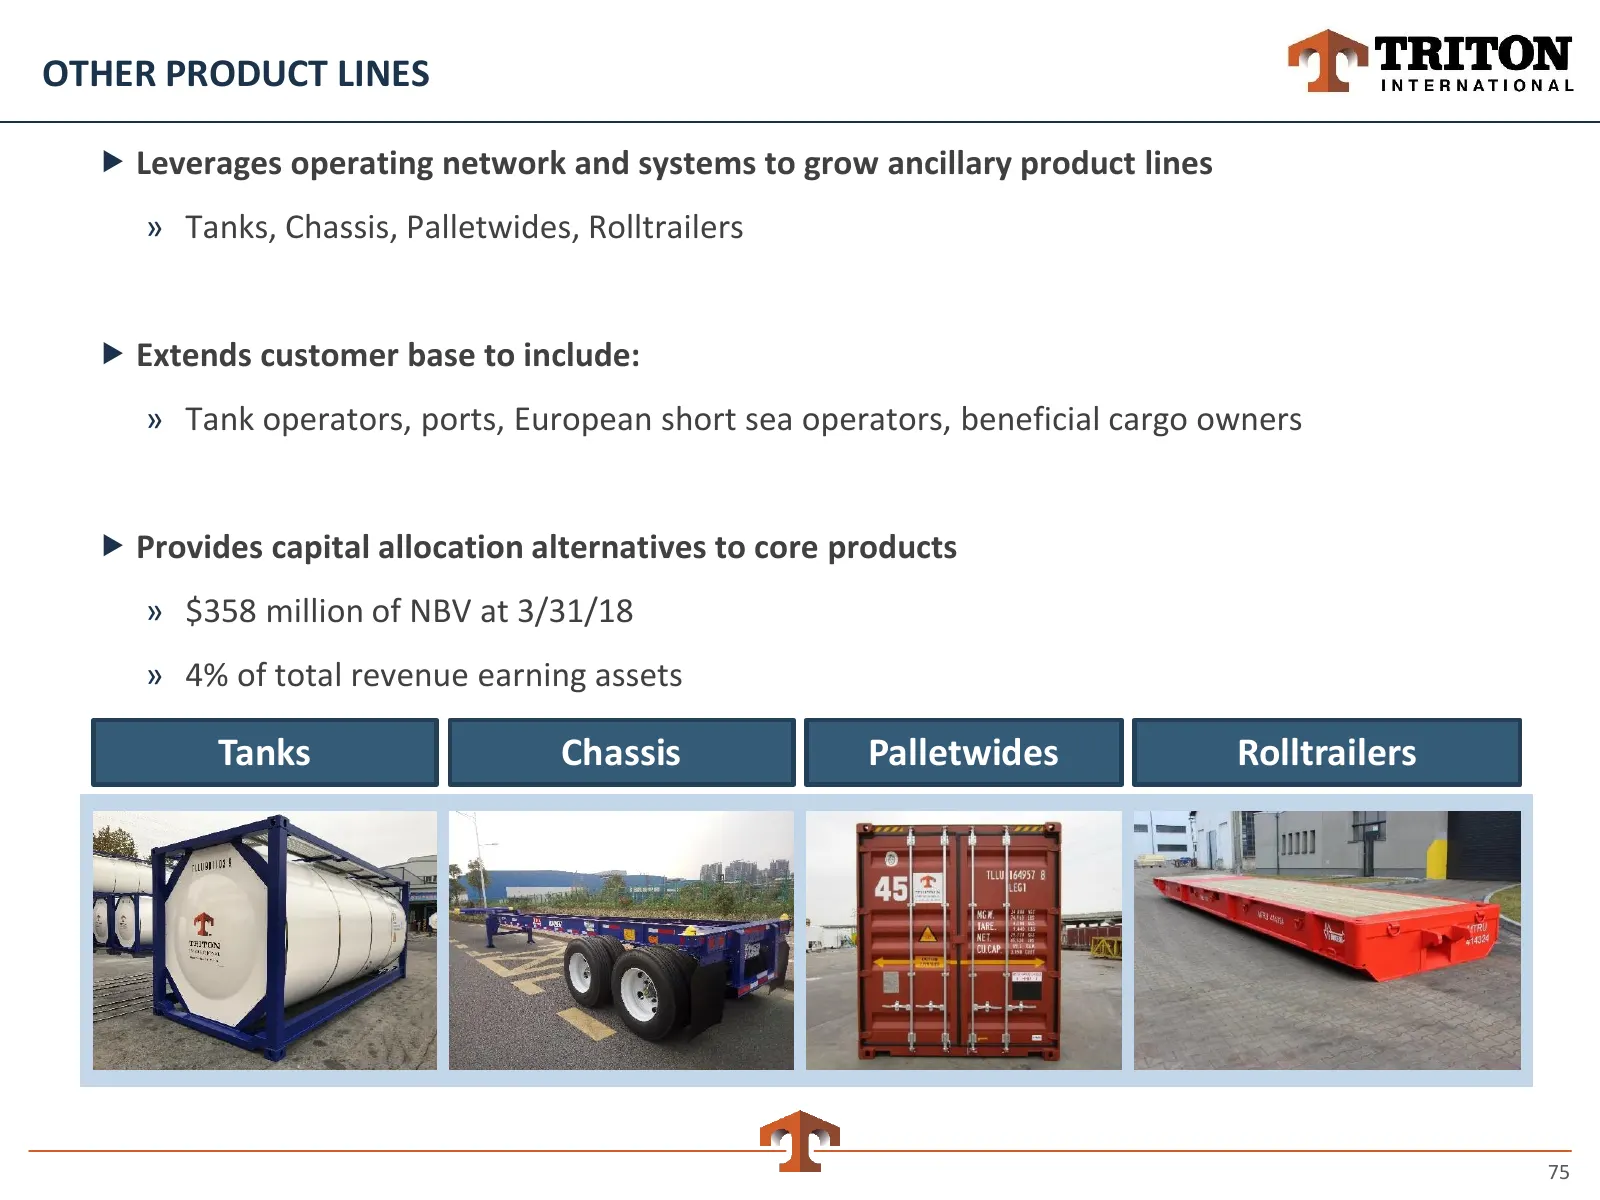
OTHER PRODUCT LINES Leverages operating network and systems to grow ancillary product lines » Tanks, Chassis, Palletwides, Rolltrailers Extends customer base to include: » Tank operators, ports, European short sea operators, beneficial cargo owners Provides capital allocation alternatives to c
Slide 76: Sale Prices Strong
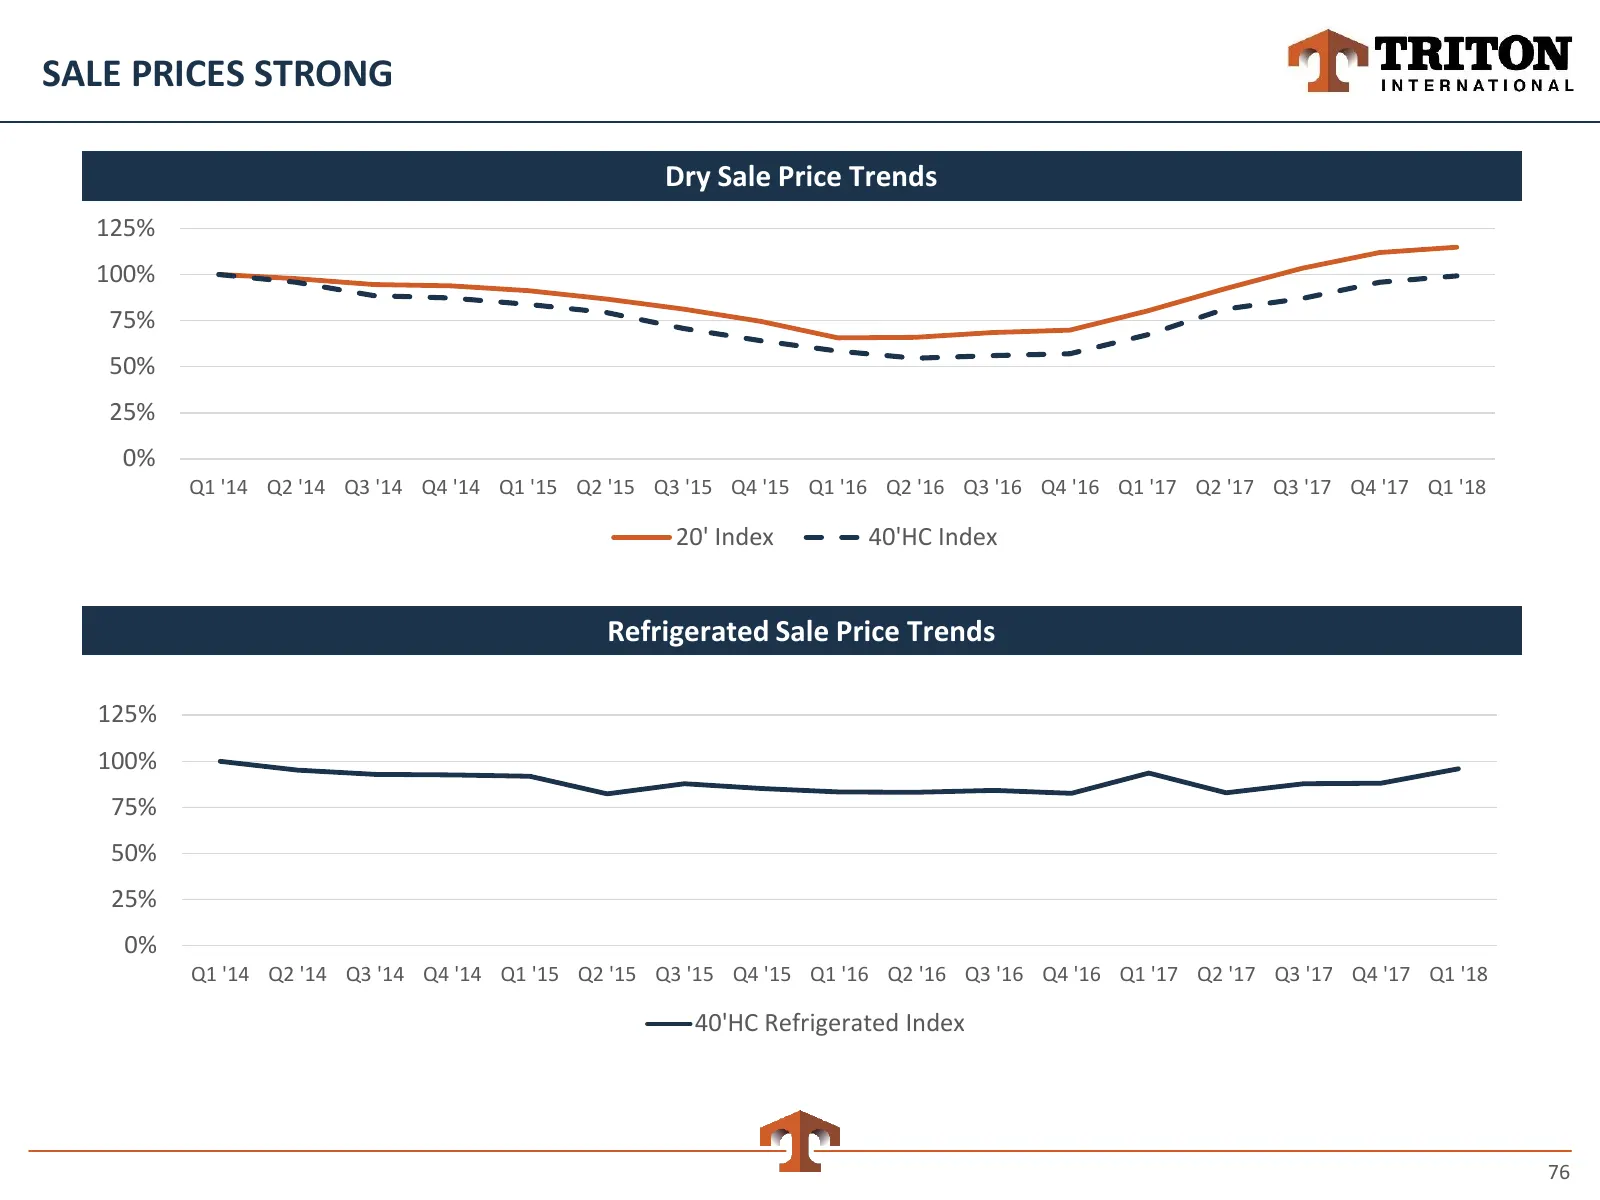
SALE PRICES STRONG Dry Sale Price Trends 125% 100% 75% 50% 25% 0% Q1 '14 Q2 '14 Q3 '14 Q4 '14 Q1 '15 Q2 '15 Q3 '15 Q4 '15 Q1 '16 Q2 '16 Q3 '16 Q4 '16 Q1 '17 Q2 '17 Q3 '17 Q4 '17 Q1 '18 20' Index 40'HC Index Refrigerated Sale Price Trends 125% 100% 75% 50% 25% 0% Q1 '14 Q2 '14 Q3 '14 Q4 '14 Q1 '15 Q2
Slide 77: Reconciliation of Non-GAAP Financial Information
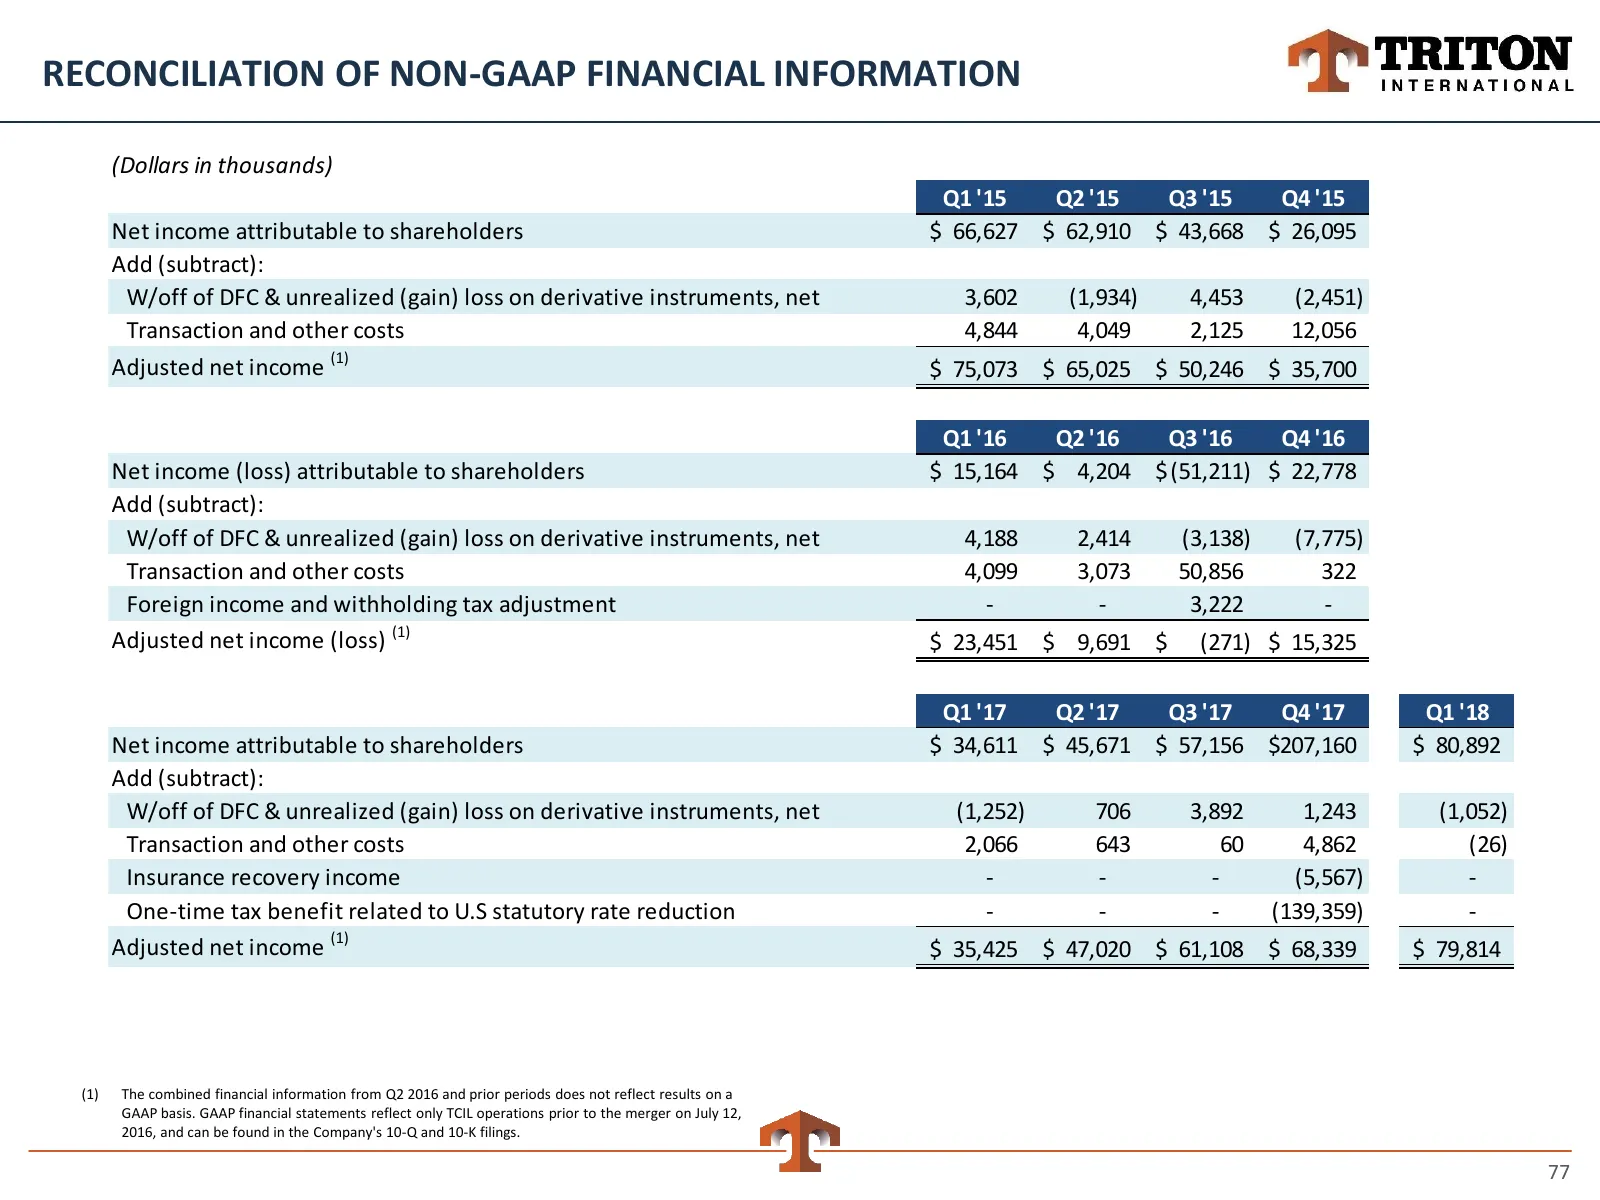
RECONCILIATION OF NON-GAAP FINANCIAL INFORMATION (Dollars in thousands) Q1 '15 Q2 '15 Q3 '15 Q4 '15 Net income attributable to shareholders $ 66,627 $ 62,910 $ 43,668 $ 26,095 Add (subtract): W/off of DFC & unrealized (gain) loss on derivative instruments, net 3,602 (1,934) 4,453 (2,451) Transaction
Source: Internet Archive copy of tritoninternational.com
More decks from Triton International Ltd.
 Q3 2026 Earnings Presentation14 slides · November 2026
 Q2 2026 Earnings Presentation14 slides · August 2026
 Q1 2026 Earnings Presentation14 slides · May 2026
 Q4 2025 Earnings Presentation12 slides · February 2026
 Investor Presentation (January 2026)12 slides · January 2026
 Q2 2025 Earnings Presentation13 slides · September 2025