Copano Energy L.L.C — Investor Day (June 2011)
97 slides from Copano Energy L.L.C's investor day presentation, Jun 15, 2011
Slide 1: 2011 Analyst Meeting
2011 Analyst Meeting June 16, 2011 NASDAQ: CPNO

Slide 2: Disclaimer
Disclaimer This presentation includes “forward-looking statements,” as defined in the federal securities laws. Statements that address activities or events that Copano believes will or may occur in the future are forward-looking statements. These statements include, but are not limited to, statement
Slide 3: Agenda
Agenda Corporate Overview & Strategy Bruce Northcutt President and CEO Oklahoma Segment Sharon Robinson SVP and President, Oklahoma and Rocky Mountains Rocky Mountains Segment Sharon Robinson SVP and President, Oklahoma and Rocky Mountains Texas Segment Jim Wade SVP and President, Texas M&A Discussi
Slide 4: Corporate Overview & Strategy
Corporate Overview & Strategy Bruce Northcutt
Slide 5: Experienced Operator with a History of Growth
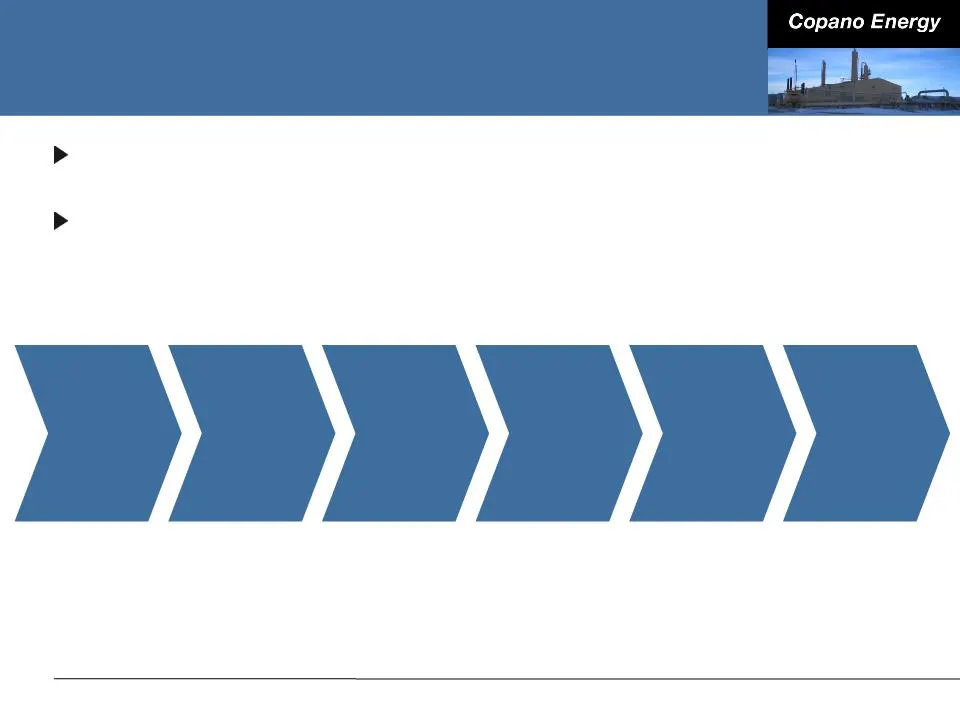
1992 John Eckel founds Copano, acquires Copano Bay system 2001 Houston Central plant acquisition 2004 First midstream LLC to IPO 2005 ScissorTail Energy acquisition 2007 Cimmarron and Cantera acquisitions 2010 Initiation of Eagle Ford Shale strategy Experienced Operator with a History of Growth Foun
Slide 6: Business Strategy
Business Strategy To build a diversified midstream company with scale and stability of cash flows, above-average returns on invested capital and “investment-grade quality” distributions Key tenets of our business strategy: ■ Develop and exploit flexibility in our operations ■ Expand midstream servic
Slide 7: Copano's Key Strengths
Copano’s Key Strengths Founded in 1992 as an independent midstream company Experienced operator in liquids-rich natural gas plays Six executive management members with 166 combined years of industry experience Experienced Operator / Seasoned Team Strong Balance Sheet with Access to Liquidity Strateg
Slide 8: Key Personnel Additions
Key Personnel Additions Adding depth and experience in order to better execute on our business strategy and support future growth ■ Senior management additions ● John Goodpasture - Senior Vice President, Corporate Development ● Jim Wade - Senior Vice President and President and Chief Operating Offic
Slide 9: Operating Segments
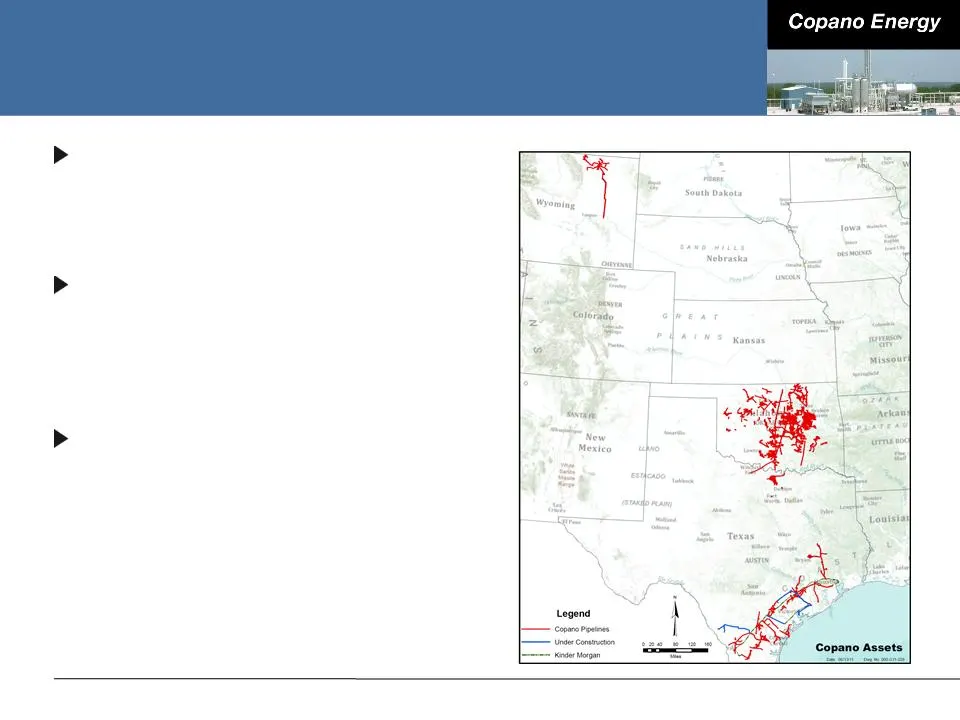
Operating Segments Texas ■ Conventional, Eagle Ford Shale and North Barnett Shale Combo play Oklahoma ■ Conventional, Hunton de-watering play, Woodford Shale and Mississippi Lime Rocky Mountains ■ Powder River Basin
Slide 10: "High-Octane" Plays
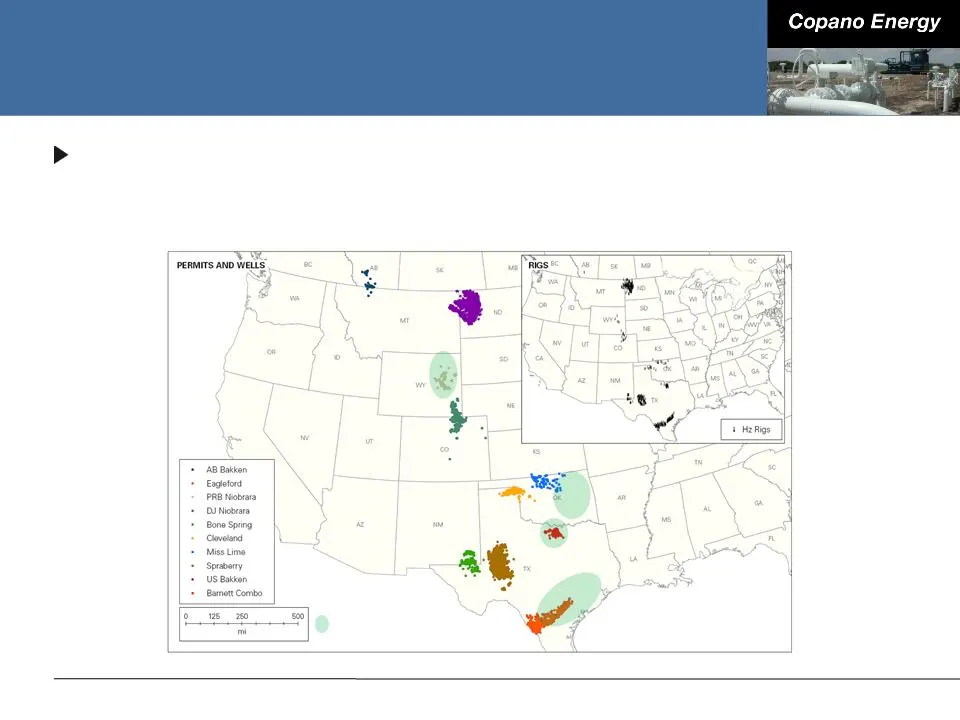
“High-Octane” Plays Copano currently has assets in four of the most active U.S. resource plays - Eagle Ford Shale, North Barnett Shale Combo, Mississippi Lime and Powder River Basin Niobrara Source: ITG (formerly RSEG). Copano assets
Slide 11: Rich Gas Benefit
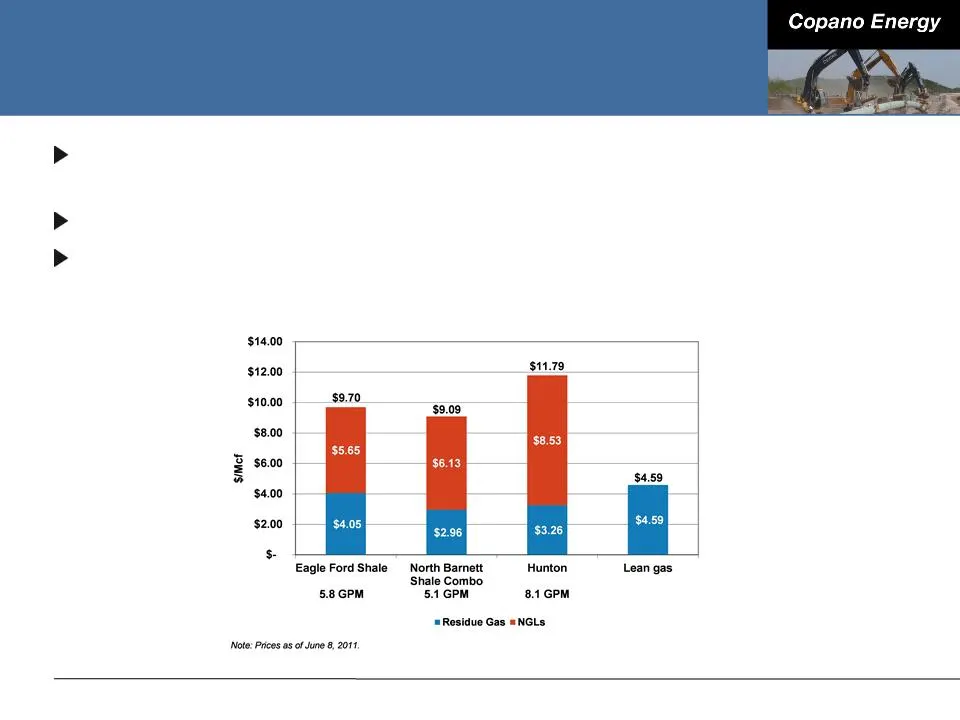
Rich Gas Benefit Upstream economics continue to drive producers toward oil and liquids-rich plays Copano has significant experience handling liquids-rich gas Significant additional infrastructure is needed to properly handle the liquids
Slide 12: Eagle Ford Shale Landscape
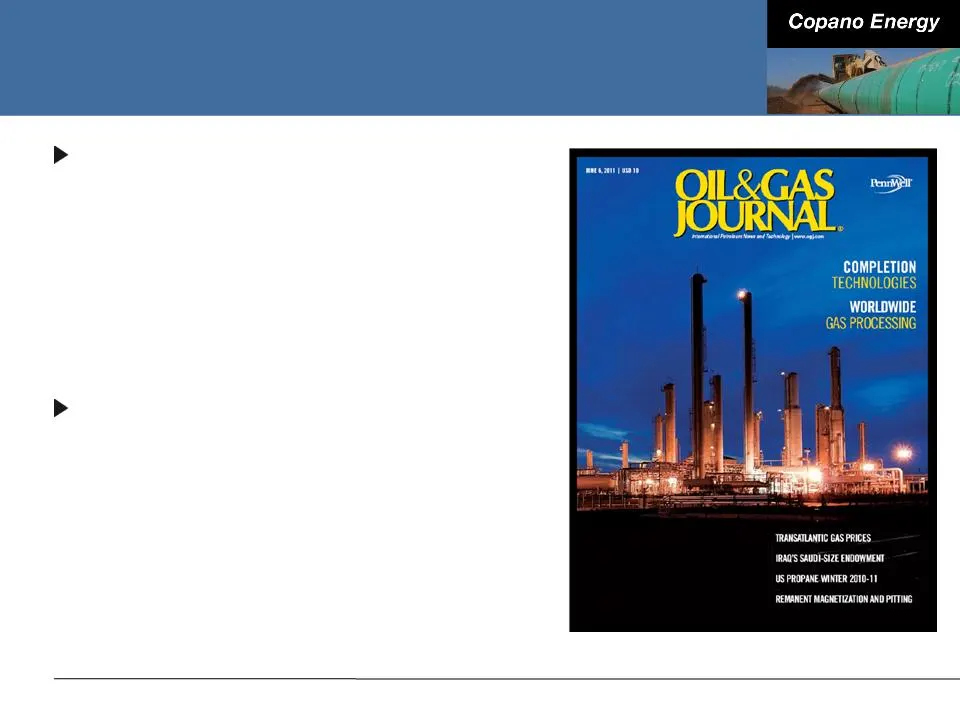
Eagle Ford Shale Landscape Used with permission of Oil & Gas Journal Significant producer activity with large upstream representation ■ Approximately 170 rigs currently running in the Eagle Ford Shale ■ Significant investment by offshore firms encouraging activity ■ Lack of completion crews and liqu
Slide 13: Eagle Ford Shale NGL Volume Growth Outlook
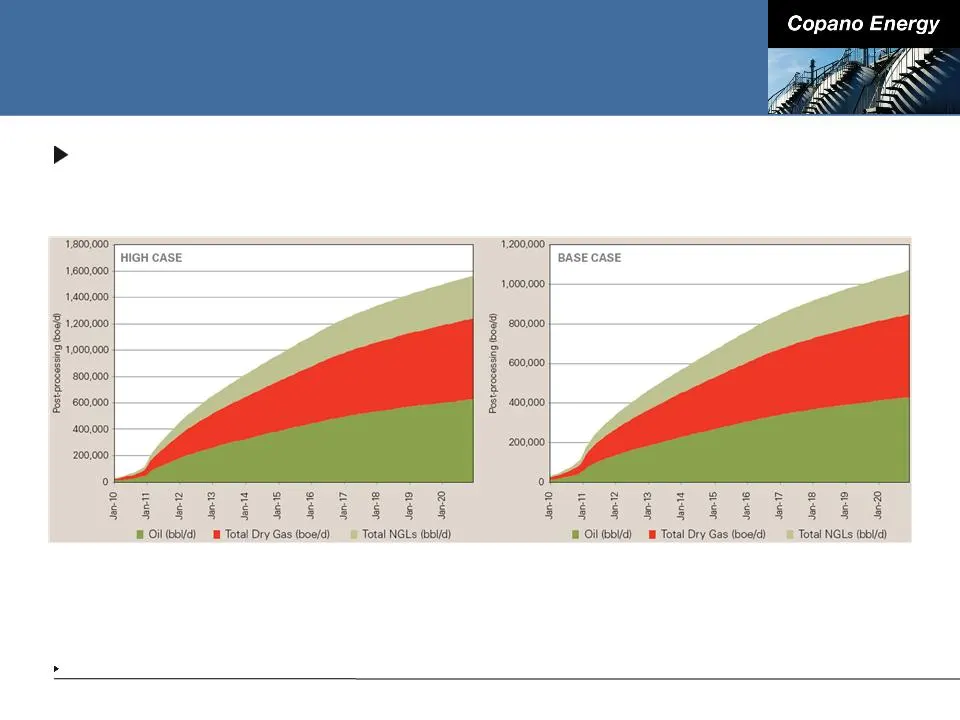
Eagle Ford Shale NGL Volume Growth Outlook Volume growth driven by oil and rich gas economics ■ Post-processing NGLs could be over 320,000 Bbls/d by year-end 2020 (1) Source: ITG (formerly RSEG). Source: ITG (formerly RSEG).
Slide 14: Solid Core Business Growth
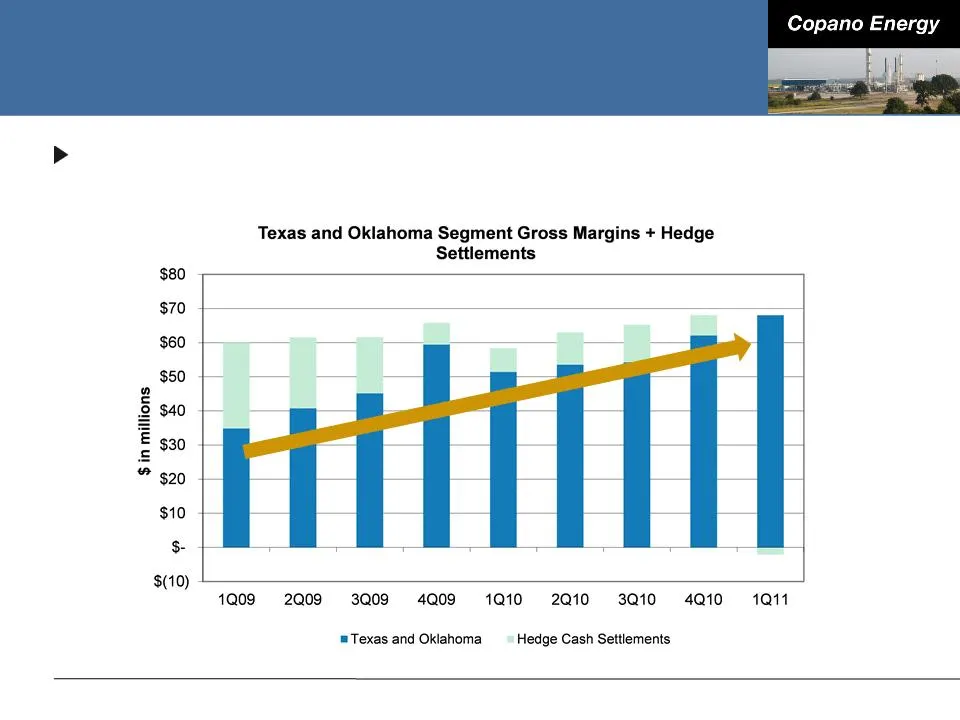
Solid Core Business Growth From 1Q 2009 to 1Q 2011, Texas and Oklahoma operating segment gross margins has increased approximately 95%
Slide 15: Significant Organic Growth Opportunities
Significant Organic Growth Opportunities Current areas of focus: ■ Eagle Ford Shale ■ North Barnett Shale Combo play ■ Woodford Shale ■ Mississippi Lime Total 2011 growth capex of over $400 million (1) ■ Expected to be invested at 5x multiple Already moving ahead with a new phase of Eagle Ford Shale
Slide 16: Other Midstream Value Chain Opportunities
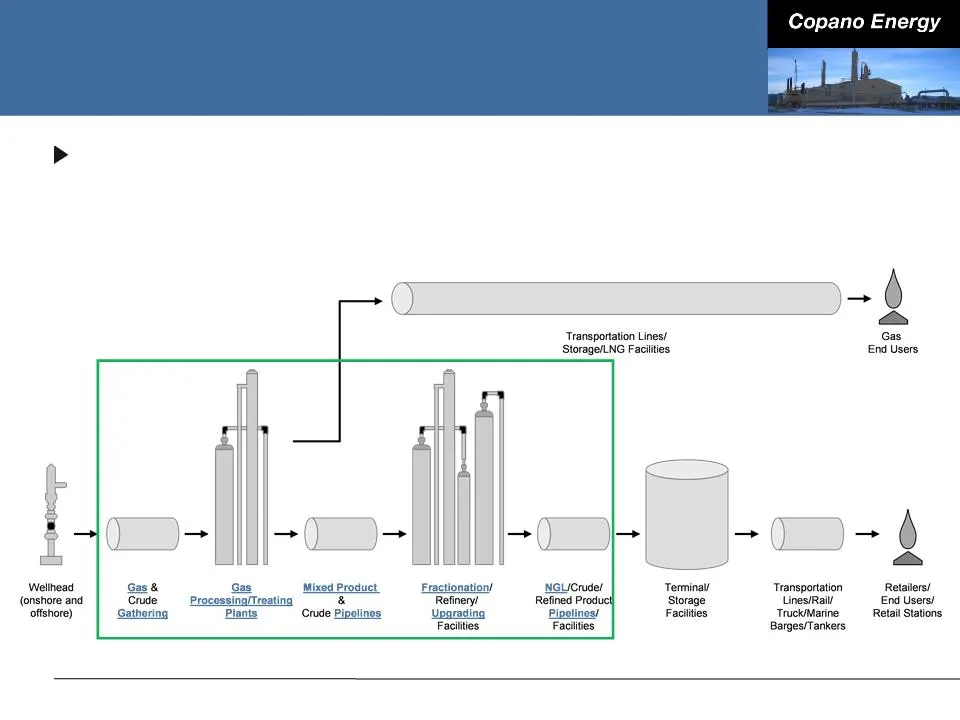
Other Midstream Value Chain Opportunities Further expansion into other businesses in the midstream value chain will help drive long-term value and improve stability of cash flows
Slide 17: Changing Contract Structure Results in More Predictable Cash Flows
Changing Contract Structure Results in More Predictable Cash Flows New projects are supported predominately by long-term, fee-based contracts with either volume commitments or acreage dedications ■ DK pipeline and extension ■ Eagle Ford Gathering JV ■ Fractionation expansion and Houston Central comp
Slide 18: Liquidity and Capital for Growth Plan
Liquidity and Capital for Growth Plan Approaching completion of several large capital projects with outlook for increasing cash flow following their completion ■ Volume growth in North Barnett Shale Combo steadily increasing ■ DK pipeline throughput averaging 115,000 MMBtu/d and awaiting completion
Slide 19: Market Trends
Market Trends Most drilling concentrated in new, unconventional shale plays ■ Significant midstream infrastructure required Due to liquids prices (oil and NGLs), upstream sector focused on rich gas and oil plays Regional basis differentials have been disrupted both for natural gas and liquids ■ Crea
Slide 20: Copano's Outlook on Commodity Prices
Copano’s Outlook on Commodity Prices We manage our business for performance through wide-ranging commodity price environments ■ Contracting ■ Hedging We expect natural gas prices to stay soft in the near term While oil has strengthened over the last year, potential demand management or demand destru
Slide 21: Executing Our Business Strategy
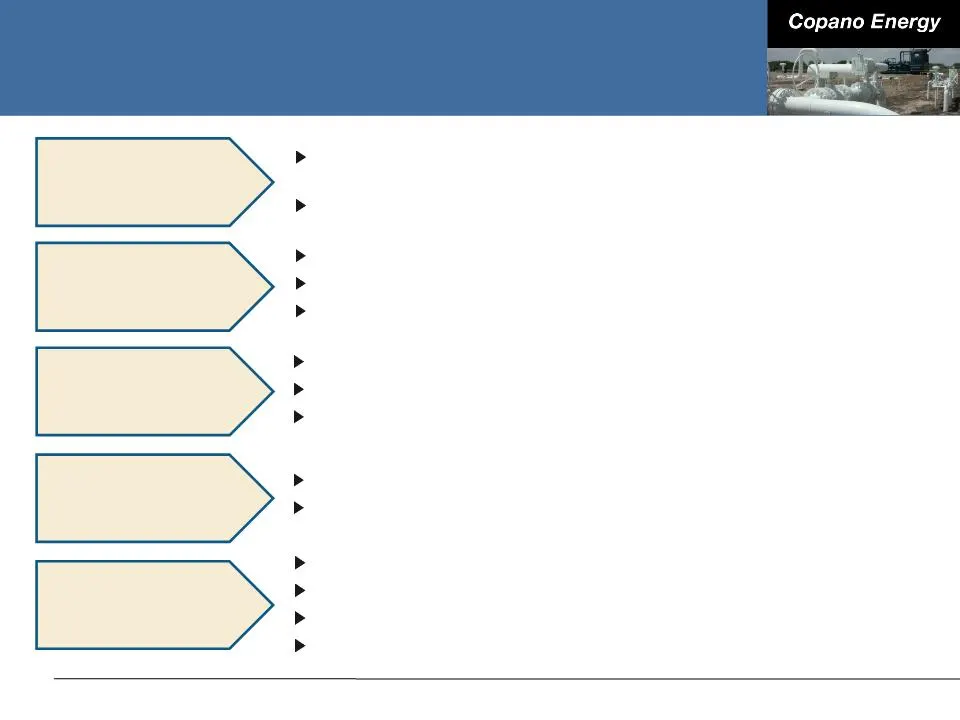
Executing Our Business Strategy Eagle Ford Shale, North Barnett Shale Combo, Woodford Shale and Mississippi Lime Acquisition of the Harrah and Davenport plants Organic Growth and Bolt-on Acquisition Maintaining Strong Balance Sheet Reduce Sensitivity to Commodity Prices Flexibility in Operations Lon
Slide 22: Oklahoma Segment
Oklahoma Segment Sharon Robinson
Slide 23: Oklahoma Overview
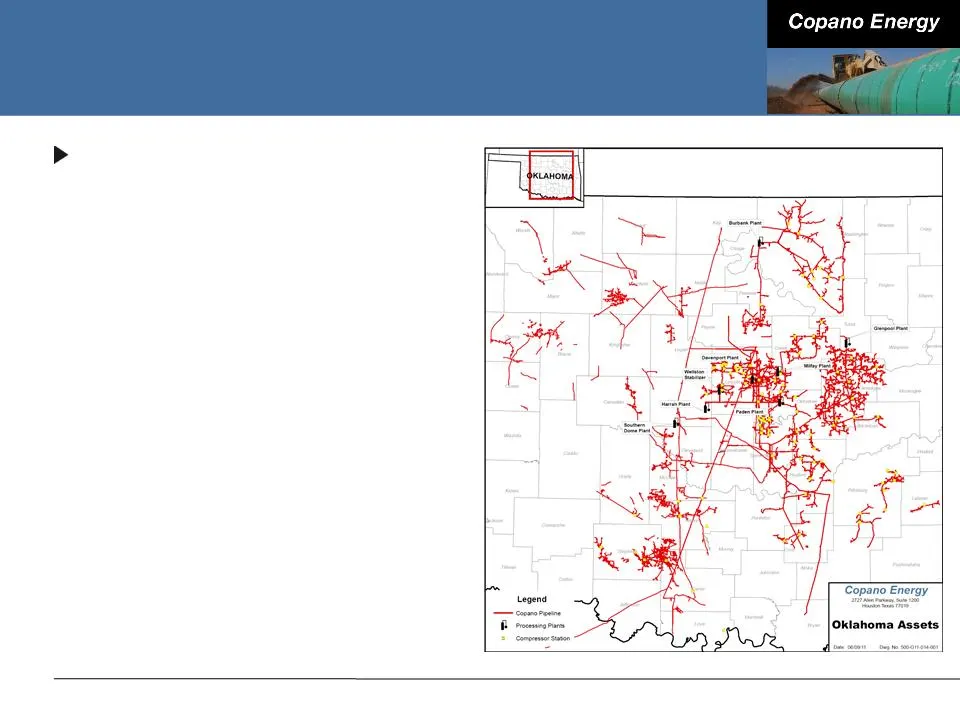
Oklahoma Overview Comprised of 9 gathering systems ■ Approximately 4,000 total miles of active pipelines ■ 7 processing plants - 236 MMcf/d processing capacity ● Paden (cryo/ref) 100 MMcf/d ● Harrah (cryo) 38 MMcf/d ● Southern Dome (ref) 30 MMcf/d ● Glenpool (cryo) 25 MMcf/d ● Milfay (ref) 15 MMcf/d
Slide 24: Stroud System
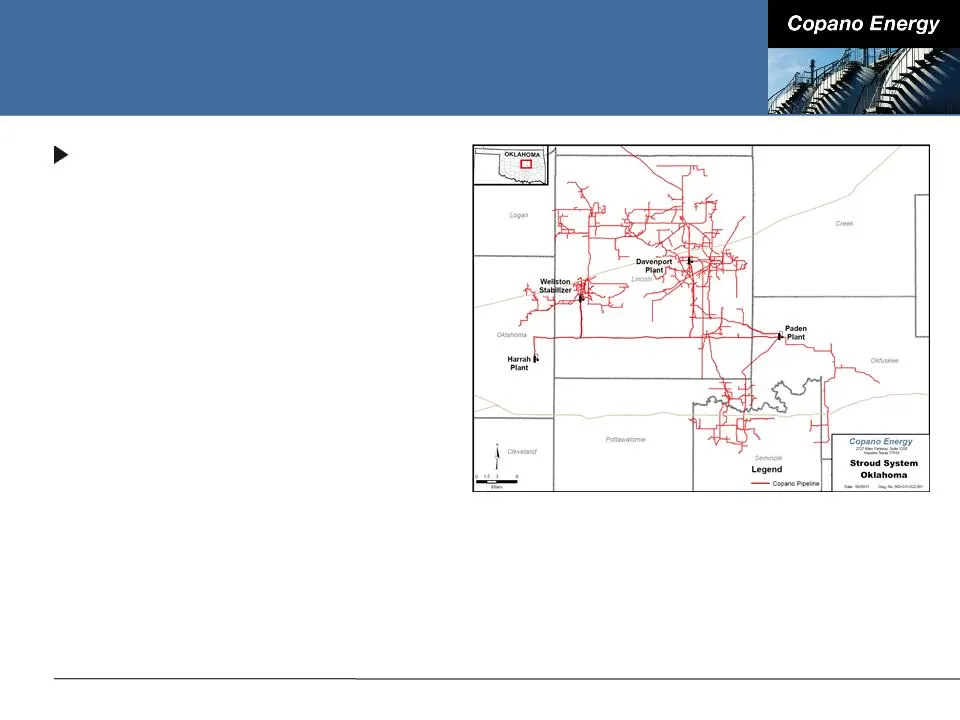
Stroud System Gathering and processing ■ 982 miles (2” - 16” in diameter) ■ Throughput capacity of approximately 121 MMcf/d ■ Current throughput of approximately 97 MMcf/d ■ Processing - 156 MMcf/d capacity ● Paden - 100 MMcf/d ● Harrah/Davenport - 56 MMcf/d ■ Nitrogen rejection facility - 48 MMcf/d
Slide 25: Stroud System
Stroud System Acquired Harrah plant (April 2011) ■ Processing plants ● Harrah with total capacity of 38 MMcf/d (two plants) ● Davenport with total capacity of 18 MMcf/d (idle) ■ Lowest cost expansion for processing in Stroud area ■ Decreased dependence on third-party processing ■ Potential growth fr
Slide 26: Stroud System Hunton Well Profile
Stroud System Hunton Well Profile Vertical depth: 4,500 ft. - 4,800 ft. (laterals of 3,000 ft. - 7,000 ft.) Drilling costs: $2.5 million - $3 million IP rate: 500 Mcf/d (peak of 750 Mcf/d - 1,000 Mcf/d) Water: Initially as high as 10,000 Bbls/d that decline over life of well Gas quality: Average of
Slide 27: Stroud System
Stroud System Primary producers with proven track records ■ New Dominion LLC (NDL) ■ Equal Energy Volume outlook ■ Expected to increase over the next few years as a result of: ● Continued drilling activity by NDL and Equal Energy ● New producers entering area ● Potential exploitation of additional z
Slide 28: Mountain Systems
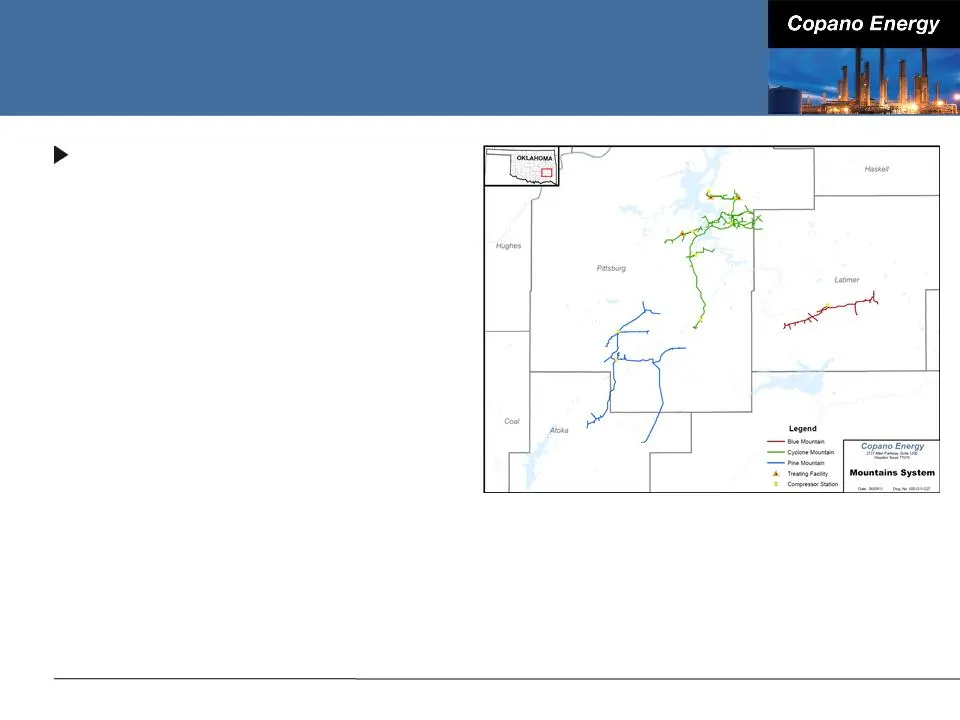
Mountain Systems Gathering ■ Comprised of three systems ● Cyclone Mountain - Pittsburg County ● Blue Mountain - Latimer County ● Pine Mountain - Pittsburg and Atoka Counties ■ 195 miles (2” - 20” in diameter) ■ Throughput capacity of approximately 154 MMcf/d ■ Current throughput of approximately 96
Slide 29: Mountain Systems Woodford Shale Well Profile
Mountain Systems Woodford Shale Well Profile Vertical depth: 8,000 ft. - 12,600 ft. (laterals of 4,500 ft. - 7,500 ft.) Drilling & completion cost: $4.5 million - $5.5 million IP rate: 4,000 Mcf/d - 6,500 Mcf/d (peak of 10,000 Mcf/d) Reserves per well: 4.5 Bcf - 6.0 Bcf Gas quality: 940 Btu 3.5% - 6
Slide 30: Mountain Systems
Mountain Systems Primary producers ■ PetroQuest Energy ■ XTO Energy ■ Continental Resources ■ Antero Resources Volume outlook ■ Volumes are expected to significantly increase in 2011 due to Woodford Shale development on Cyclone Mountain system ● Major producer is very encouraged by results ● Improve
Slide 31: Osage System
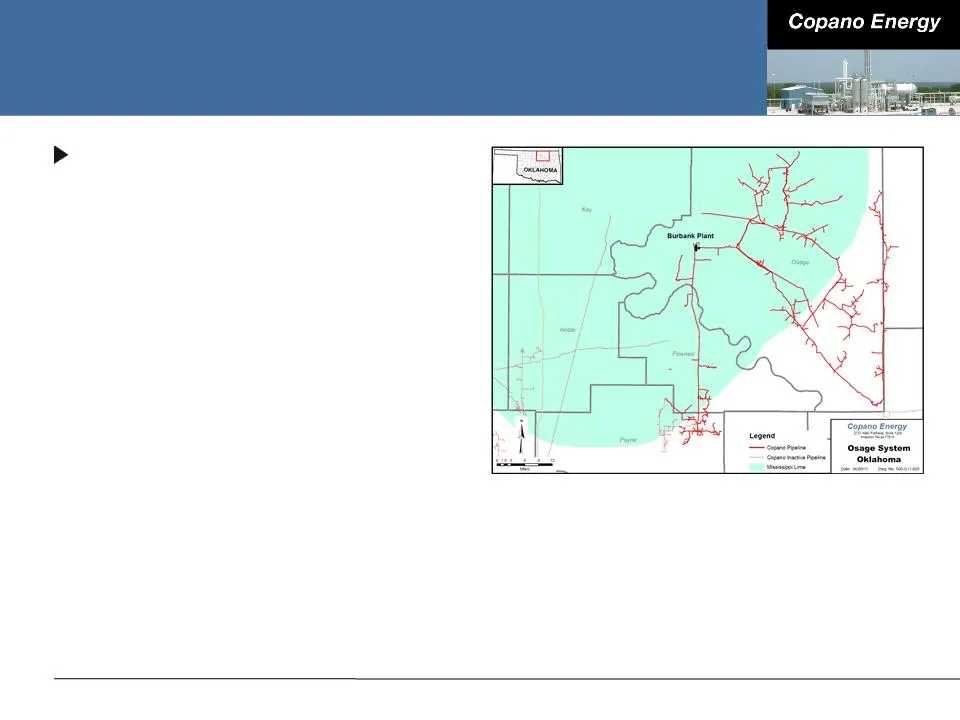
Osage System Gathering and processing ■ 563 miles (2” - 8” in diameter) ■ Throughput capacity of approximately 32 MMcf/d ■ Current throughput of approximately 18 MMcf/d ■ Processing - Burbank plant (propane refrigeration) ● 10 MMcf/d capacity ■ Residue gas delivered to Post Rock KPC Pipeline ■ NGLs
Slide 32: Osage System Mississippi Lime Well Profile
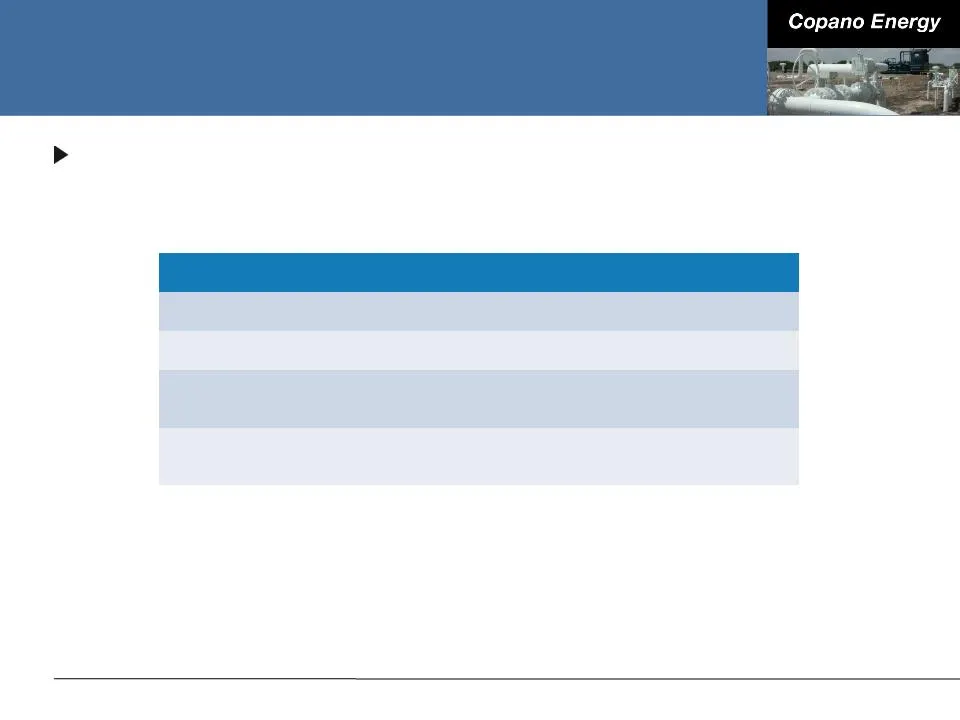
Osage System Mississippi Lime Well Profile Vertical depth: 4,000 ft. - 6,000 ft. Drilling costs: $1.0 million - $2.5 million IP rates: Initial results vary 40 Mcf/d - 700 Mcf/d Gas quality: 1,100 Btu - 1,600 Btu 8% - 15% nitrogen New primary producing formation - Mississippi Lime ■ Emerging play, ho
Slide 33: Osage System
Osage System Existing primary producers ■ CEP Mid-Continent ■ Chaparral Energy ■ Mt. Dora Energy ■ Spyglass Energy Gas quality ■ 60/40 ratio of lean to rich gas ■ Current producing trend is toward the rich gas Volume outlook ■ Rich gas volumes expected to increase based on the leasing/permitting act
Slide 34: Osage System - Mississippi Lime
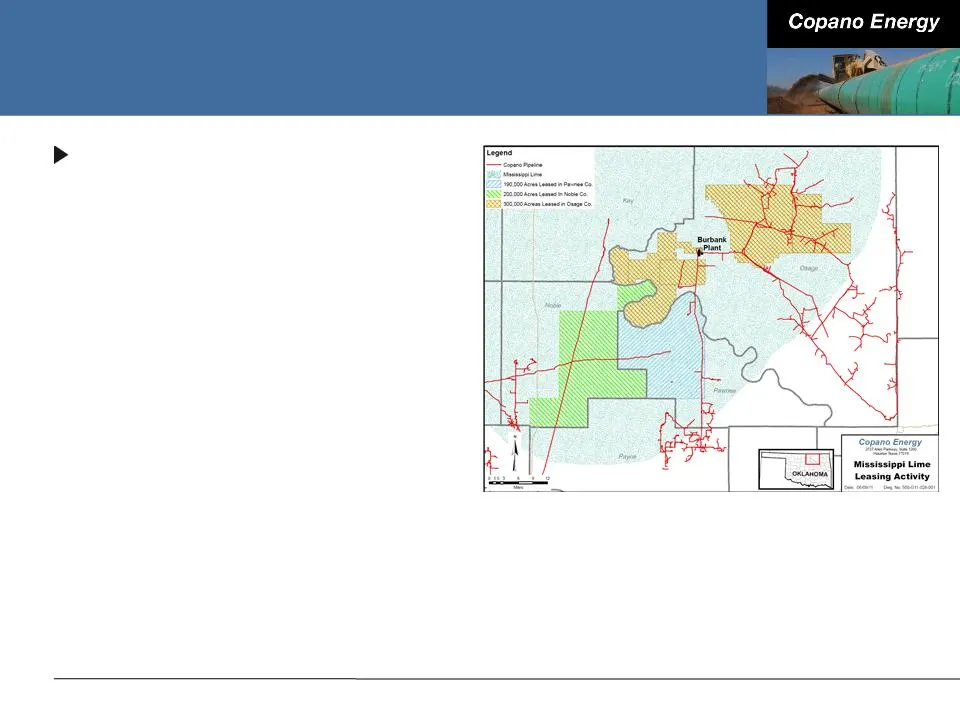
Osage System - Mississippi Lime Leasing activity ■ Over 800,000 acres have been leased within the last 12 months in Osage, Noble and Pawnee Counties ● 82% of these acres are in close proximity to Copano’s assets ■ Over a dozen producers actively leasing, including: ● SandRidge Energy ● Ram Energy ●
Slide 35: Osage System - Mississippi Lime
Osage System - Mississippi Lime Gathering and processing capabilities ■ Approximately 150 miles of idle pipe, acquired in 2007, is available for activation and integration into the Osage system ■ Processing ● Potential Burbank plant expansion ● Paden plant ● Third-party processing Producer activity
Slide 36: Growth Opportunities - Stroud System
Growth Opportunities - Stroud System Producers in the Hunton are looking to develop additional zones Over the next 2 - 3 years, there is the potential for as many as 4 - 6 additional rigs move into the area currently served by the Stroud system Copano’s existing midstream infrastructure is a key com
Slide 37: Growth Opportunities - Mountain Systems
Growth Opportunities - Mountain Systems Copano is strategically positioned with large diameter pipe in this area of the Woodford Shale Average system volumes have increased approximately 25% since the beginning of 2011 to 85 MMcf/d on Cyclone Mountain system (95% is Woodford Shale) Major Woodford Sh
Slide 38: Growth Opportunities - Mississippi Lime
Growth Opportunities - Mississippi Lime Many producers are very active in leasing acreage Existing Copano infrastructure gives us a strategic advantage Predominant oil play points to rapid development of reserves independent of price curve for natural gas ■ Associated natural gas will require proces
Slide 39: Rocky Mountains Segment
Rocky Mountains Segment Sharon Robinson
Slide 40: Rocky Mountains
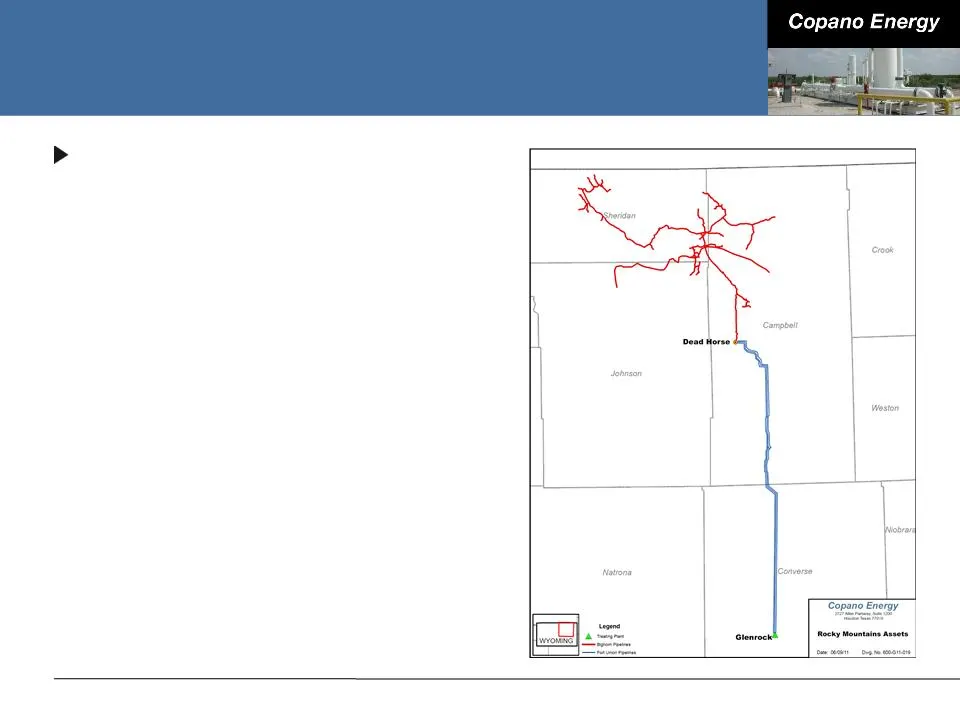
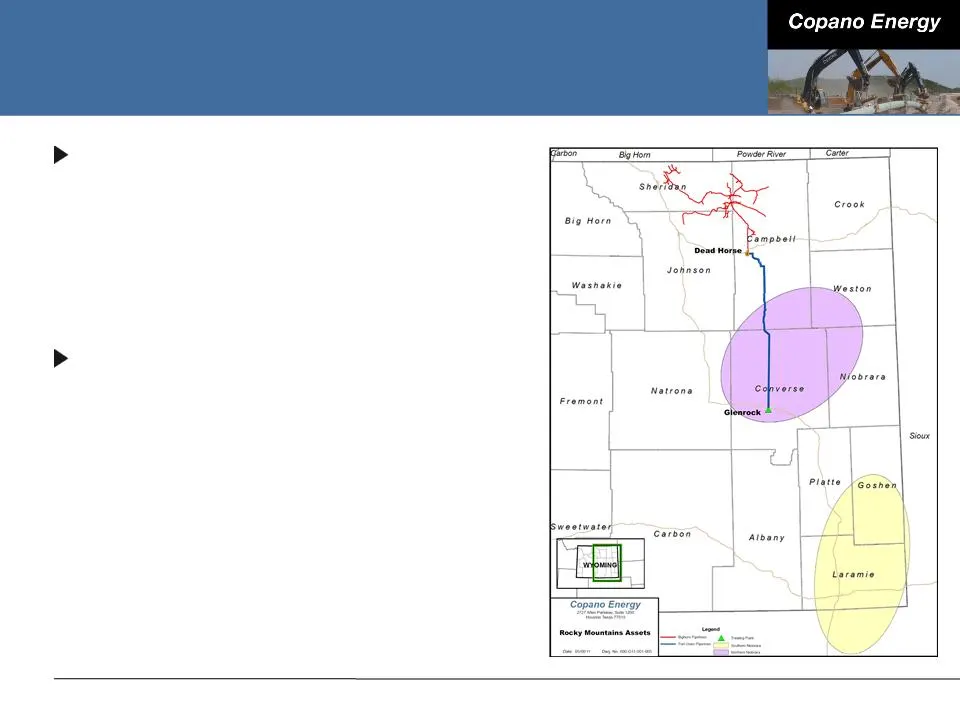
Rocky Mountains Gathering and treating ■ Two gathering systems ● Bighorn Gas Gathering (51% managing member interest) ● Fort Union Gas Gathering (37.04% managing member interest) ■ 591 miles (6” - 24” in diameter) ■ Throughput capacity of approximately 1.6 Bcf/d ■ Current throughput of approximately
Slide 41: Bighorn Gas Gathering
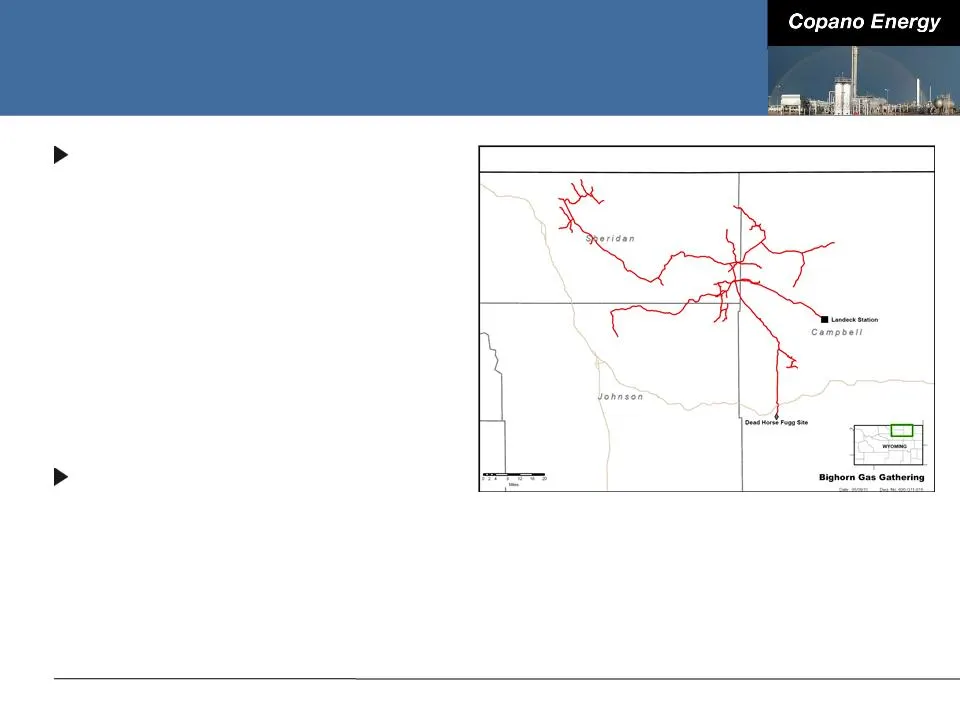
Bighorn Gas Gathering Gathering ■ 273 miles of pipeline (6” - 24” in diameter) ■ Throughput capacity of approximately 300 MMcf/d ■ Current throughput of approximately 143 MMcf/d ■ 53,000 HP of compression ■ Low and high pressure service ■ Gas quality - 100% lean gas (coal bed methane - no processing
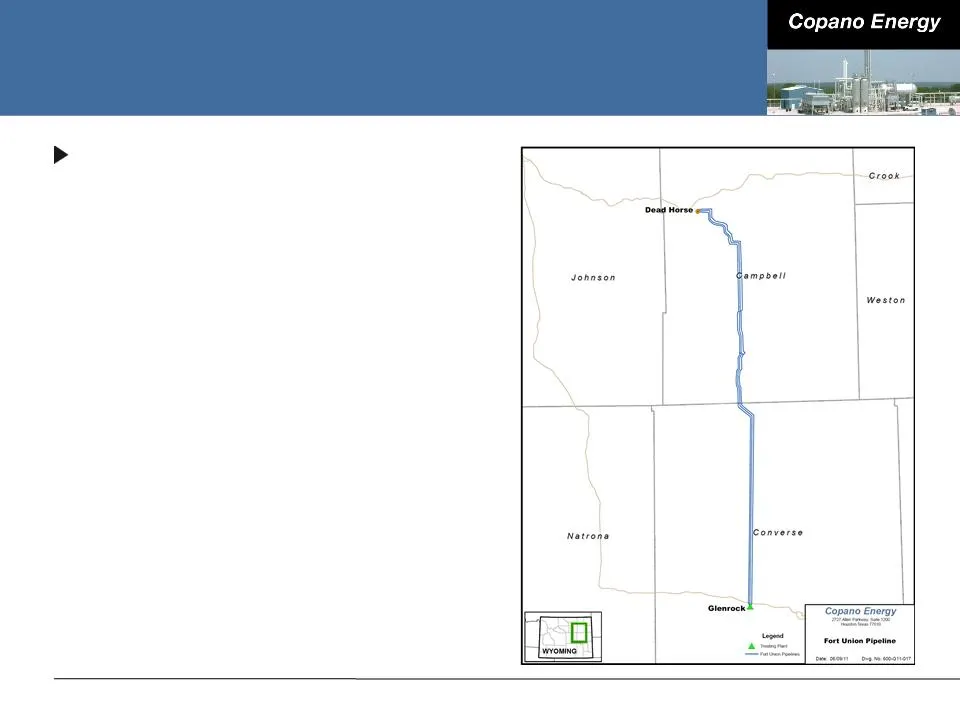
Slide 42: Fort Union Gas Gathering
Fort Union Gas Gathering Gathering and treating ■ High pressure gas gathering system ■ Three parallel 24”, 106-mile pipelines ■ 1.25 Bcf/d of throughput capacity ■ 1,500 GPM of treating capacity ■ Market deliveries to WIC, CIG, and Kinder Morgan ■ Gas quality - 100% lean gas with treating for CO 2 r
Slide 43: Rocky Mountains Volume Outlook
Rocky Mountains Volume Outlook Drilling activity minimal due to pricing environment ■ Producer discussions indicate sustained pricing above $4.30/MMBtu needed to stimulate drilling Consolidation among producers has begun; could signal potential increase in producer activity ■ Producers will have a l
Slide 44: Growth Opportunities - Rocky Mountains
Growth Opportunities - Rocky Mountains Southern Niobrara (DJ Basin area) ■ Centered in southeastern Wyoming and northeastern Colorado ■ Growing producer activity, with mixed results ■ Primarily an oil-directed play with associated rich gas Northern Niobrara (Powder River Basin area) ■ Centered in ce
Slide 45: Conclusions - Oklahoma & Rocky Mountains
Conclusions - Oklahoma & Rocky Mountains Oklahoma ■ Exploit our gathering and processing footprint ■ Continue to pursue growth opportunities in the Woodford Shale and Mississippi Lime Rocky Mountains ■ Consolidation and restructuring by producers ■ Actively engaged in the emerging Niobrara play

Slide 46: Texas Segment
Texas Segment Jim Wade
Slide 47: Copano's Texas Operations
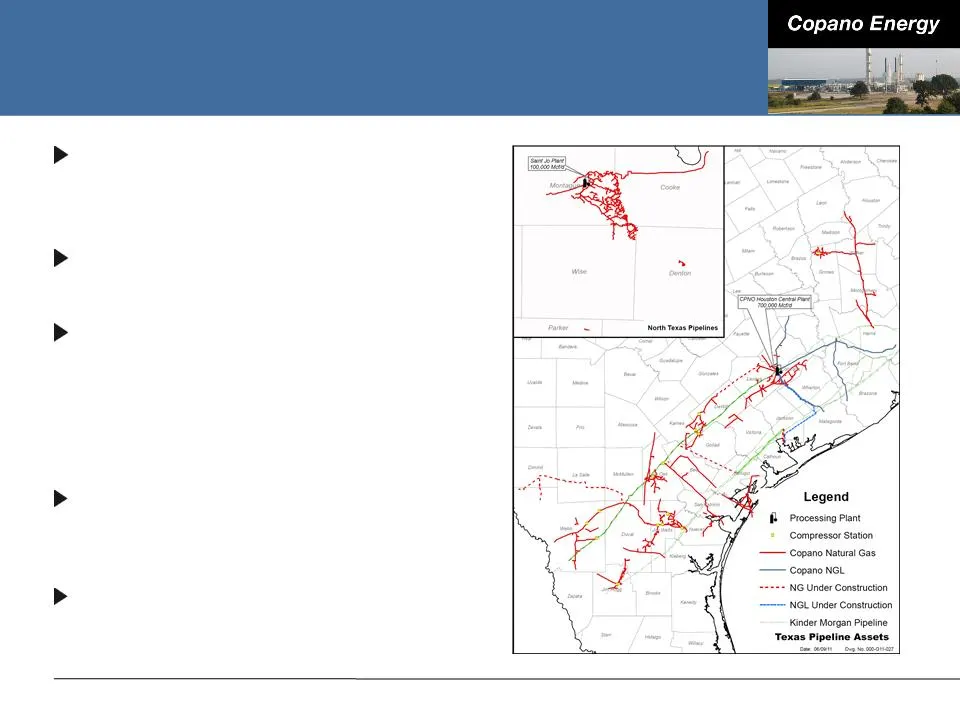
Copano’s Texas Operations Approximately 2,000 miles of natural gas pipelines 260 miles of NGL pipelines 1 Bcf/d processing capacity ■ Houston Central complex ■ Saint Jo ■ Lake Charles (idle) 22,000 Bbls/day of fractionation capacity Current service throughput of approximately 700,000 MMBtu/d
Slide 48: Primary Focus Areas in Texas
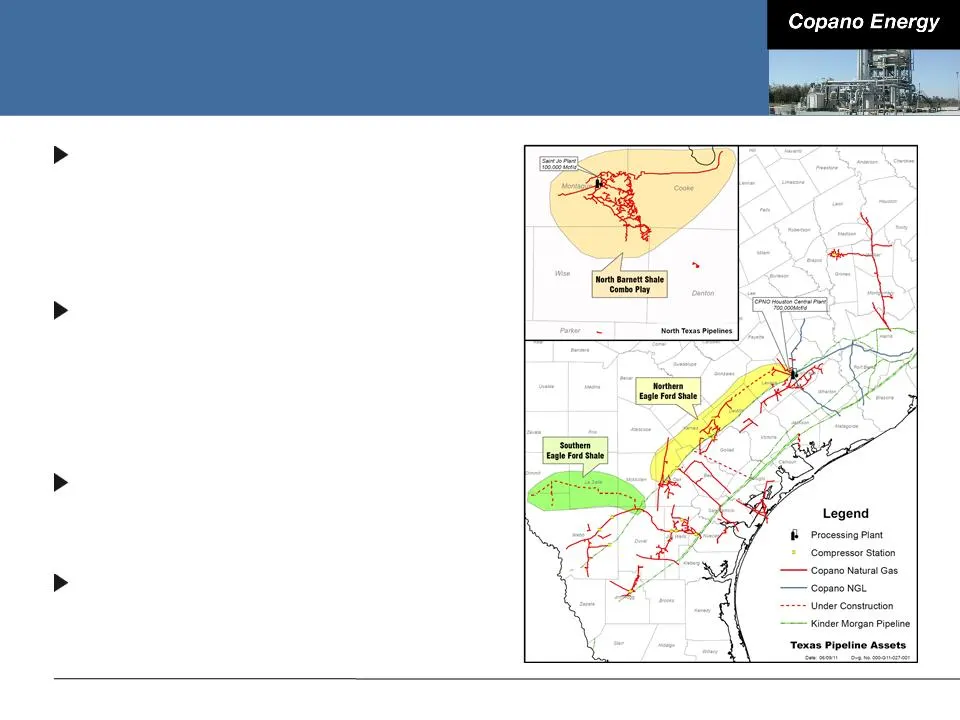
Primary Focus Areas in Texas Northern Eagle Ford Shale ■ DK pipeline and extension ■ Live Oak / Fashing system ■ Live Oak, DeWitt, Karnes and Lavaca Counties Southern Eagle Ford Shale ■ Eagle Ford Gathering LLC, a joint venture between Copano and Kinder Morgan ■ LaSalle, McMullen, Dimmitt and Webb C
Slide 49: Copano's Eagle Ford Shale Strategy
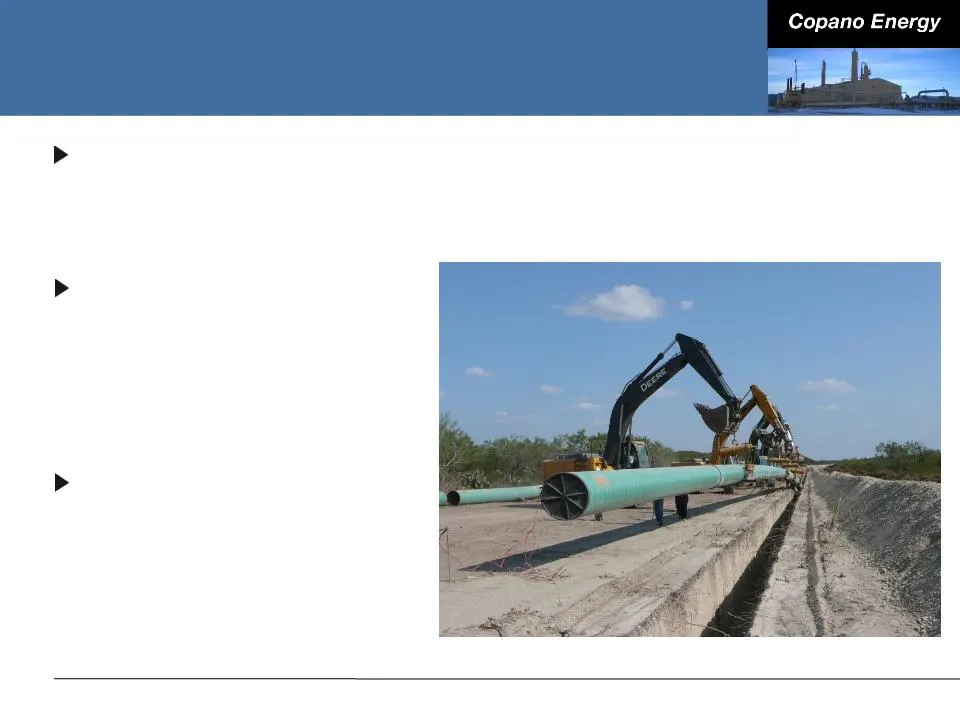
Copano’s Eagle Ford Shale Strategy Utilize existing assets as a platform to provide additional midstream solutions for rich Eagle Ford Shale production well in excess of 1 Bcf/d of gas and over 100,000 Bbls/d of NGLs Existing assets ■ Gathering ■ Processing ■ Fractionation ■ NGL transportation Execu
Slide 50: Northern Eagle Ford Shale
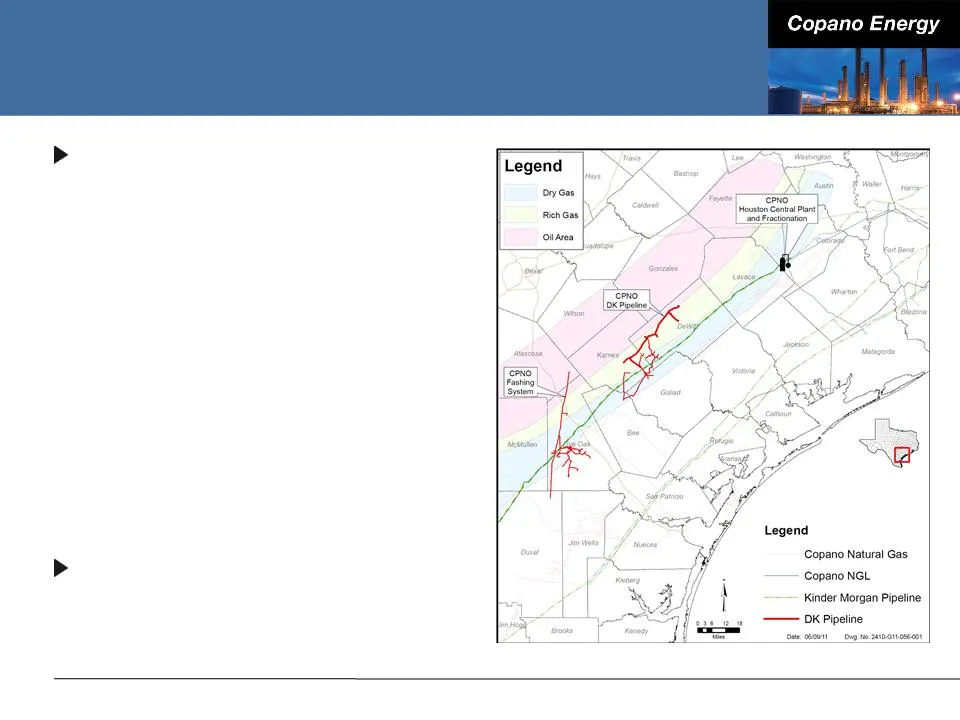
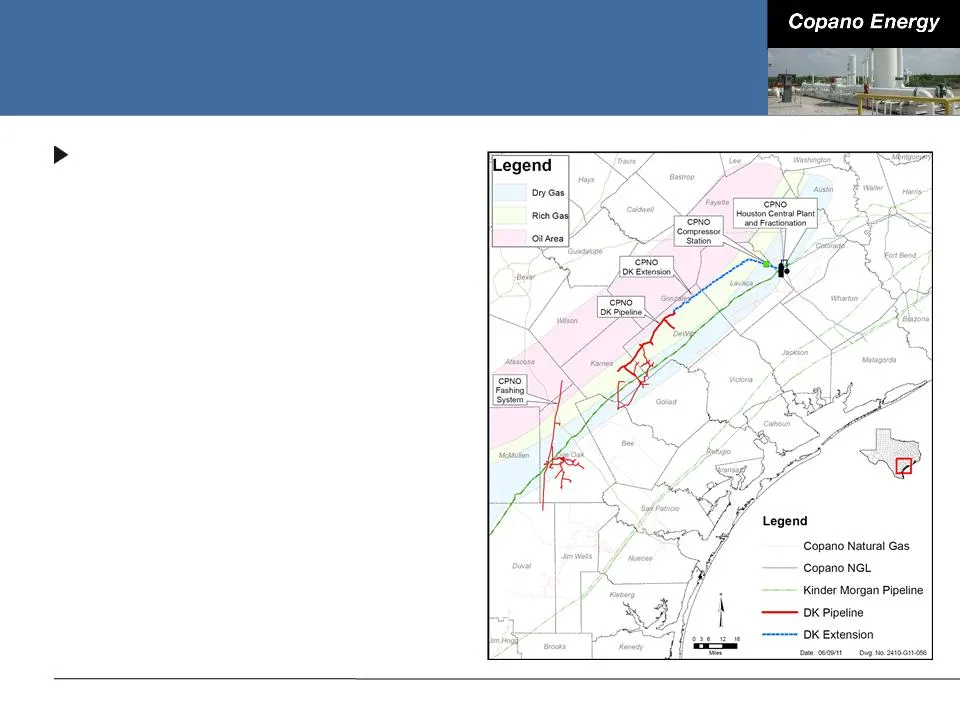
Northern Eagle Ford Shale DK pipeline ■ Capacity of 225,000 MMBtu/d ● Current throughput of approximately 115,000 MMBtu/d ■ 38 miles of 24” pipe placed into full service October 2010 ■ Services the most prolific rich gas window in the Eagle Ford Shale ■ Key producer contracts with Abraxas, GeoSouthe
Slide 51: Northern Eagle Ford Shale
Northern Eagle Ford Shale DK extension ■ February 2011 - announced extension of existing pipeline back to Houston Central complex ● Additional 58 miles of 24” pipe ■ Loops Kinder Morgan’s Index 50 pipeline, effectively boosting pipeline capacity to Houston Central complex ■ Extension to Houston Cent
Slide 52: Southern Eagle Ford Shale
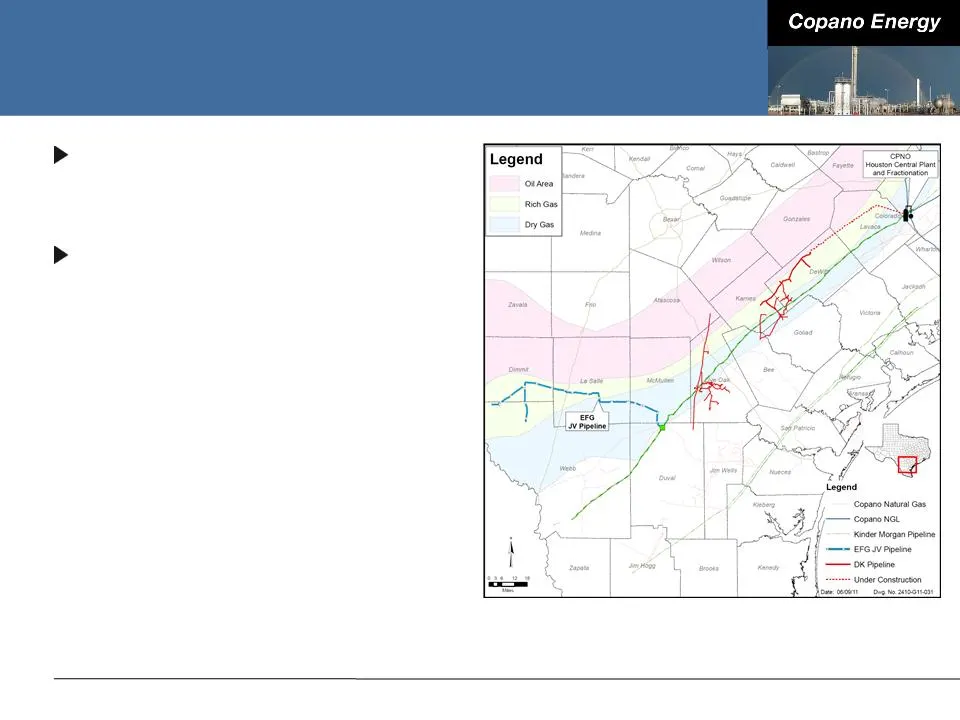
Southern Eagle Ford Shale Eagle Ford Gathering (EFG) ■ 50/50 JV with Kinder Morgan EFG pipeline ■ 117 miles of 30” and 24” pipe - currently under construction ■ Nominal capacity of 600,000 MMBtu/d ■ Long-term, fee-based contracts with aggregate volume commitments approaching 500,000 MMBtu/d ● SM Ene
Slide 53: EFG Crossover Project
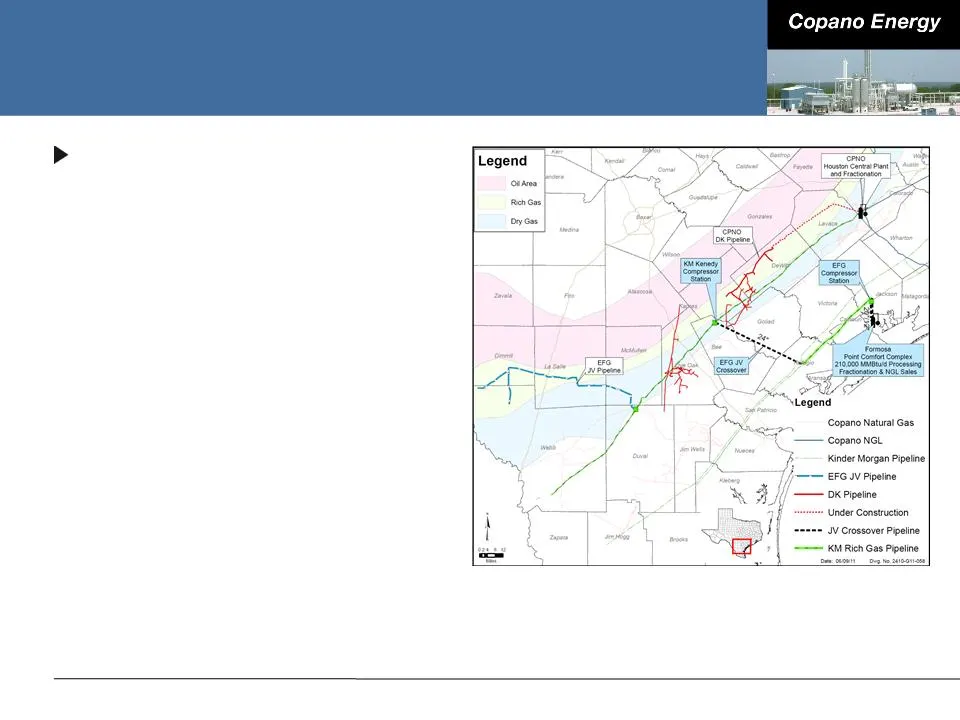
EFG Crossover Project Crossover project ■ 66 miles of 24” and 20” pipe connecting Kinder Morgan’s Index 50 and Tejas 30” pipelines to Formosa ● Nominal pipeline capacity of 400,000 MMBtu/d ■ Allows an incremental 210,000 MMBtu/d of gas to flow on EFG 30” pipeline ■ Processing, fractionation and prod
Slide 54: EFG Crossover Project Extension
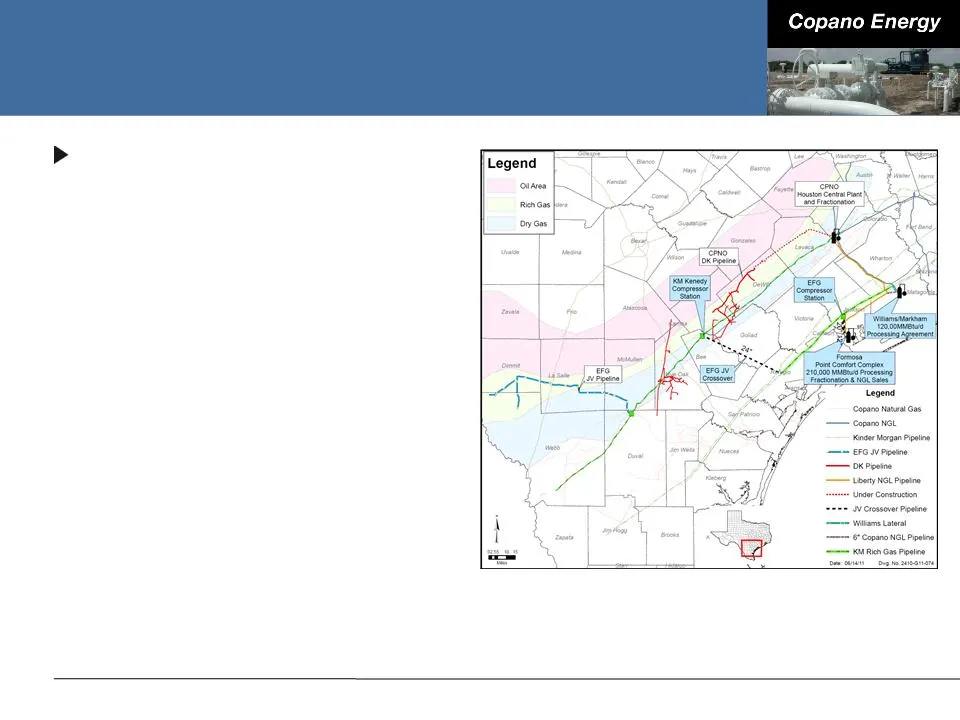
EFG Crossover Project Extension Extension to Williams Partners’ Markham plant ■ Long-term contract with Williams Partners’ to initially process 100 MMcf/d with an option to increase to 200 MMcf/d ■ EFG constructing 7 miles of 20” pipe connecting Kinder Morgan’s Tejas 30” pipeline to Markham plant (p
Slide 55: Houston Central Complex
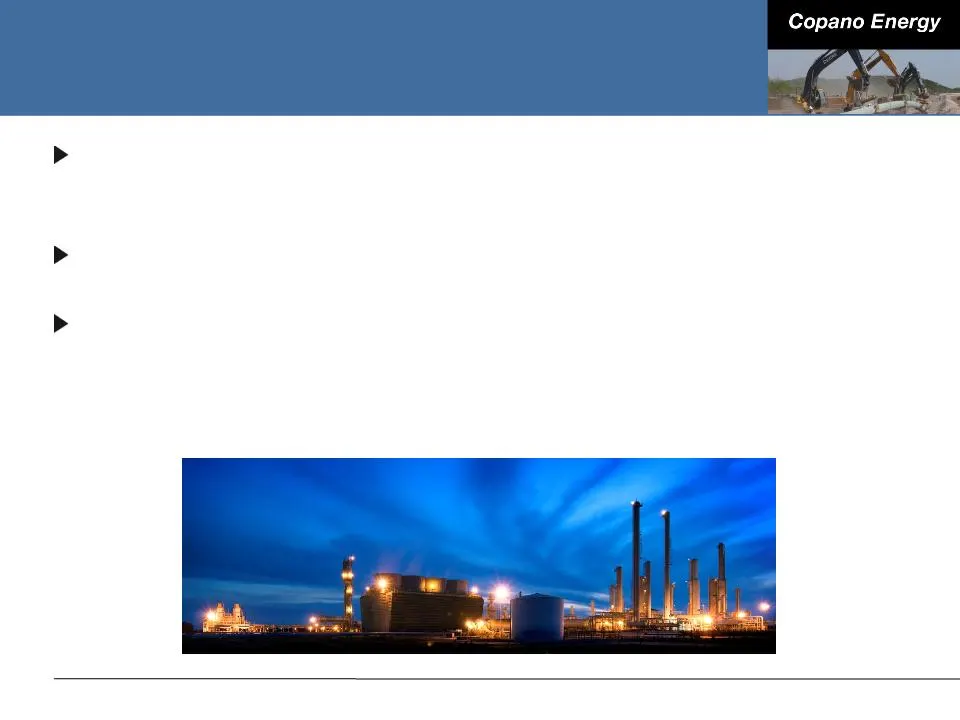
Houston Central Complex Current capacity of 700 MMcf/d ■ 500 MMcf/d of lean oil processing ■ 200 MMcf/d of cryogenic processing Multiple residue interconnects ■ Anticipated additional connection - Tres Palacios storage and header system Cryogenic processing expansion of 400 MMcf/d in process ■ Impro
Slide 56: Houston Central Complex
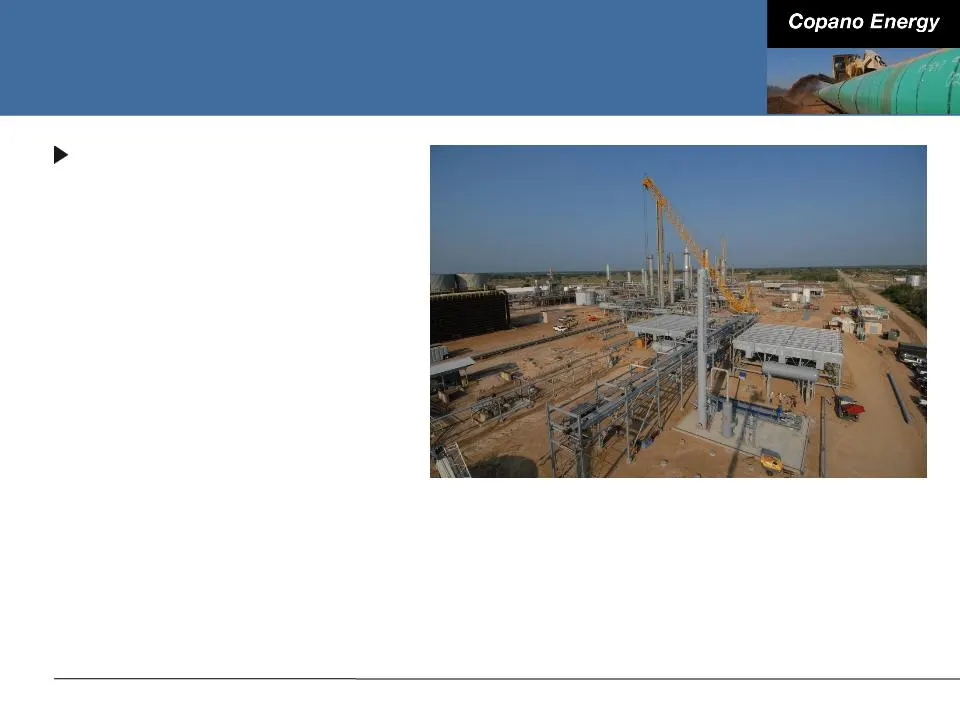
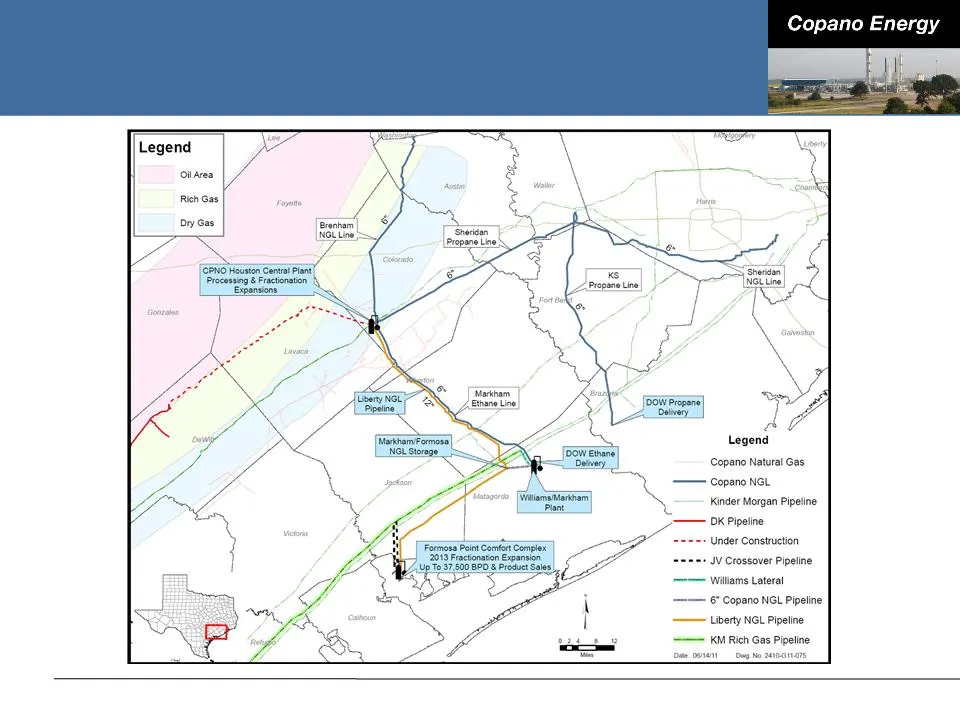
Houston Central Complex Fractionation expansion ■ Responding to increased producer demand, liquids handling capacity at Houston Central complex will double ■ Fractionation expansion from 22,000 Bbls/d to 44,000 Bbls/d ● All ethane and propane will move to Dow through Copano purity pipelines ■ Total
Slide 57: Liberty NGL Pipeline
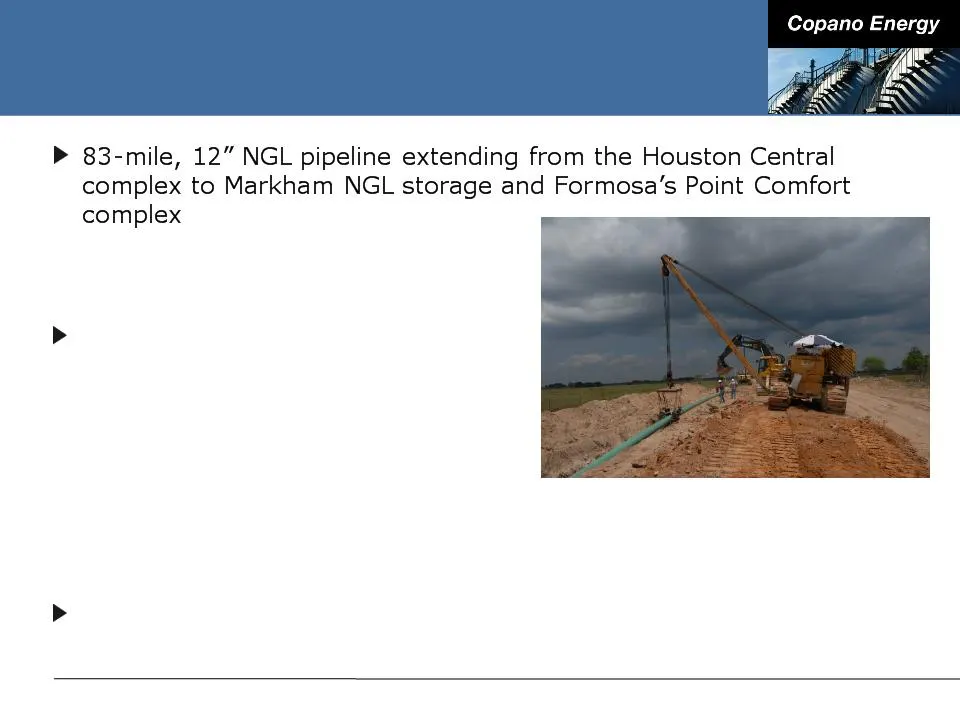
Liberty NGL Pipeline ■ Total capacity of 75,000 Bbls/d ■ Constructed through 50/50 JV with Energy Transfer Long-term fractionation and product sales agreement with Formosa on favorable terms ■ Initial access to a minimum of 5,000 Bbls/d - 7,000 Bbls/d following Liberty NGL pipeline completion ■ Upon
Slide 58: Houston Central NGL Infrastructure
Houston Central NGL Infrastructure
Slide 59: Gulf Coast Petrochemical Market Access
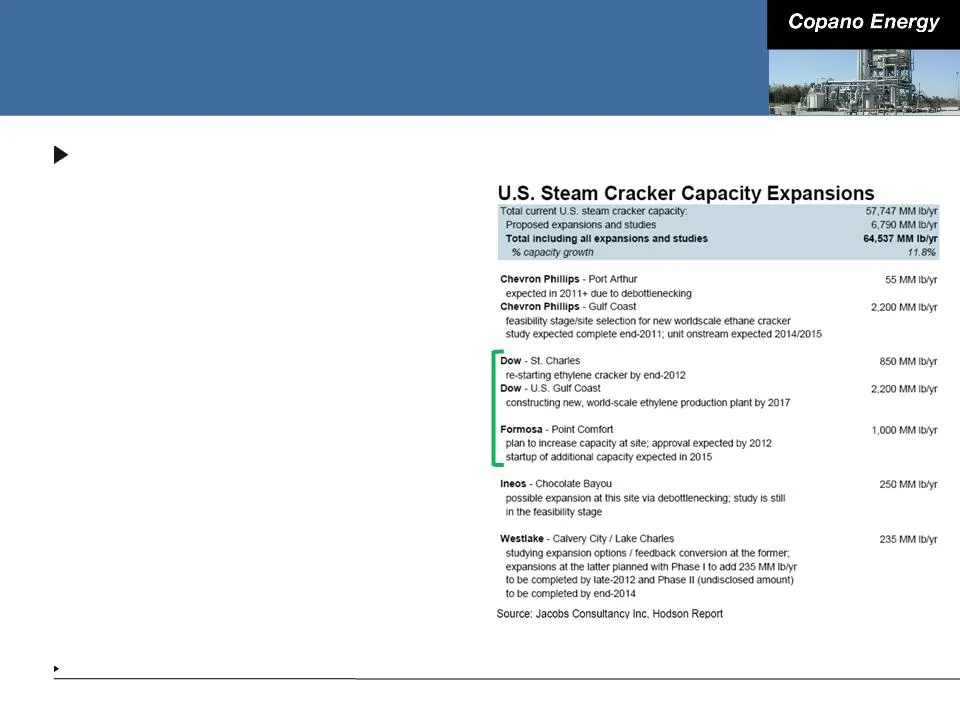
Gulf Coast Petrochemical Market Access Copano has access to Dow and, upon completion of the Liberty NGL pipeline, Formosa ■ Among the largest end users of NGLs in the U.S. ■ Taking into account announced expansions, Dow and Formosa’s combined steam cracker capacity is approximately 19% of total U.S.
Slide 60: Summary of Eagle Ford Shale Infrastructure
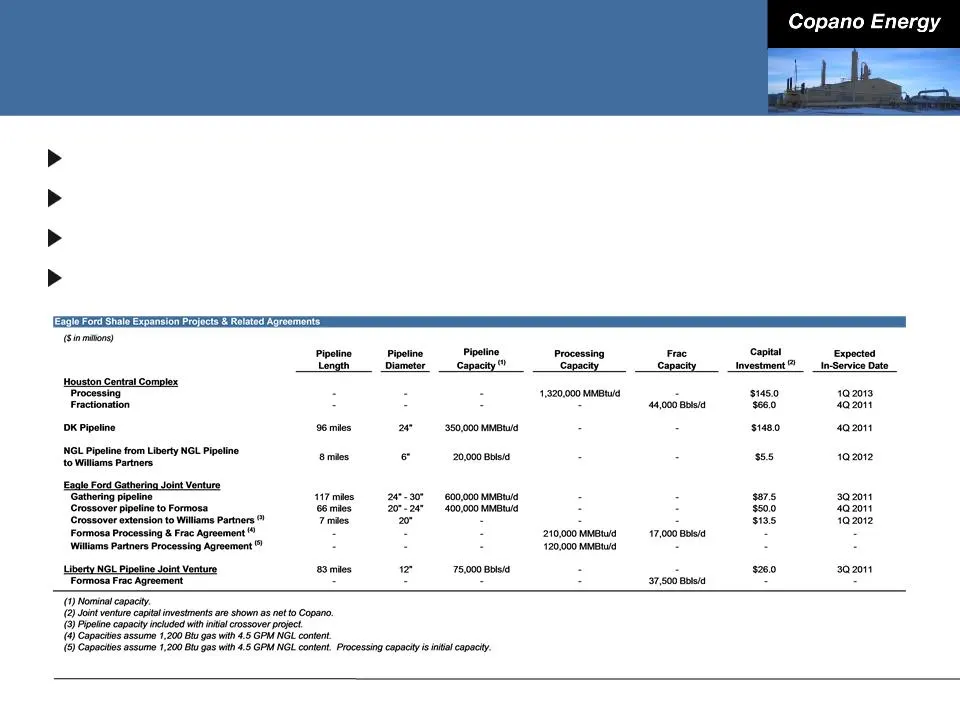
Summary of Eagle Ford Shale Infrastructure Total capital investment of over $500 million Well in excess of 1 Bcf/d of pipeline and processing capacity Exceeding 100,000 Bbls/d of fractionation capacity Access to multiple markets for residue gas and NGLs
Slide 61: Combined Eagle Ford Shale Map
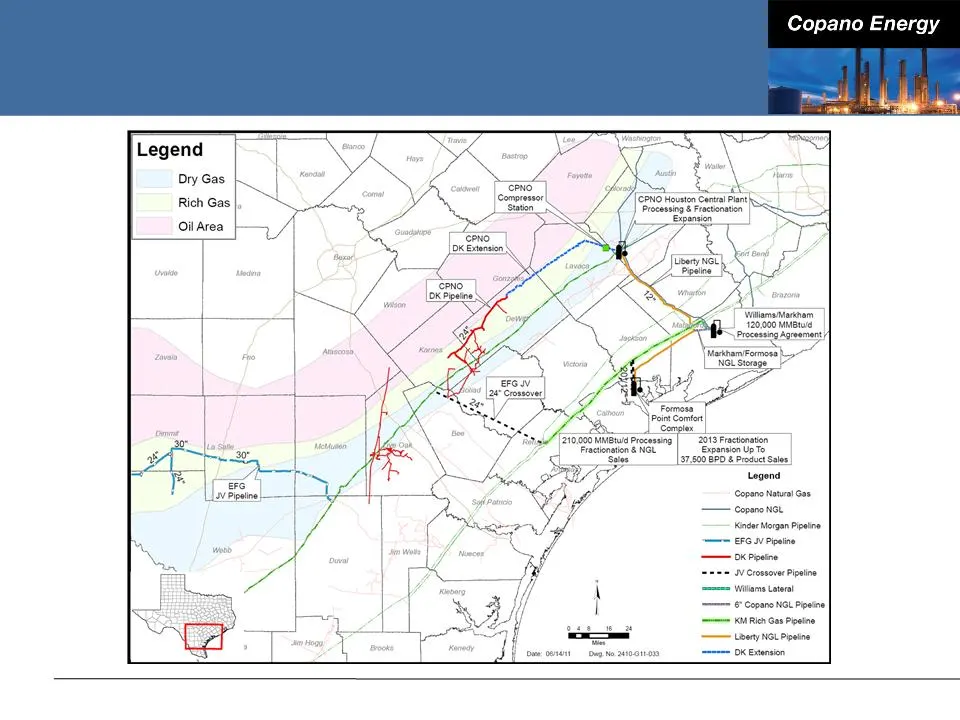
Combined Eagle Ford Shale Map
Slide 62: Eagle Ford Shale Volume Outlook
Eagle Ford Shale Volume Outlook Copano’s total Eagle Ford Shale volumes have been averaging approximately 130,000 MMBtu/d EFG 30” pipeline expected to be in service September 2011 as originally forecasted ■ Interruptible volumes not expected to flow before September 2011 in-service date As our growt
Slide 63: Growth Opportunities - Eagle Ford Shale
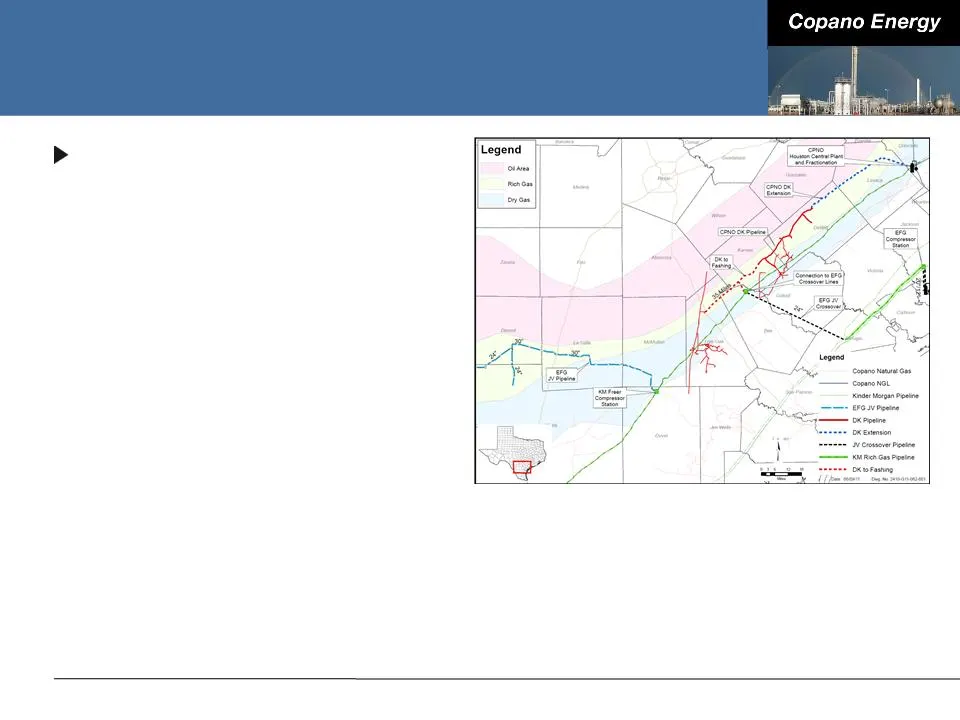
Growth Opportunities - Eagle Ford Shale Potential extension of DK pipeline to Fashing / Live Oak system ■ Continues loop of Kinder Morgan’s Index 50 pipeline through the Eagle Ford Shale condensate window ■ Ties additional existing Copano gathering systems directly to Houston Central complex ■ Provi
Slide 64: Growth Opportunities - Eagle Ford Shale
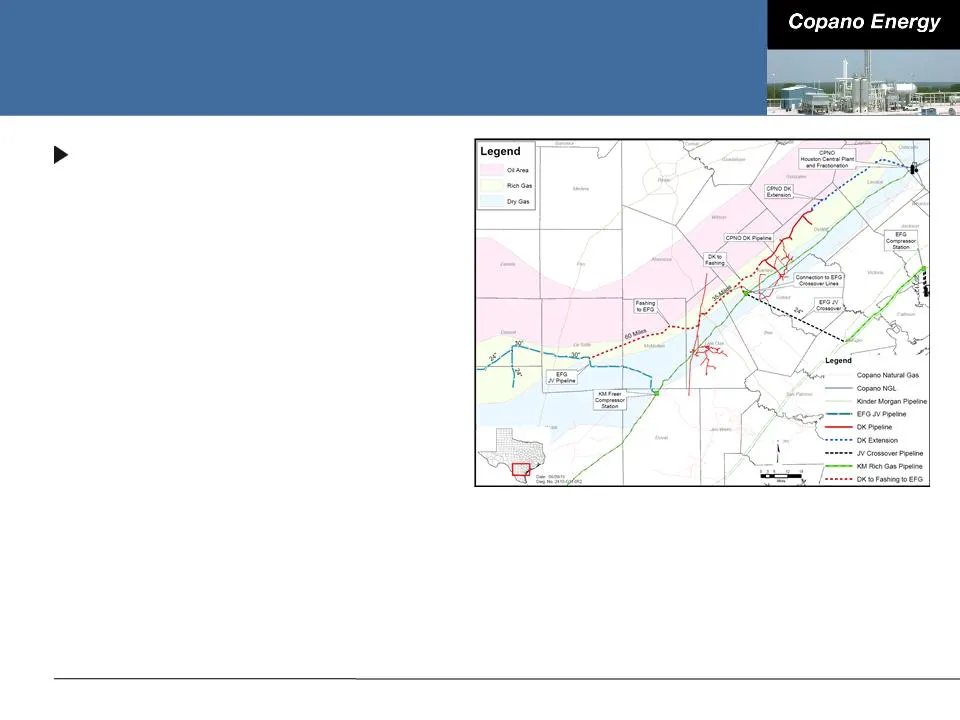
Growth Opportunities - Eagle Ford Shale Potential extension of DK pipeline from Fashing / Live Oak system to EFG 30” pipeline in McMullen County ■ Completes loop of Kinder Morgan’s Index 50 pipeline ■ Increases exposure to remaining Eagle Ford Shale condensate window ■ Increases EFG 30” pipeline cap
Slide 65: Growth Opportunities - Eagle Ford Shale
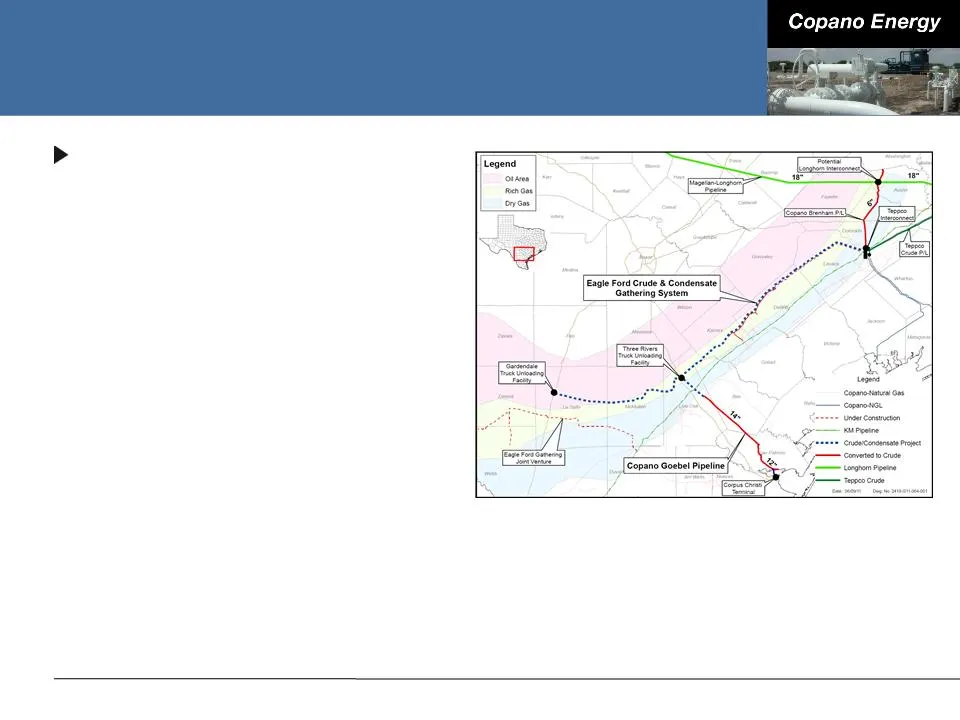
Growth Opportunities - Eagle Ford Shale Crude oil / condensate initiatives under review ■ Convert existing Copano gas gathering line to crude service ■ Tie into markets, storage and loading docks in Corpus Christi ■ Utilize dual-line rights of way in the DK corridor to lay crude gathering system ■ A
Slide 66: Copano Energy
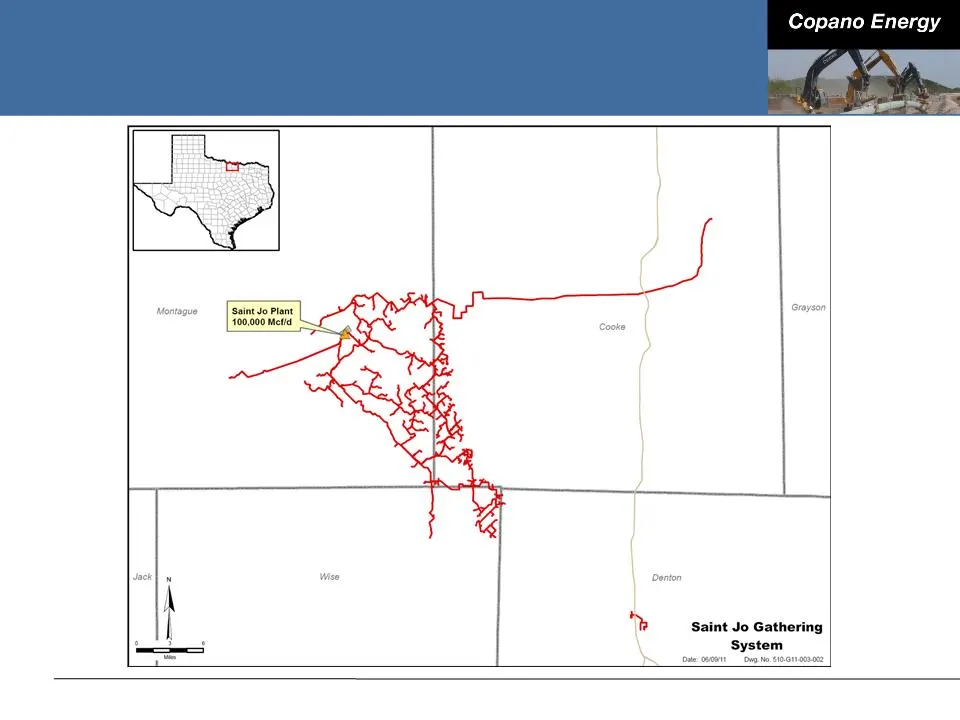
Copano Energy Montague Grayson Saint Jo Gathering ‘System
Slide 67: Saint Jo System
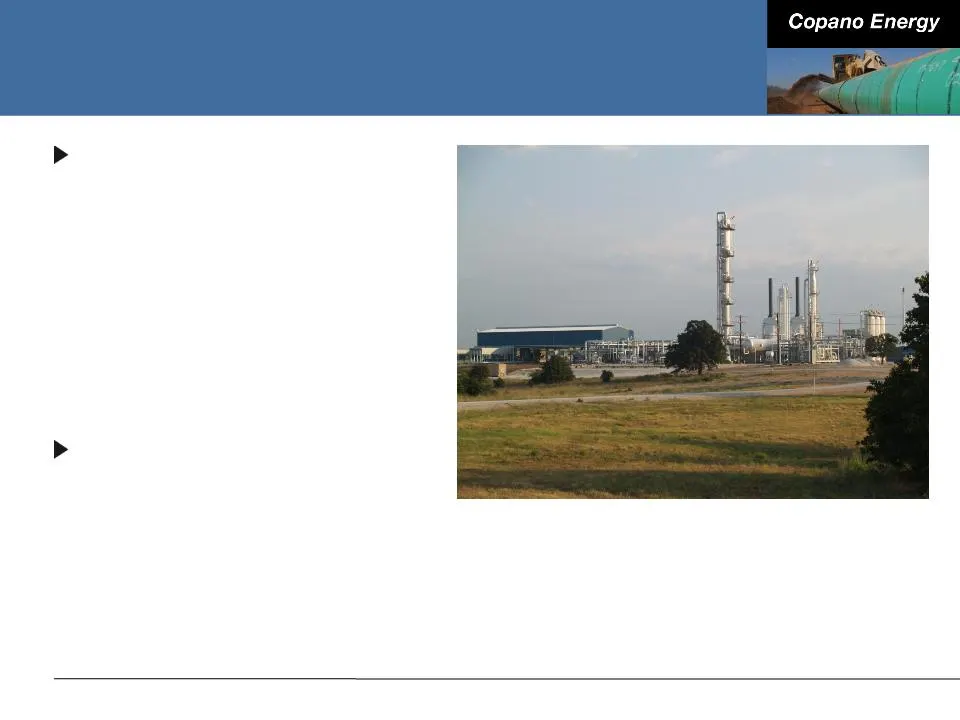
Saint Jo System Saint Jo processing plant ■ 100 MMcf/d processing capacity ■ 1,200 GPM amine treater ■ Residue gas outlets ● NGPL ● Atmos ■ NGL outlet ● ONEOK Arbuckle pipeline Gathering system ■ 340 miles of pipe ■ 20,700 HP of compression
Slide 68: North Barnett Shale Combo Well Profile
North Barnett Shale Combo North Barnett Shale Combo Well Profile Vertical depth: Approximately 9,000 ft. Horizontal laterals: Up to 6,000 ft. Completed well cost: Approximately $3 million IP rate: Up to 500 Bbls/d of oil and 1 MMcf/d of gas Gas quality: 4 - 6 GPM 10% CO 2 Key producers with over 250
Slide 69: Saint Jo System - Major Producer Contracts
Saint Jo System - Major Producer Contracts Long-term, fee-based contracts Firm commitment for 90,000 Mcf/d Current system throughput of approximately 67,000 Mcf/d Deficiency fees on any firm volumes not delivered
Slide 70: Growth Opportunities - Saint Jo System
Growth Opportunities - Saint Jo System Expect to fill existing processing plant capacity by end of 2011 Drilling activity by producers may warrant Saint Jo processing plant expansion Working with producers for volume commitments to support potential processing plant expansion
Slide 71: Growth Opportunities - Lake Charles
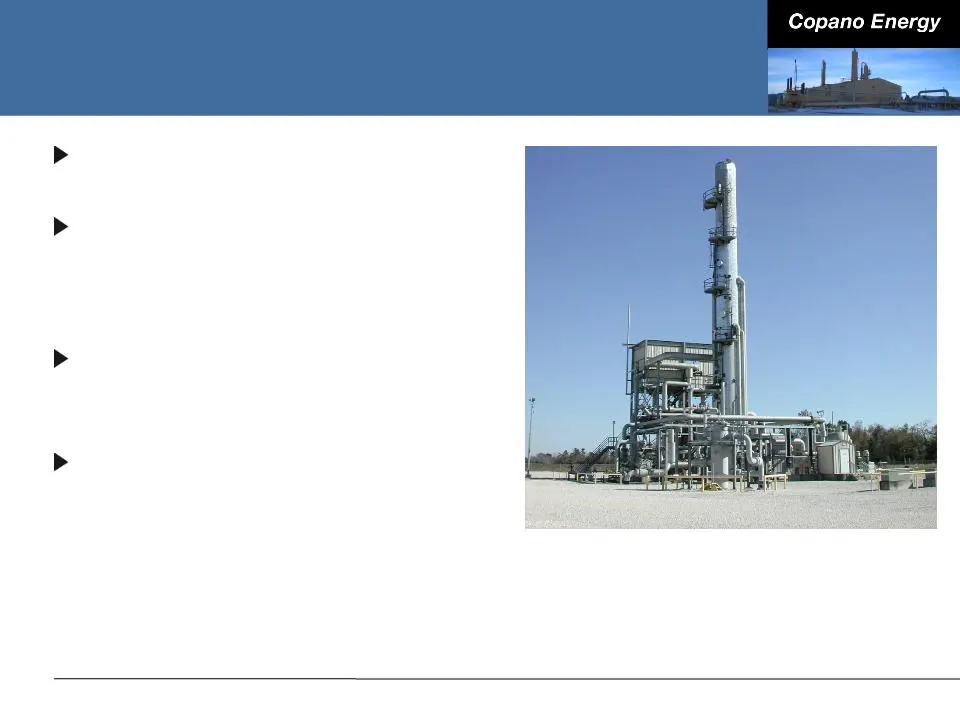
Growth Opportunities - Lake Charles 200 MMcf/d cryogenic processing facility in Louisiana Previously processed rich gas from Trunkline’s LNG import facility ■ Idled in 2010 upon completion of Trunkline’s LNG processing plant Evaluated moving plant to expand Houston Central complex to handle Eagle Fo
Slide 72: Legacy Texas Systems
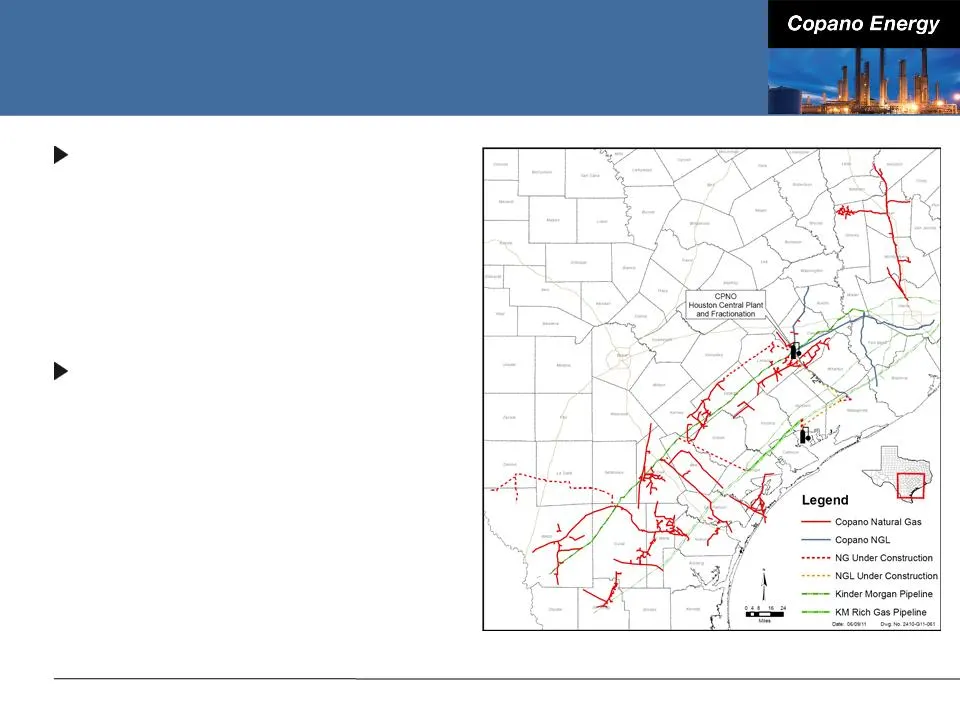
Legacy Texas Systems Most legacy Texas systems tied to Houston Central complex via Kinder Morgan’s Index 50 pipeline ■ Allows gathering of additional non- Eagle Ford Shale gas Asset optimization project underway on legacy Texas systems ■ Reviewing utilization and strategic use for each pipeline syst
Slide 73: Conclusions - Texas
Conclusions - Texas Strategy for Eagle Ford Shale infrastructure to handle well in excess of 1 Bcf/d of gas and over 100,000 Bbls/d of NGLs is well underway ■ Significant new contracts underlie expansion projects ■ Contracts are long-term and fee-based Evaluating opportunity to utilize existing natu
Slide 74: M&A Discussion
M&A Discussion John Goodpasture
Slide 75: M&A Strategy
M&A Strategy Acquisitions have been an important part of Copano’s heritage and remain a key element of our current growth strategy The goal is to build a more diversified portfolio, adding scale and stability beyond what Copano’s organic initiatives will provide ■ Create operational synergies and/or
Slide 76: M&A Process
M&A Process Copano has a well-developed M&A process that includes: ■ Strategic assessment of target ● Gauge costs and probability of success ■ Rigorous due diligence effort ● Use outside expertise as required ■ Granular economic analyses ● Includes sound financing strategy consistent with our financ
Slide 77: Current M&A Market
Current M&A Market Very competitive, robust prices, seller-friendly contract terms Drilling activity has shifted to liquids-rich regions and significantly increased the value and prices paid for associated midstream assets (Eagle Ford, Marcellus, Bakken, Granite Wash, Niobrara, etc.) Midstream asset
Slide 78: Current M&A Market
Current M&A Market New production in emerging areas has outpaced the growth of needed midstream infrastructure Liquids logistics capability (including storage, terminals, pipelines and truck/rail/barge transportation) is in short supply and is therefore particularly valuable Efficient delivery to a

Slide 79: Financial Discussion
Financial Discussion Carl Luna
Slide 80: Copano Energy
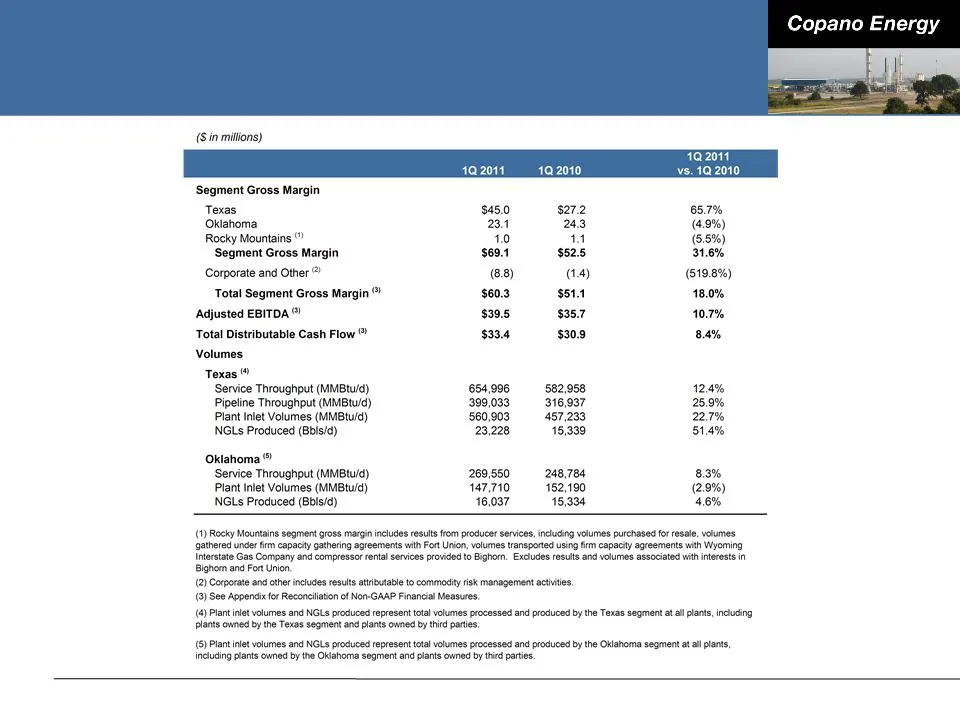
Copano Energy ($ in millions) 402011 102010 ‘Segment Gross Margin Texas $45.0 $272 657% Oklahoma 23.4 24.3 (49%) Rocky Mountains 19 14 (65%) ‘Segment Gross Margin $69.4 $525 31.8% ‘Corporate and Other ® (8.8) (14) (519.8%) Total Segment Gross Margin $60.3 $51.4 18.0% Adjusted EBITDA $39.5 $35.7 10.7
Slide 81: Capitalization and Liquidity
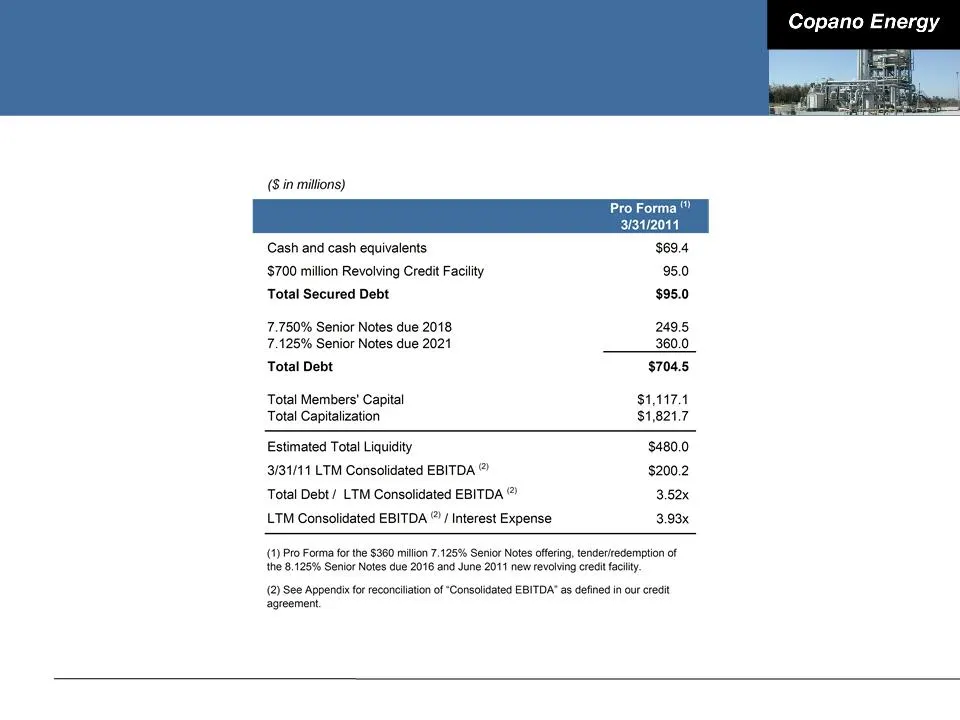
Capitalization and Liquidity
Slide 82: New Revolving Credit Facility
New Revolving Credit Facility On June 10, 2011 closed a new $700 million five-year credit facility ■ Ability to increase facility to $850 million Added flexibility to financial covenants ■ Maximum total leverage ratio of 5.25x ■ Maximum senior secured leverage ratio of 4.00x ■ Minimum interest cover
Slide 83: Financial Policy
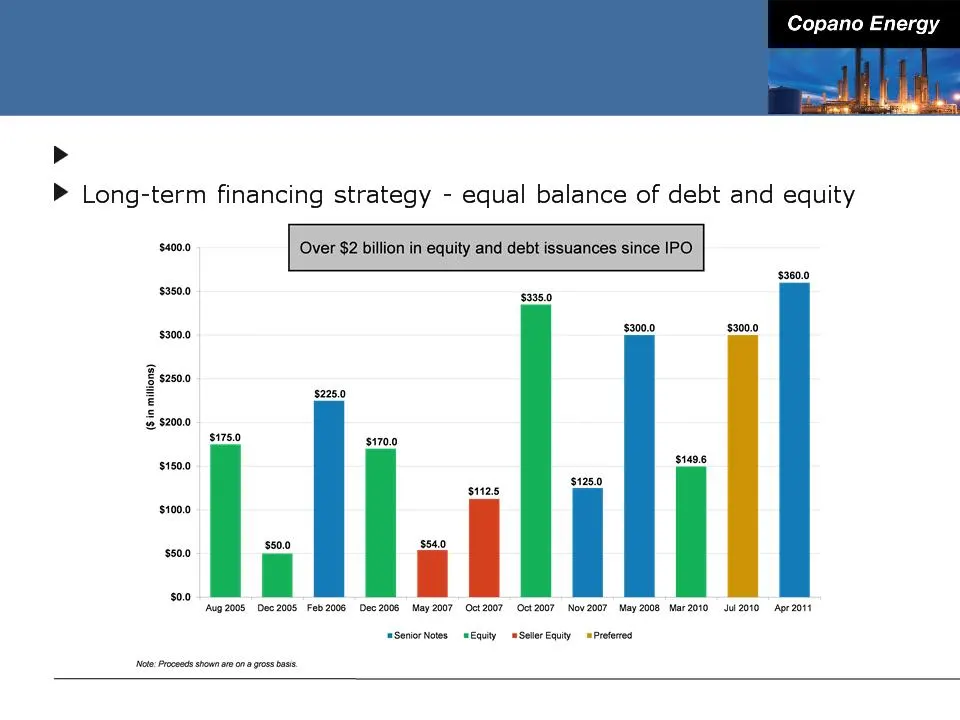
Financial Policy Target total leverage of 4.0x or below
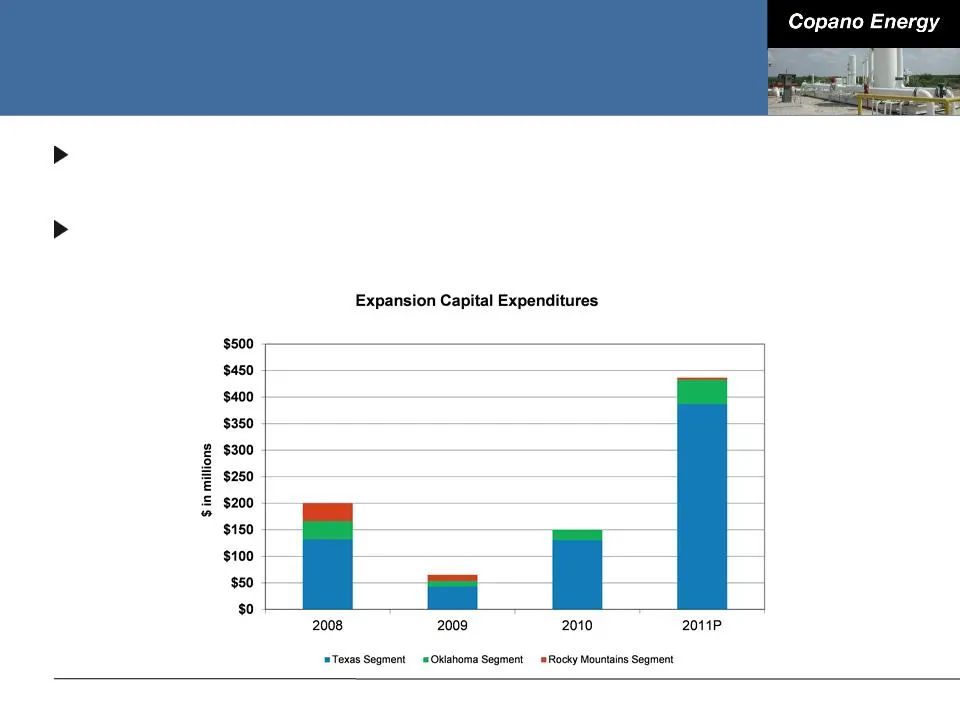
Slide 84: 2011 Capital Expenditure Plans
2011 Capital Expenditure Plans Estimated capital spending over $400 million for wholly owned and JV expansion projects in 2011 Once completed, capital investments should add approximately $60 - $70 million in incremental cash flow in 2012
Slide 85: 2012 Capital Expenditure Plans
2012 Capital Expenditure Plans 2012 capital expenditures for announced projects include: ■ Approximately $110 million related to Houston Central complex processing expansion Additional 2012 capital expenditures will be driven by growth opportunities in Texas and Oklahoma and could include: ■ Souther
Slide 86: Shifting Contract Mix
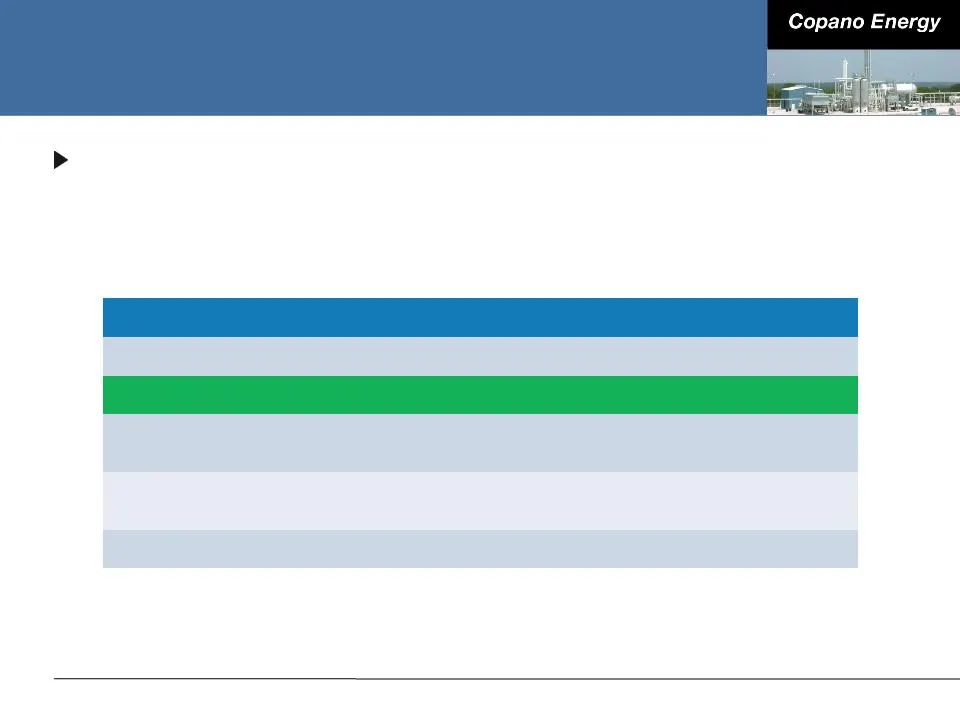
Shifting Contract Mix Contract Mix as a % of Gross Margin 1Q 2010 2Q 2010 3Q 2010 4Q 2010 1Q 2011 Fee-based 27% 33% 37% 38% 41% Percentage-of- proceeds 39% 31% 30% 32% 32% Keep- whole/Other 36% 33% 29% 34% 39% Net hedging -2% 3% 4% -4% -12% Continued shift towards a more fee-based contract mix ■ Eag
Slide 87: Hedging Strategy
Hedging Strategy Continued focus on option-based, product-specific hedging strategy ■ Reliance on hedging will decrease over time as contract mix changes 2011 well hedged ■ Between 70% and 90% of ethane, propane, butane, natural gasoline and condensate price exposure is hedged 2012 hedged near polic
Slide 88: Commodity-Related Margin Sensitivities
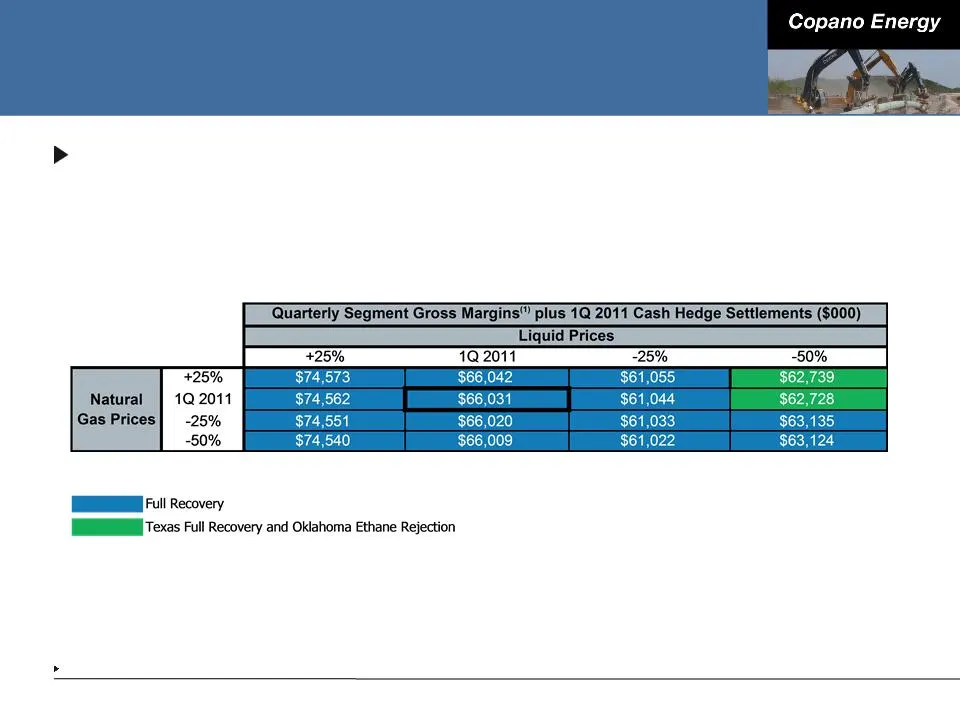
Commodity-Related Margin Sensitivities Matrix reflects 1Q 2011 wellhead and plant inlet volumes, adjusted using Copano’s 2011 planning model Consists of Texas and Oklahoma Segment gross margins.
Slide 89: 2011 Current Guidance
2011 Current Guidance General and administrative expenses: ■ $46 million - $48 million Operations and maintenance expenses: ■ $62 million - $64 million Interest expense: ■ $54 million - $56 million Maintenance capital expenditures: ■ $12 million - $14 million Non-cash amortization expense related to

Slide 90: Conclusions
Conclusions Bruce Northcutt
Slide 91: Key Investment Highlights
Key Investment Highlights Experienced operator with a history of growth in an investor-friendly structure (no GP, no Incentive Distribution Rights) Seasoned team of motivated employees with strong experience in project development and handling liquid-rich plays Continued solid growth in core busines
Slide 92: Key Value Drivers
Key Value Drivers Execution on our Eagle Ford Shale strategy Strong producer activity in north Texas Expanded growth opportunities in the Woodford Shale and Mississippi Lime in Oklahoma Potential for future strategic acquisitions Shift to predominately fee-based contract mix Ample liquidity and acce
Slide 93: Copano Energy
Copano Energy
Slide 94: Reconciliation of Non-GAAP Financial Measures
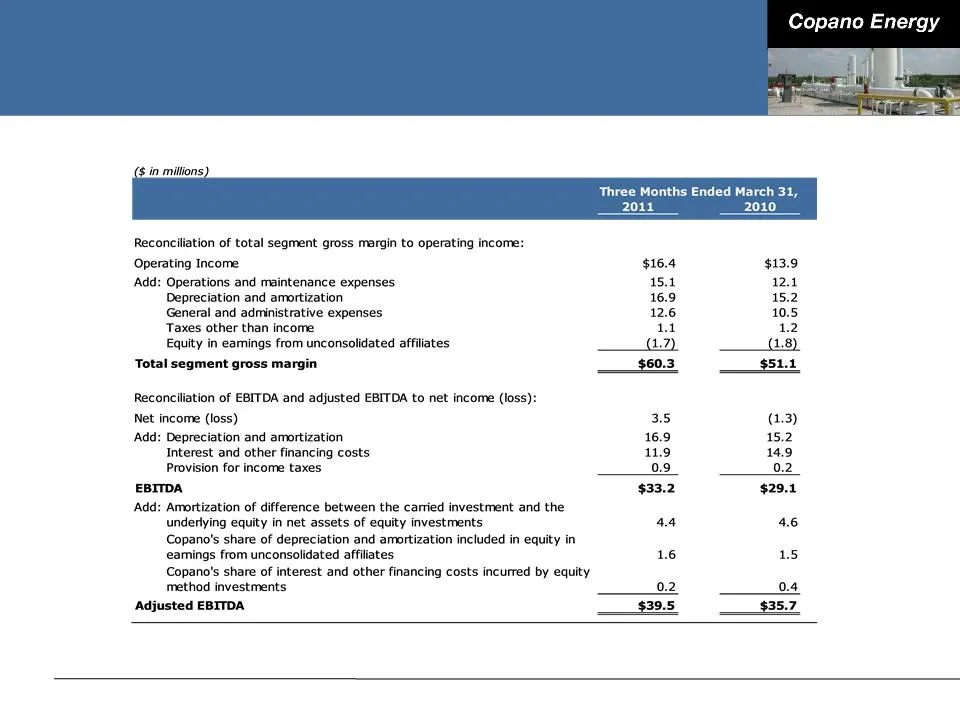
Reconciliation of Non-GAAP Financial Measures Segment Gross Margin, Total Segment Gross Margin and Adjusted EBITDA We define segment gross margin as an operating segment's revenue minus cost of sales. Cost of sales includes the following: cost of natural gas and NGLs we purchase and costs for transp
Slide 95: Reconciliation of Non-GAAP Financial Measures
Reconciliation of Non-GAAP Financial Measures
Slide 96: Reconciliation of Non-GAAP Financial Measures
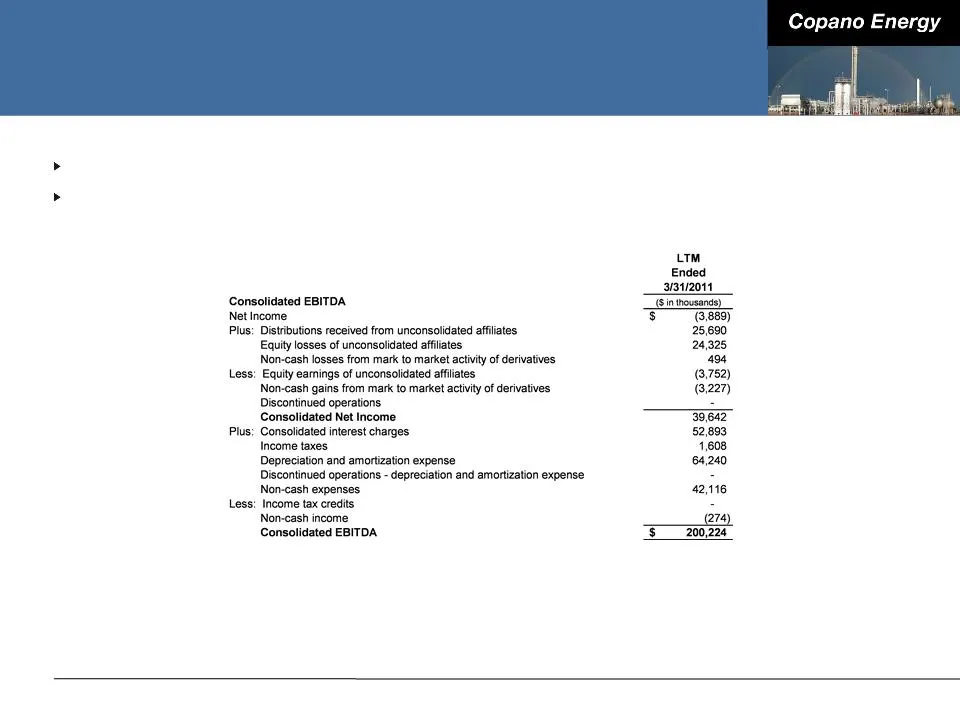
Reconciliation of Non-GAAP Financial Measures Consolidated EBITDA EBITDA is also a financial measure that, with negotiated pro forma adjustments relating to acquisitions completed during the period, is reported to our lenders as Consolidated EBITDA and is used to compute our financial covenants unde
Slide 97: Reconciliation of Non-GAAP Financial Measures
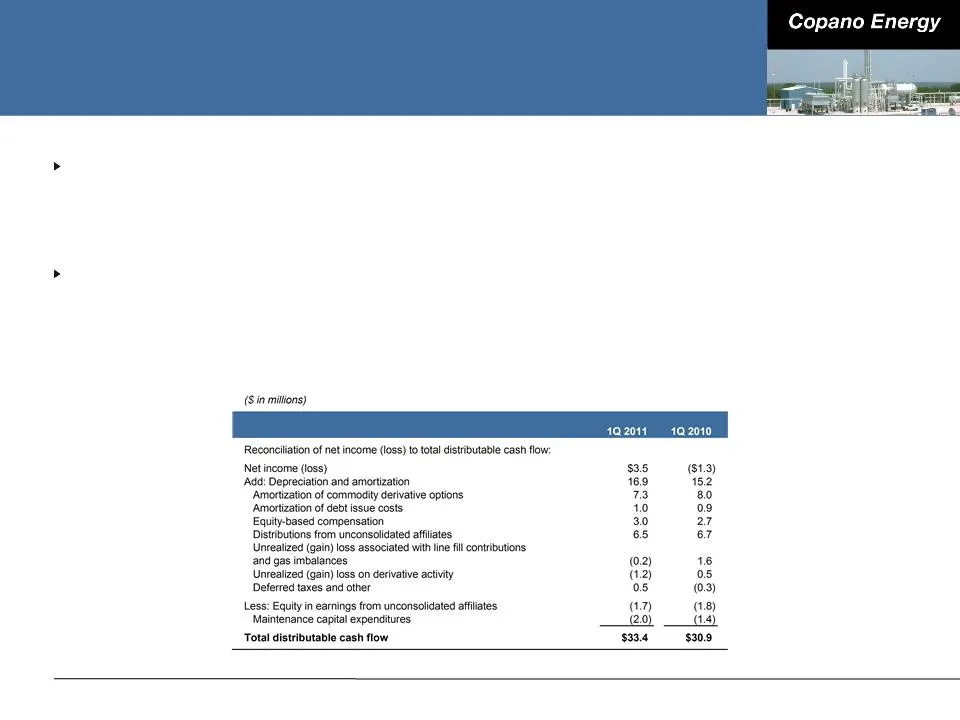
Reconciliation of Non-GAAP Financial Measures Total Distributable Cash Flow We define total distributable cash flow as net income plus: (i) depreciation, amortization and impairment expense (including amortization expense relating to the option component of our risk management portfolio); (ii) cash
Source: SEC EDGAR · 8-K filed Jun 15, 2011
More decks from Copano Energy L.L.C.
 2012 RBC Capital Markets MLP Conference35 slides · Nov 15, 2012
 2012 Citi One-on-One MLP/Midstream Infrastructure Conference35 slides · Aug 21, 2012
 Investor Presentation (June 2012)34 slides · Jun 18, 2012
 NAPTP 2012 MLP Investor Conference34 slides · May 22, 2012
 Morgan Stanley MLP and Diversified Natural Gas Corporate Access Day 201245 slides · Mar 7, 2012
 2011 RBC Capital Markets MLP Conference42 slides · Nov 17, 2011