Endeavour International — EnerCom's Oil & Gas Conference 2011
26 slides from Endeavour International's conference presentation, Aug 17, 2011
Slide 1: EnerCom's Oil & Gas Conference August 16-17, 2011
EnerCom's Oil & Gas Conference August 16-17, 2011
Slide 2: Forward-looking statements and cautionary notes
2 This is an oral presentation which is accompanied by slides. Investors are urged to review our SEC filings. This presentation contains certain forward-looking statements regarding various oil and gas discoveries, oil and gas exploration, development and production activities, anticipated and poten
Slide 3: Endeavour At A Glance
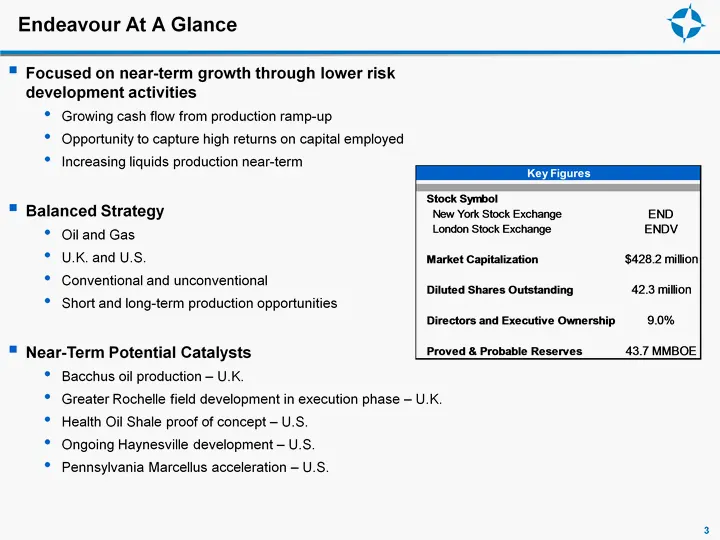
3 Endeavour At A Glance Focused on near-term growth through lower risk development activities Growing cash flow from production ramp-up Opportunity to capture high returns on capital employed Increasing liquids production near-term Balanced Strategy Oil and Gas U.K. and U.S. Conventional and unconve
Slide 4: Overview of Endeavour's U.K. Assets
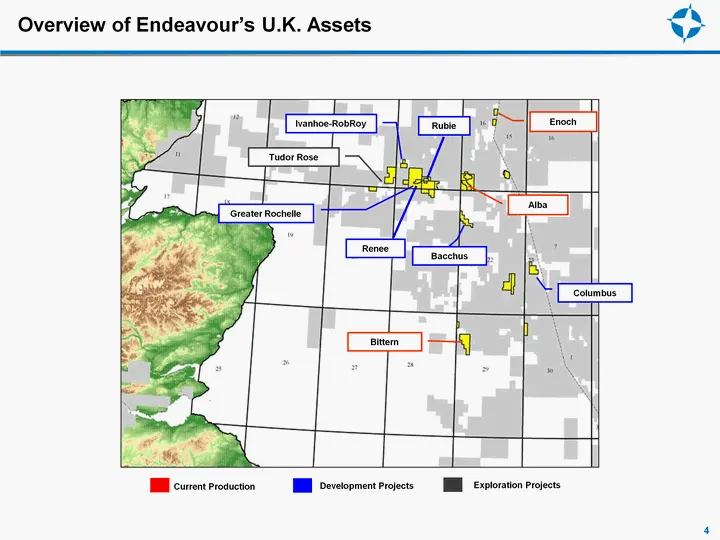
Overview of Endeavour's U.K. Assets 4 Rubie Renee Current Production Development Projects Exploration Projects
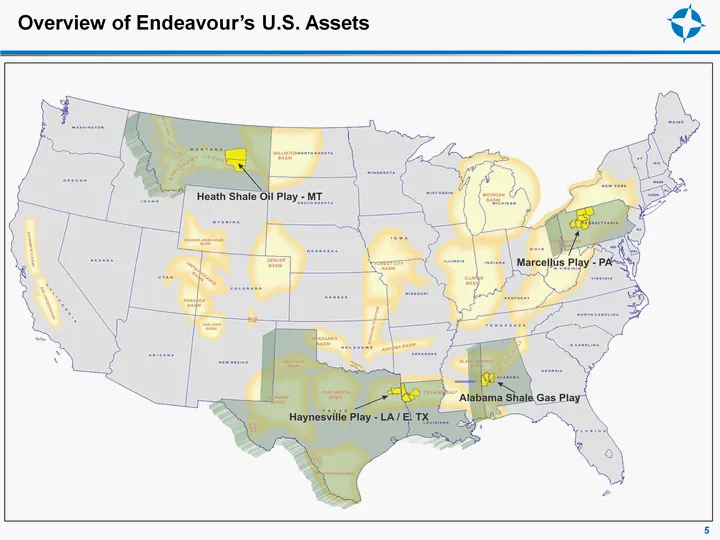
Slide 5: Overview of Endeavour's U.S. Assets
5 Overview of Endeavour's U.S. Assets
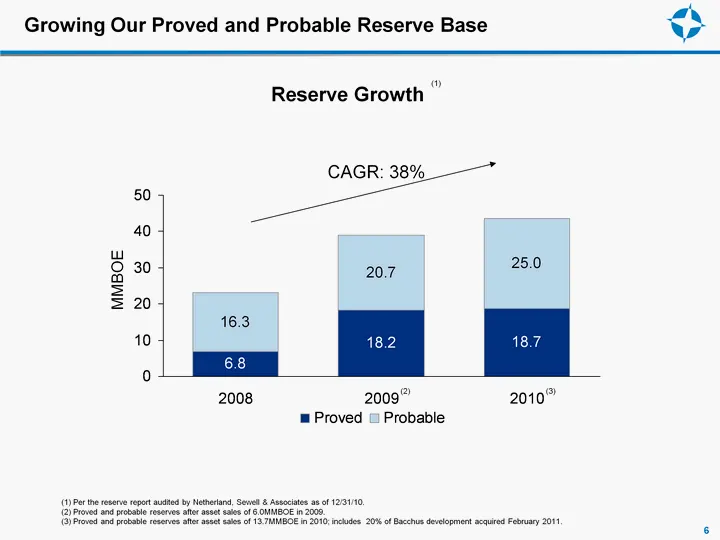
Slide 6: Growing Our Proved and Probable Reserve Base
Growing Our Proved and Probable Reserve Base 6 Reserve Growth (1) Per the reserve report audited by Netherland, Sewell & Associates as of 12/31/10. (2) Proved and probable reserves after asset sales of 6.0MMBOE in 2009. (3) Proved and probable reserves after asset sales of 13.7MMBOE in 2010; include
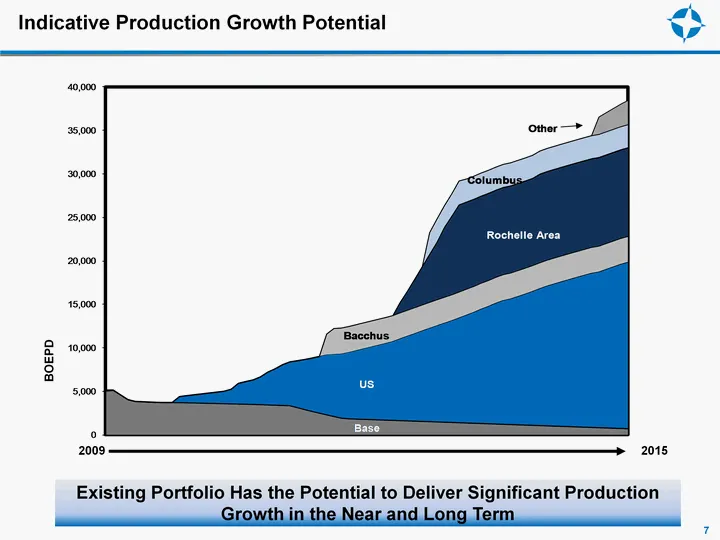
Slide 7: Indicative Production Growth Potential
Indicative Production Growth Potential 7 Existing Portfolio Has the Potential to Deliver Significant Production Growth in the Near and Long Term 2009 2015 BOEPD
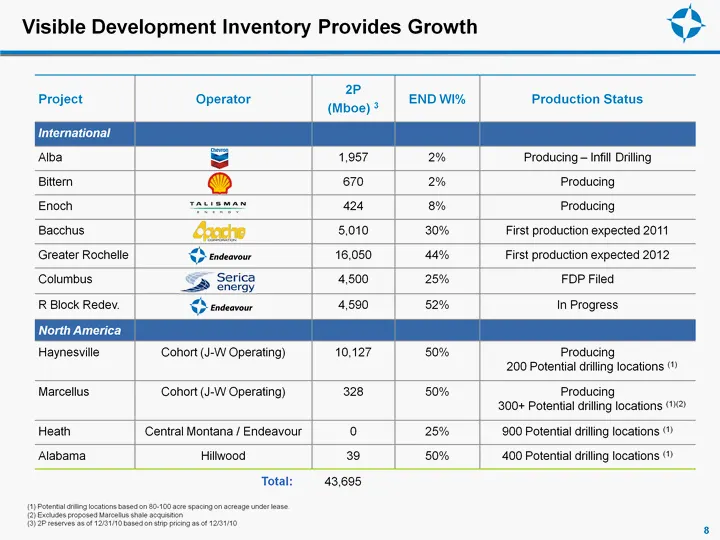
Slide 8: Visible Development Inventory Provides Growth
8 Visible Development Inventory Provides Growth Project Operator 2P(Mboe) 3 END WI% Production Status International Alba 1,957 2% Producing - Infill Drilling Bittern 670 2% Producing Enoch 424 8% Producing Bacchus 5,010 30% First production expected 2011 Greater Rochelle 16,050 44% First production
Slide 9: Outstanding Portfolio Management Capturing Value to Accelerate Returns
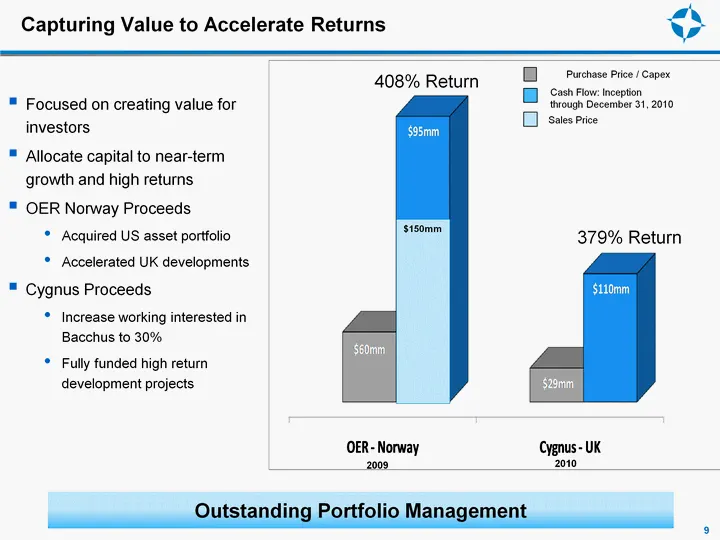
Outstanding Portfolio Management Capturing Value to Accelerate Returns 408% Return 379% Return Cash Flow: Inception through December 31, 2010 Purchase Price / Capex Sales Price $150mm 2009 2010 Focused on creating value for investors Allocate capital to near-term growth and high returns OER Norway P
Slide 10: Our North Sea Assets
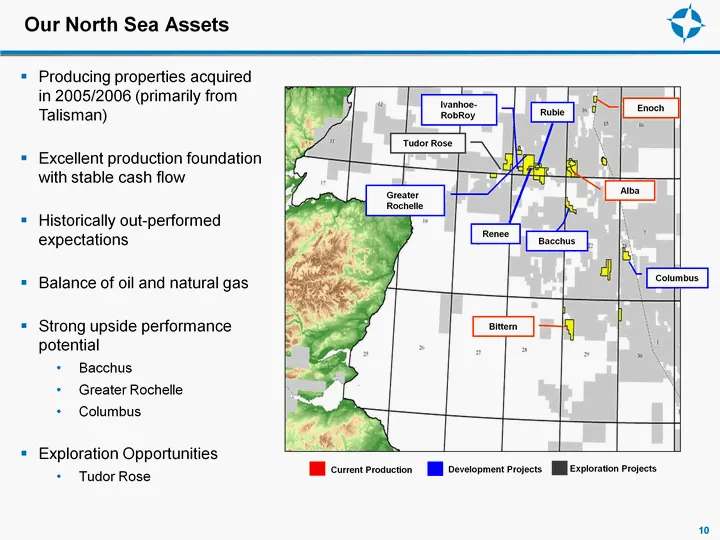
10 Our North Sea Assets Producing properties acquired in 2005/2006 (primarily from Talisman) Excellent production foundation with stable cash flow Historically out-performed expectations Balance of oil and natural gas Strong upside performance potential Bacchus Greater Rochelle Columbus Exploration
Slide 11: Bacchus: Block 22/06a Central North Sea
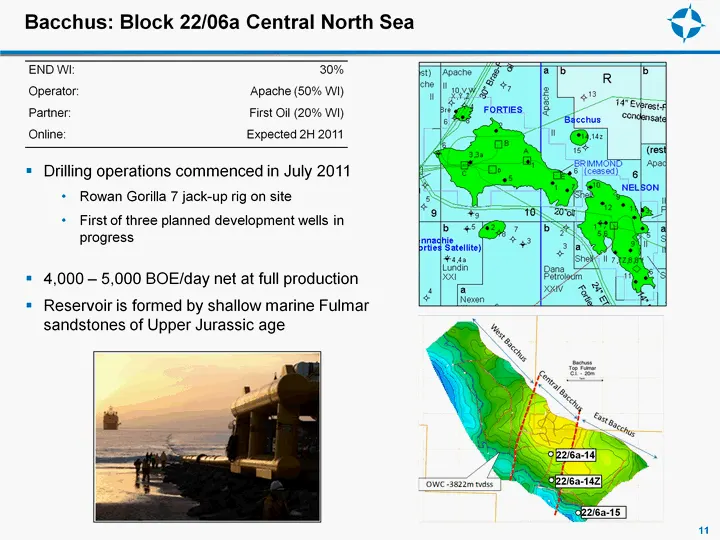
Bacchus: Block 22/06a Central North Sea 11 Drilling operations commenced in July 2011 Rowan Gorilla 7 jack-up rig on site First of three planned development wells in progress 4,000 - 5,000 BOE/day net at full production Reservoir is formed by shallow marine Fulmar sandstones of Upper Jurassic age 22
Slide 12: Greater Rochelle: Blocks 15/26b, 15/26c & 15/27
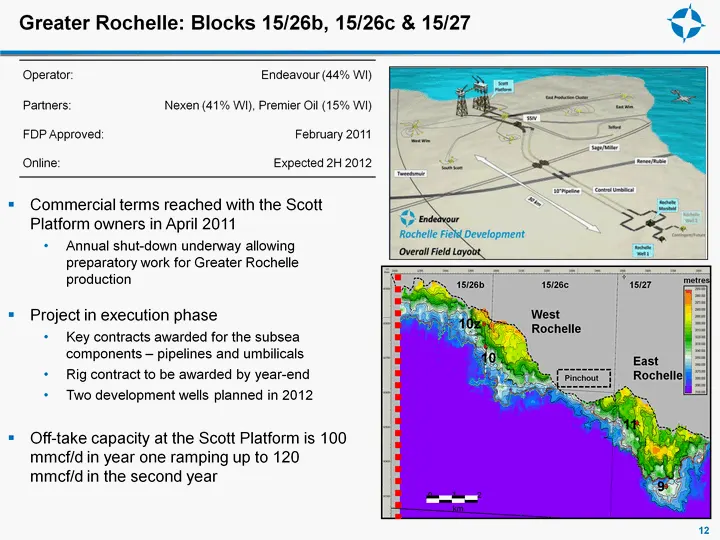
Commercial terms reached with the Scott Platform owners in April 2011 Annual shut-down underway allowing preparatory work for Greater Rochelle production Project in execution phase Key contracts awarded for the subsea components - pipelines and umbilicals Rig contract to be awarded by year-end Two d
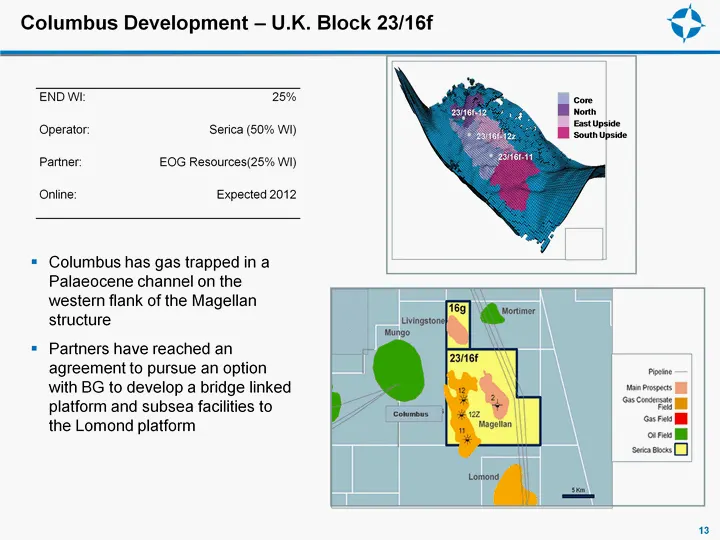
Slide 13: Columbus Development - U.K. Block 23/16f
Columbus Development - U.K. Block 23/16f 13 Columbus has gas trapped in a Palaeocene channel on the western flank of the Magellan structure Partners have reached an agreement to pursue an option with BG to develop a bridge linked platform and subsea facilities to the Lomond platform END WI: 25% Oper
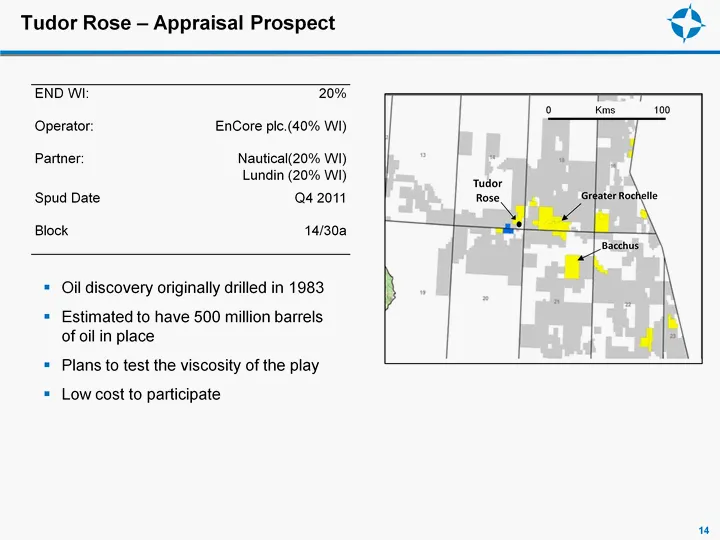
Slide 14: Tudor Rose - Appraisal Prospect
Tudor Rose - Appraisal Prospect 14 Oil discovery originally drilled in 1983 Estimated to have 500 million barrels of oil in place Plans to test the viscosity of the play Low cost to participate END WI: 20% Operator: EnCore plc.(40% WI) Partner: Nautical(20% WI) Lundin (20% WI) Spud Date Q4 2011 Bloc
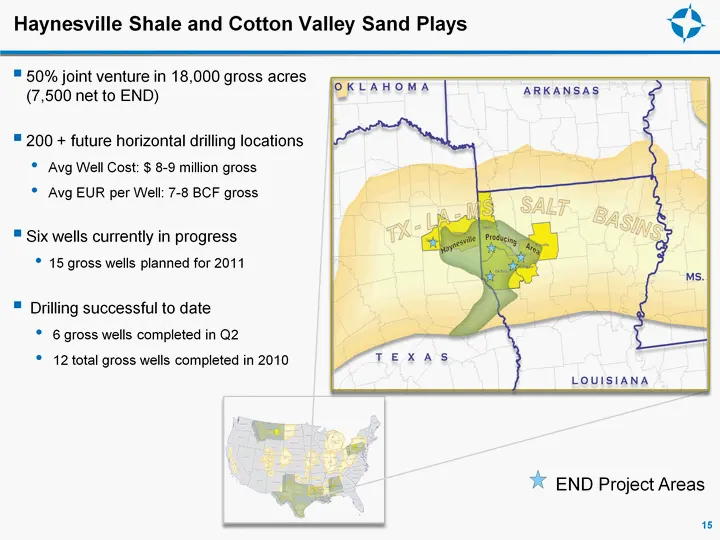
Slide 15: Haynesville Shale and Cotton Valley Sand Plays
Haynesville Shale and Cotton Valley Sand Plays 50% joint venture in 18,000 gross acres (7,500 net to END) 200 + future horizontal drilling locations Avg Well Cost: $ 8-9 million gross Avg EUR per Well: 7-8 BCF gross Six wells currently in progress 15 gross wells planned for 2011 Drilling successful
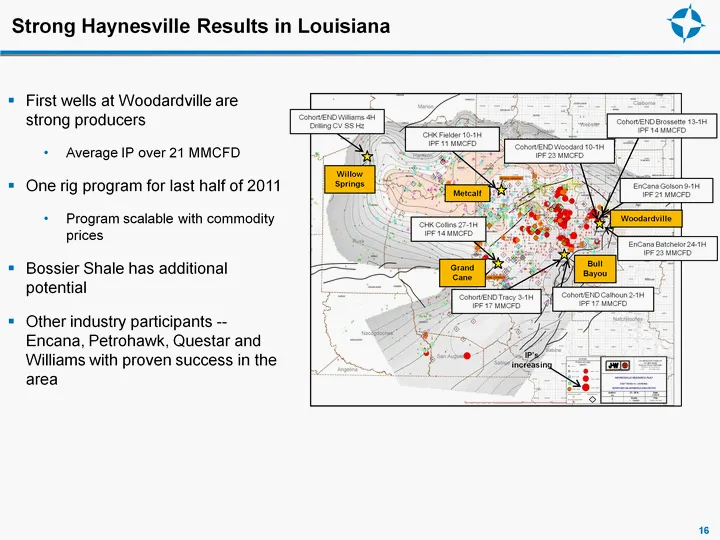
Slide 16: Strong Haynesville Results in Louisiana
16 First wells at Woodardville are strong producers Average IP over 21 MMCFD One rig program for last half of 2011 Program scalable with commodity prices Bossier Shale has additional potential Other industry participants -- Encana, Petrohawk, Questar and Williams with proven success in the area IP's
Slide 17: Overview of Marcellus Shale Acquisition
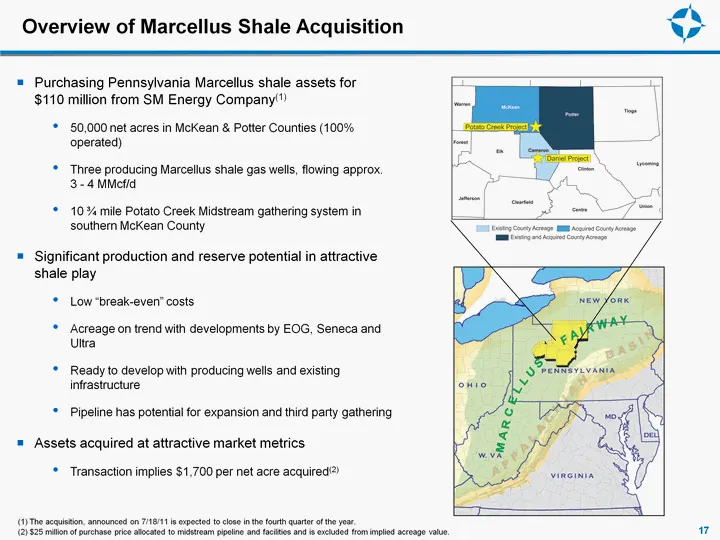
17 Overview of Marcellus Shale Acquisition Purchasing Pennsylvania Marcellus shale assets for $110 million from SM Energy Company(1) 50,000 net acres in McKean & Potter Counties (100% operated) Three producing Marcellus shale gas wells, flowing approx. 3 - 4 MMcf/d 10 3/4 mile Potato Creek Midstream
Slide 18: END's Combined Marcellus Shale Play Post-Acquisition
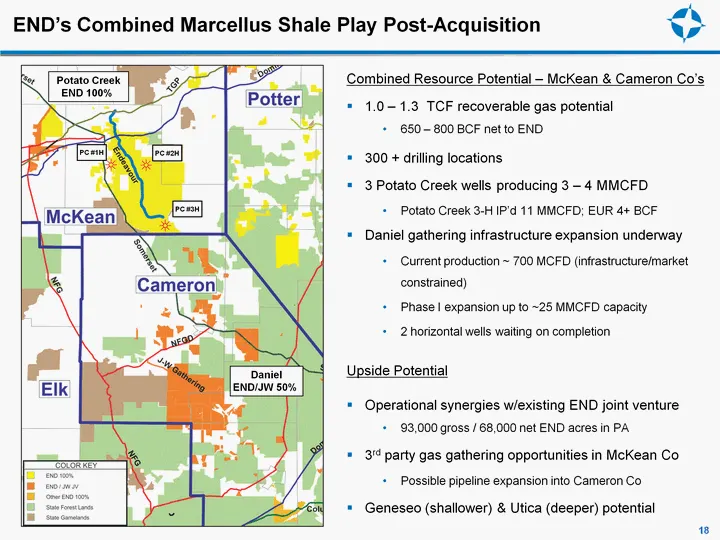
END's Combined Marcellus Shale Play Post-Acquisition 18 Potato Creek END 100% Daniel END/JW 50% PC #1H PC #2H PC #3H Combined Resource Potential - McKean & Cameron Co's 1.0 - 1.3 TCF recoverable gas potential 650 - 800 BCF net to END 300 + drilling locations 3 Potato Creek wells producing 3 - 4 MMCF
Slide 19: Strong Drilling Results in the Play
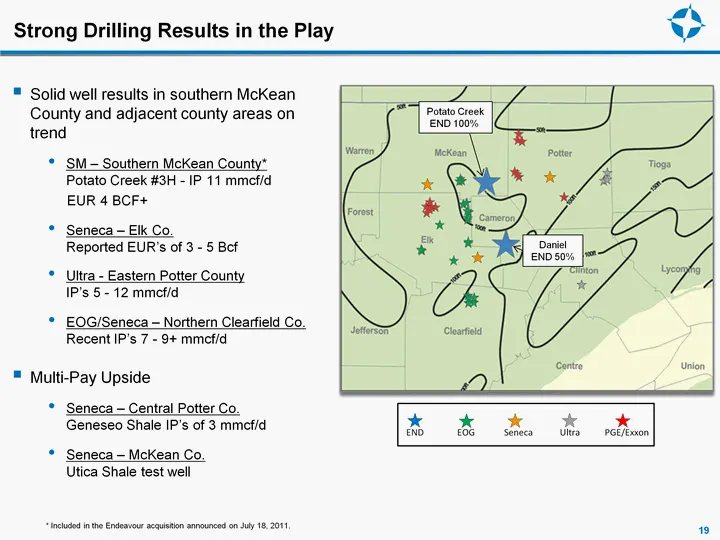
Strong Drilling Results in the Play 19 Solid well results in southern McKean County and adjacent county areas on trend SM - Southern McKean County* Potato Creek #3H - IP 11 mmcf/d EUR 4 BCF+ Seneca - Elk Co. Reported EUR's of 3 - 5 Bcf Ultra - Eastern Potter County IP's 5 - 12 mmcf/d EOG/Seneca - No
Slide 20: Heath Oil Shale on the Montana Frontier
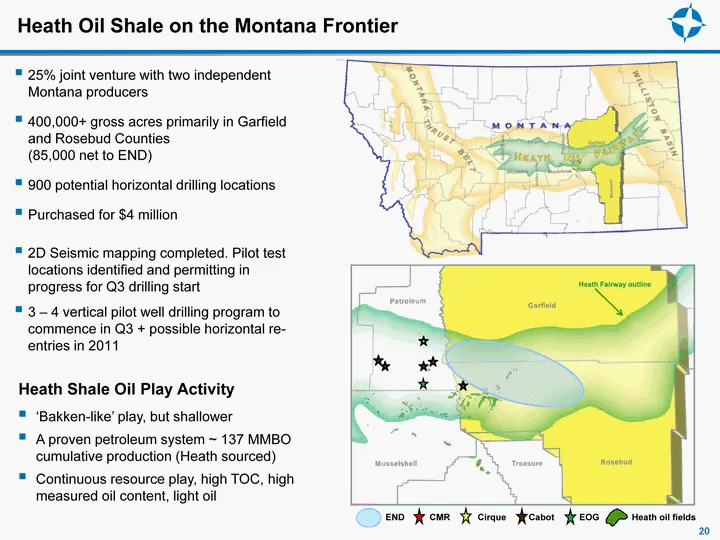
Heath Oil Shale on the Montana Frontier 25% joint venture with two independent Montana producers 400,000+ gross acres primarily in Garfield and Rosebud Counties (85,000 net to END) 900 potential horizontal drilling locations Purchased for $4 million 2D Seismic mapping completed. Pilot test locations
Slide 21: Alabama Frontier Shale Gas Play
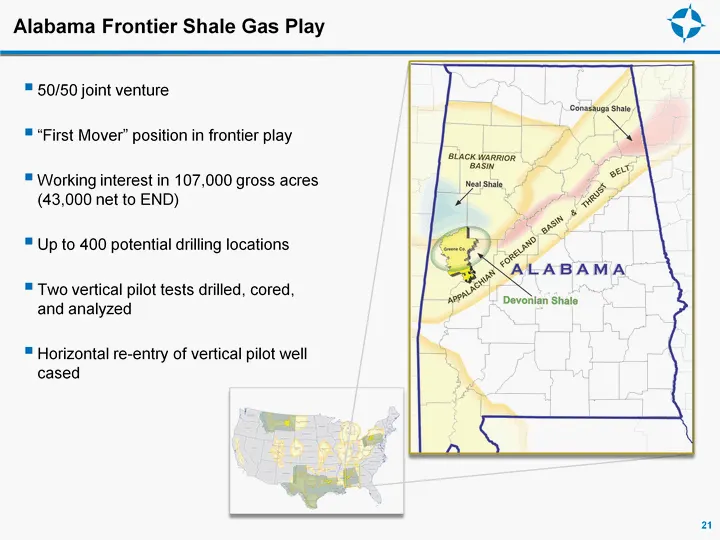
Alabama Frontier Shale Gas Play 21 50/50 joint venture "First Mover" position in frontier play Working interest in 107,000 gross acres (43,000 net to END) Up to 400 potential drilling locations Two vertical pilot tests drilled, cored, and analyzed Horizontal re-entry of vertical pilot well cased
Slide 22: Capital Structure
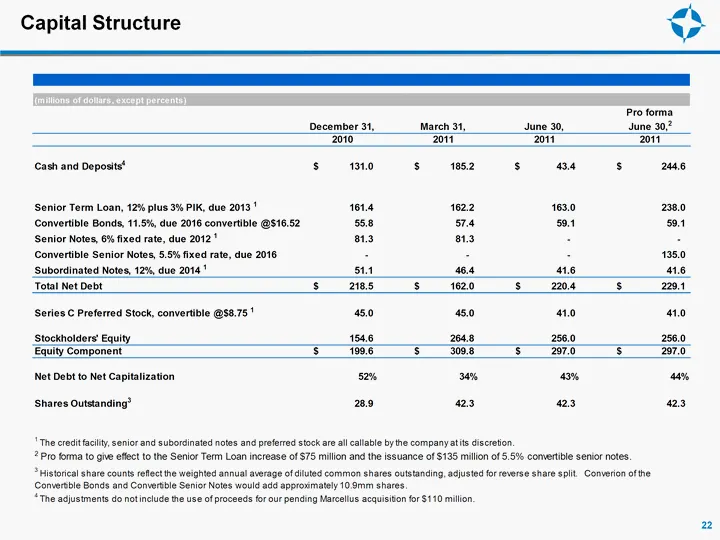
Capital Structure Pro forma Decomber 31, March 31, June 30, June 302 2010 Zot Zt 2011 ‘cash and Deposits! S110 Ss 1052 s 44 Ss mas Senior Term Loan, 12% plus 3% PIK, due 2013 1014 1022 1630 2380 Convertible Bonds, 11.5%, due 2016 convertible @$16.52 558 sr 504 504 Senior Notes, 6% fixed rate, due 20
Slide 23: 2011 Capital Budget
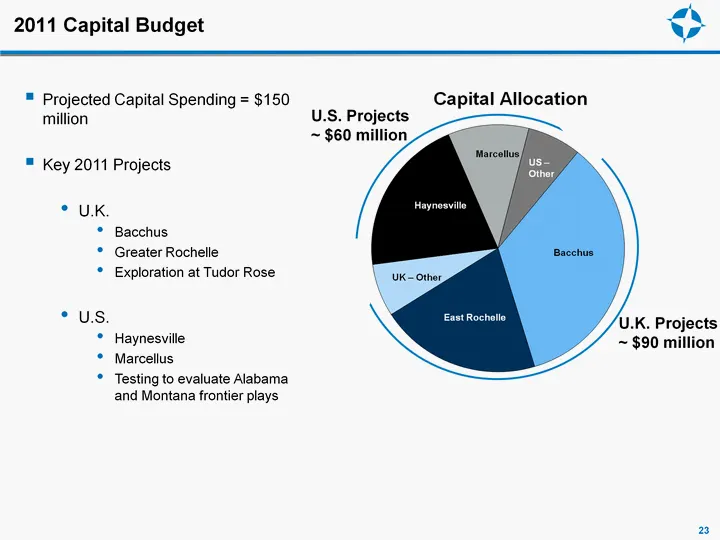
2011 Capital Budget 23 Projected Capital Spending = $150 million Key 2011 Projects U.K. Bacchus Greater Rochelle Exploration at Tudor Rose U.S. Haynesville Marcellus Testing to evaluate Alabama and Montana frontier plays U.K. Projects ~ $90 million U.S. Projects ~ $60 million
Slide 24: Estimated Valuation
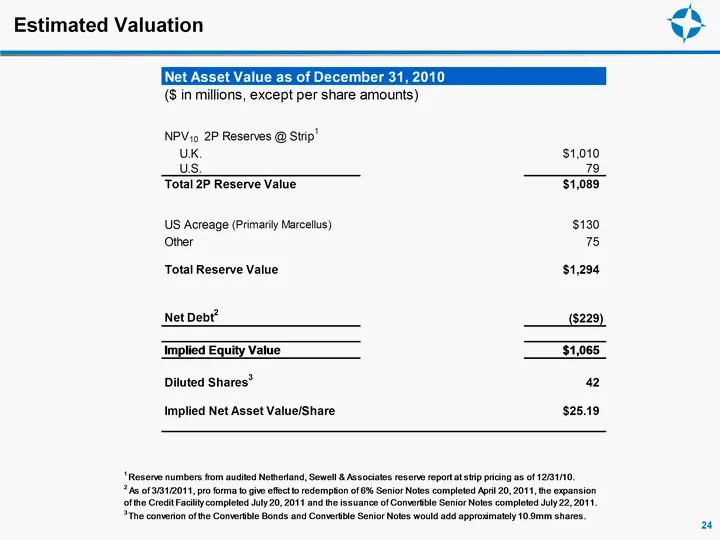
Estimated Valuation Net Asset Value as of December 3° (S in millions, except per share amounts) 1010 NPVio 2P Reserves @ Strip’ UK. $1,010 US. 79 Total 2P Reserve Value $7,088 US Acreage (Primarily Marcellus) $130 Other 15 Total Reserve Value $1,294 Net Debt ($229) implied Equity Value $1,065. Dilut
Slide 25: Key Investment Highlights
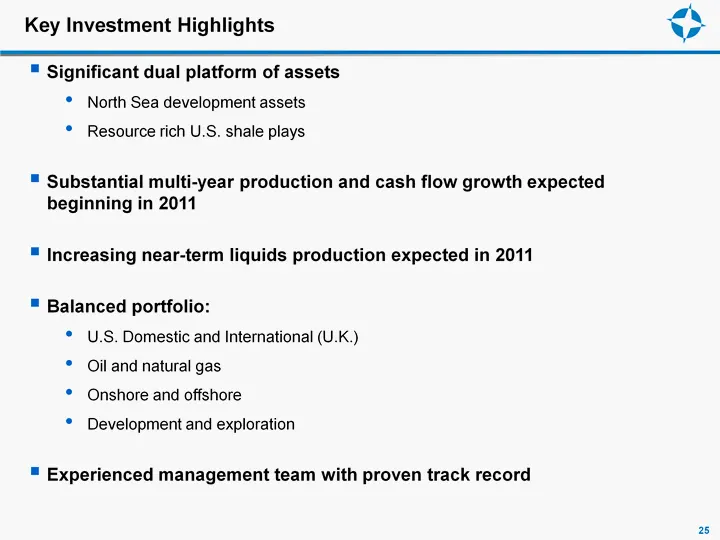
Key Investment Highlights 25 Significant dual platform of assets North Sea development assets Resource rich U.S. shale plays Substantial multi-year production and cash flow growth expected beginning in 2011 Increasing near-term liquids production expected in 2011 Balanced portfolio: U.S. Domestic an
Slide 26: Investor Contacts
NYSE:END LSE:ENDV www.endeavourcorp.com A aw * Endeavour Vs INVESTOR CONTACTS: Mike Kirksey Darcey Matthews Chief Financial Officer Director of Investor Relations 713.307.8788 / +44.207.451.2381 713.307.8711 mike. [email protected] [email protected]
Source: SEC EDGAR · 8-K filed Aug 17, 2011
More decks from Endeavour International Corp
 Presentation (May 2015)5 slides · May 7, 2015
 Corporate Update (February 2015)23 slides · Feb 27, 2015
 Debt Investor Presentation (October 2014)16 slides · Oct 14, 2014
 Q2 2014 Earnings Presentation12 slides · Aug 5, 2014
 Proxy Contest (May 2014)45 slides · May 8, 2014
 Q1 2014 Earnings Presentation12 slides · May 7, 2014