Osi Pharmaceuticals — Investor Day (December 2009)
135 slides from Osi Pharmaceuticals's investor day presentation, Dec 4, 2009
Slide 1: Welcome to OSI's Analyst Day
Exhibit 99.1 (os1) pharmaceuticals Shaping Medicine, Changing Lives Welcome to OSI’s Analyst Day December 3, 2009
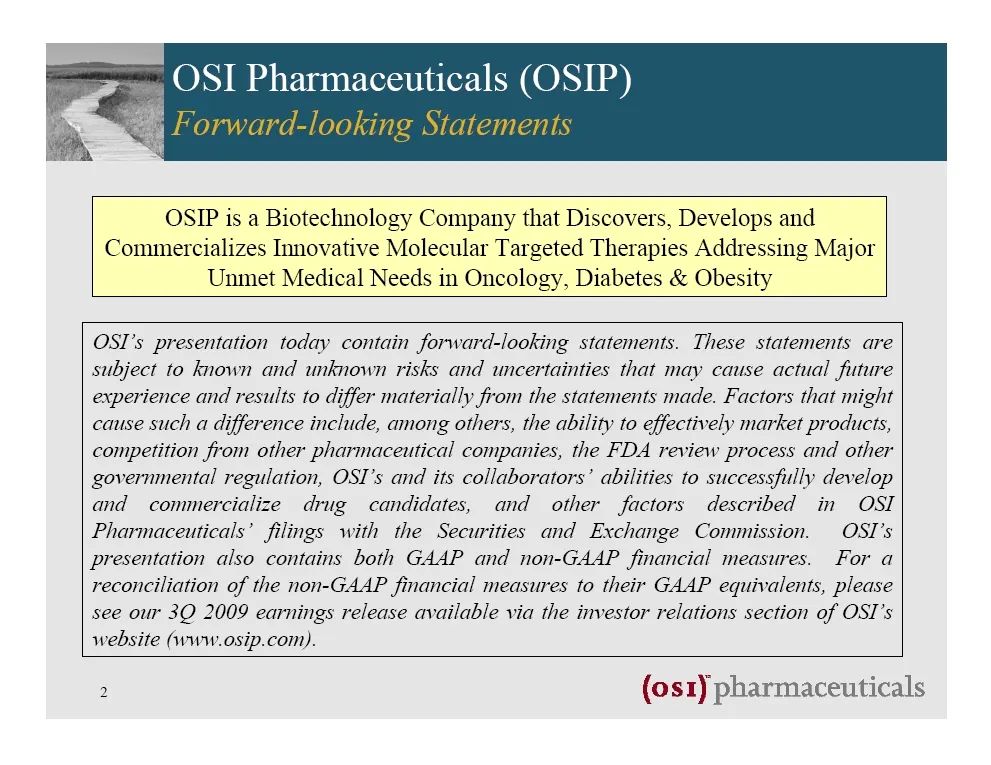
Slide 2: OSI Pharmaceuticals (OSIP)
~, OSI Pharmaceuticals (OSIP) OSIP is a Biotechnology Company that Discovers, Develops and Commercializes Innovative Molecular Targeted Therapies Addressing Major Unmet Medical Needs in Oncology, Diabetes & Obesity OSI’s presentation today contain forward-looking statements. These statements are sub
Slide 3: R&D Introduction
® CEO Gold Standard Founding Member (os1) pharmaceuticals Shaping Medicine, Changing Lives Analyst Day December 3, 2009 Colin Goddard, Ph.D. R&D Introduction
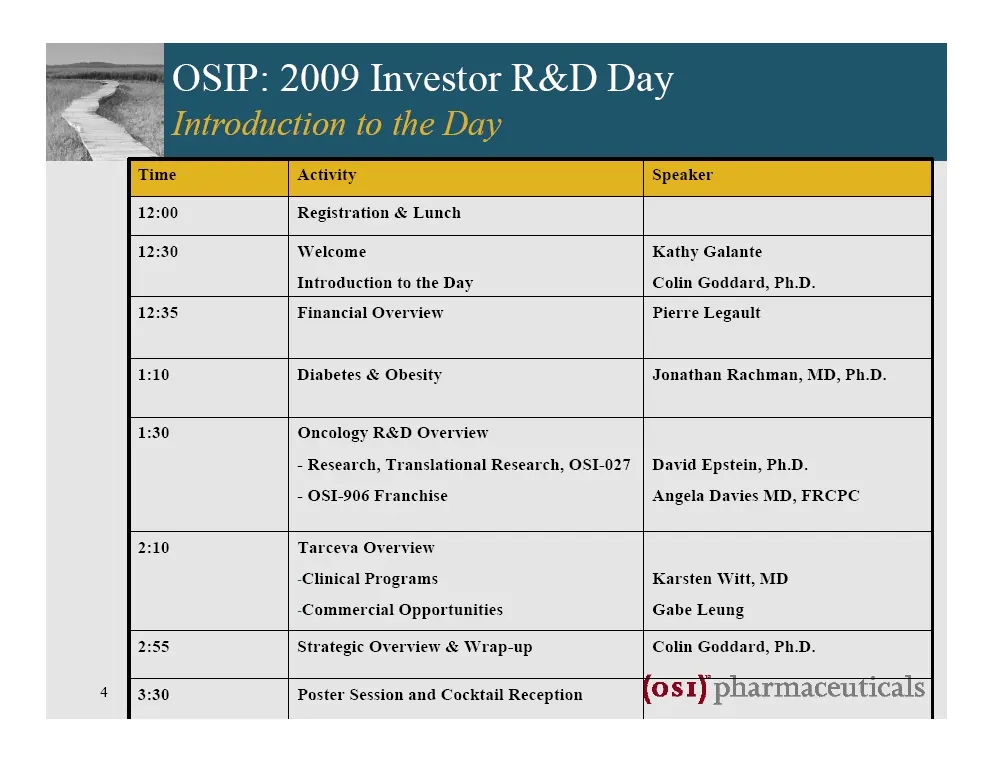
Slide 4: OSIP: 2009 Investor R&D Day agenda
Registration & Lunch OSIP: 2009 Investor R&D Day Welcome Introduction to the Day Kathy Galante Colin Goddard, Ph.D. Pierre Legault Diabetes & Obesity Jonathan Rachman, MD, Ph.D. Oncology R&D Overview - Research, Translational Research, OSI-027 - OSI-906 Franchise David Epstein, Ph.D. Angela Davies M
Slide 5: Financial Overview
CEO Gold Standard Founding Member (os1) pharmaceuticals Shaping Medicine, Changing Lives R & D Analyst Day Financial Overview Pierre Legault Executive Vice President & CFO
Slide 6: OSI Has Strong Underlying Financial Performance
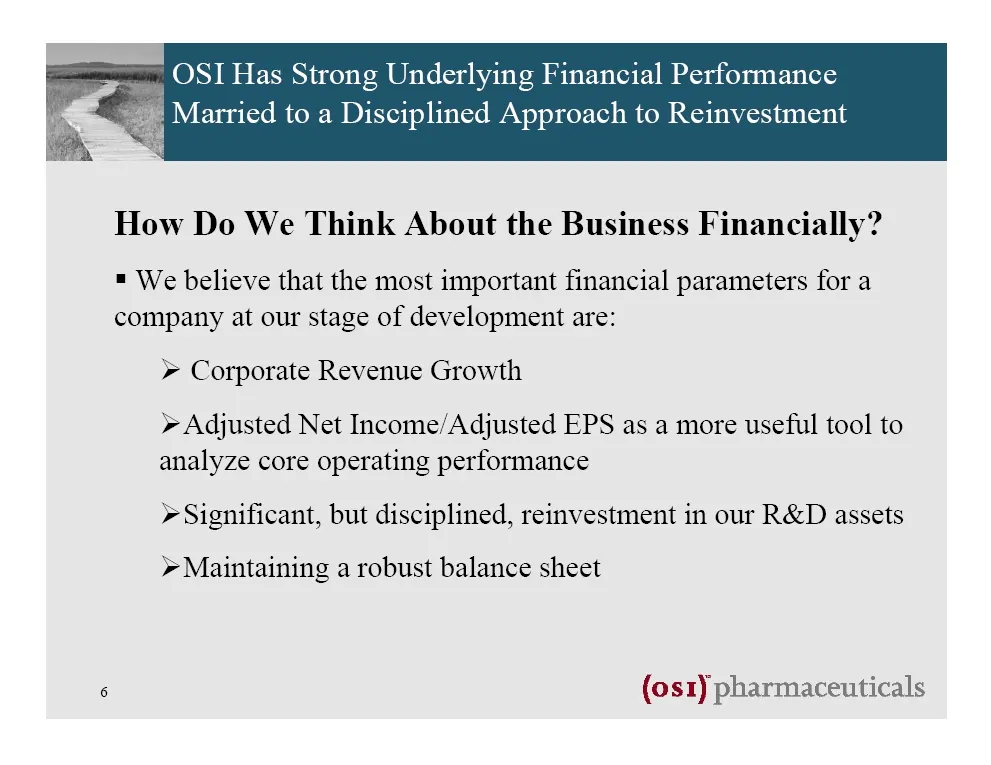
OSI Has Strong Underlying Financial Performance oe Married to a Disciplined Approach to Reinvestment “ty How Do We Think About the Business Financially? = We believe that the most important financial parameters for a company at our stage of development are: > Corporate Revenue Growth > Adjusted Net
Slide 7: Three Major Revenue Lines
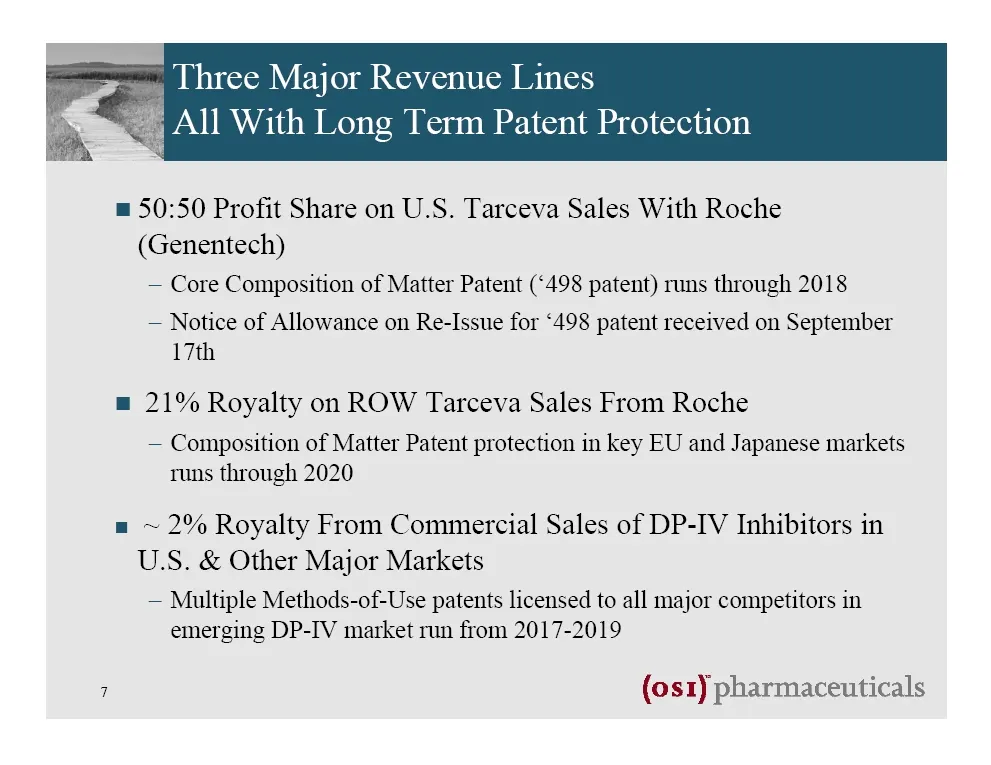
Three Major Revenue Lines Ke All With Long Term Patent Protection = 50:50 Profit Share on U.S. Tarceva Sales With Roche (Genentech) — Core Composition of Matter Patent (‘498 patent) runs through 2018 — Notice of Allowance on Re-Issue for ‘498 patent received on September 17th = 21% Royalty on ROW Ta
Slide 8: Total Revenues — Growth Has Been Solid
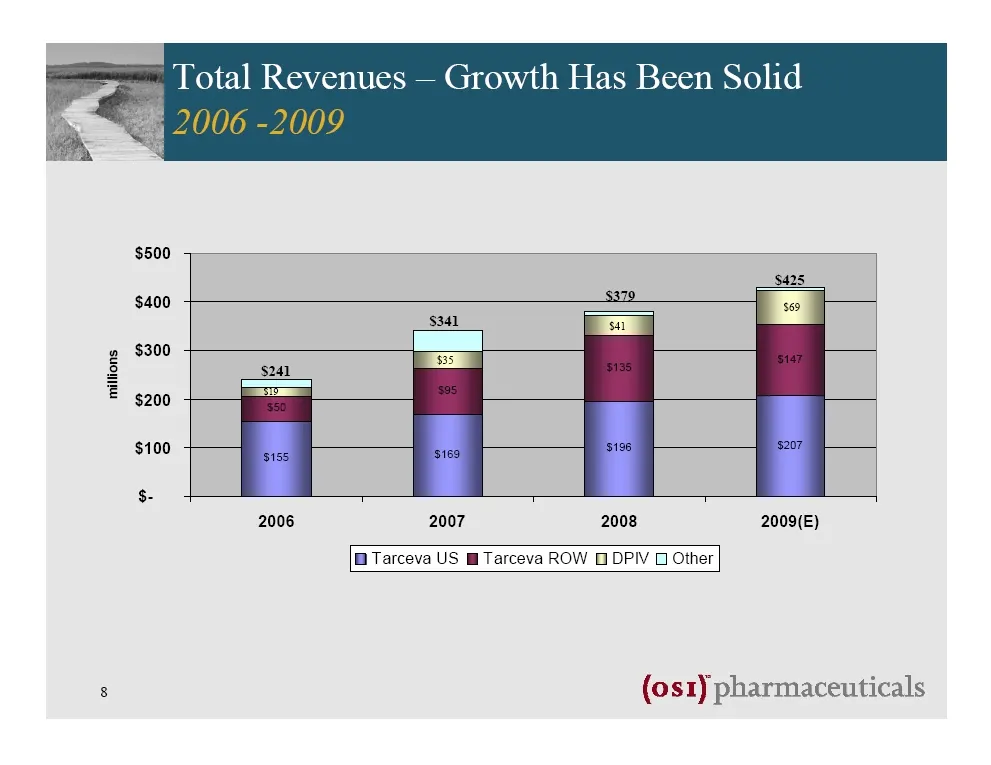
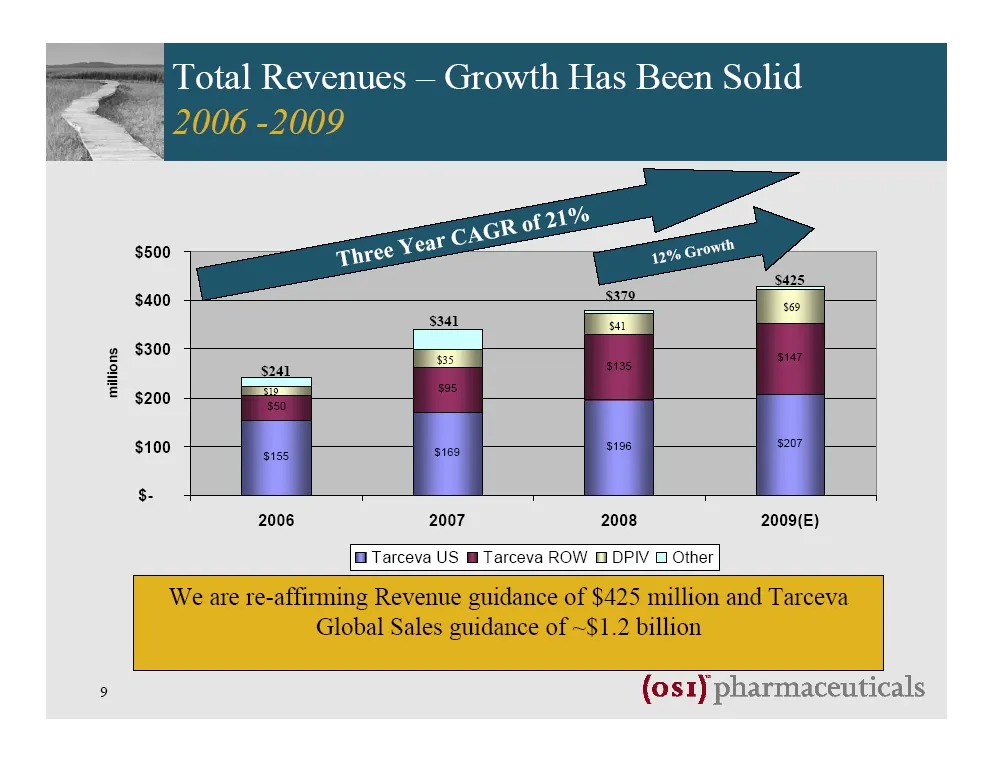
Total Revenues — Growth Has Been Solid $500 $425 $400 = a z g $300 = & S24 = $200 $100 , $- 2006 2007 2008 2009(E) B Tarceva US @ Tarceva ROW O DPIV O Other 8 (os1) pharmaceuticals
Slide 9: Total Revenues — Growth Has Been Solid -2009
. Total Revenues — Growth Has Been Solid 006 -2009 2006 2007 2008 2009(E) Tarceva US @ Tarceva ROW O DPIV O Other We are re-affirming Revenue guidance of $425 million and Tarceva Global Sales guidance of ~$1.2 billion (os1) pharmaceuticals
Slide 10: Growth: Issue is Confounded by Current Perceptions
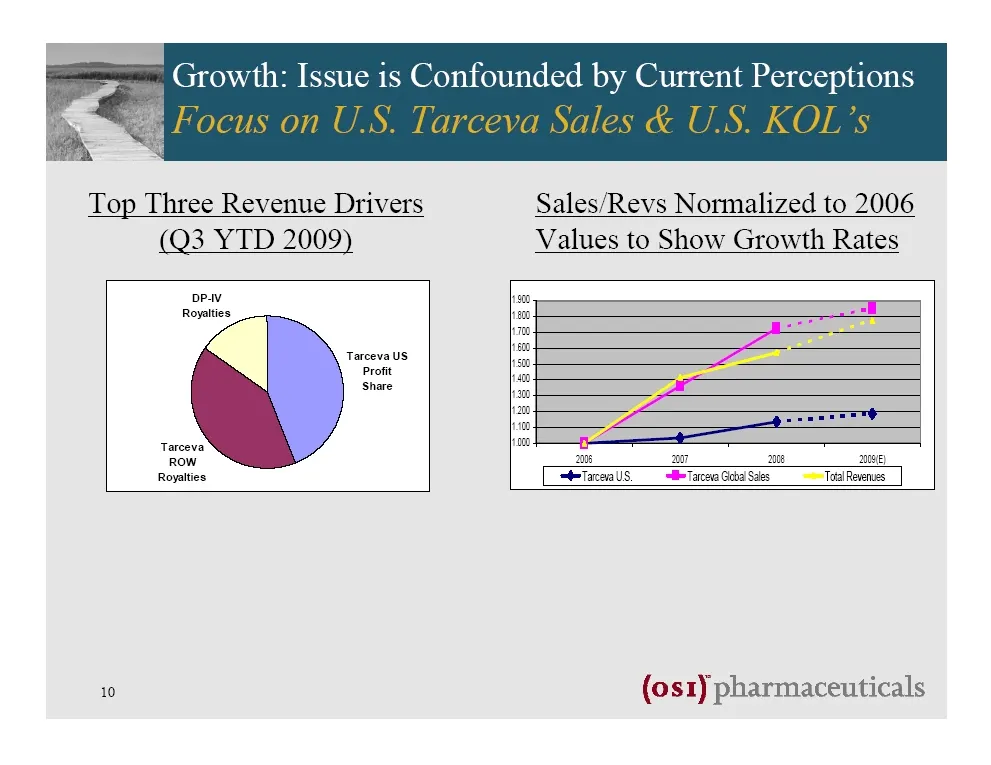
Growth: Issue is Confounded by Current Perceptions Top Three Revenue Drivers Sales/Revs Normalized to 2006 (Q3 YTD 2009) Values to Show Growth Rates opav Rowaies “I ‘to Tarceva US © a Share = 2 + ct Tarceva oo tom Po “a 18 ae Royalties stTacava US. oll Tarceva Global Sales er Total Revenues: 10 (os1
Slide 11: Growth: Issue is Confounded by Current Perceptions
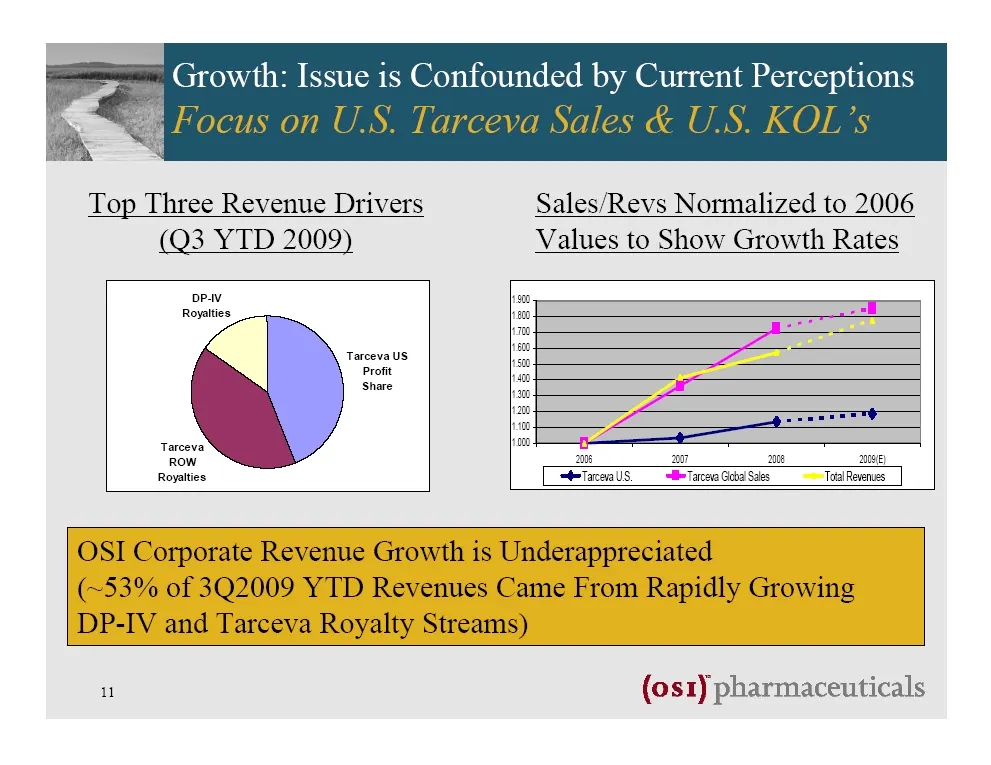
_. Growth: Issue is Confounded by Current Perceptions f Focus on U.S. Tarceva Sales & U.S. KOL’s Top Three Revenue Drivers Sales/Revs Normalized to 2006 (Q3 YTD 2009) Values to Show Growth Rates DP.v Royalties 00 Tarceva US Profit Share Tarceva ROW Royalties Be | ——— = * 2 a a ae SeiacealS __ Be Tao
Slide 12: DP-IV Patent Estate & License Portfolio
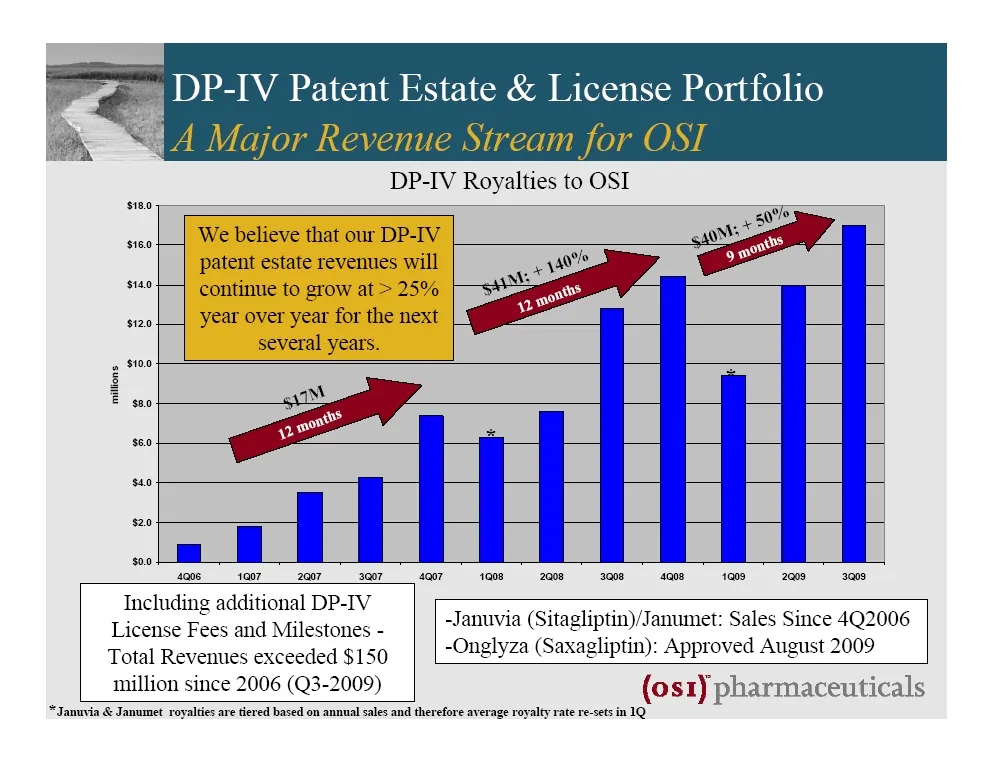
« DP-IV Patent Estate & License Portfolio DP-IV Royalties to OSI s20 2 $100 & E sao IM 5 50 s40 s20 soo | soos 10072007 3c? antag zon aan donee aan Including additional DP-IV License Fees and Milestones - Total Revenues exceeded $150 million since 2006 (Q3-2009) (os1) pharmaceuticals * Januvia & Jan
Slide 13: Fully Diluted Earnings Per Share
Fully Diluted Earnings Per Share = We use adjusted net income / adjusted EPS as a more useful tool to analyze core operating performance —In order to achieve an appropriate balance between re- investing in the business and delivering increased earnings, we will strive to deliver 10% or more adjusted
Slide 14: Well capitalized with strong cash/investments position
= We are well capitalized with a strong cash/investments position exiting 2009 and a solid overall balance sheet = We expect to generate solid cash flow in 2010 (net of capital purchases and Ardsley renovations) = We continually monitor and evaluate return on capital, in- licensing opportunities and
Slide 15: Summary of Outstanding Notes
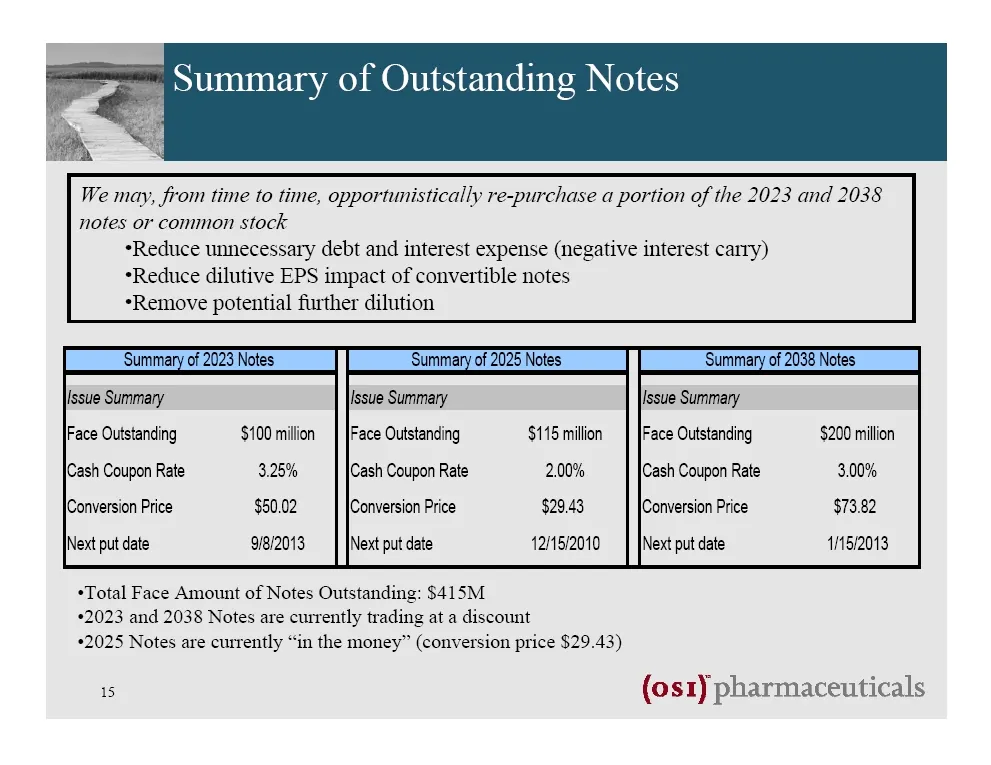
. Summary of Outstanding Notes We may, from time to time, opportunistically re-purchase a portion of the 2023 and 2038 notes or common stock Reduce unnecessary debt and interest expense (negative interest carry) *Reduce dilutive EPS impact of convertible notes -Remove potential further dilution liss
Slide 16: Strong Cash Flow Has Led To Steadily Strengthening Balance Sheet
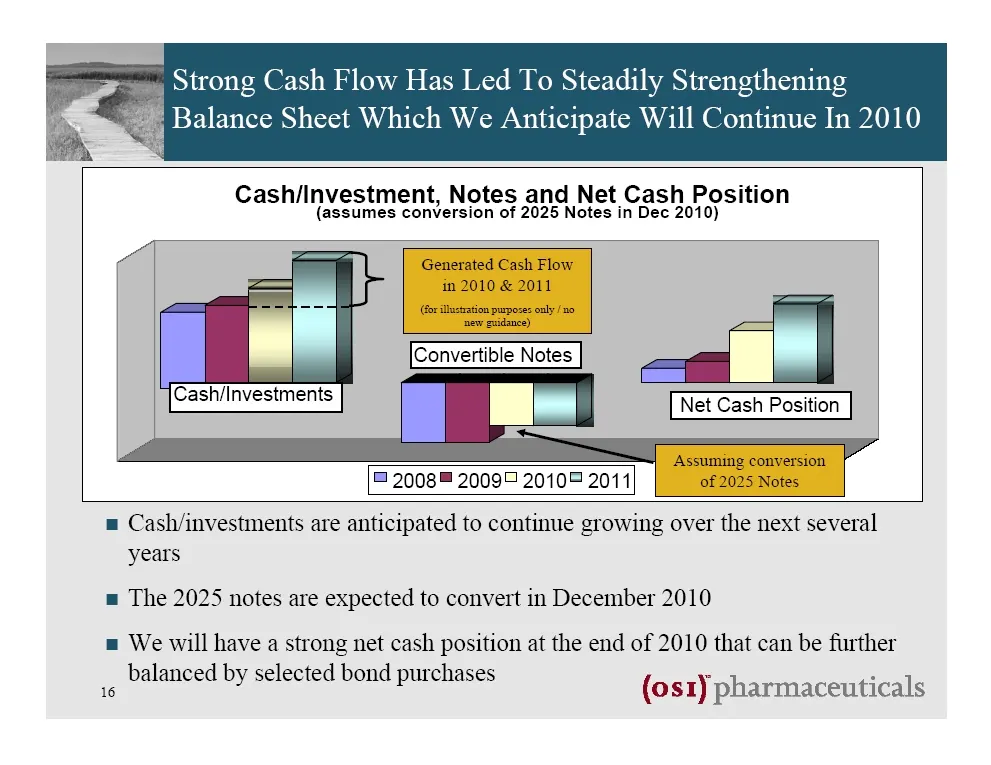
Strong Cash Flow Has Led To Steadily Strengthening > Balance Sheet Which We Anticipate Will Continue In 2010 Cash/Investment, Notes and Net Cash Position (assumes conversion of 2025 Notes in Dec 2010) 7 oy | Convertible Notes h/Investments Net Cash Position = 2008™ 20090 20105 2011 = Cash/investment
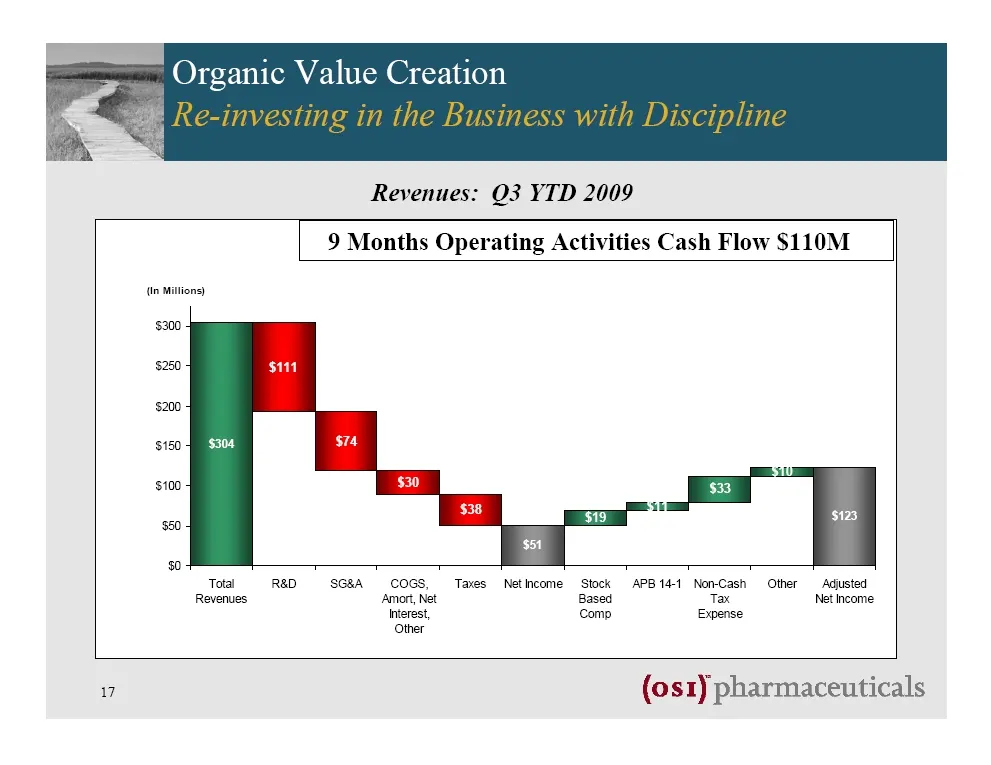
Slide 17: Organic Value Creation
Organic Value Creation Revenues: O03 YTD 2009 (tn Mitions) ss a 9 Months Operating Activities Cash Flow $110M Other 17 (os1) pharmaceuticals
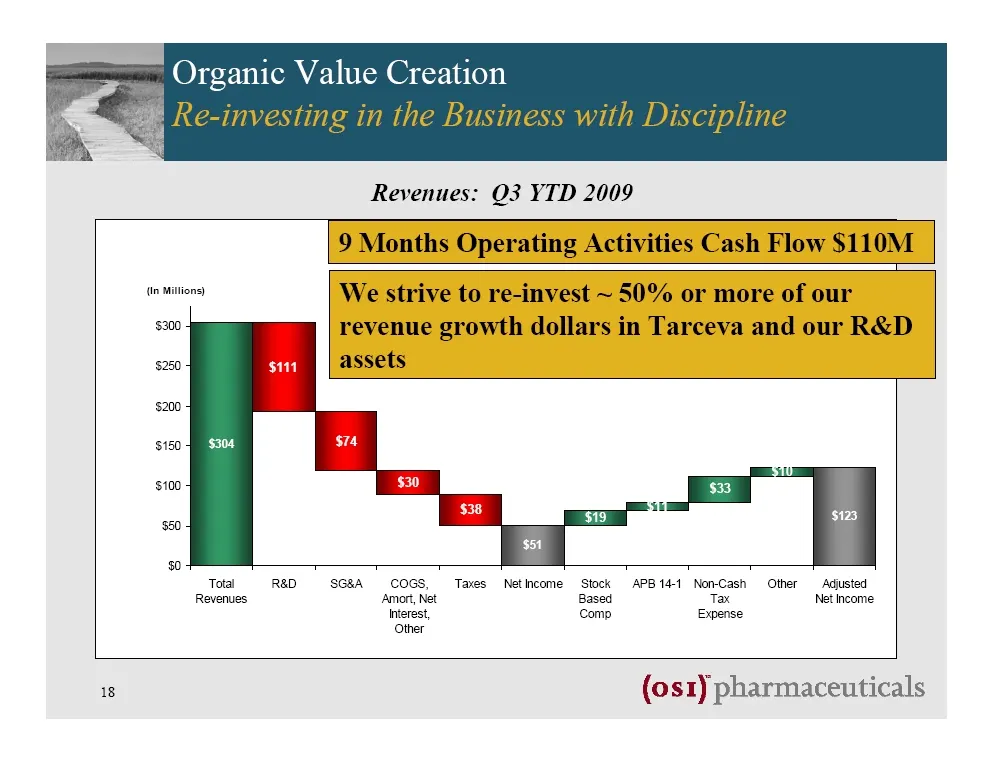
Slide 18: Organic Value Creation
Organic Value Creation Re-investing in the Business with Revenues: O03 YTD 2009 9 Months Operating Activities Cash Flow $110M. fm mations We strive to re-invest ~ 50% or more of our $300 revenue growth dollars in Tarceva and our R&D assets $250 s $60 so Total © R&D SGBA_ COGS, = Taxes. Net Income St
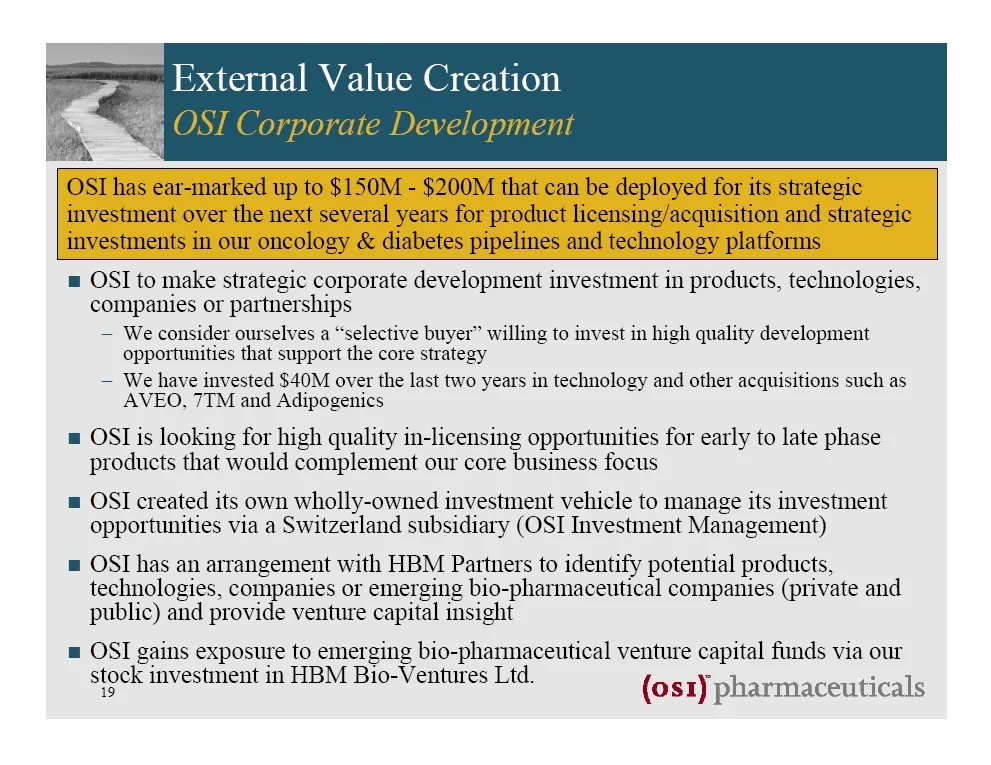
Slide 19: External Value Creation: OSI Corporate Development
External Value Creation 5 OST Corporate Development OST has ear-marked up to $150M - $200M that can be deployed for its strategic investinent over the next several years for product licensing/acquisition and strategic investinents in our oncology & diabetes pipelines and technology platforms = OSI t
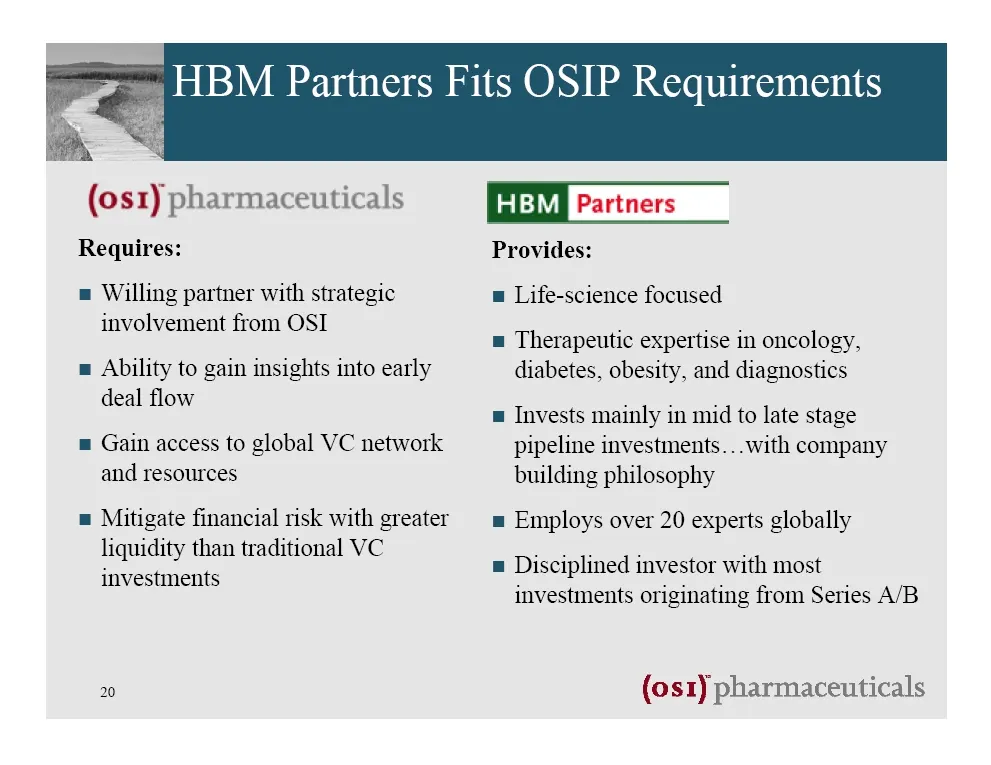
Slide 20: HBM Partners Fits OSIP Requirements
HBM Partners Fits OSIP Requirements (os1) pharmaceuticals Requires: = Willing partner with strategic involvement from OSI = Ability to gain insights into early deal flow = Gain access to global VC network and resources = Mitigate financial risk with greater liquidity than traditional VC investments
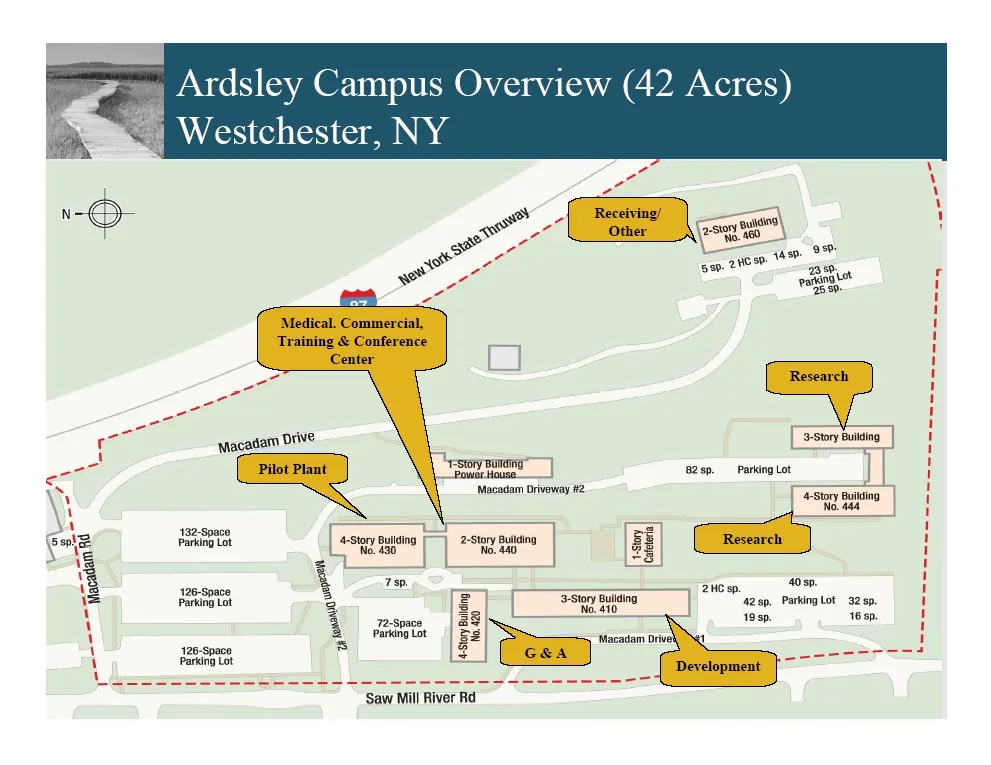
Slide 21: Ardsley Campus Overview (42 Acres)
» Westchester, NY co ‘macadam Drive ‘Macadam Driveway #2 Ardsley Campus Overview (42 Acres) 8-Story Building aS) 4Stor Buin Ne aaa sn 2HC sp. Crs 425p, Parking Lot 32 sp. 1 1 1 uy = 4132-Spaco Wz 4-Story Bulling 2-Story Building &. ere ae c cad No. aa. & 4 S sees t= = rang ‘¥-Story Building “ Parkin
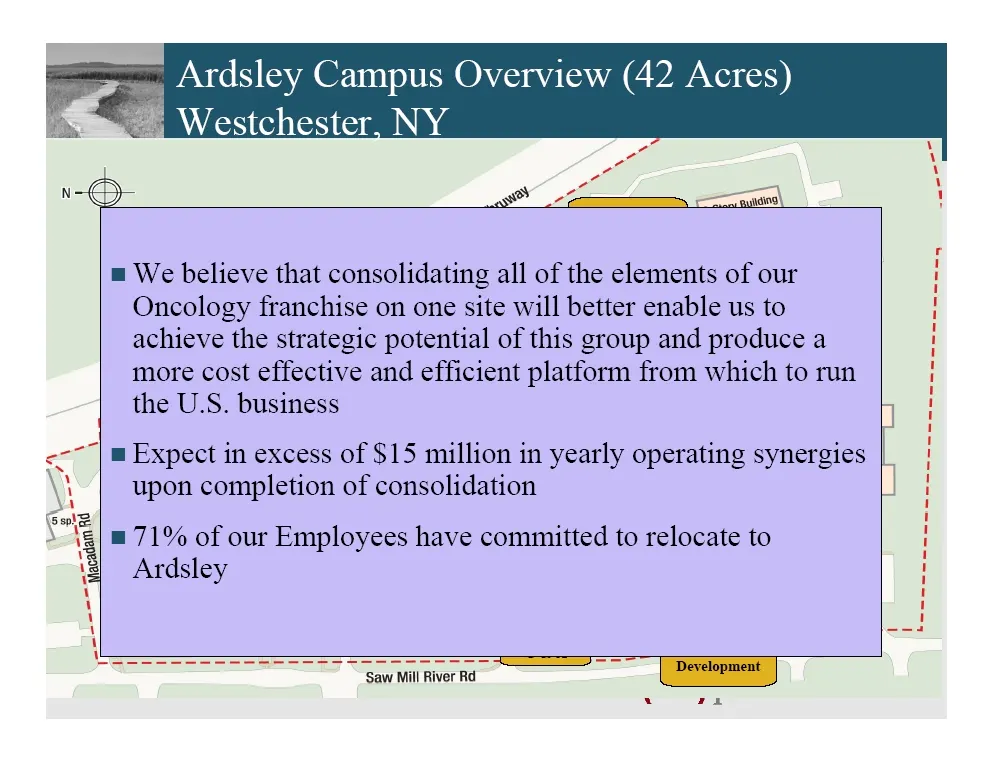
Slide 22: Ardsley Campus Overview (42 Acres)
. Ardsley Campus Overview (42 Acres) > Westchester = We believe that consolidating all of the elements of our Oncology franchise on one site will better enable us to achieve the strategic potential of this group and produce a more cost effective and efficient platform from which to run the U.S. busi
Slide 23: OSI Pharmaceuticals 2010
OSI Pharmaceuticals 2010: = Global revenue growth story (maintenance, EGFR mutation, ex-US, DP-IV) u Appropriate balance between revenue and re- investment in the business especially in R&D and corporate development = Reasonable growth in adjusted EPS = Maintaining an efficient balance sheet in term
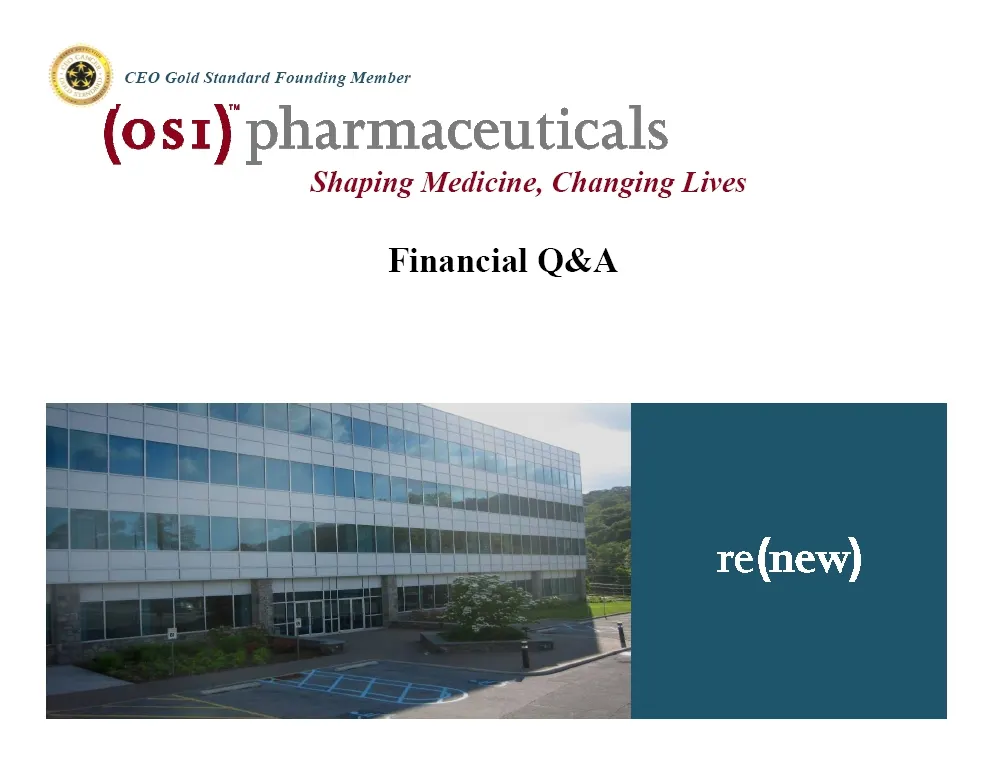
Slide 24: Financial Q&A
CEO Gold Standard Founding Member (os1) pharmaceuticals Shaping Medicine, Changing Lives Financial Q&A
Slide 25: R&D Introduction
® CEO Gold Standard Founding Member (os1) pharmaceuticals Shaping Medicine, Changing Lives Analyst Day December 3, 2009 Colin Goddard, Ph.D. R&D Introduction
Slide 26: OSI 2009: A Strong Portfolio
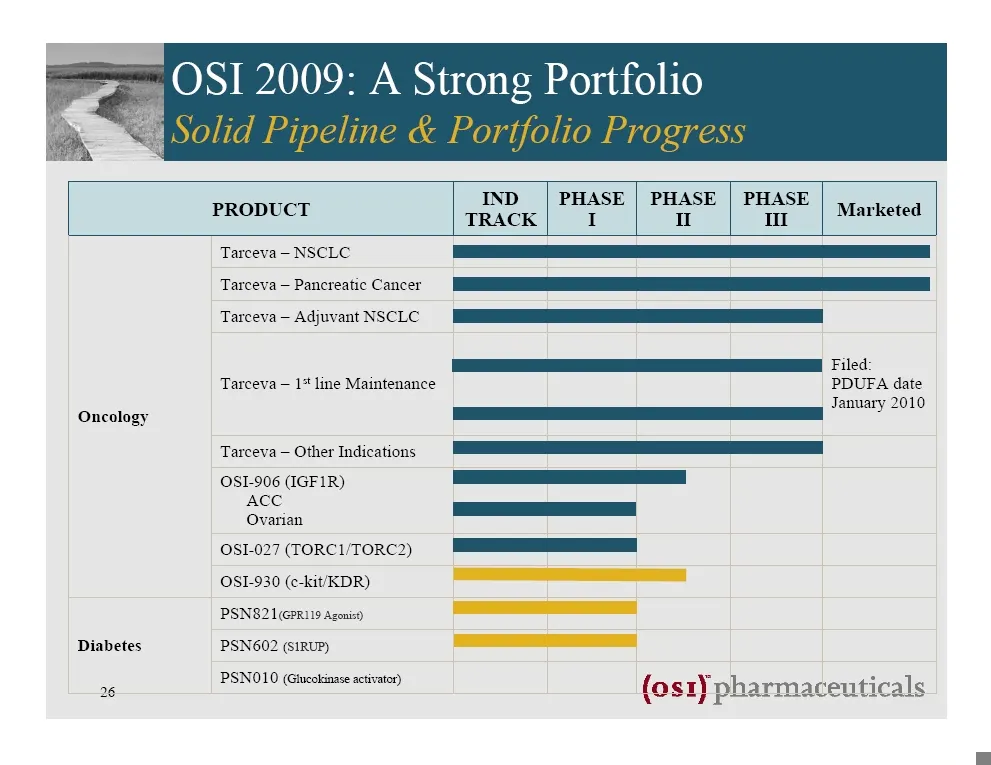
OSI 2009: A Strong Portfolio | IND PHASE | PHASE | PHASE Marketed ERODED TRACK| I i fig Tarceva — NSCLC Tarceva — Pancreatic Cancer Tarceva — Adjuvant NSCLC Filed. Tarceva — 1* line Maintenance PDUFA date January 2010 Oncology | Tareva—Oter indications OSI-906 (IGF1R) oes Es Ovarian: SHovIRIIR) = GR
Slide 27: OSI 2009: A Strong Portfolio
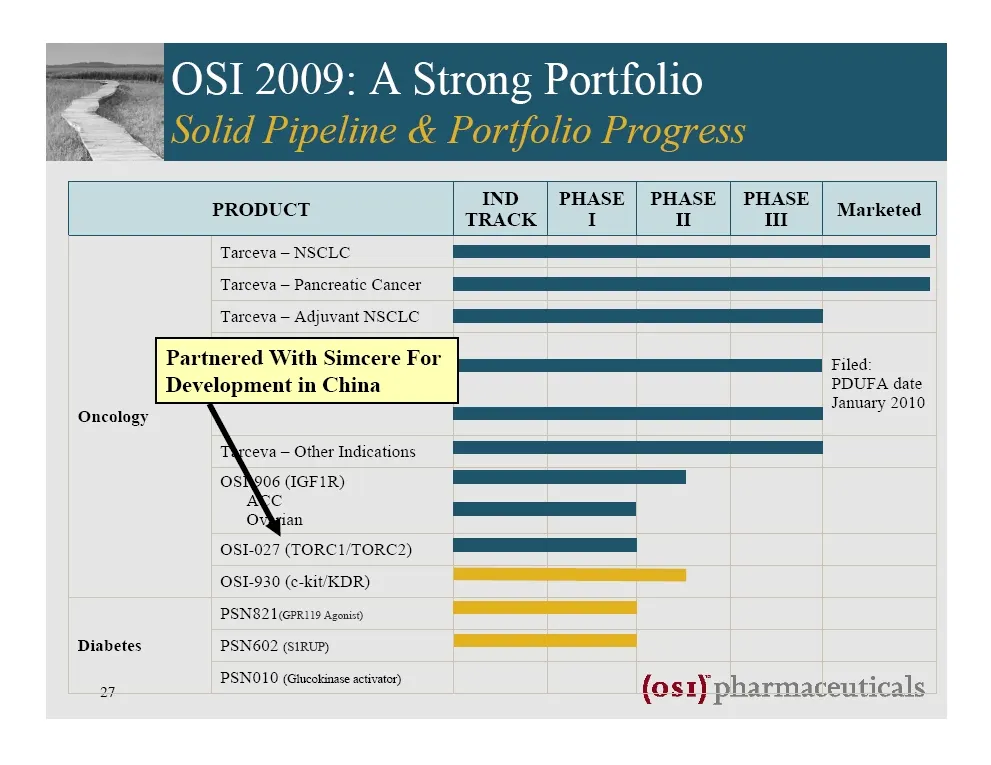
OSI 2009: A Strong Portfolio PRODUCT PHASE TRACK I Marketed Oncology Diabetes Tarceva — NSCLC Tarceva — Pancreatic Cancer Tarceva — Adjuvant NSCLC Partnered With Simcere For Development in China eva — Other Indications OsN006 (IGF1R) AXc Ovgian OSI-027 (TORC1/TORC2) OSI-930 (c-kit/KDR) PSN821(CPR119
Slide 28: OSI 2009: A Strong Portfolio
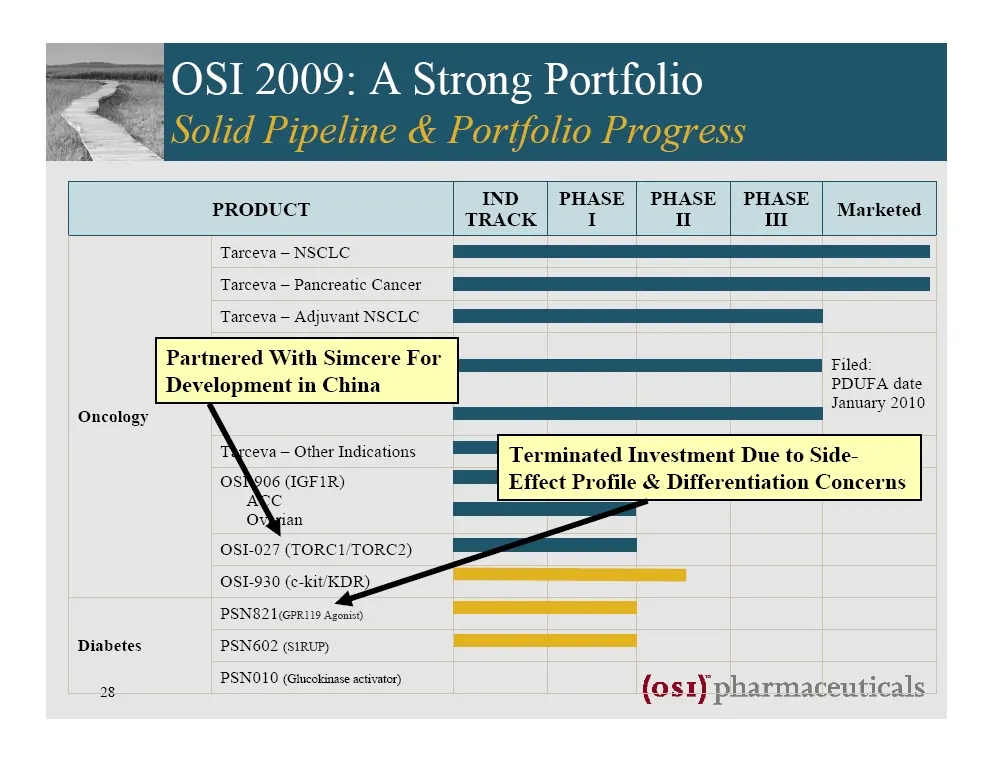
OSI 2009: A Strong Portfolio | IND PHASE | PHASE | PHASE Marketed ERODED TRACK| I i fig Tarceva — NSCLC Tarceva — Pancreatic Cancer Tarceva — Adjuvant NSCLC Partnered With Simcere For |uug EE Filed Development in China PDUFA date January 2010 Oncology Dt a eva — Other Indications OsN006 (IGF1R) AXc
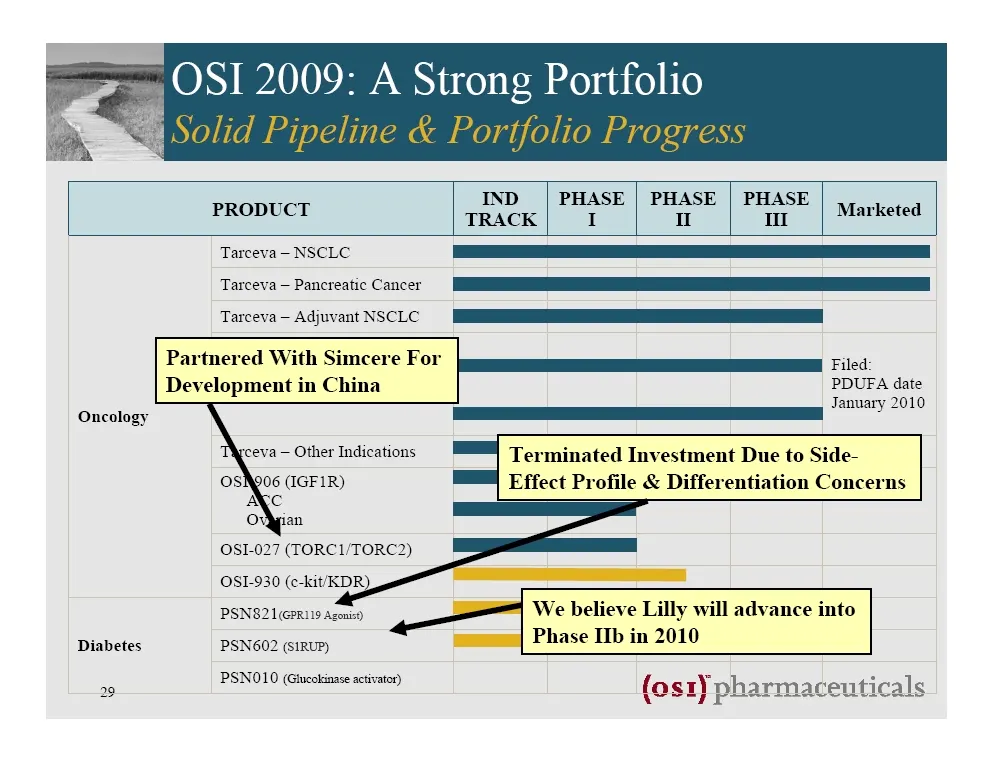
Slide 29: OSI 2009: A Strong Portfolio
OSI 2009: A Strong Portfolio | IND PHASE | PHASE | PHASE Marketed ERODED TRACK| I i fig Tarceva — NSCLC Tarceva — Pancreatic Cancer Tarceva — Adjuvant NSCLC Partnered With Simcere For |uug EE Filed Development in China PDUFA date January 2010 Oncology Dt ‘ceva — Other Indications OsN006 (IGF1R) Nc O
Slide 30: Update on Diabetes & Obesity
(os1) pharmaceuticals Update on Diabetes & Obesity Jonathan Rachman, M.D., Ph.D. Senior Vice President, Diabetes & Obesity Z Soe Ya Z
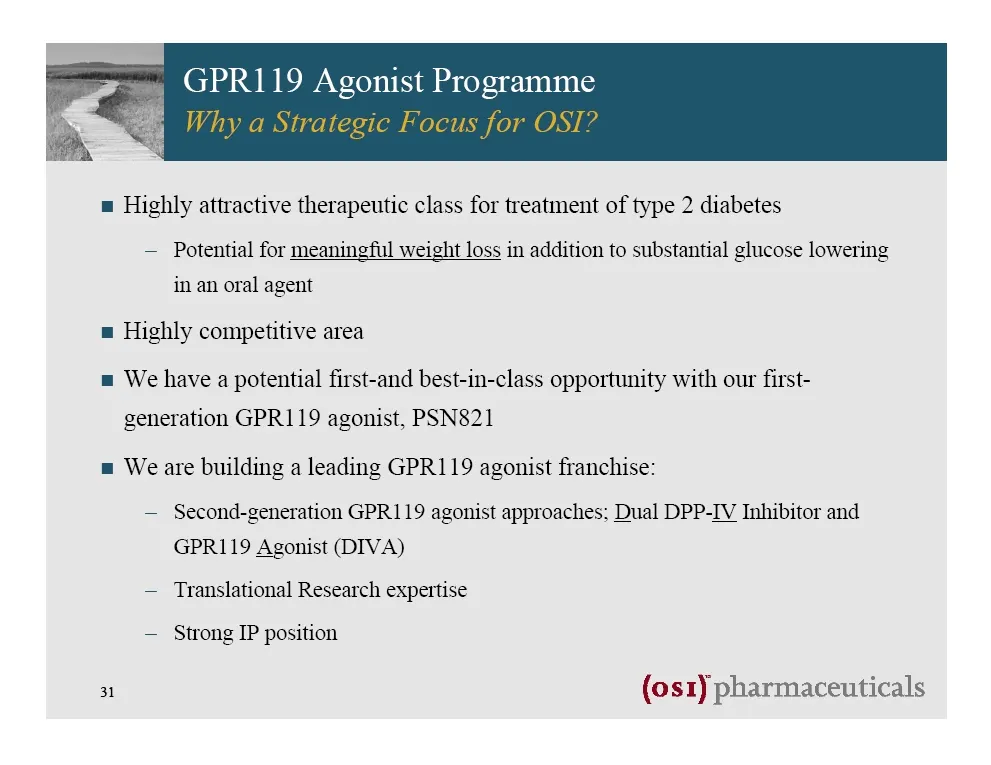
Slide 31: Highly attractive therapeutic class for type 2 diabetes
= Highly attractive therapeutic class for treatment of type 2 diabetes — Potential for meaningful weight loss in addition to substantial glucose lowering in an oral agent = Highly competitive area = We have a potential first-and best-in-class opportunity with our first- generation GPR119 agonist, PS
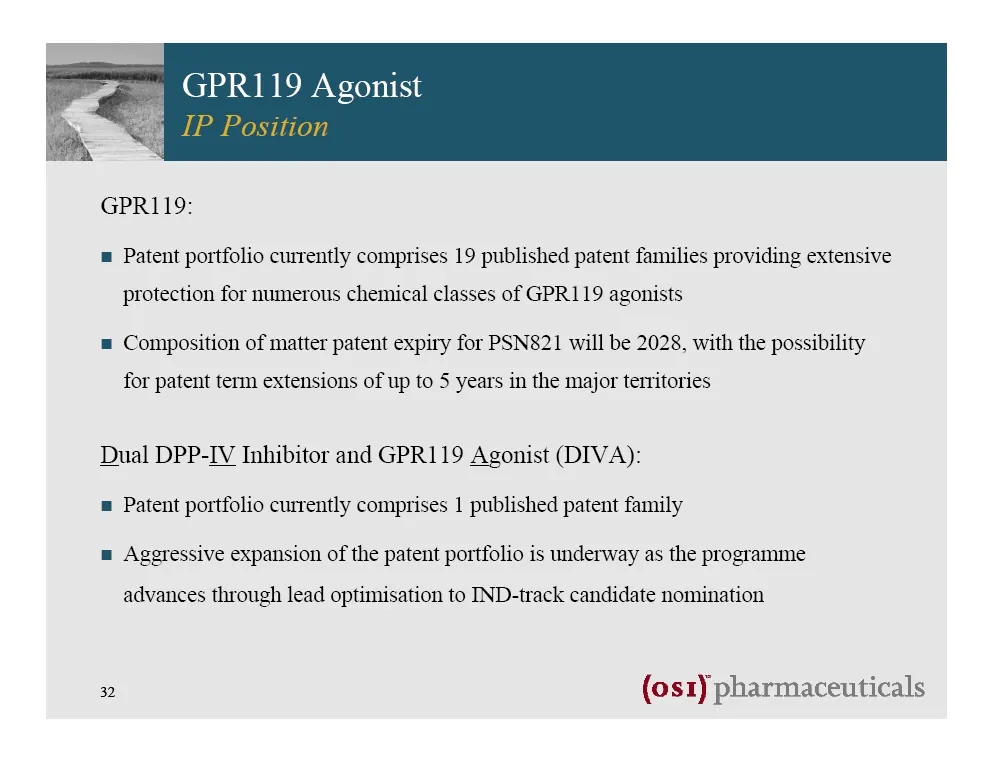
Slide 32: GPR119 and DIVA patent portfolio
GPR119: = Patent portfolio currently comprises 19 published patent families providing extensive protection for numerous chemical classes of GPR119 agonists = Composition of matter patent expiry for PSN821 will be 2028, with the possibility for patent term extensions of up to 5 years in the major ter
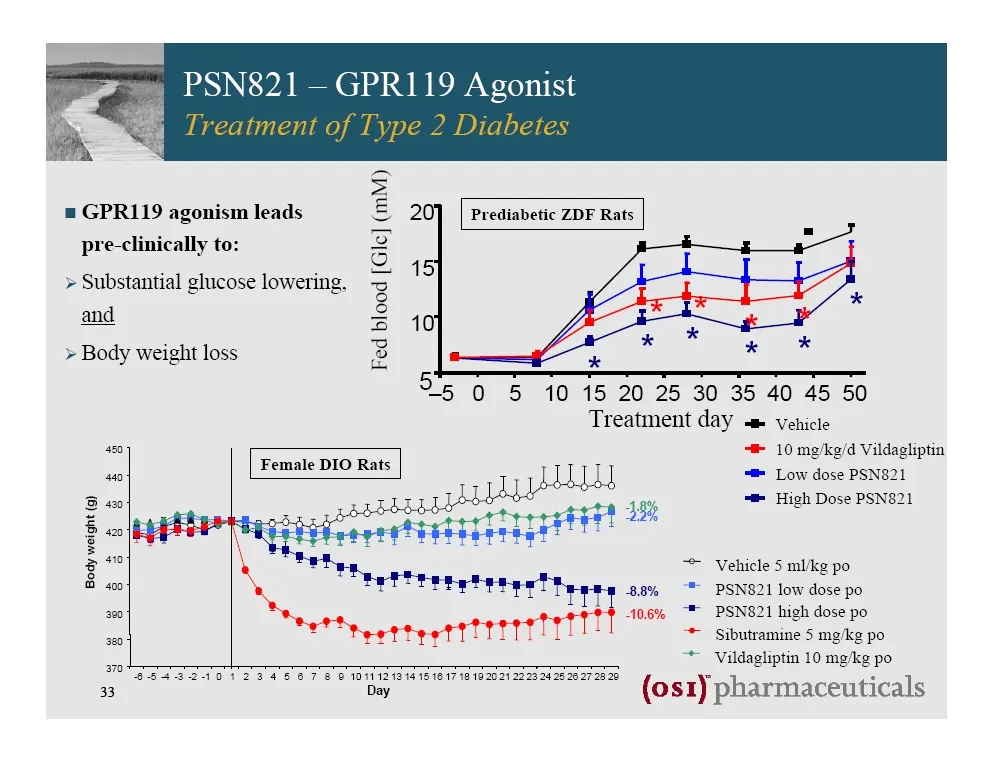
Slide 33: PSN821 — GPR119 Agonist
PSN821— GPR119 Agonist = GPR119 agonism leads pre-clinically to: N Prediabetic ZDF Rats > Substantial glucose lowering, and > Body weight loss = o Fed blood [Gle] (mM) q 55 0 5 10 15 20 25 30 35 40 45 50 Treatment day ~m vVenicle + 10 mg/kg/d Vildagliptin “® Low dose PSN821 ™® High Dose PSN821 Femal
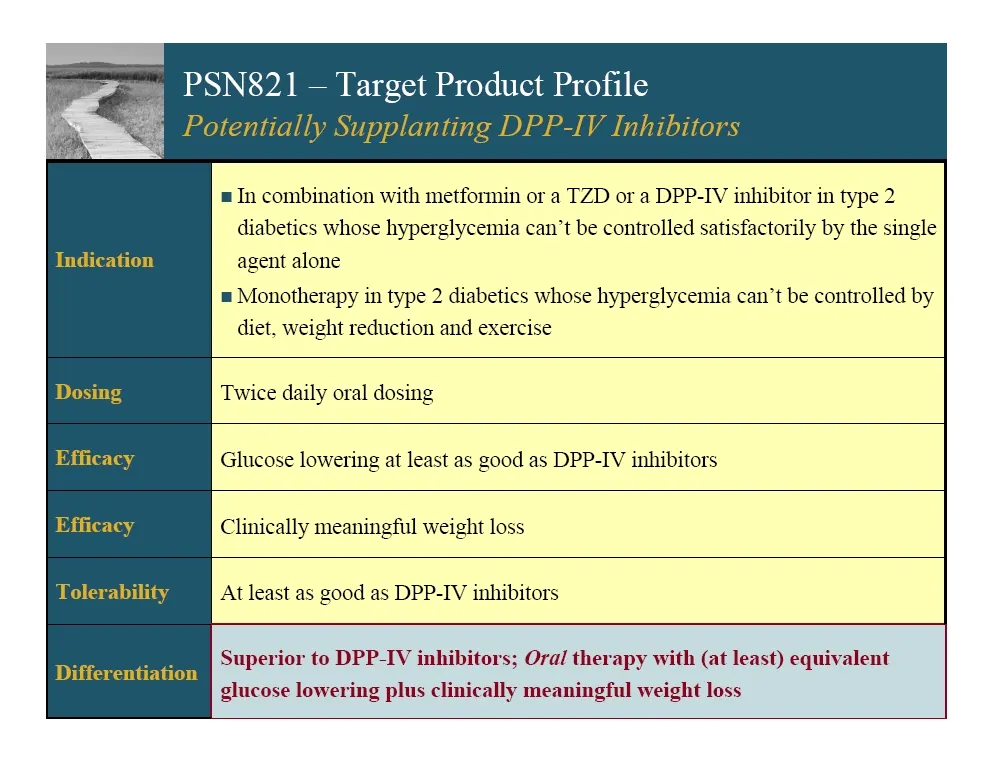
Slide 34: PSN821 — Target Product Profile
PSN821 — Target Product Profile Potentially Supplanting DPP-IV Inhibitors = In combination with metformin or a TZD or a DPP-IV inhibitor in type 2 diabetics whose hyperglycemia can’t be controlled satisfactorily by the single Indication agent alone = Monotherapy in type 2 diabetics whose hyperglycem
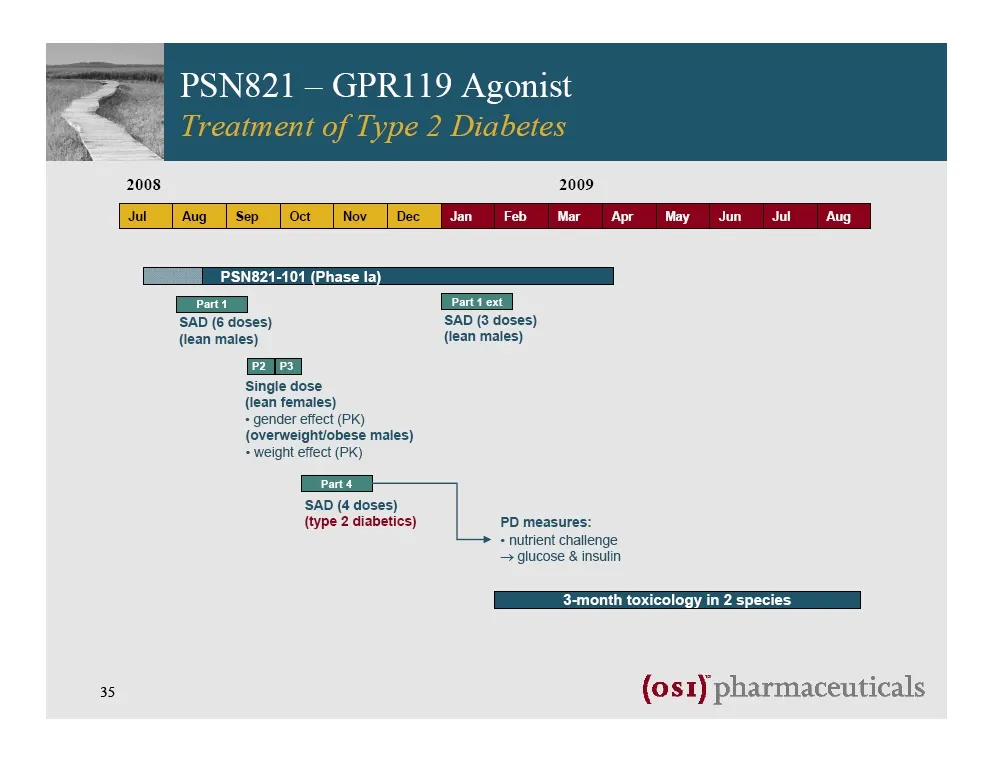
Slide 35: PSN821 — GPR119 Agonist
PSN821 — GPR119 Agonist | Part ext | SAD (6 doses) SAD (3 doses) (lean males) (lean males) [P23 | Single dose (lean females) + gender effect (Pk) (overweightfobese males) + weight effect (PK) =, ‘SAD (4 doses) {type 2 diabetics) PD measures: ‘—> «nutrient challenge — glucose & insulin 3-month toxico
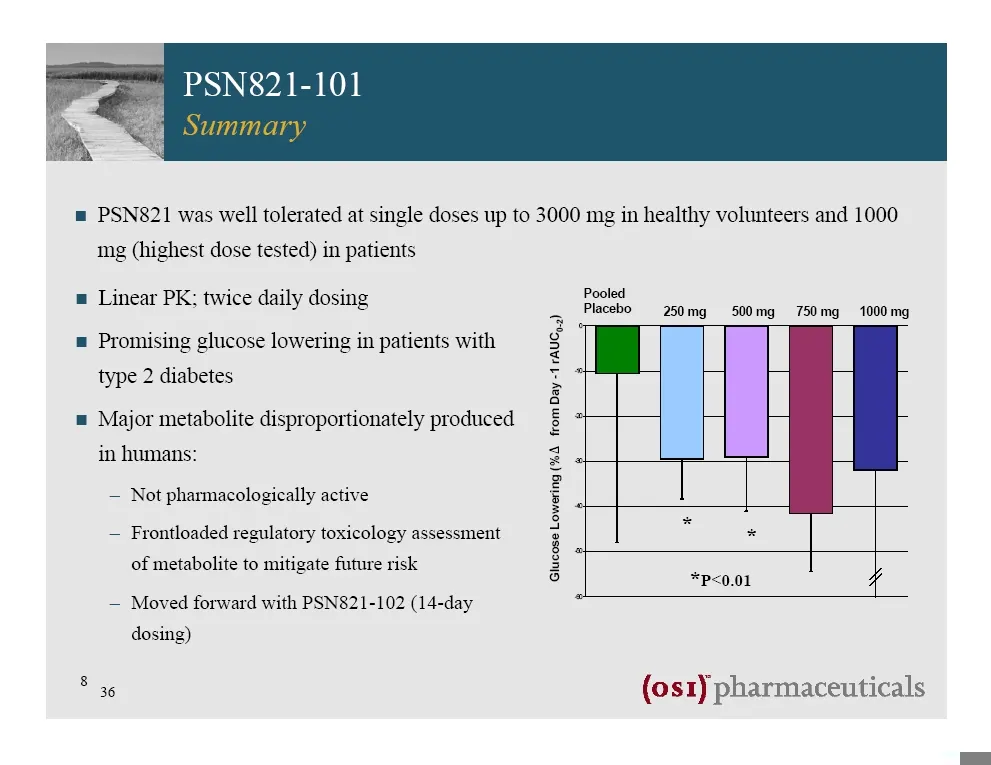
Slide 36: PSN821-101
PSN821-101 = PSN821 was well tolerated at single doses up to 3000 mg in healthy volunteers and 1000 ing (highest dose tested) in patients = Linear PK: twice daily dosing Escled iy Placebo 250mg 500mg = 750mg = 1000 mg = Promising glucose lowering in patients with type 2 diabetes = Major metabolite d
Slide 37: PSN821 — GPR119 Agonist
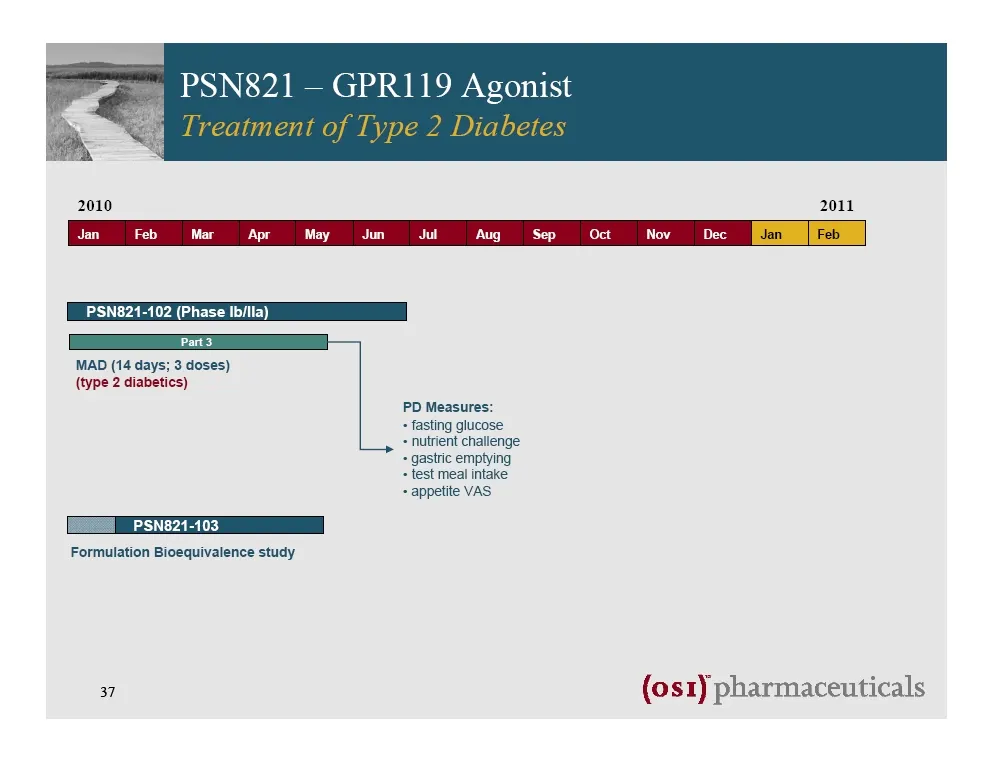
PSN821 — GPR119 Agonist ed iy 2010 2011 Jan Feb Mar Apr May Jul Aug Sep Oct Nov Dec PSN821-102 (Phase Ibilla) EE ee MAD (14 days; 3 doses) (type 2 diabetics) PD Measures: + fasting glucose = nutrient challenge + gastric emptying + test meal intake + appetite VAS PSN821-103 Formulation Bioequivalence
Slide 38: PSN821 — GPR119 Agonist
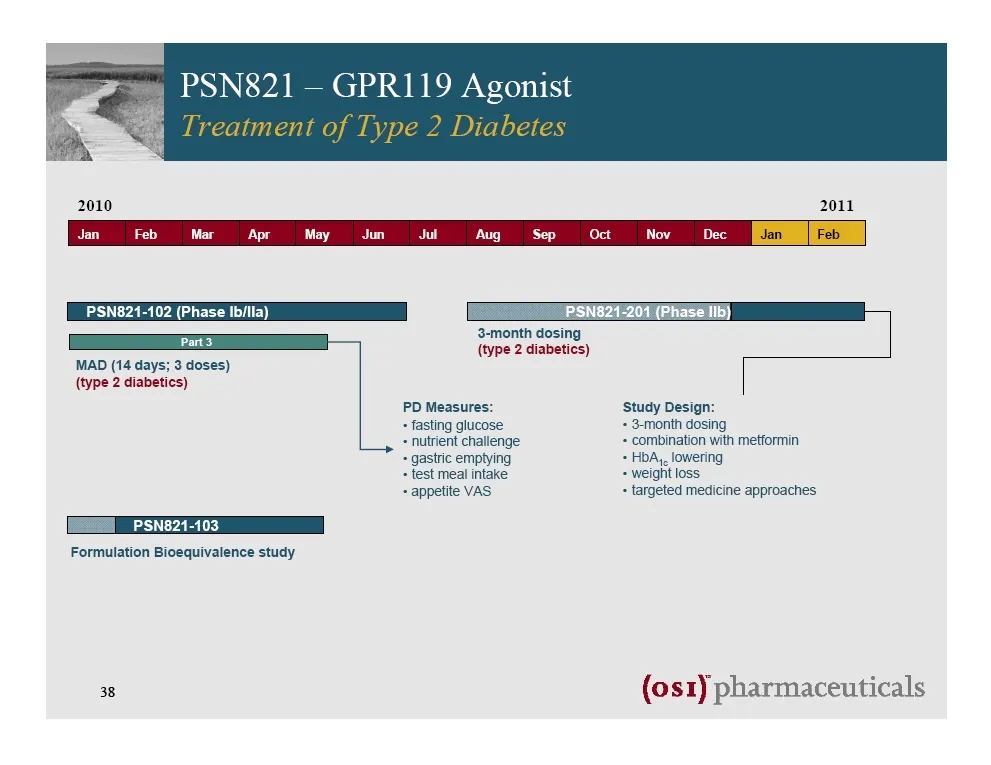
PSN821 — GPR119 Agonist ed iy 2010 2011 Jul Aug Sep Oct Nov Dec 3-month dosing EE ee (type 2 diabetics) MAD (14 days; 3 doses) (type 2 diabetics) PD Measures: ‘Study Design: + fasting glucose + 3-month dosing = nutrient challenge + combination with metformin + gastric emptying + HbA,, lowering + tes
Slide 39: PSN821 — GPR119 Agonist
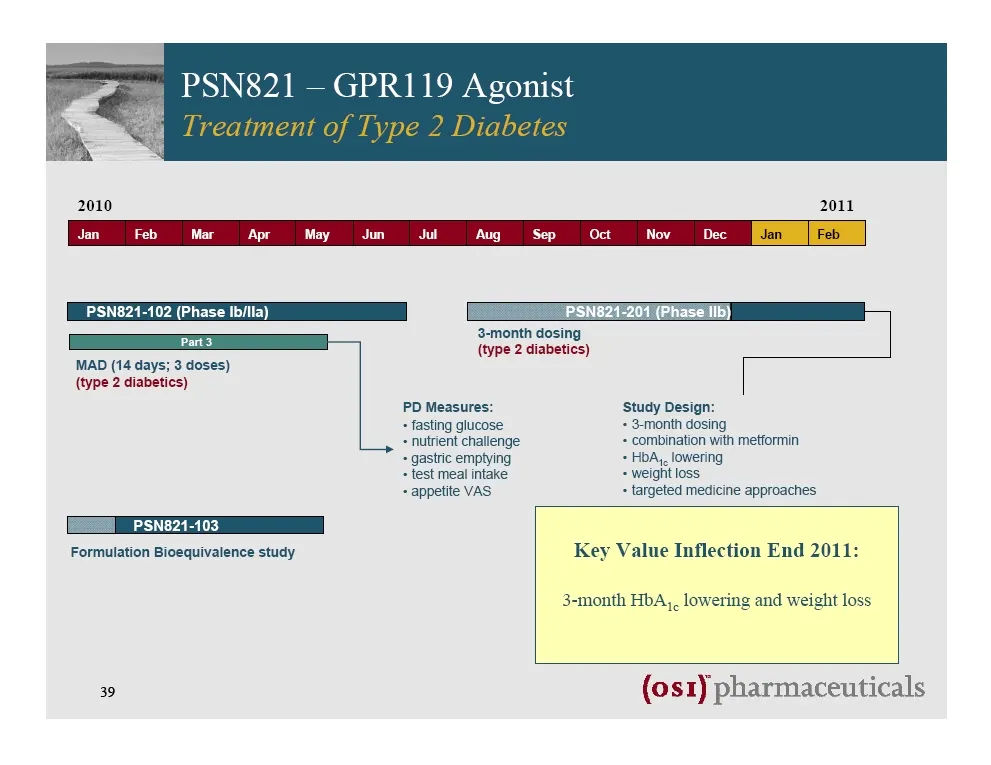
PSN821 — GPR119 Agonist 2010 2011 Jan Feb Mar Apr May Jul Aug Sep Oct Nov Dec PSN821-102 (Phase Ib/Ila) PSN821-201 (Phase IIb) a pane erare (type 2 diabetics) MAD (14 days; 3 doses) (type 2 diabetics) PD Measures: ‘Study Design: = fasting glucose + 3-month dosing = nutrient challenge + combination w
Slide 40: Dual DPP-IV Inhibitor and GPR119 Agonist (DIVA)
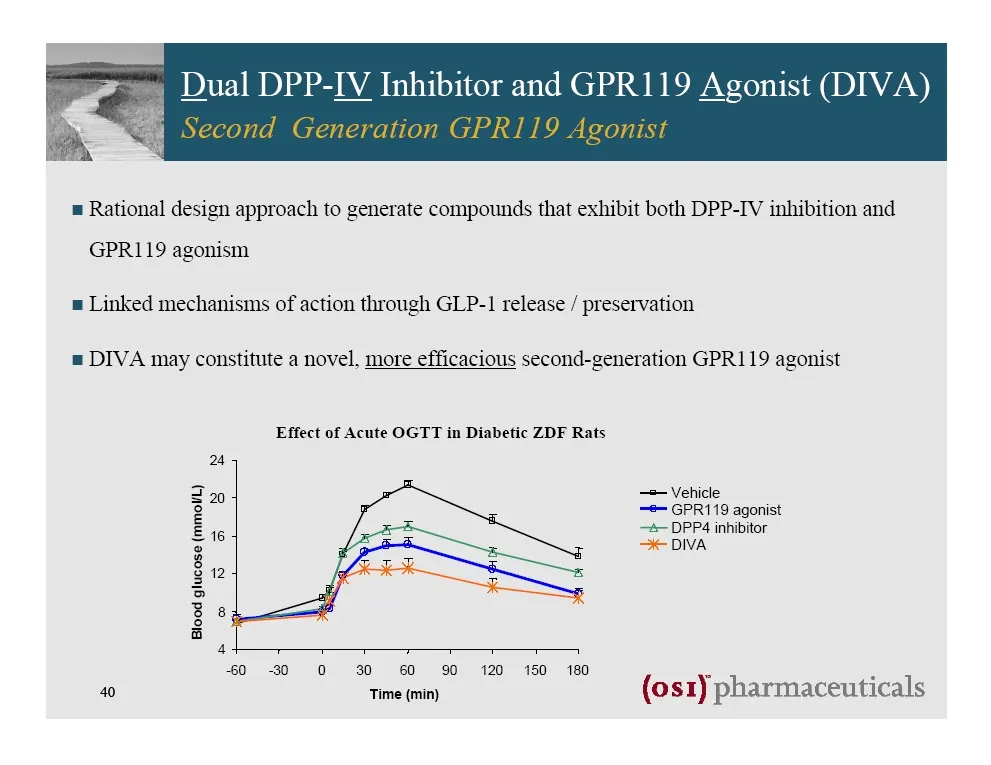
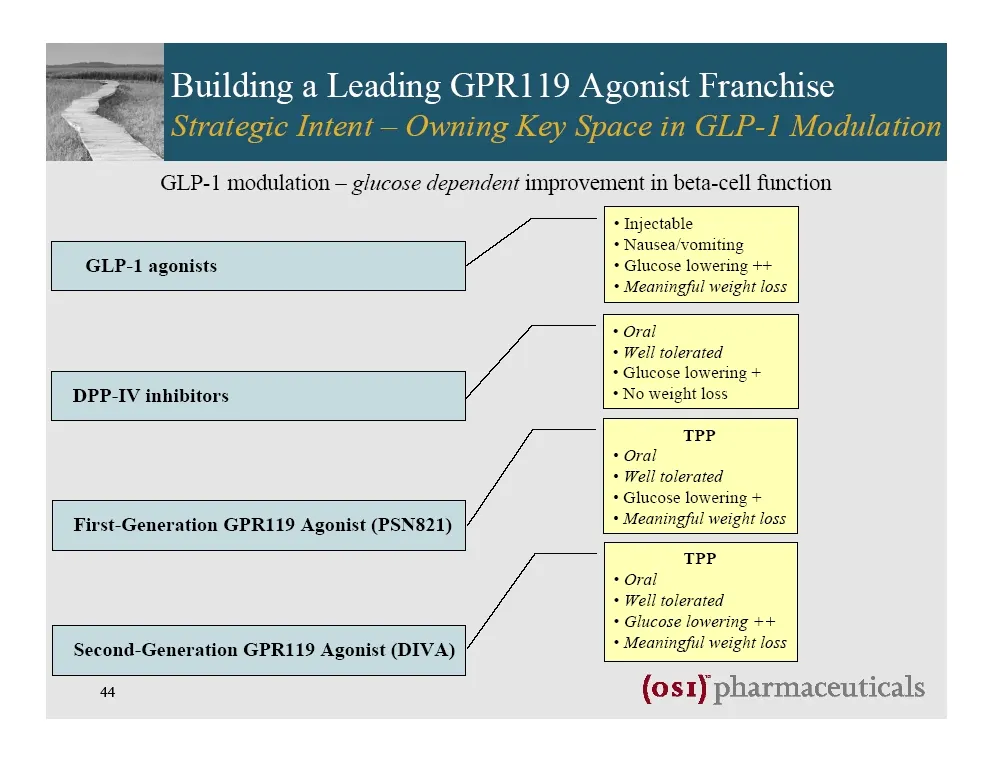
Dual DPP-IV Inhibitor and GPR119 Agonist (DIVA) = Rational design approach to generate compounds that exhibit both DPP-IV inhibition and GPR119 agonism. = Linked mechanisms of action through GLP-1 release / preservation = DIVA may constitute a novel. more efficacious second-generation GPR119 agonist
Slide 41: Building a Leading GPR119 Agonist Franchise
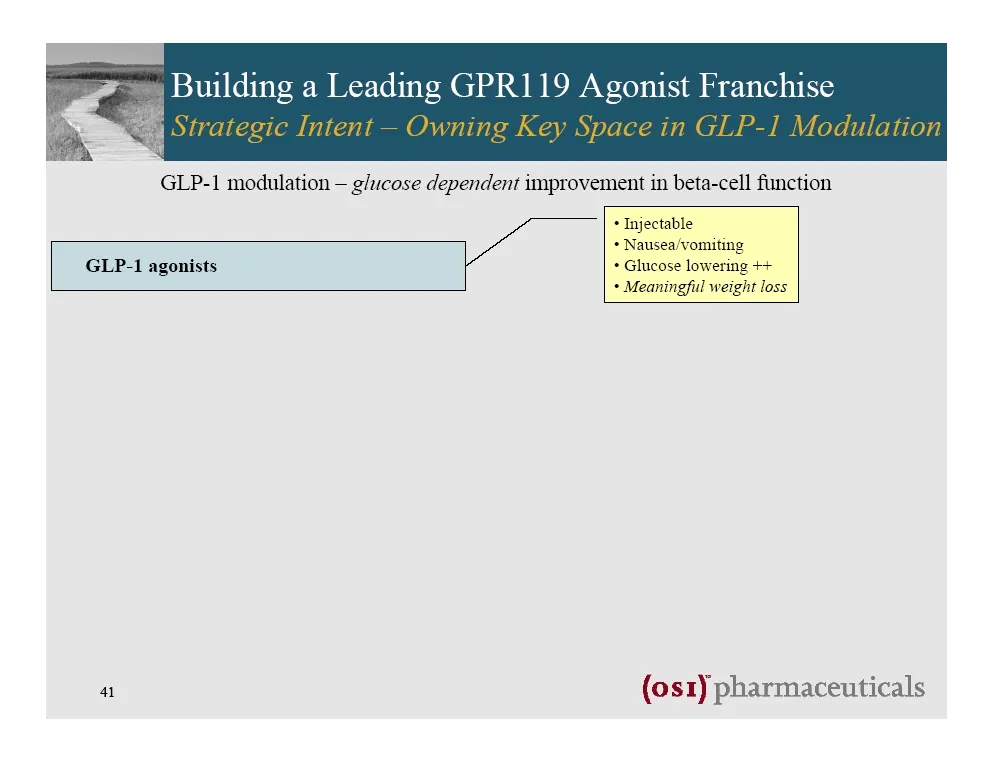
Building a Leading GPR119 Agonist Franchise GLP-1 modulation — g/cose dependent improvement in beta-cell function GLP-1 agonists 41 + Injectable + Nausea/vomiting + Glucose lowering ++ + Meaningful weight loss (os1) pharmaceuticals
Slide 42: Building a Leading GPR119 Agonist Franchise
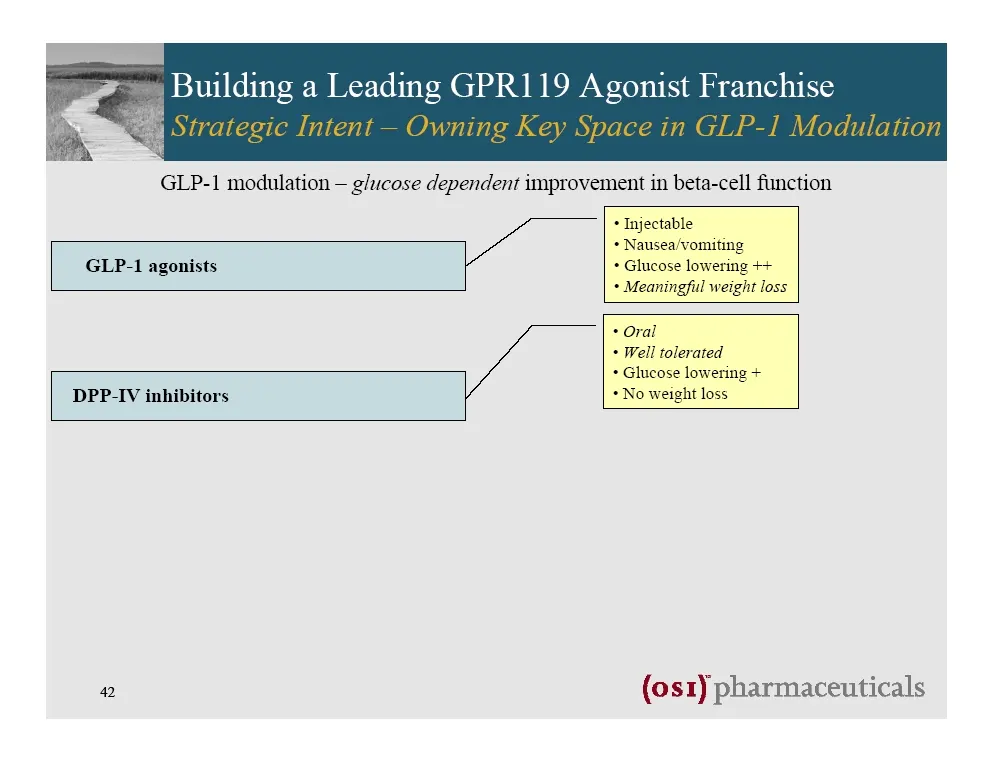
Building a Leading GPR119 Agonist Franchise GLP-1 modulation — g/cose dependent improvement in beta-cell function GLP-1 agonists DPP-IV inhibitors 42 + Injectable + Nausea/vomiting + Glucose lowering ++ + Meaningful weight loss + Oral + Well tolerated + Glucose lowering + + No weight loss (os1) phar
Slide 43: Building a Leading GPR119 Agonist Franchise
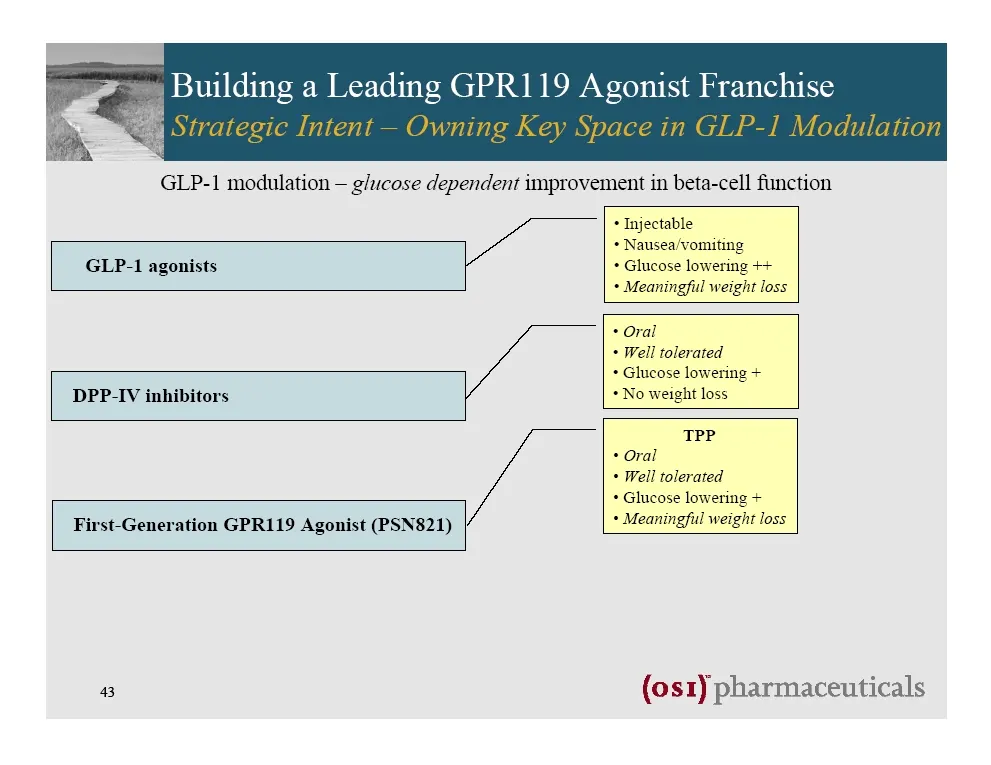
» Building a Leading GPR119 Agonist Franchise GLP-1 modulation — g/cose dependent improvement in beta-cell function GLP-1 agonists DPP-IV inhibitors First-Generation GPR119 Agonist (PSN821) 4B + Injectable + Nausea/vomiting + Glucose lowering ++ + Meaningful weight loss + Oral + Well tolerated + Glu
Slide 44: Building a Leading GPR119 Agonist Franchise
Building a Leading GPR119 Agonist Franchise GLP-1 modulation — g/cose dependent improvement in beta-cell function GLP-1 agonists DPP-IV inhibitors First-Generation GPR119 Agonist (PSN821) Second-Generation GPR119 Agonist (DIVA) 44 + Injectable + Nausea/vomiting + Glucose lowering ++ + Meaningful wei
Slide 45: GPR119 Agonism Translational Research
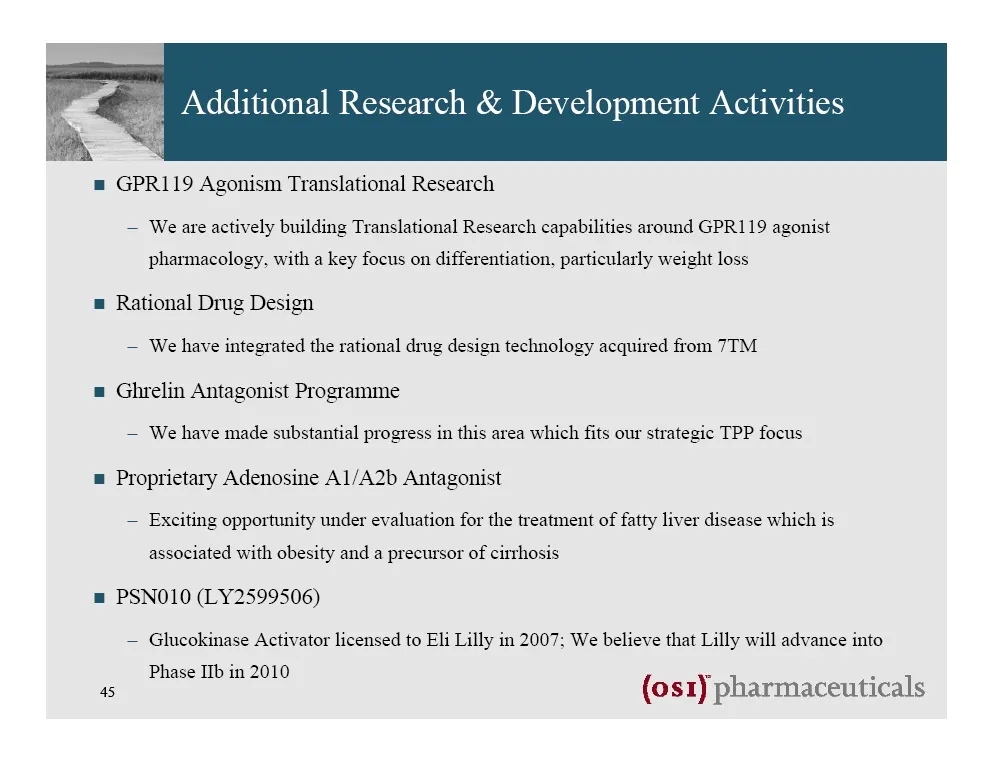
= GPR119 Agonism Translational Research — We are actively building Translational Research capabilities around GPR119 agonist pharmacology, with a key focus on differentiation, particularly weight loss = Rational Drug Design — We have integrated the rational drug design technology acquired from 7TM =
Slide 46: Expansive commitment to a GPR119 agonist franchise
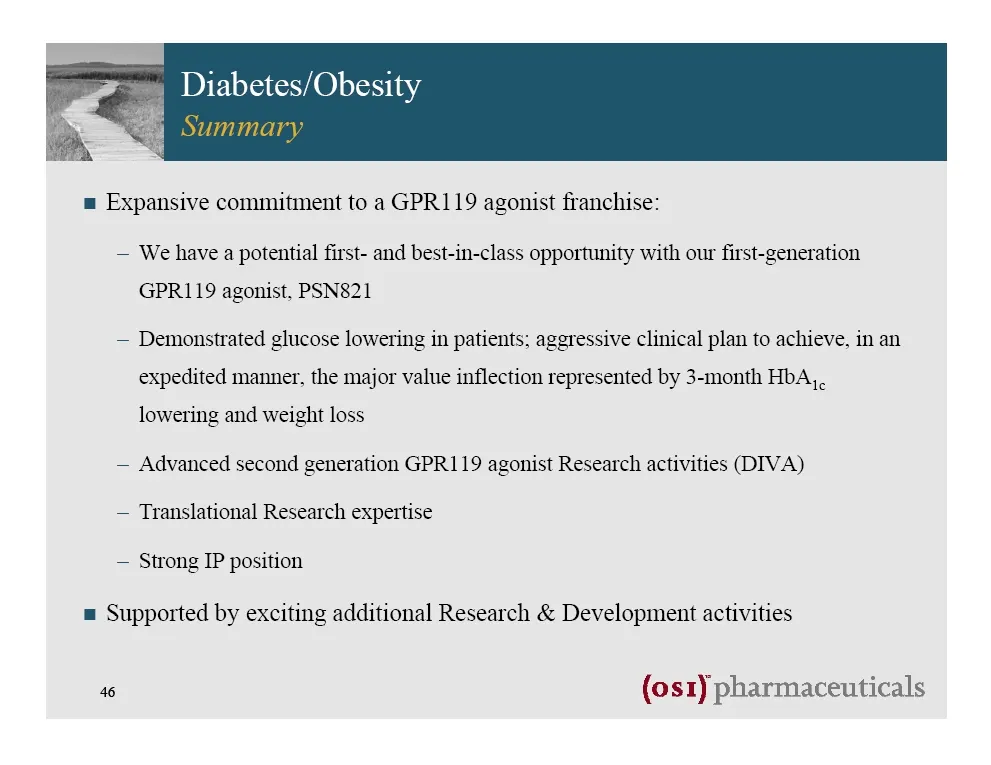
= Expansive commitment to a GPR119 agonist franchise: — We have a potential first- and best-in-class opportunity with our first-generation GPR119 agonist, PSN821 — Demonstrated glucose lowering in patients: aggressive clinical plan to achieve, in an expedited manner, the major value inflection repre

Slide 47: Diabetes & Obesity Q&A
(os1) pharmaceuticals Diabetes & Obesity Q&A
Slide 48: Discovery & Translational Research: Towards Individualized Medicine
(os1) pharmaceuticals Discovery & Translational Research: Towards Individualized Medicine David M. Epstein, Ph.D. Sr. Vice President, Oncology Research
Slide 49: OSI Oncology R&D Entering 2010
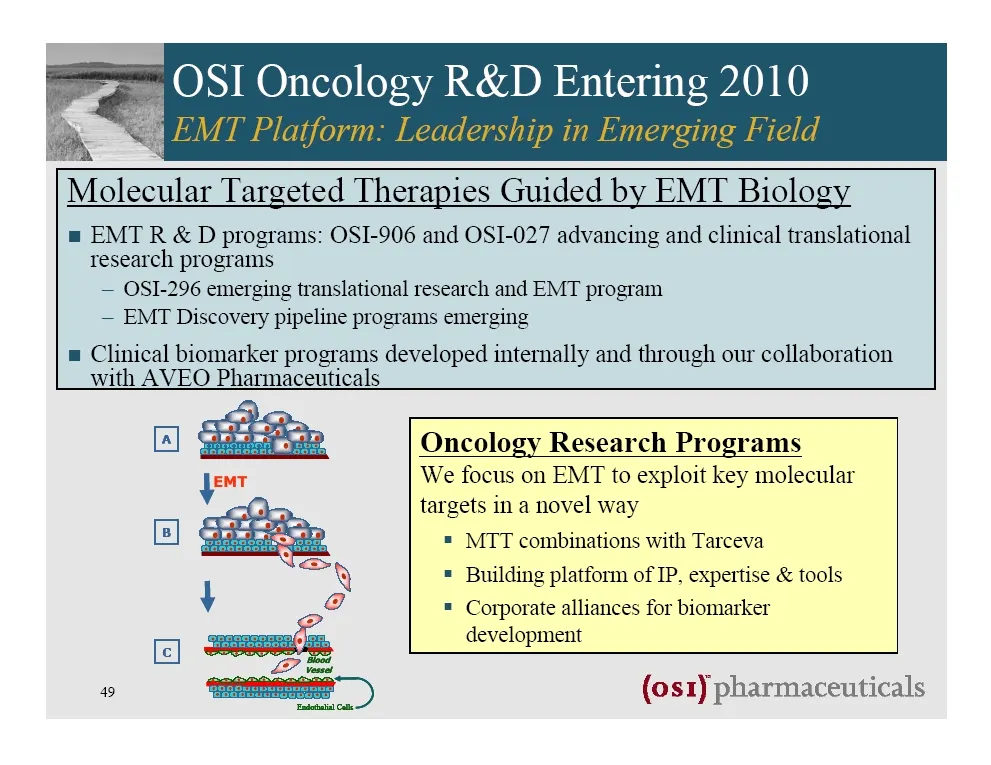
OSI Oncology R&D Entering 2010 Molecular Targeted Therapies Guided by EMT Biology = EMT R&D programs: OSI-906 and OSI-027 advancing and clinical translational research programs — OSI-296 emerging translational research and EMT program — EMT Discovery pipeline programs emerging = Clinical biomarker p
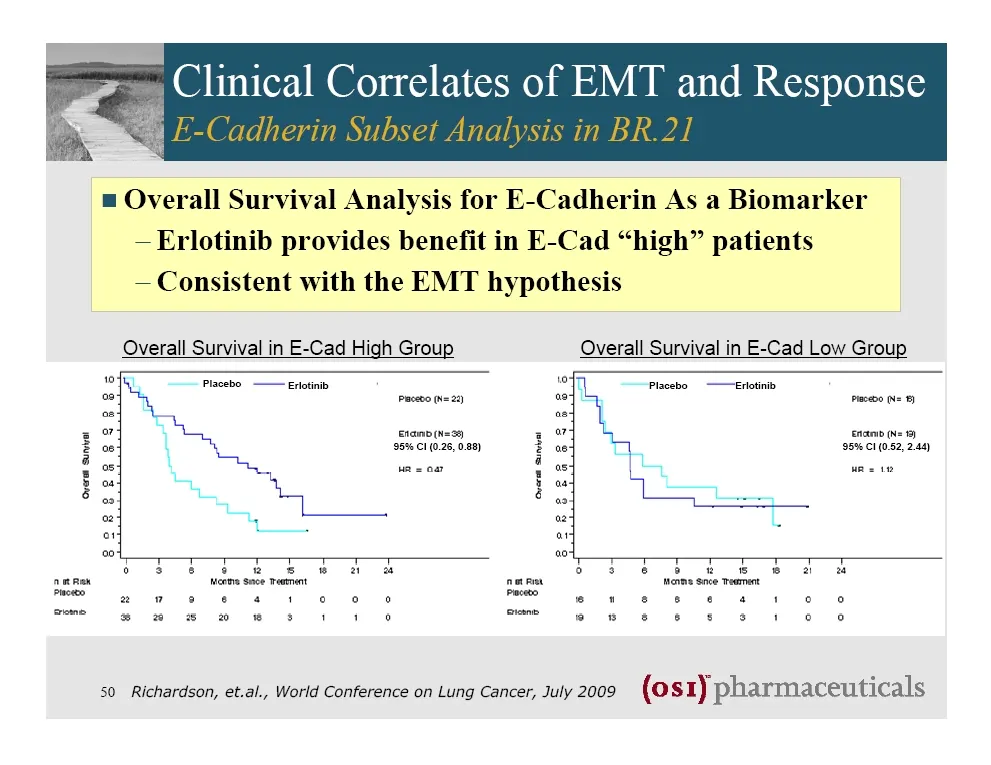
Slide 50: Clinical Correlates of EMT and Response
Clinical Correlates of EMT and Response = Overall Survival Analysis for E-Cadherin As a Biomarker — Erlotinib provides benefit in E-Cad “high” patients — Consistent with the EMT hypothesis Overall Survival in E-Cad High Group Overall Survival in E-Cad Low Group Placebo —— erlotinib Prceto (N22) 1 sr
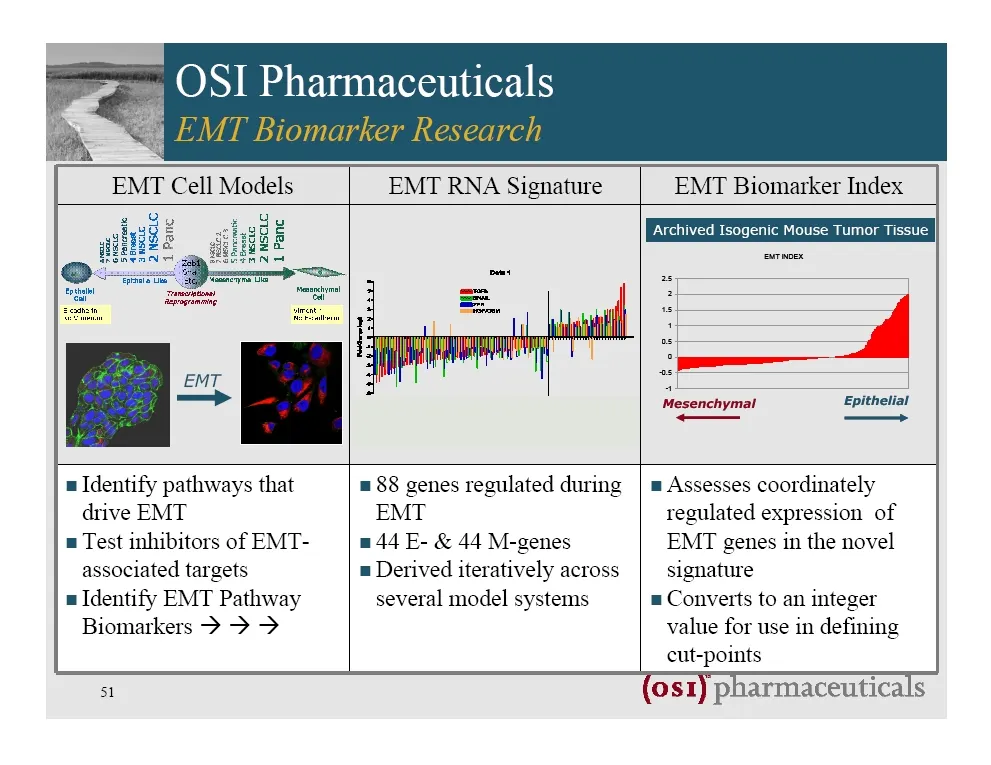
Slide 51: EMT Biomarker Index
EMT Biomarker Index Archived Isogenic Mouse Tumor Tissue Epithelial — u Identify pathways that drive EMT = Test inhibitors of EMT- associated targets u Identify EMT Pathway Biomarkers > > > = 88 genes regulated during EMT 44 E- & 44 M-genes a Derived iteratively across several model systems u Assess
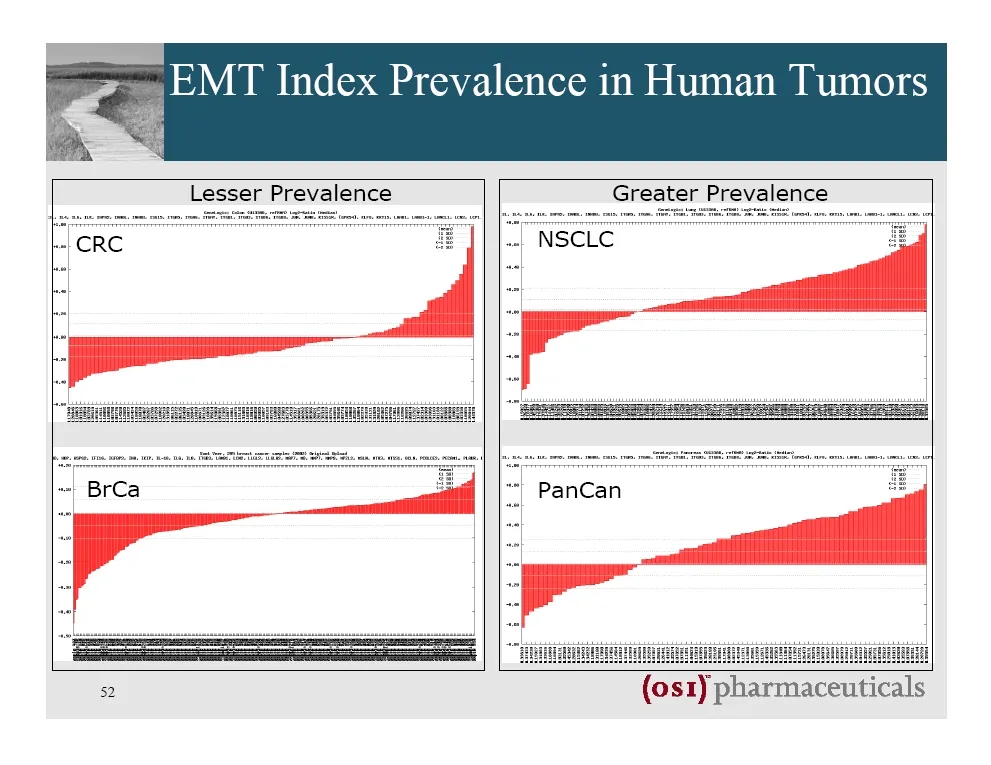
Slide 52: EMT Index Prevalence in Human Tumors
= EMT Index Prevalence in Human Tumors 2 (os1) pharmaceuticals
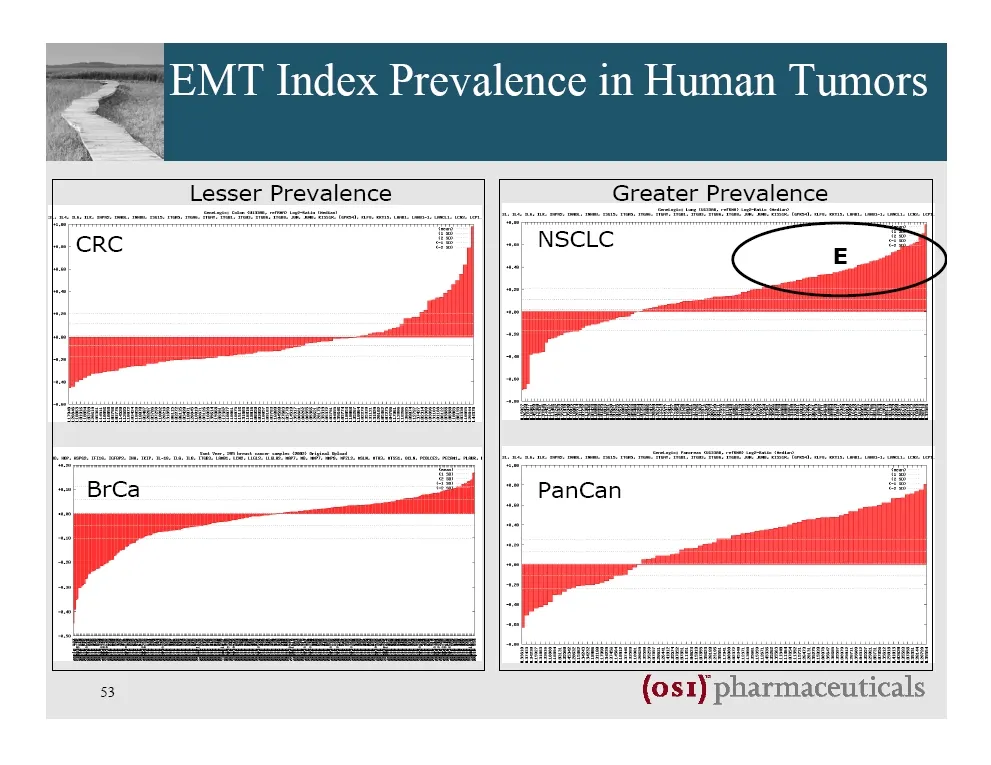
Slide 53: EMT Index Prevalence in Human Tumors
= EMT Index Prevalence in Human Tumors 3 (os1) pharmaceuticals
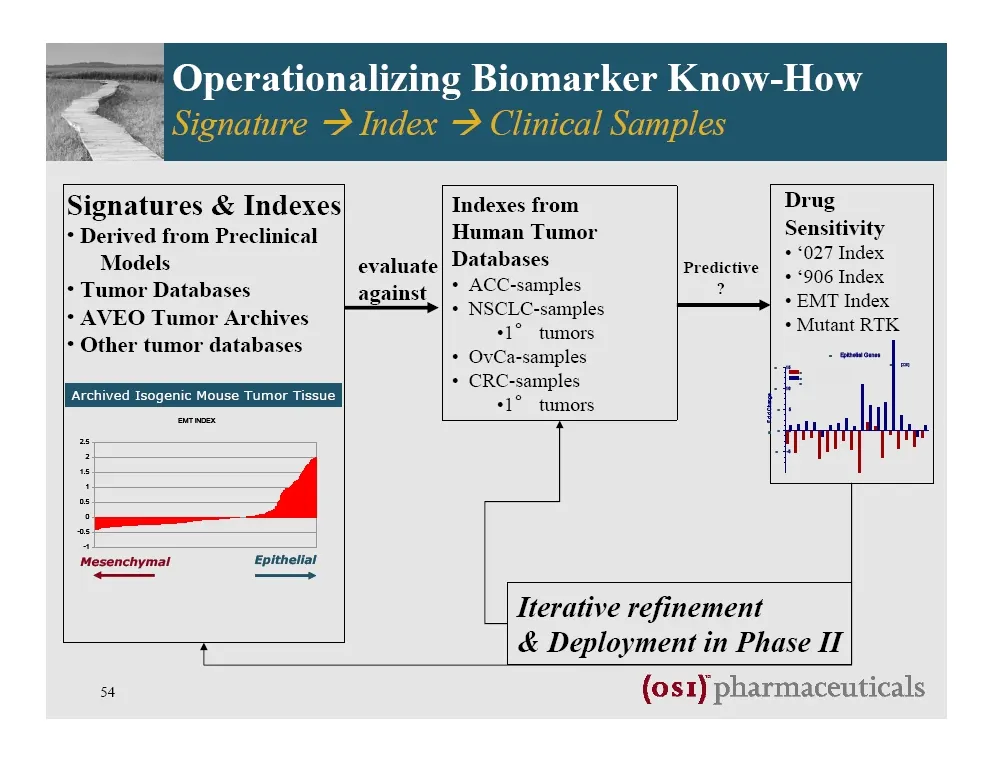
Slide 54: Operationalizing Biomarker Know-How
Operationalizing Biomarker Know-How Signatures & Indexes| Indexes from Drug * Derived from Preclinical Human Tumor Statin Models evaluate] Databases Predictive oe acs * Tumor Databases against | * ACC-samples 2 ° EMT Index + AVEO Tumor Archives © INBICILC armies * Mutant RTK +1° tumors + OvCa-sample
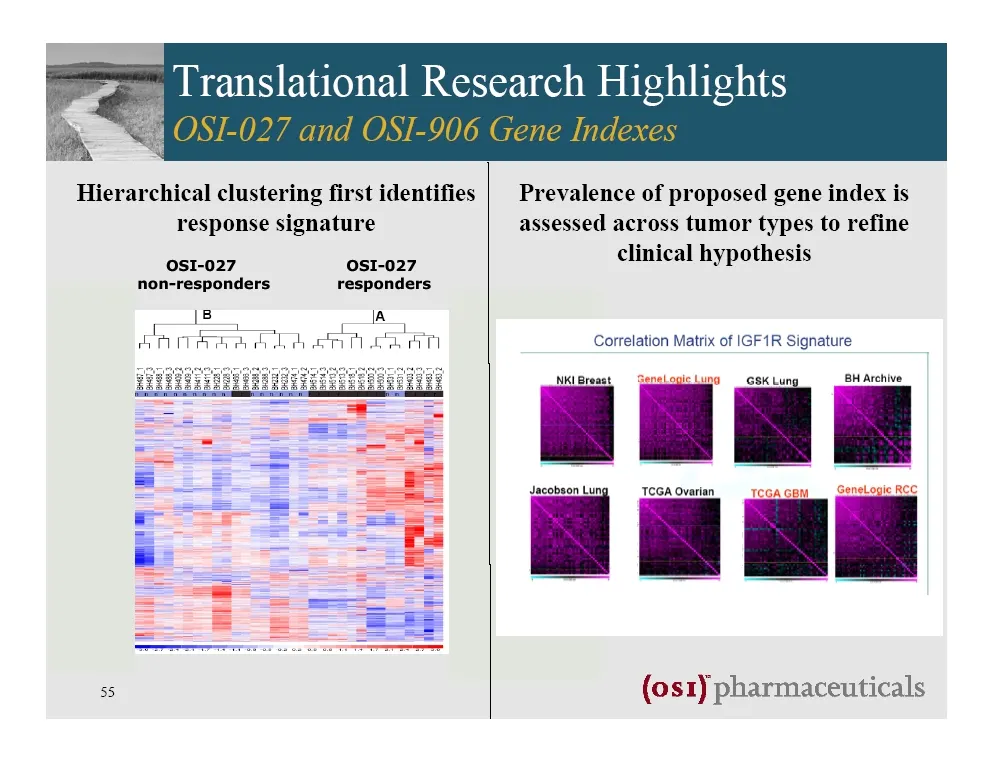
Slide 55: Hierarchical clustering first identifies response signature
Hierarchical clustering first identifies response signature OSI-027 non-responders OSI-027 responders |B Snead 55 Prevalence of proposed gene index is assessed across tumor types to refine clinical hypothesis Correlation Matrix of IGF1R Signature BH Archive NKI Senebogie luna GSK Lunj TCGA Ovarian =
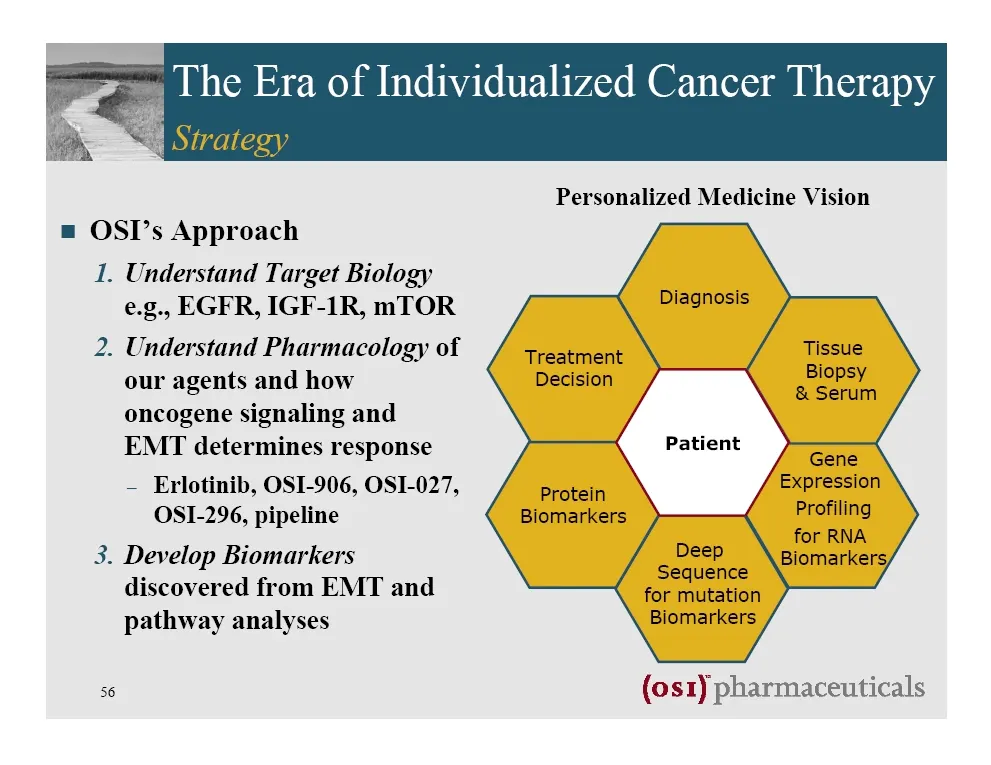
Slide 56: The Era of Individualized Cancer Therapy
. The Era of Individualized Cancer Therapy | Strategy Personalized Medicine Vision = OSI’s Approach 1. Understand Target Biology e.g., EGFR, IGF-1R, mTOR 2. Understand Pharmacology of our agents and how oncogene signaling and EMT determines response ~ Erlotinib, OSI-906, OSI-027, OSI-296, pipeline 3
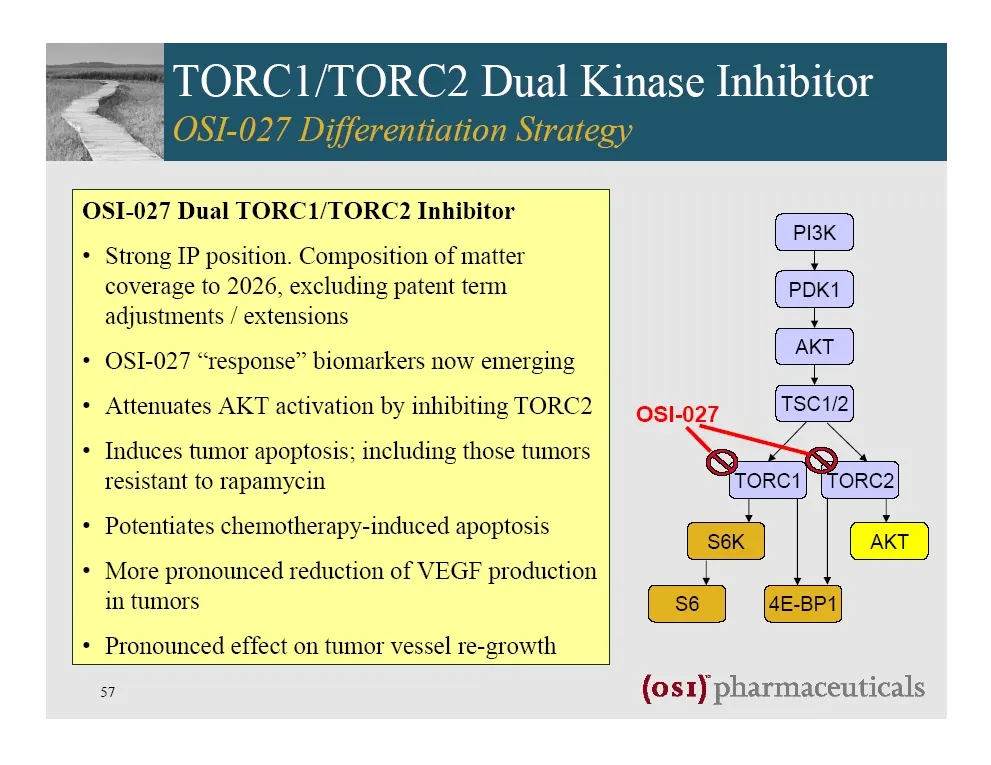
Slide 57: TORC1/TORC2 Dual Kinase Inhibitor
» TORC1/TORC2 Dual Kinase Inhibitor OSI-027 Differentiation Strategy OSI-027 Dual TORC1/TORC2 Inhibitor * Strong IP position. Composition of matter coverage to 2026, excluding patent term adjustments / extensions * OSI-027 “response” biomarkers now emerging + Attenuates AKT activation by inhibiting
Slide 58: TORC1/TORC2 Inhibition Blocks Vessel Re-Growth
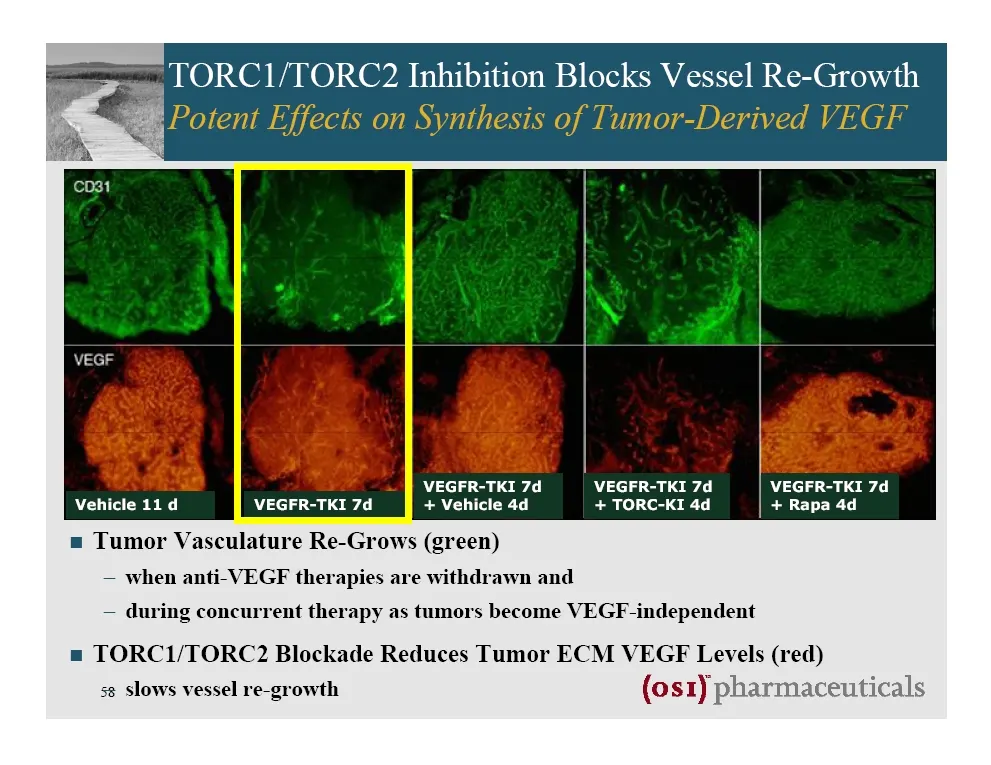
TORC1/TORC2 Inhibition Blocks Vessel Re-Growth Potent Effects on Synthesis of Tumor-Derived VEGF : hee — |] VEGFR-TKI 7d VEGFR-TKI 7d VEGFR-TKI 7d Vehicle 11d VEGFR-TKI 7d + Vehicle 4d + TORC-KI 4d + Rapa 4d = Tumor Vasculature Re-Grows (green) — when anti-VEGF therapies are withdrawn and — during c
Slide 59: TORC1/TORC2 Inhibition Blocks Vessel Re-Growth
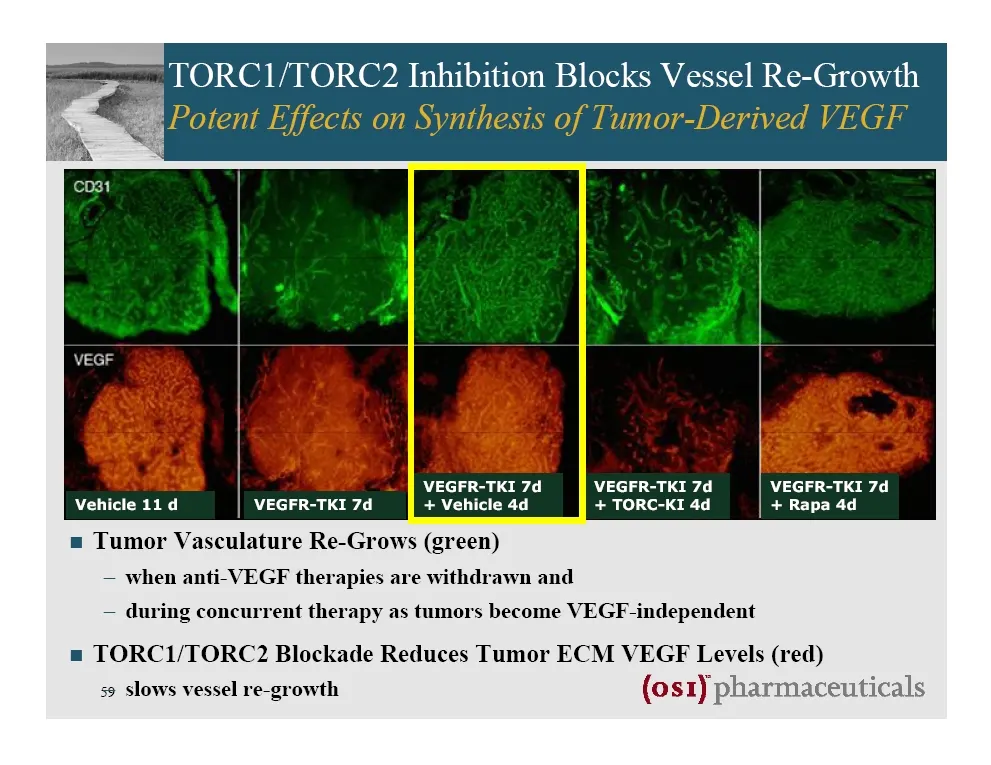
TORC1/TORC2 Inhibition Blocks Vessel Re-Growth Potent Effects on Synthesis of Tumor-Derived VEGF 2 VEGFR-TKI 7d VEGFR-TKI 7d VEGFR-TKI 7d Vehicle 11d VEGFR-TKI 7d + Vehicle 4d + TORC-KI 4d + Rapa 4d = Tumor Vasculature Re-Grows (green) — when anti-VEGF therapies are withdrawn and — during concurrent
Slide 60: TORC1/TORC2 Inhibition Blocks Vessel Re-Growth
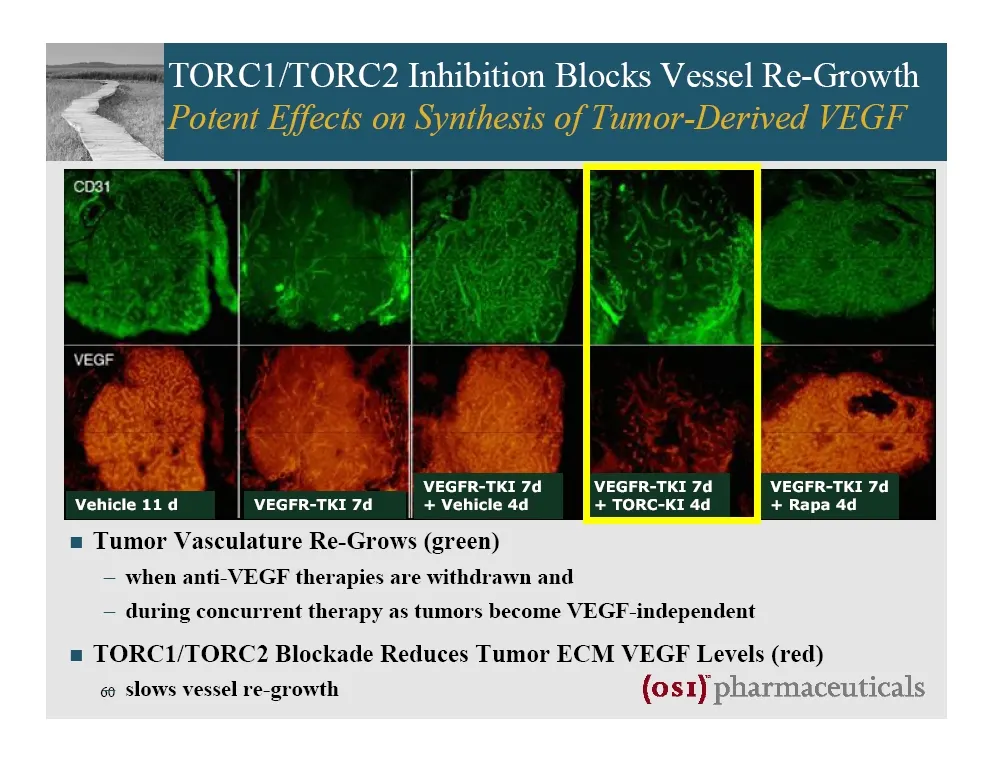
TORC1/TORC2 Inhibition Blocks Vessel Re-Growth Potent Effects on Synthesis of Tumor-Derived VEGF 5 way ” — | VEGFR-TKI 7d VEGFR-TKI 7d VEGFR-TKI 7d Vehicle 11d VEGFR-TKI 7d + Vehicle 4d + TORC-KI 4d + Rapa 4d = Tumor Vasculature Re-Grows (green) — when anti-VEGF therapies are withdrawn and — during
Slide 61: TORC1/TORC2 Inhibition Blocks Vessel Re-Growth
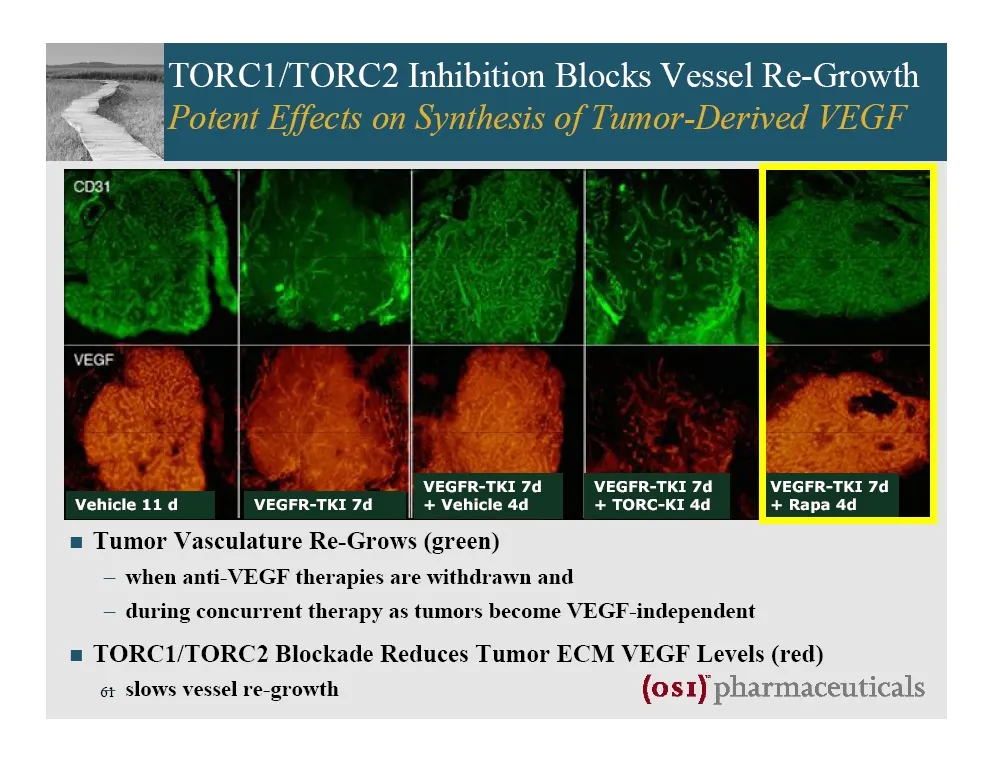
TORC1/TORC2 Inhibition Blocks Vessel Re-Growth Potent Effects on Synthesis of Tumor-Derived VEGF 5 way ” — | VEGFR-TKI 7d VEGFR-TKI 7d VEGFR-TKI 7d Vehicle 11d VEGFR-TKI 7d + Vehicle 4d + TORC-KI 4d + Rapa 4d = Tumor Vasculature Re-Grows (green) — when anti-VEGF therapies are withdrawn and — during
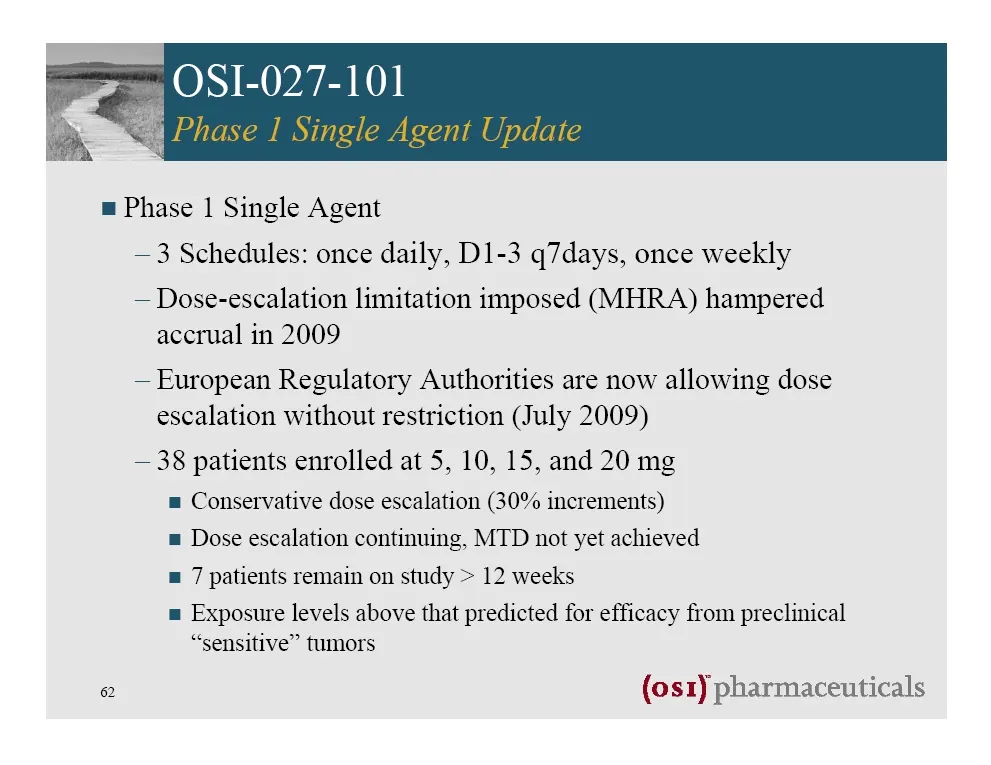
Slide 62: OSI-027-101
OSI-027-101 = Phase | Single Agent —3 Schedules: once daily, D1-3 q7days, once weekly —Dose-escalation limitation imposed (MHRA) hampered accrual in 2009 — European Regulatory Authorities are now allowing dose escalation without restriction (July 2009) — 38 patients enrolled at 5, 10, 15, and 20 mg
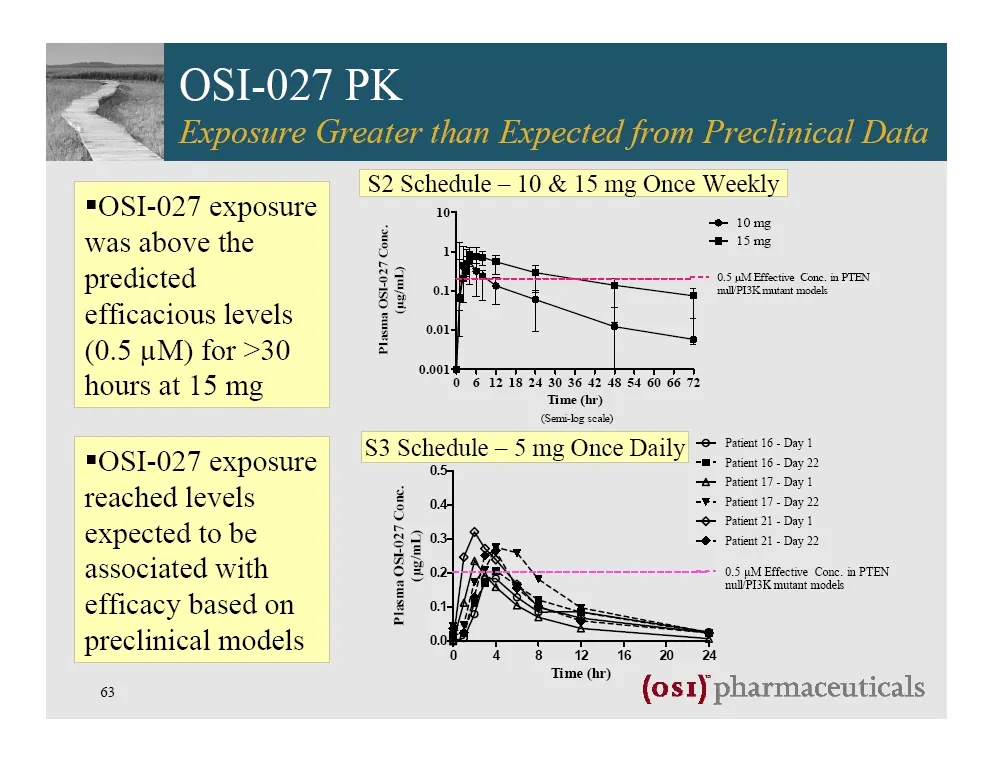
Slide 63: OSI-027 PK
= OSI-027 PK =OSI-027 exposure was above the predicted efficacious levels (0.5 uM) for >30 hours at 15 mg =OSI-027 exposure reached levels expected to be associated with efficacy based on preclinical models 63 S2 Schedule — 10 & 15 mg Once Weekly > 10mg img wna na nn => 0.5 pM EBective Cone. ia PTE
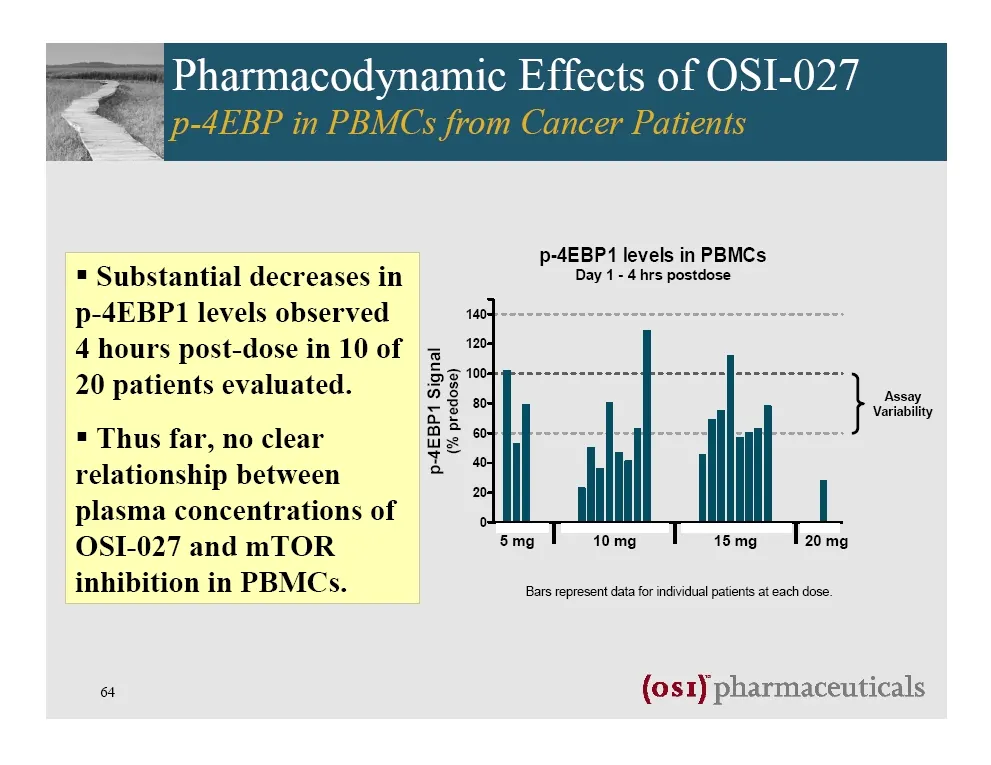
Slide 64: Pharmacodynamic Effects of OSI-027
= Substantial decreases in p-4EBP1 levels observed 4 hours post-dose in 10 of 20 patients evaluated. = Thus far, no clear relationship between plasma concentrations of OSL-027 and mTOR inhibition in PBMCs. 4 .. Pharmacodynamic Effects of OSI-027 p-4EBP1 levels in PBMCs Day 1-4 hrs postdose Assay Var
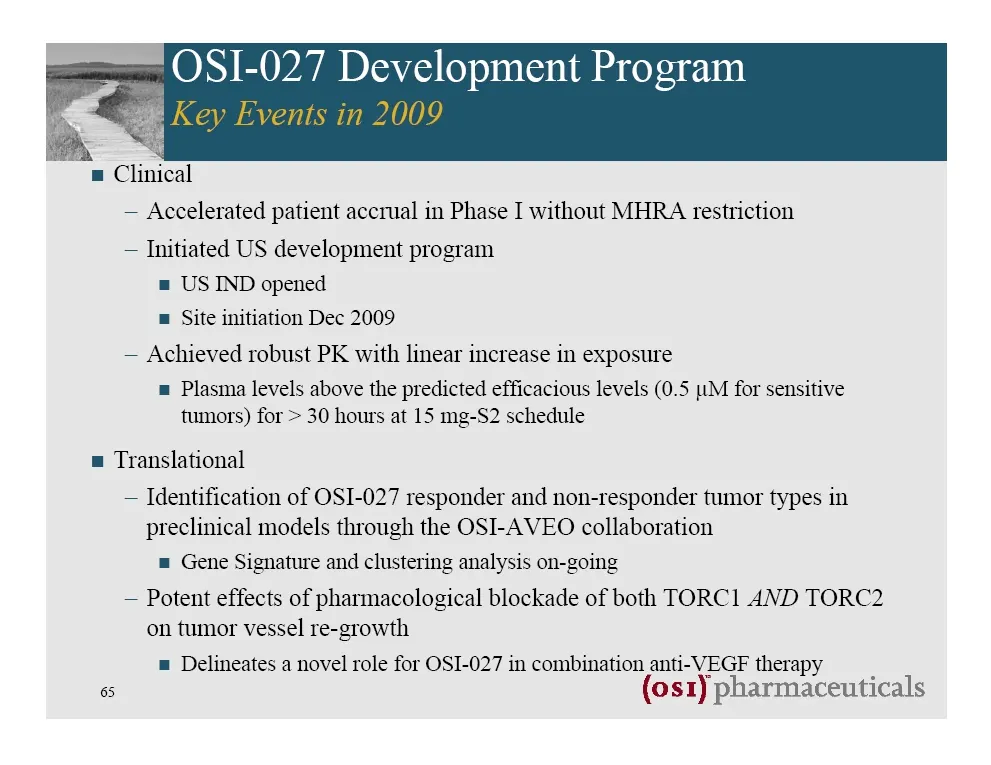
Slide 65: OSI-027 Development Program
OSI-027 Development Program | = Clinical — Accelerated patient accrual in Phase I without MHRA restriction — Initiated US development program = US IND opened @ Site initiation Dec 2009 — Achieved robust PK with linear increase in exposure = Plasma levels above the predicted efficacious levels (0.5 t
Slide 66: Clinical Development Update: OSI-906
(os1) pharmaceuticals Clinical Development Update: OSI-906 Angela M. Davies, MD, FRCPC Vice President, Oncology Clinical Research
Slide 67: OSI-906
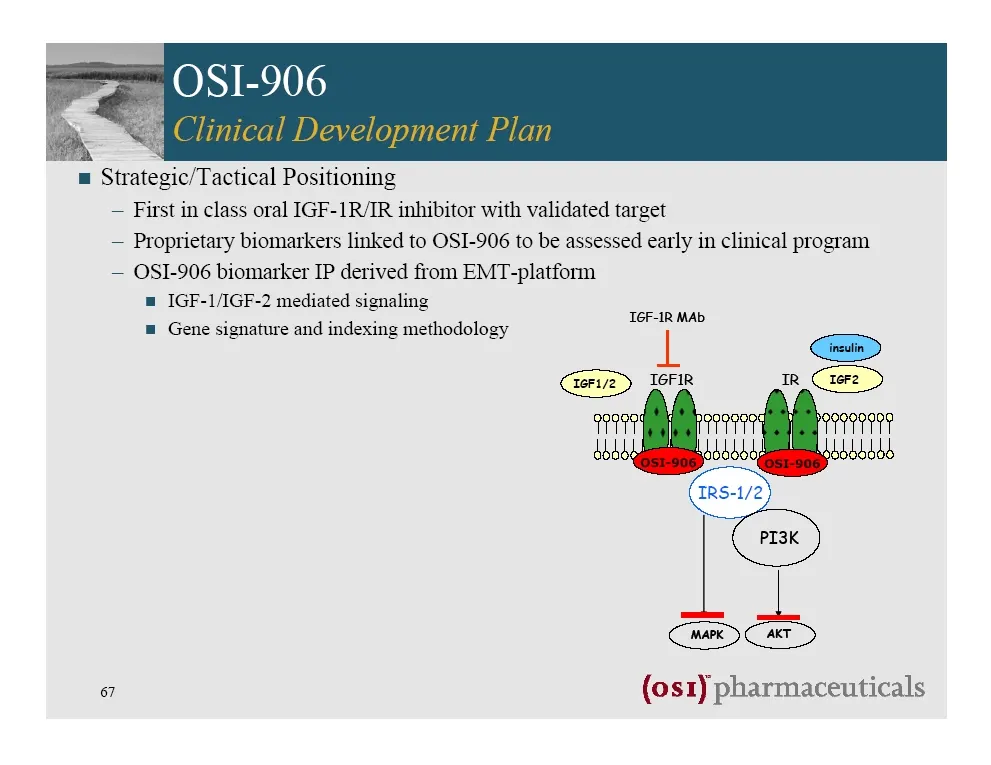
OSI-906 = Strategic/Tactical Positioning — First in class oral IGF-1R/IR inhibitor with validated target — Proprietary biomarkers linked to OSI-906 to be assessed early in clinical program. — OSI-906 biomarker IP derived from EMT-platform = IGE-1/IGE-2 mediated signaling = Gene signature and indexin
Slide 68: OSI-906
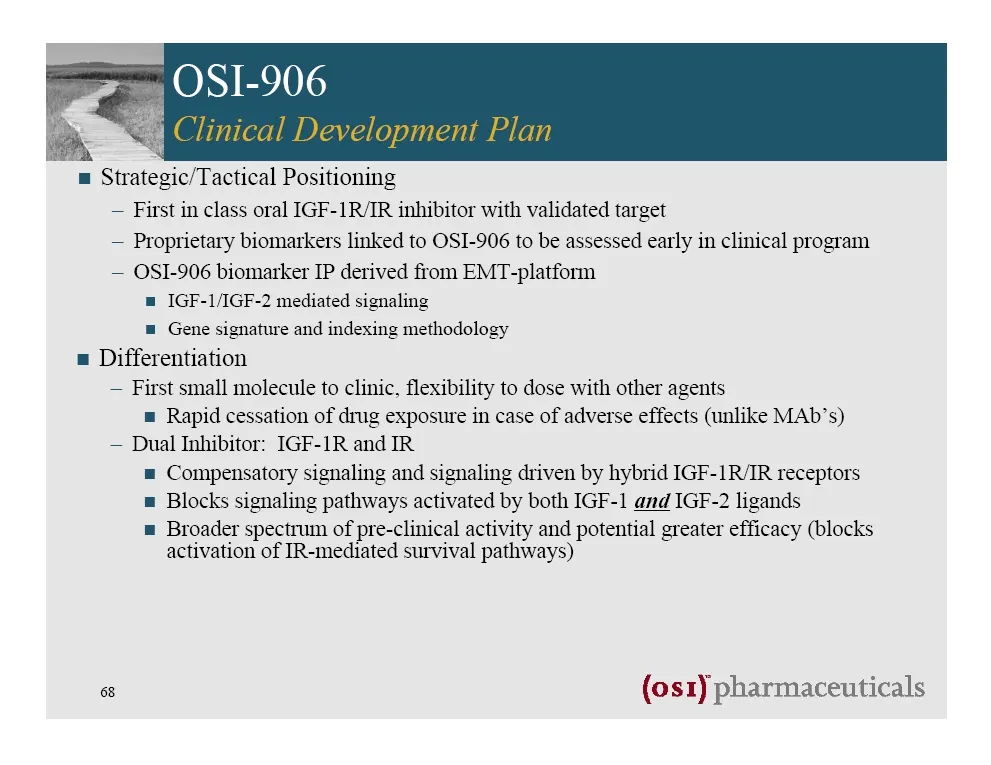
OSI-906 = Strategic/Tactical Positioning — First in class oral IGF-1R/IR inhibitor with validated target — Proprietary biomarkers linked to OSI-906 to be assessed early in clinical program. — OSI-906 biomarker IP derived from EMT-platform = IGE-1/IGE-2 mediated signaling = Gene signature and indexin
Slide 69: OSI-906
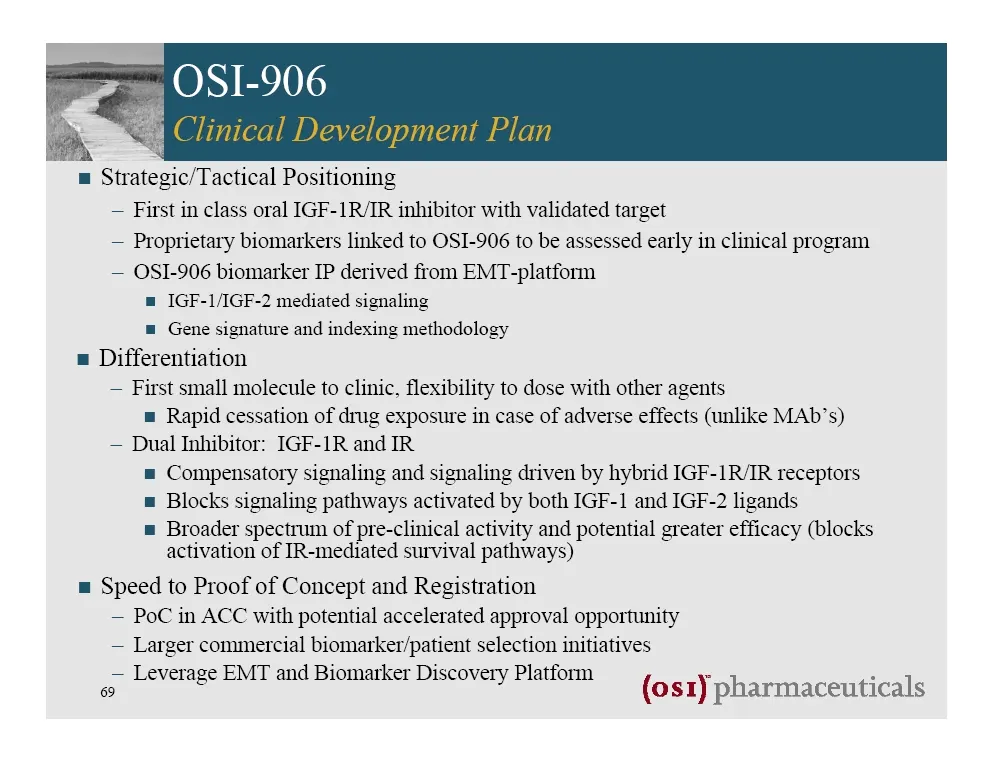
OSI-906 = Strategic/Tactical Positioning — First in class oral IGF-1R/IR inhibitor with validated target — Proprietary biomarkers linked to OSI-906 to be assessed early in clinical program. — OSI-906 biomarker IP derived from EMT-platform = IGE-1/IGE-2 mediated signaling = Gene signature and indexin
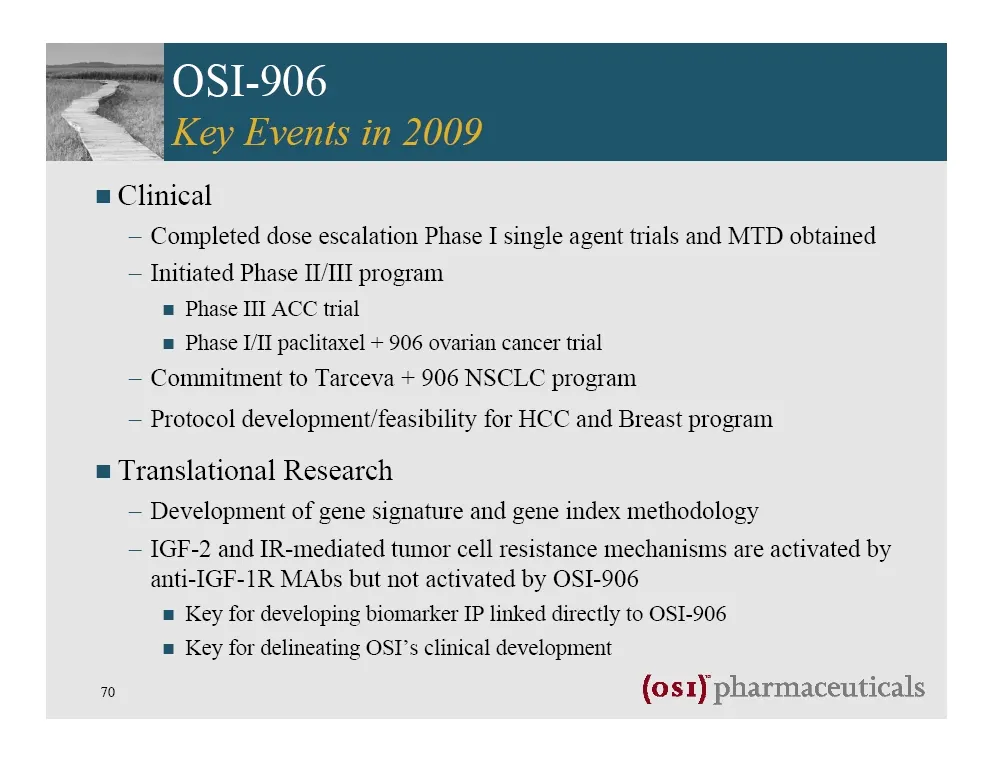
Slide 70: OSI-906
OSI-906 = Clinical — Completed dose escalation Phase I single agent trials and MTD obtained — Initiated Phase II/III program = Phase III ACC trial @ Phase I/II paclitaxel + 906 ovarian cancer trial — Conunitinent to Tarceva + 906 NSCLC program — Protocol development/feasibility for HCC and Breast pr
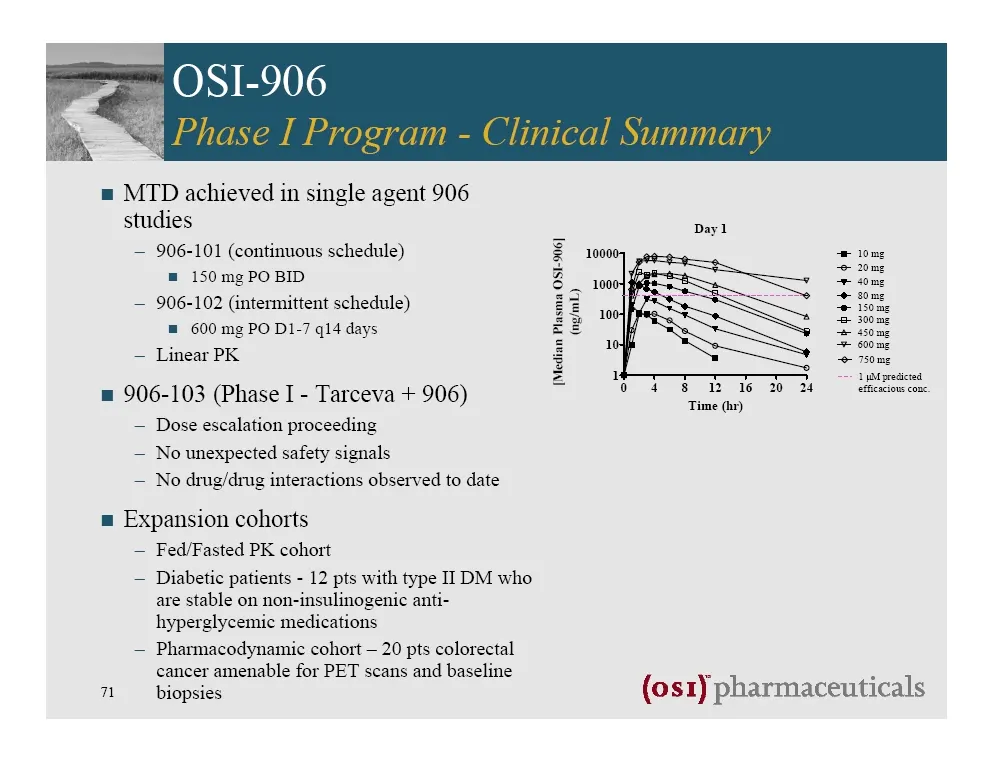
Slide 71: OSI-906
OSI-906 = MTD achieved in single agent 906 studies Dayl — 906-101 (continuous schedule) Z 000 a = 150mg PO BID Z 100 Sas — 906-102 (intermittent schedule) Ae 7 See = 600 mg PO D1-7 q14 days ze Soe — Linear PK 2° Sister 2 —— a yotyreaces = 906-103 (Phase I - Tarceva + 906) Ome Sassen — Dose escalatio
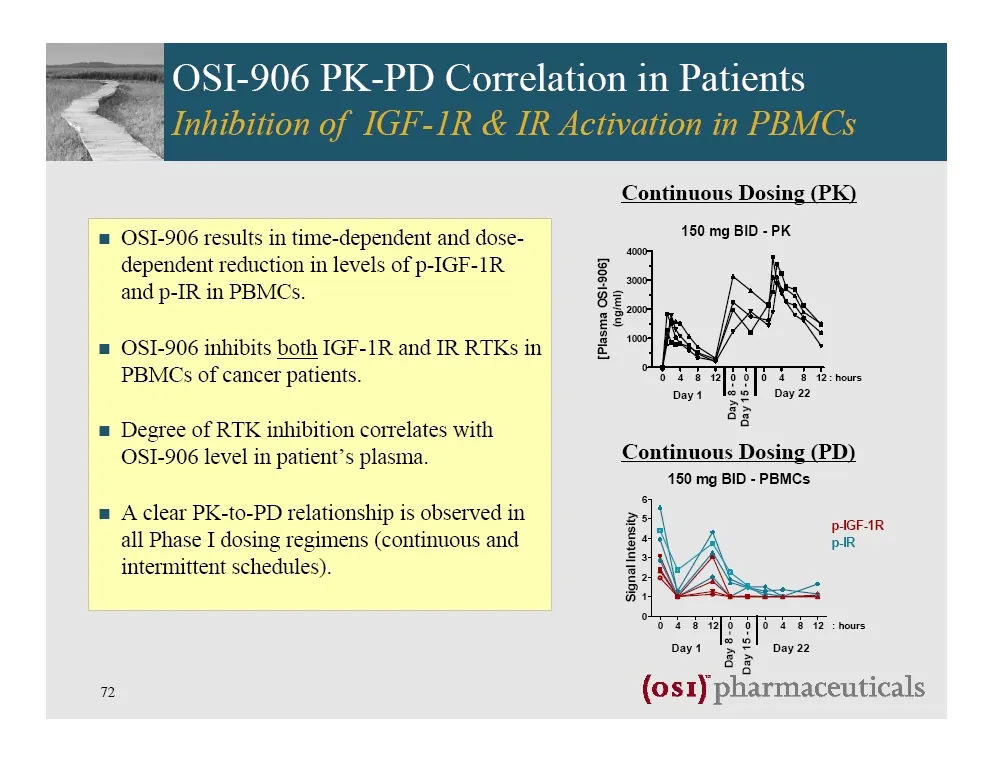
Slide 72: OSI-906 PK-PD Correlation in Patients
4 OSI-906 PK-PD Correlation in Patients = OSI-906 results in time-dependent and dose- dependent reduction in levels of p-IGF-1R and p-IR in PBMCs. = OSI-906 inhibits both IGF-1R and IR RTKs in PBMCs of cancer patients. = Degree of RTK inhibition correlates with OSI-906 level in patient’s plasma. = A
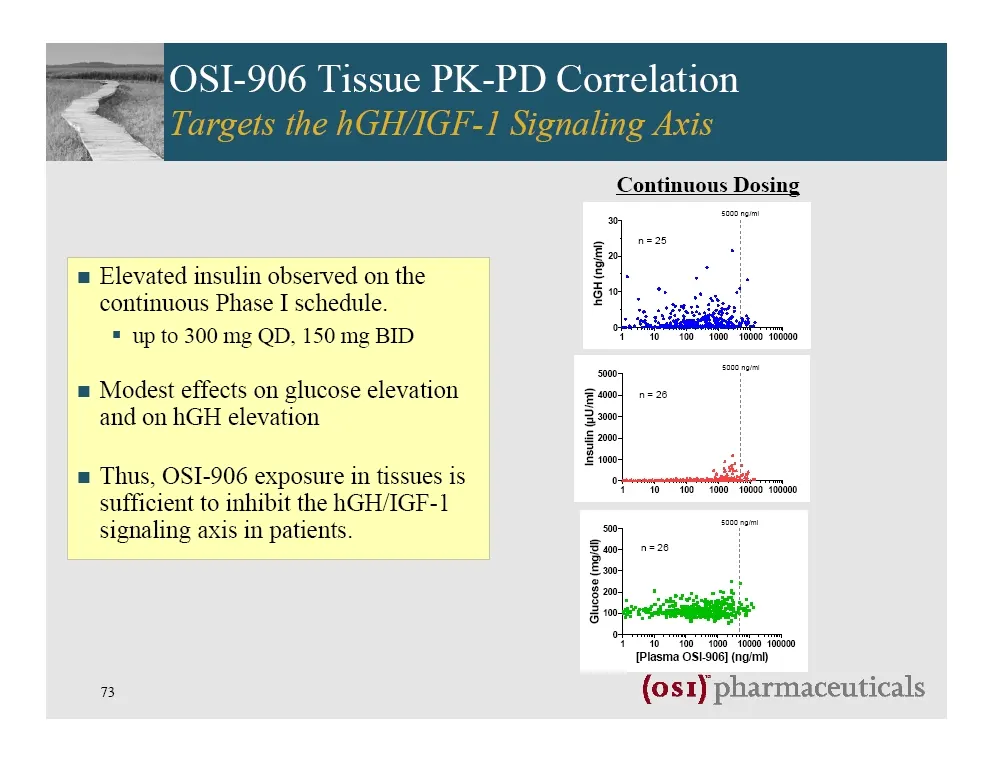
Slide 73: Elevated insulin observed on continuous Phase I schedule
= Elevated insulin observed on the continuous Phase I schedule. = up to 300 mg QD. 150 mg BID = Modest effects on glucose elevation and on hGH elevation = Thus, OSI-906 exposure in tissues is sufficient to inhibit the hGH/IGF-1 signaling axis in patients. B Continuous Dosing AGH (ngim)) “o100 1000 1
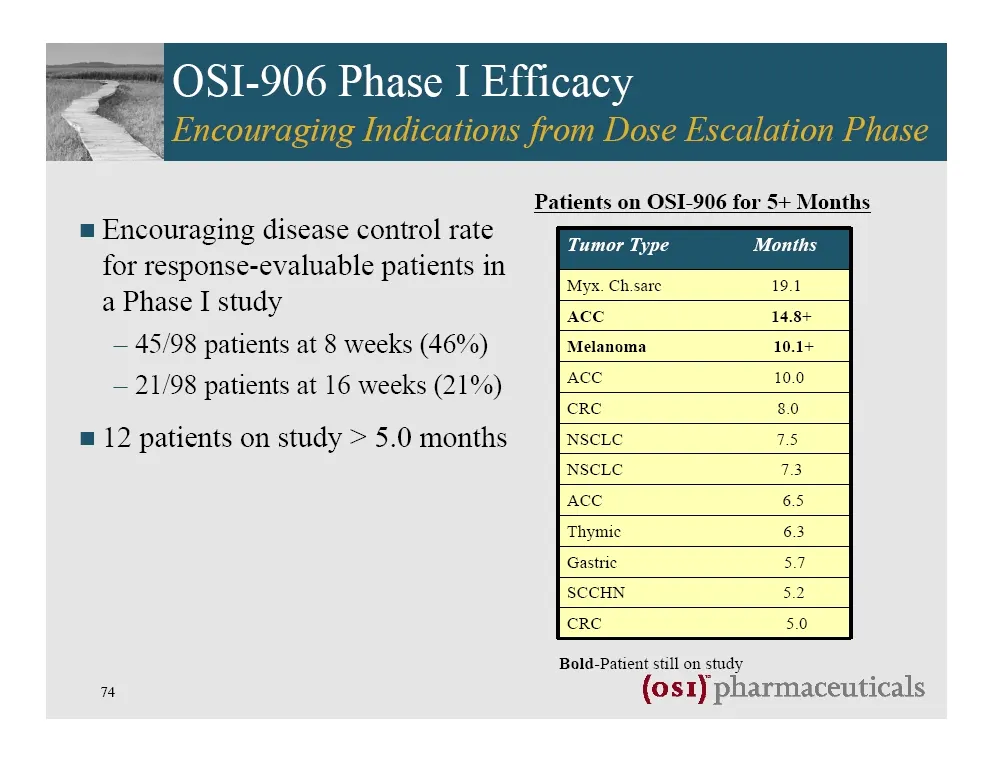
Slide 74: OSI-906 Phase I Efficacy
= OSI-906 Phase I Efficacy Patients on OSI-906 for 5+ Months = Encouraging disease control rate for response-evaluable patients in Ch: Tstud Myx. Ch.sare a Phase I study Ace — 45/98 patients at 8 weeks (46%) Melanoma — 21/98 patients at 16 weeks (21%) Ace Tumor Type = 12 patients on study > 5.0 mont
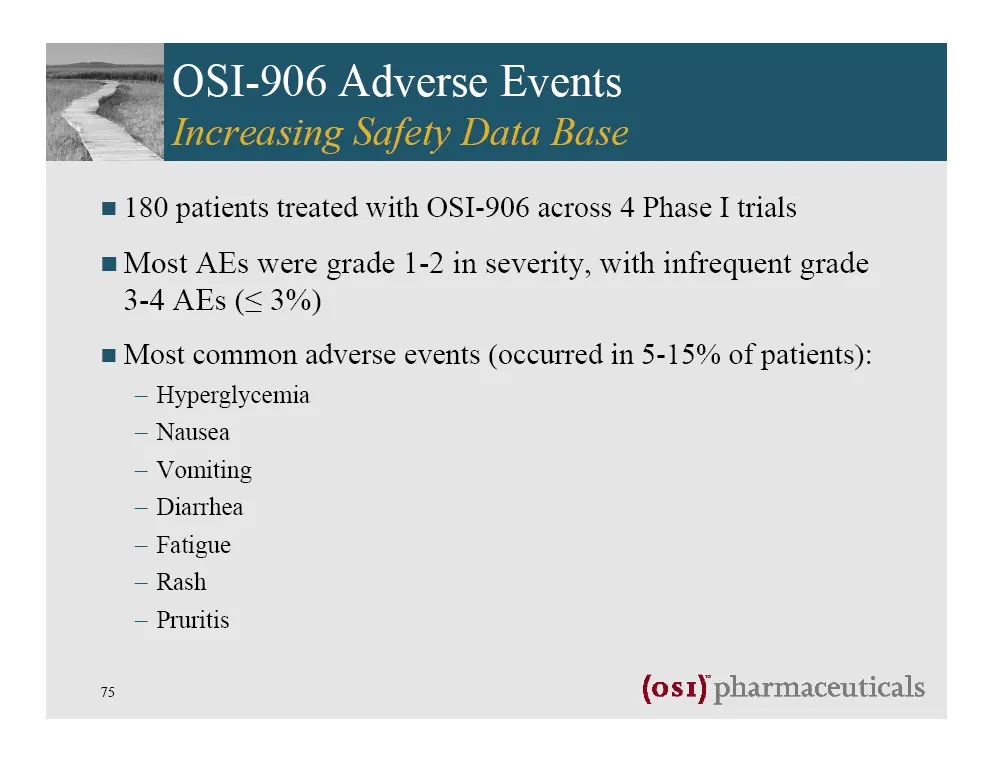
Slide 75: OSI-906 Adverse Events
OSI-906 Adverse Events = 180 patients treated with OSI-906 across 4 Phase I trials = Most AEs were grade 1-2 in severity, with infrequent grade 3-4 AEs (< 3%) = Most common adverse events (occurred in 5-15% of patients): — Hyperglycemia — Nausea — Vomiting — Diarrhea — Fatigue — Rash — Pruritis 15 (
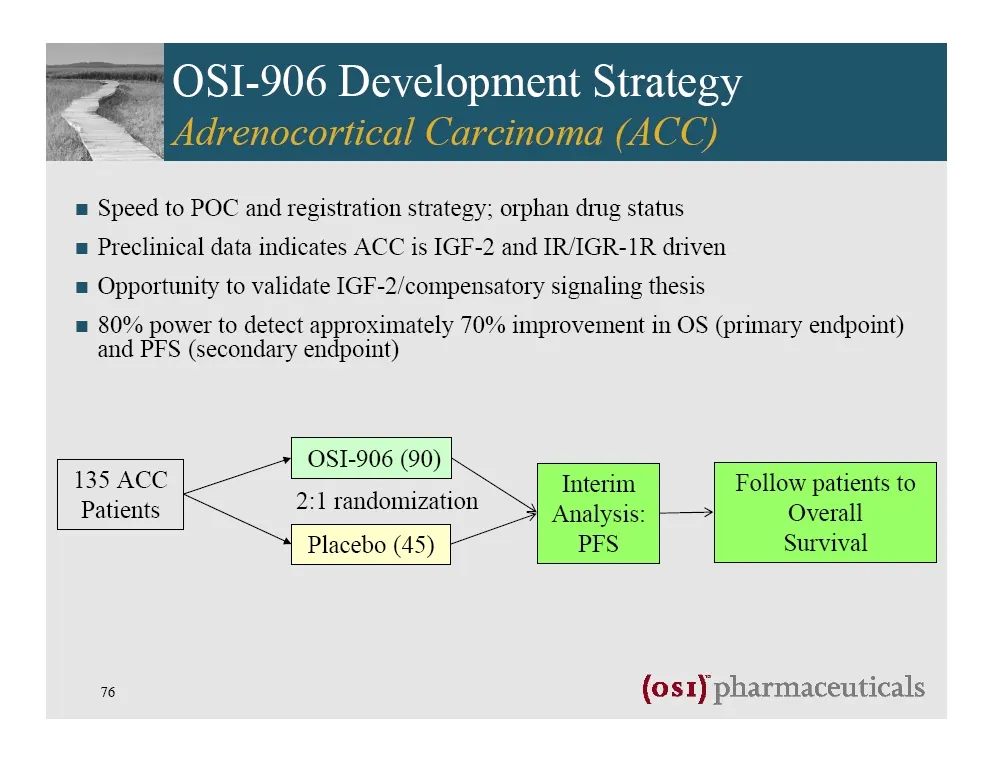
Slide 76: OSI-906 Development Strategy
OSI-906 Development Strategy = Speed to POC and registration strategy; orphan drug status = Preclinical data indicates ACC is IGF-2 and IR/IGR-1R driven = Opportunity to validate IGF-2/compensatory signaling thesis = 80% power to detect approximately 70% improvement in OS (primary endpoint) and PFS
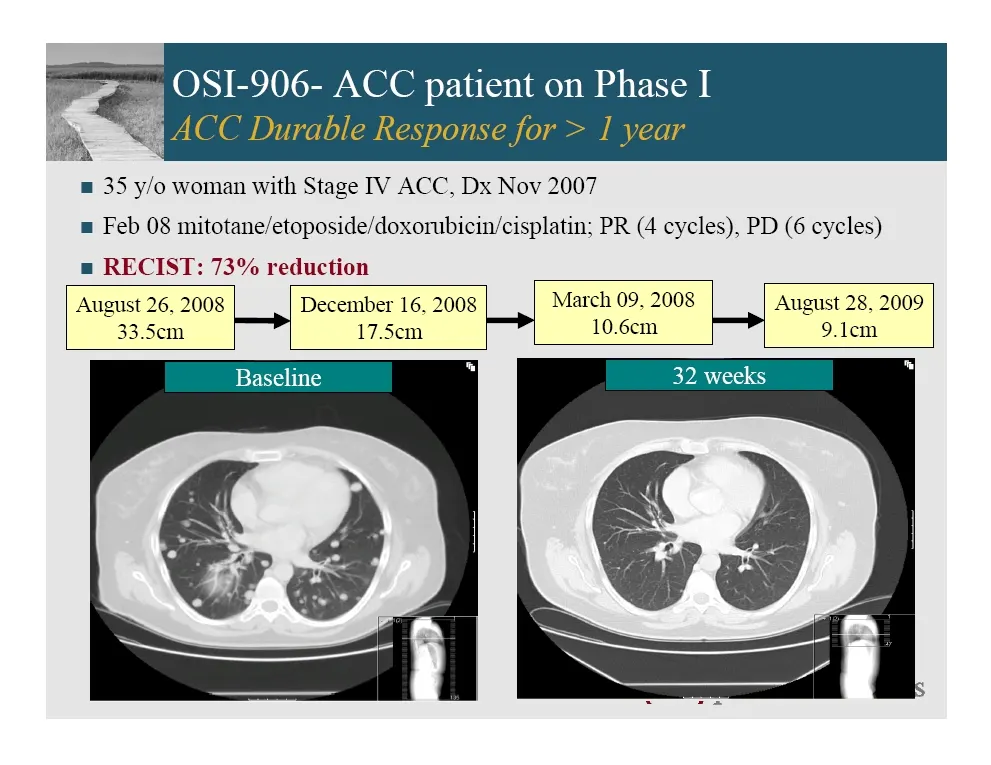
Slide 77: OSI-906 ACC patient on Phase I
OSI-906- ACC patient on Phase I faa ACC Durable Response for > I year = 35 y/o woman with Stage IV ACC, Dx Nov 2007 = Feb 08 mitotane/etoposide/doxorubicin/cisplatin; PR (4 cycles), PD (6 cycles) = REC August 26, 2008 December 16, 2008 March 09, 2008 August 28, 2009 33.5cm , 17.5cm 10.6cm > 9.1cem :
Slide 78: OSI-906 — ACC patients on Phase I studies
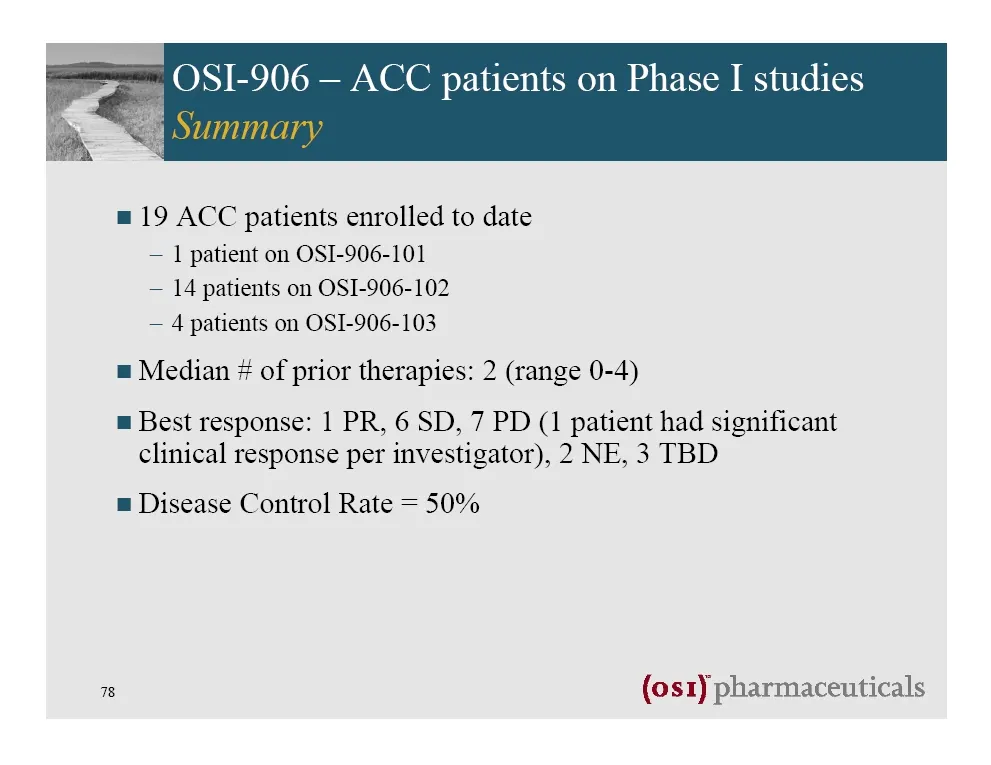
OSI-906 — ACC patients on Phase I studies = 19 ACC patients enrolled to date — | patient on OSI-906-101 — 14 patients on OSI-906-102 — 4 patients on OSI-906-103 = Median # of prior therapies: 2 (range 0-4) = Best response: 1 PR, 6 SD, 7 PD (1 patient had significant clinical response per investigato
Slide 79: OSI-906 Development Strategy
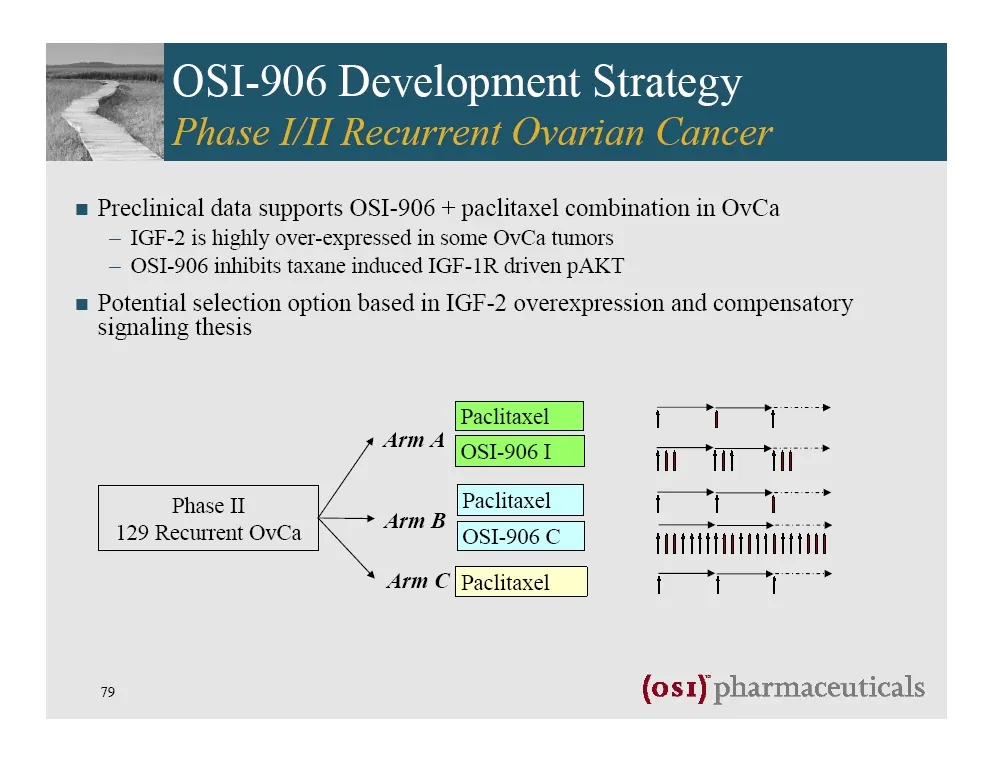
. OSI-906 Development Strategy = Preclinical data supports OSI-906 + paclitaxel combination in OvCa — IGF-2 is highly over-expressed in some OvCa tumors — OSI-906 inhibits taxane induced IGF-1R driven pAKT = Potential selection option based in IGF-2 overexpression and compensatory signaling thesis u
Slide 80: OSI-906 Development Strategy
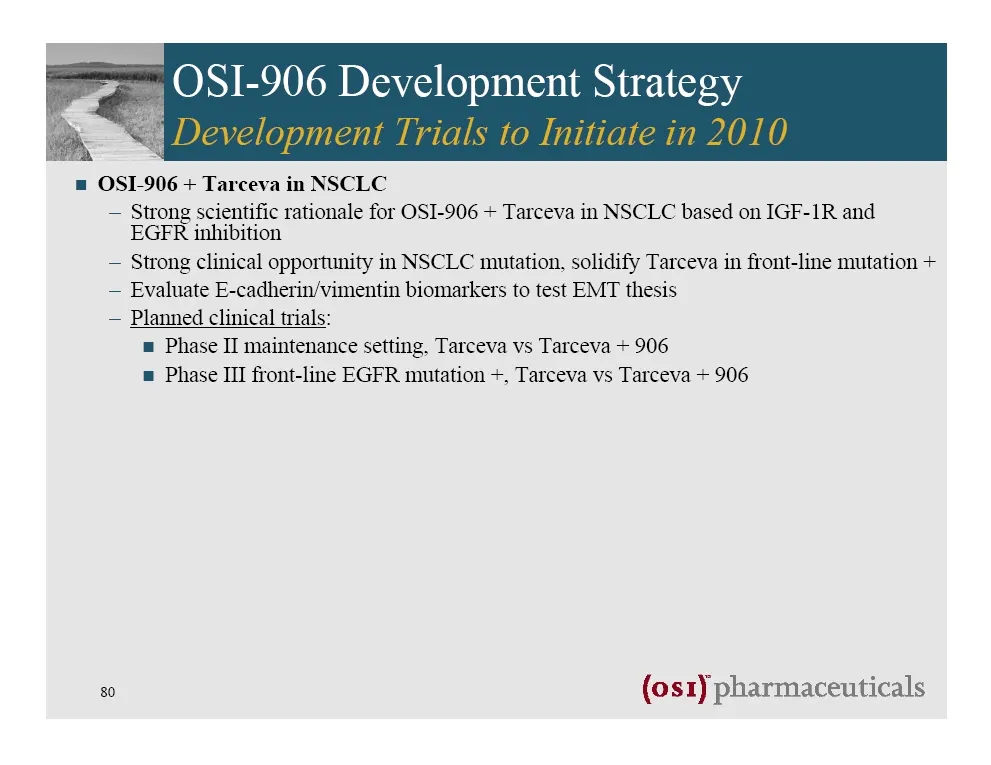
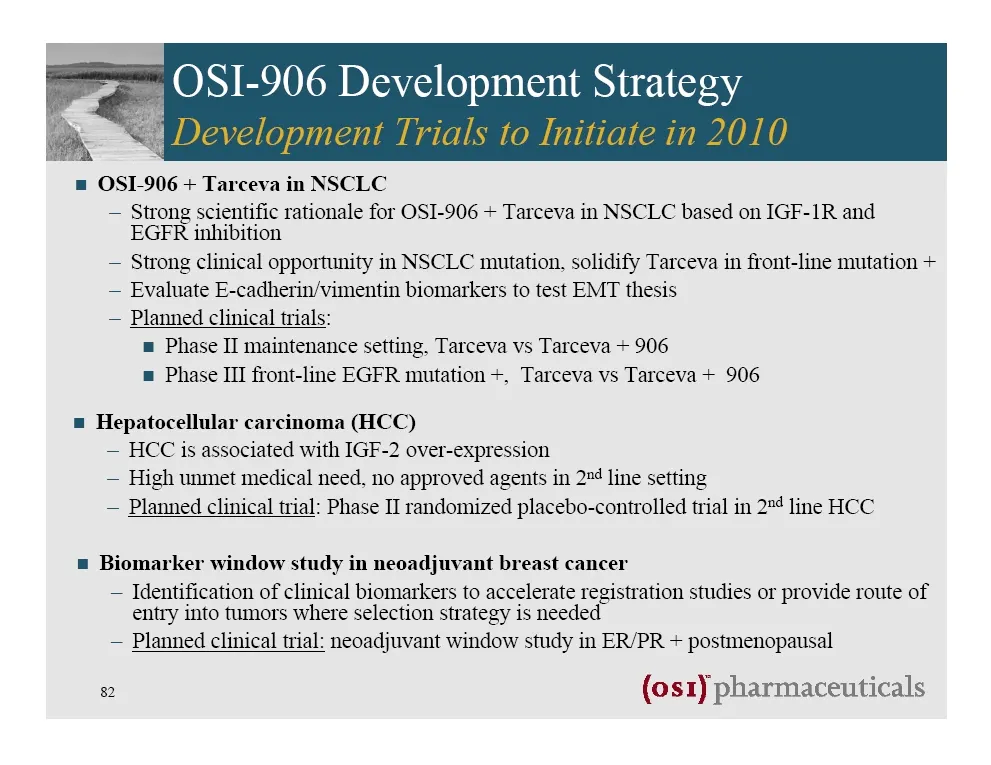
OSI-906 Development Strategy = OSI-906 + Tarceva in NSCLC — Strong scientific rationale for OSI-906 + Tarceva in NSCLC based on IGF-1R and EGER inhibition — Strong clinical opportunity in NSCLC mutation, solidify Tarceva in front-line mutation + — Evaluate E-cadherin/vimentin biomarkers to test EMT
Slide 81
Slide 82

Slide 83
Slide 84
Slide 85
Slide 86
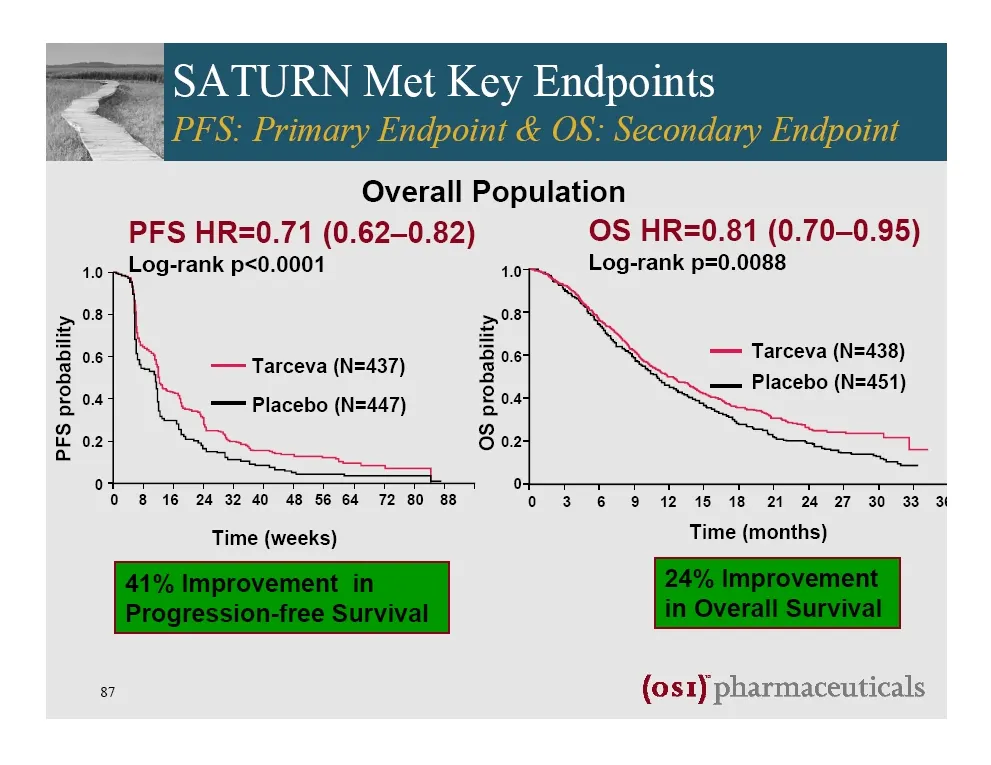
Slide 87
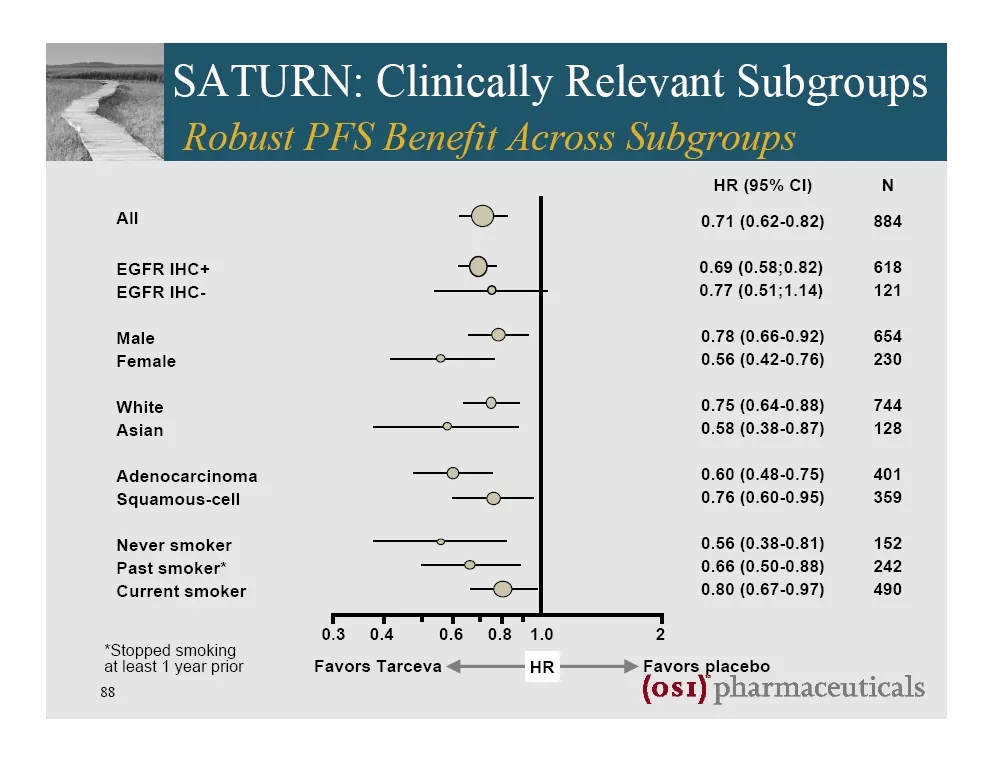
Slide 88
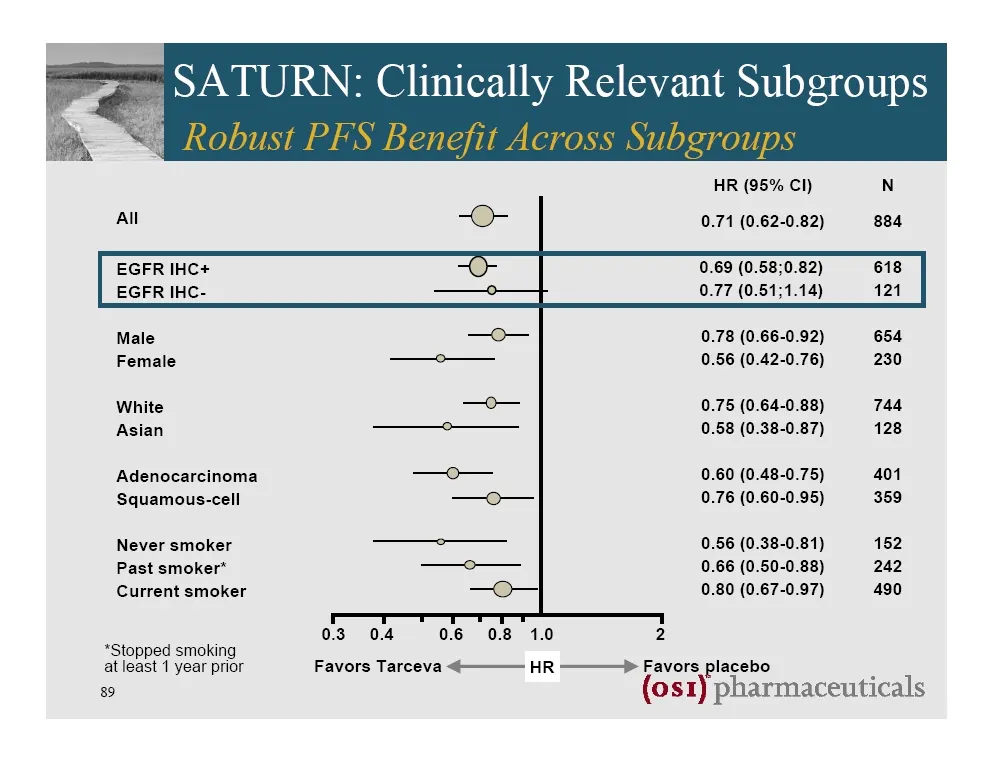
Slide 89
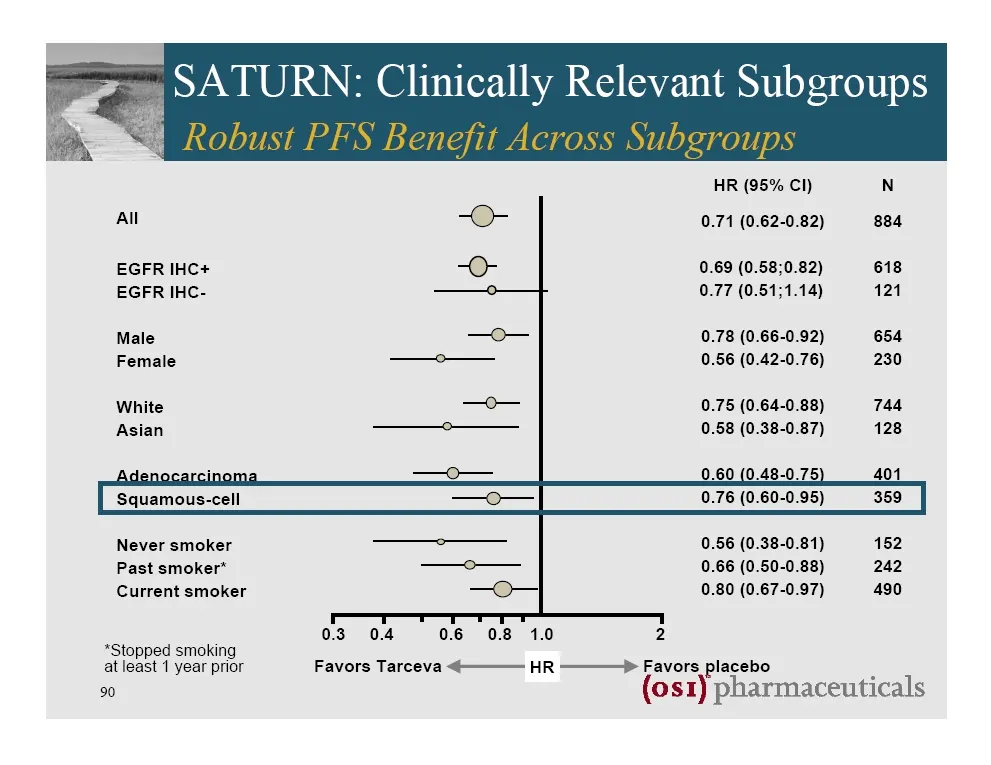
Slide 90
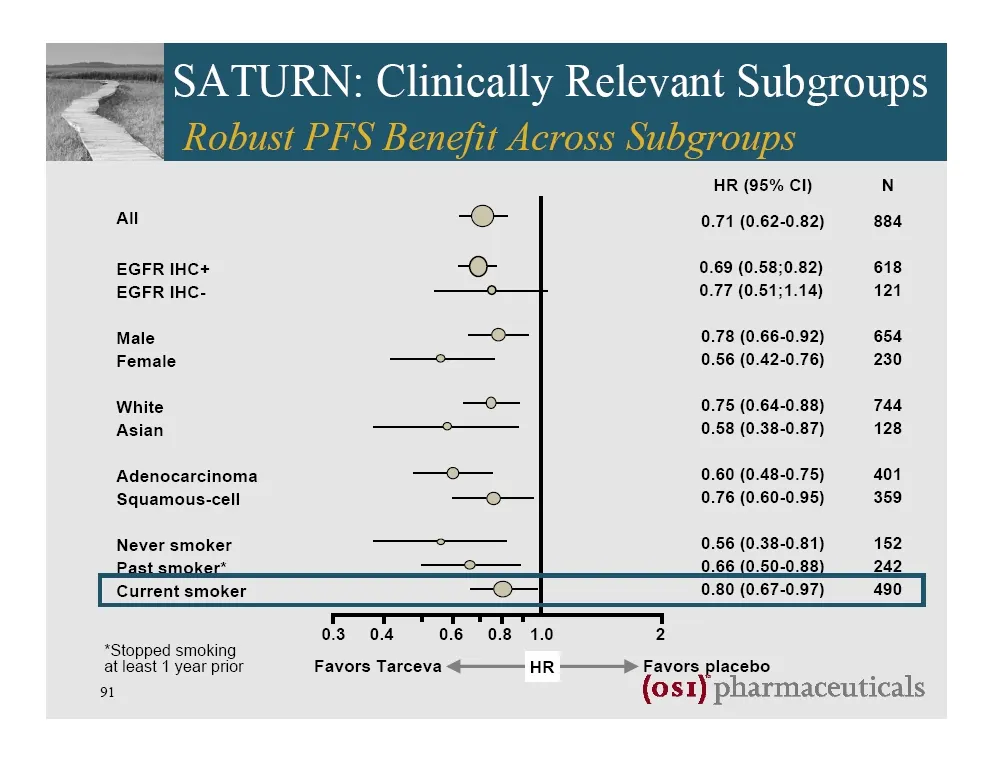
Slide 91
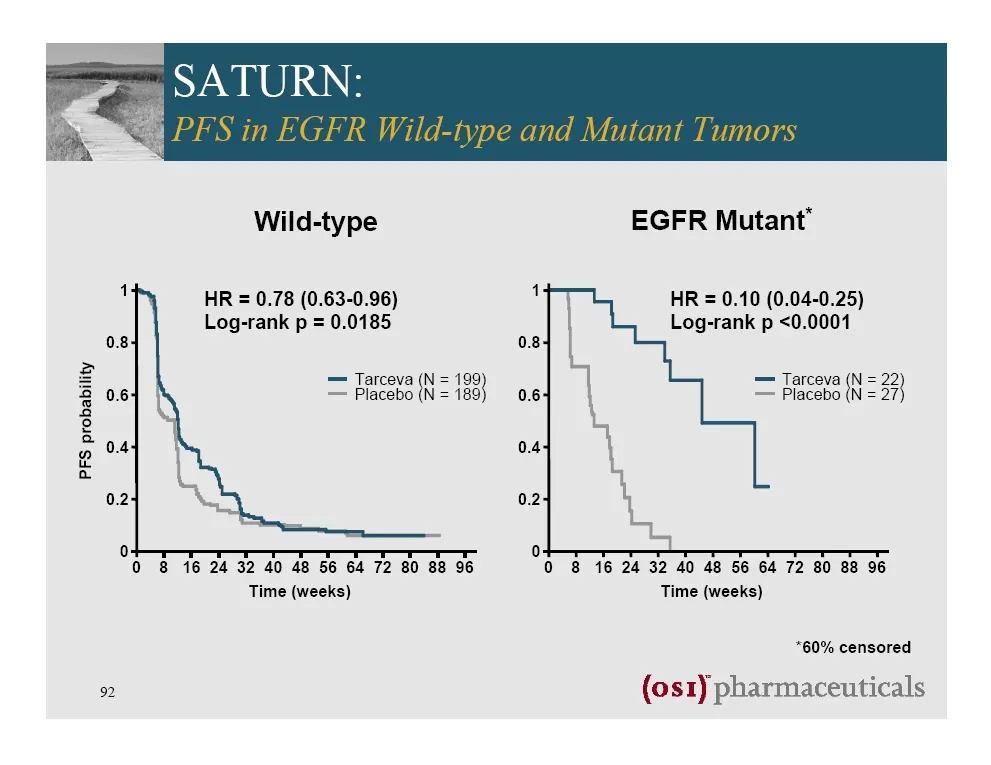
Slide 92
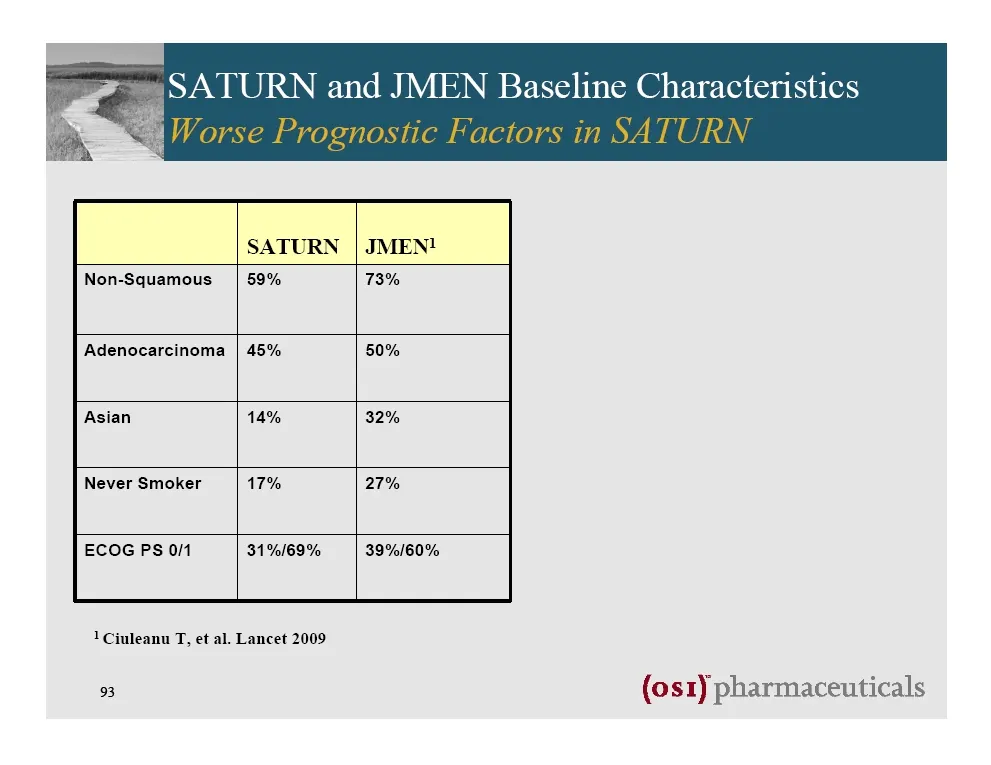
Slide 93
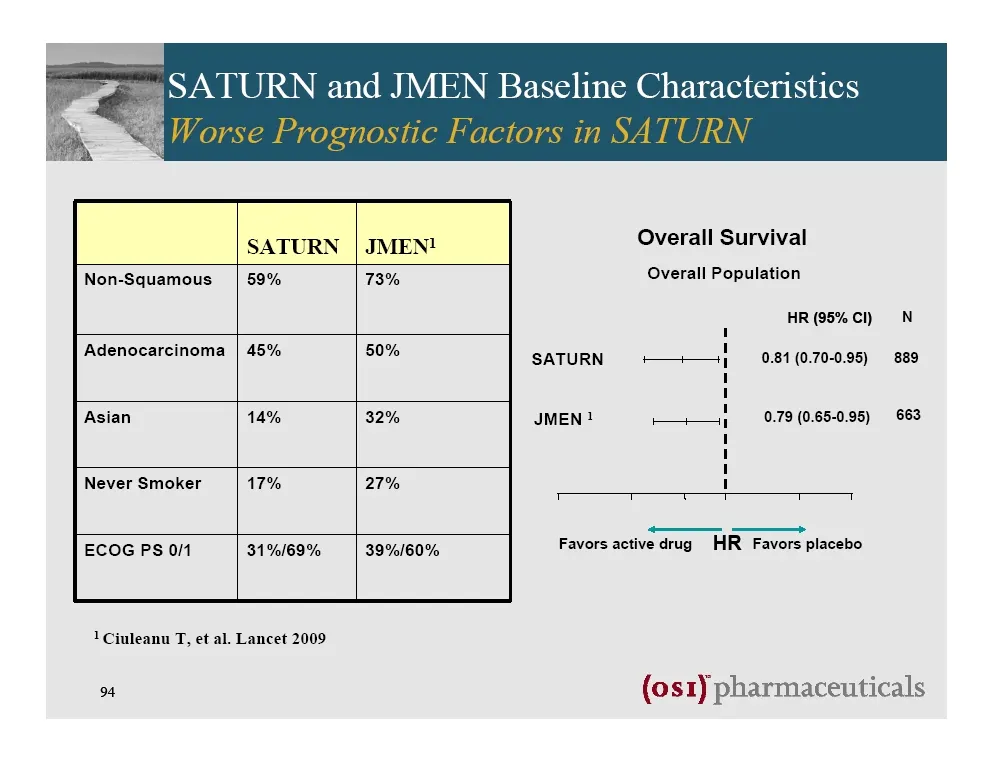
Slide 94
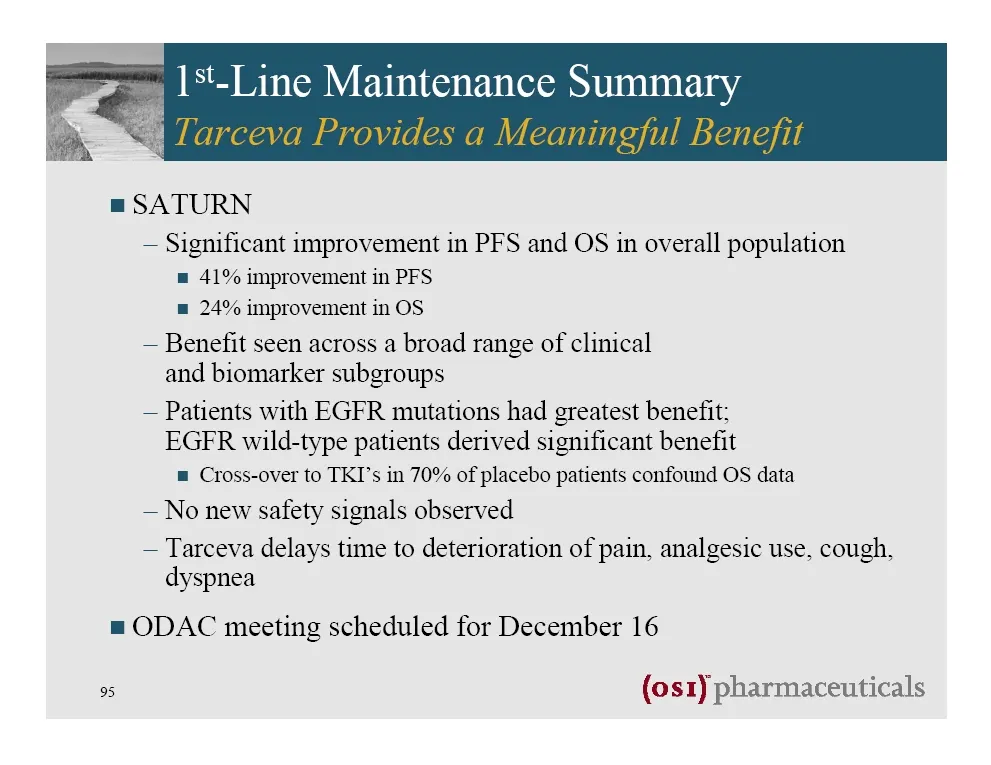
Slide 95
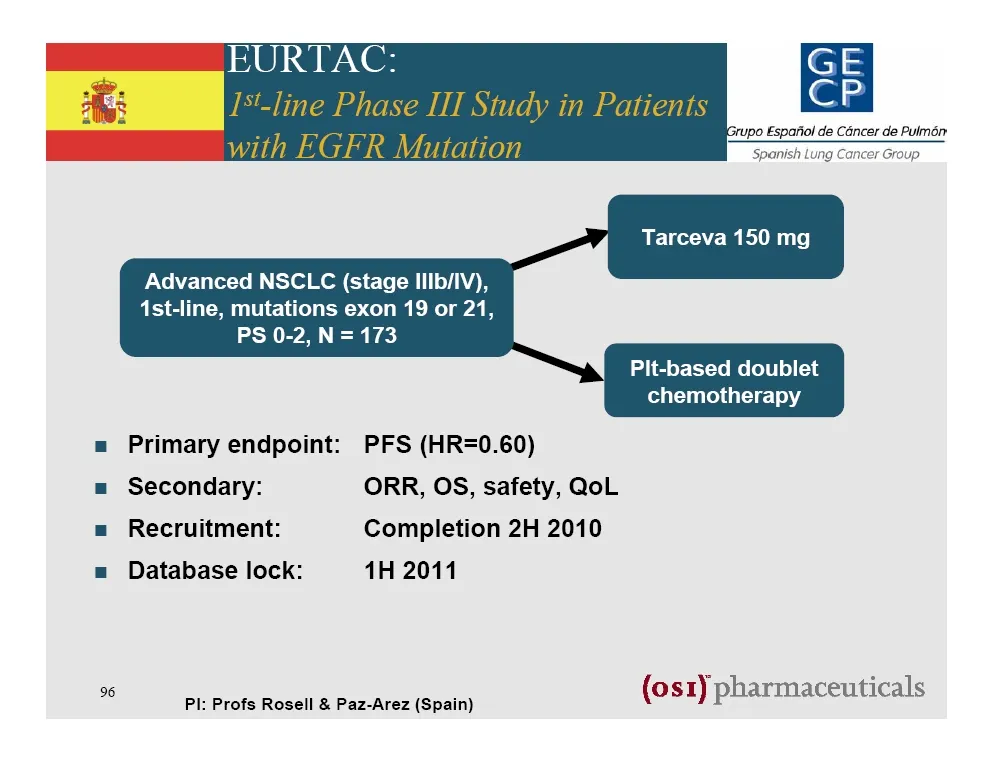
Slide 96
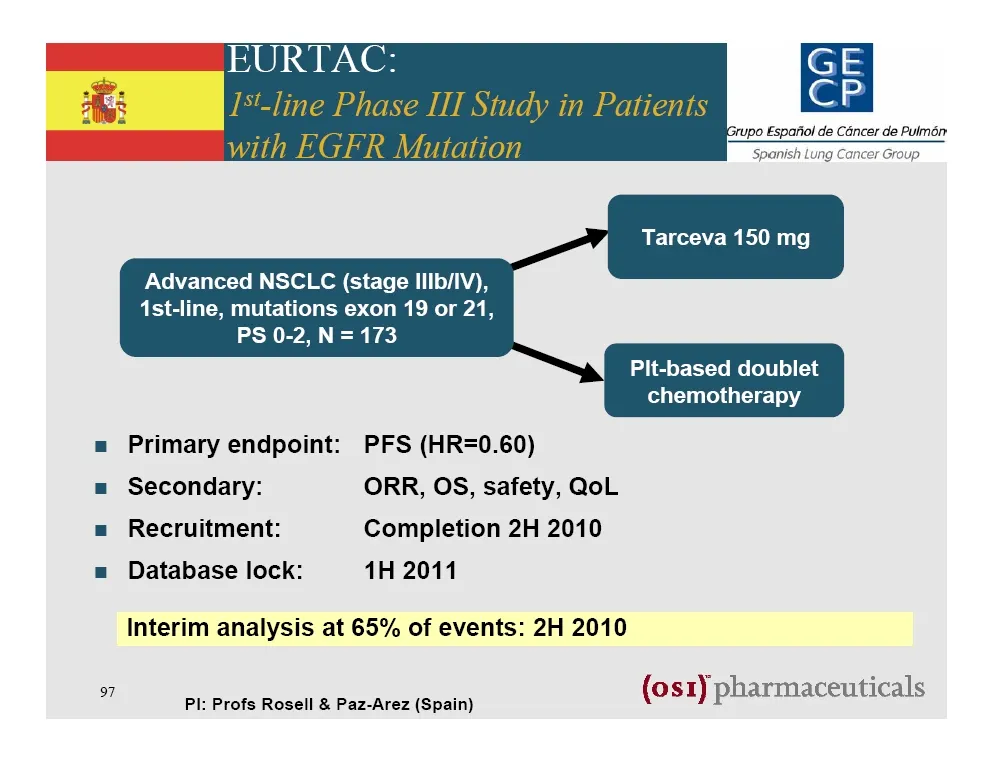
Slide 97
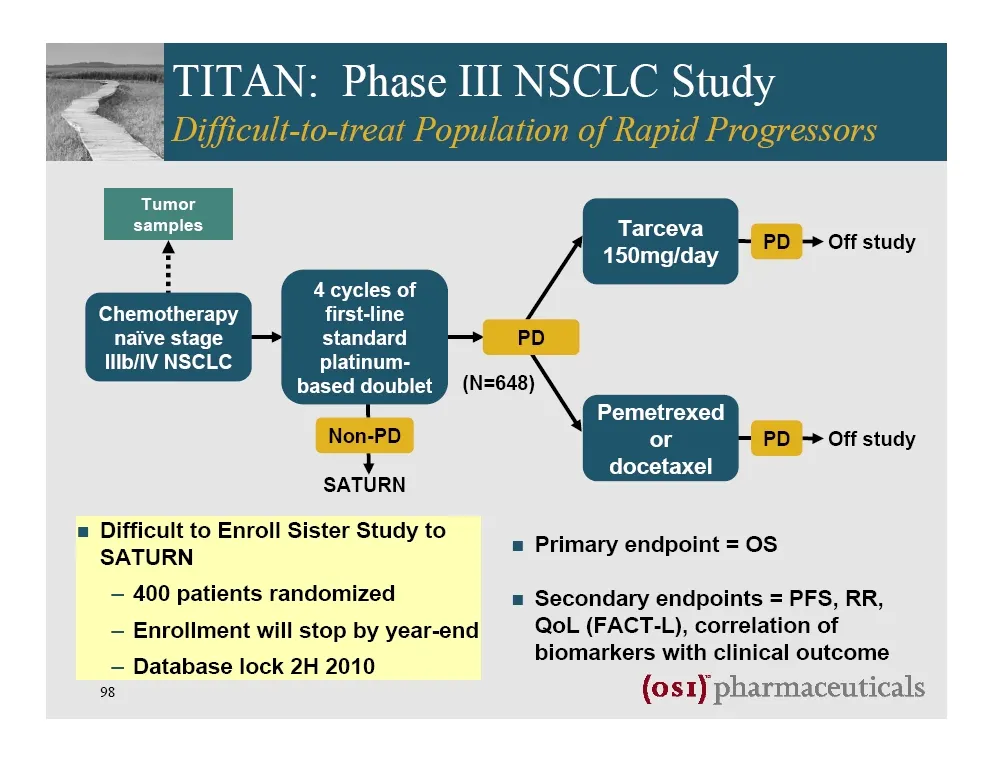
Slide 98
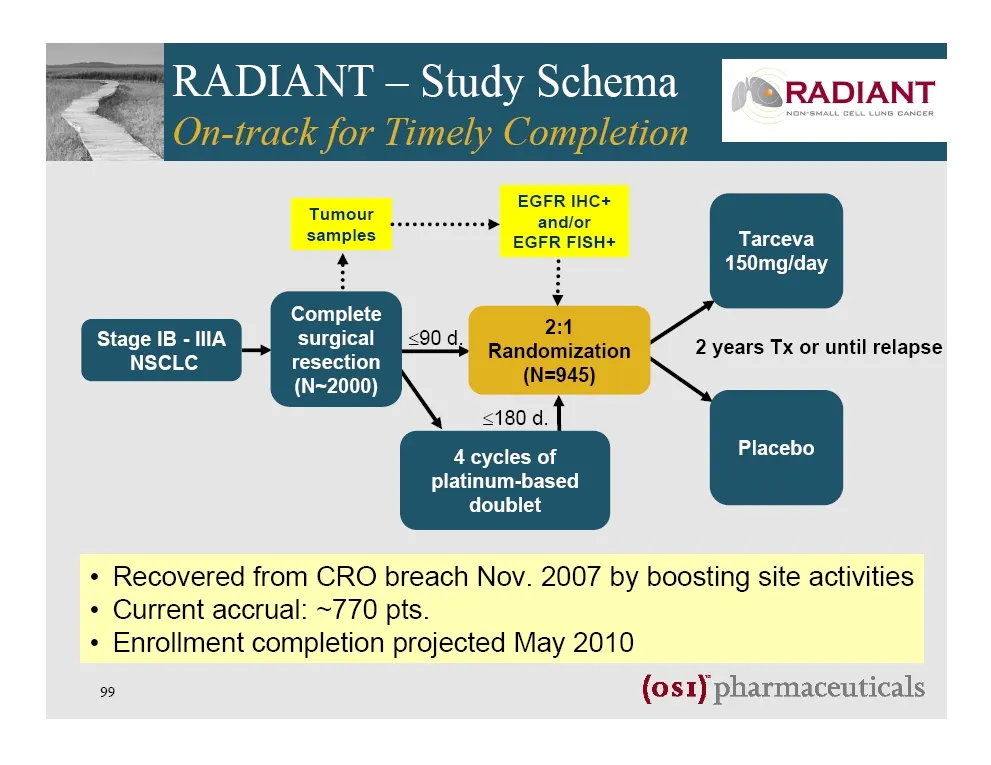
Slide 99
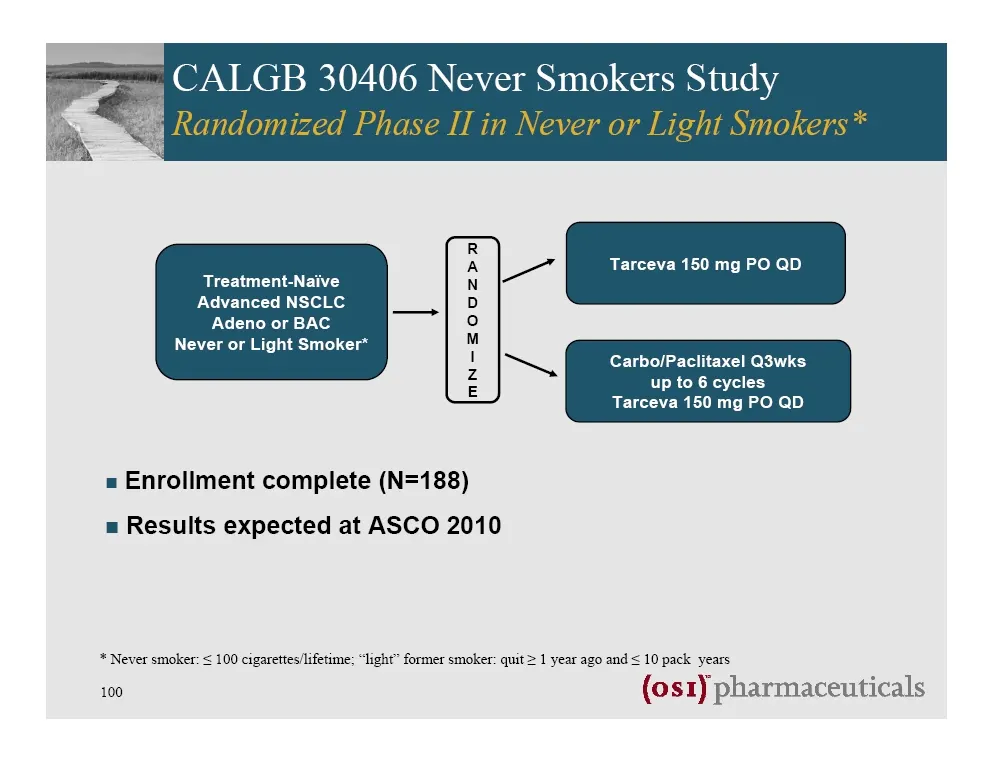
Slide 100
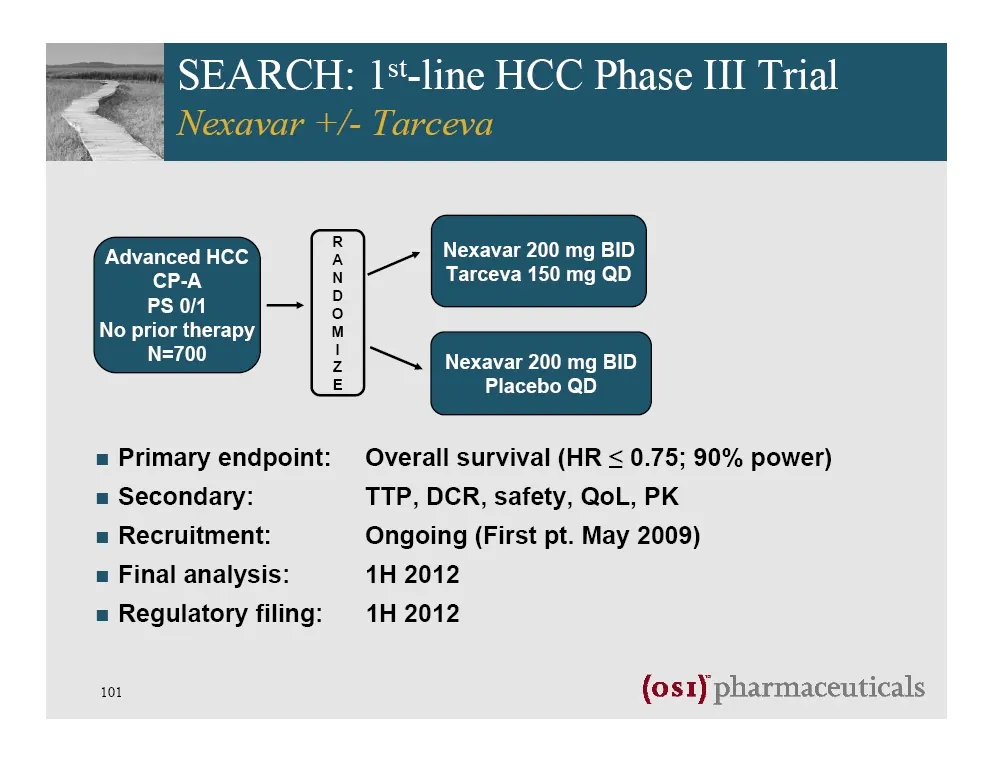
Slide 101
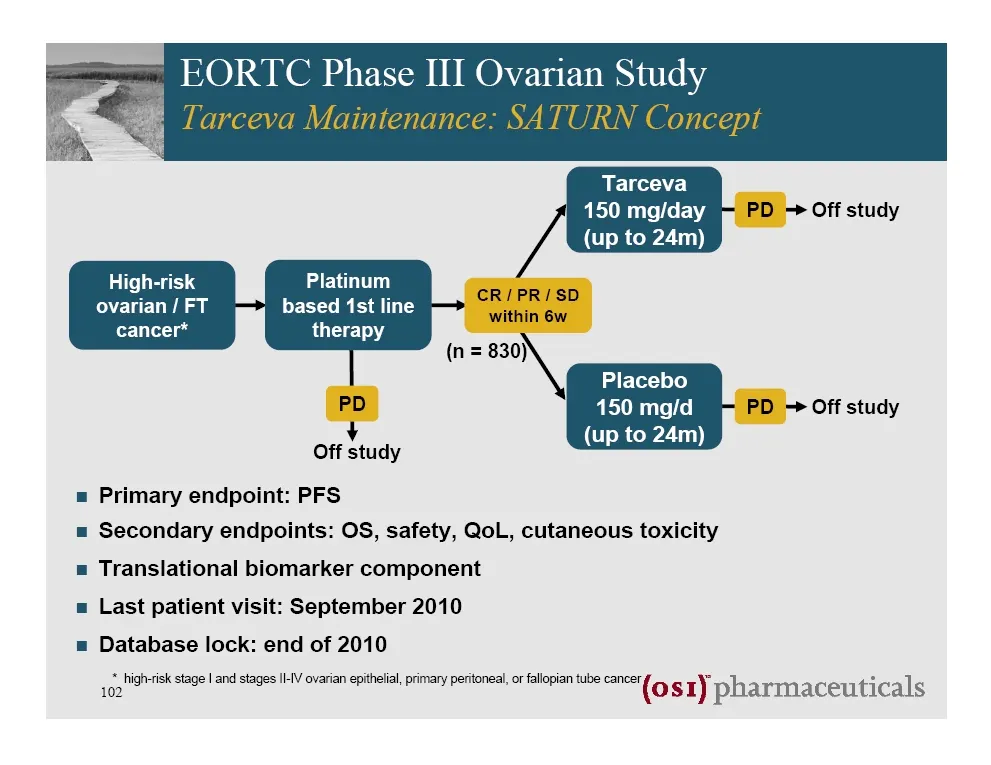
Slide 102
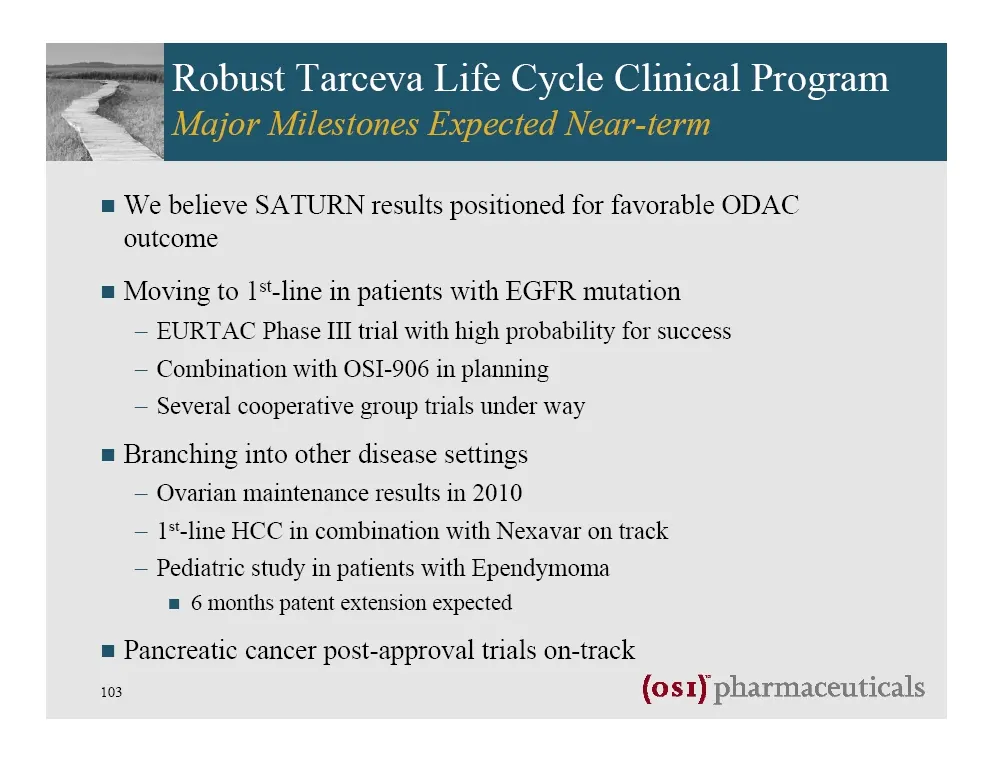
Slide 103

Slide 104
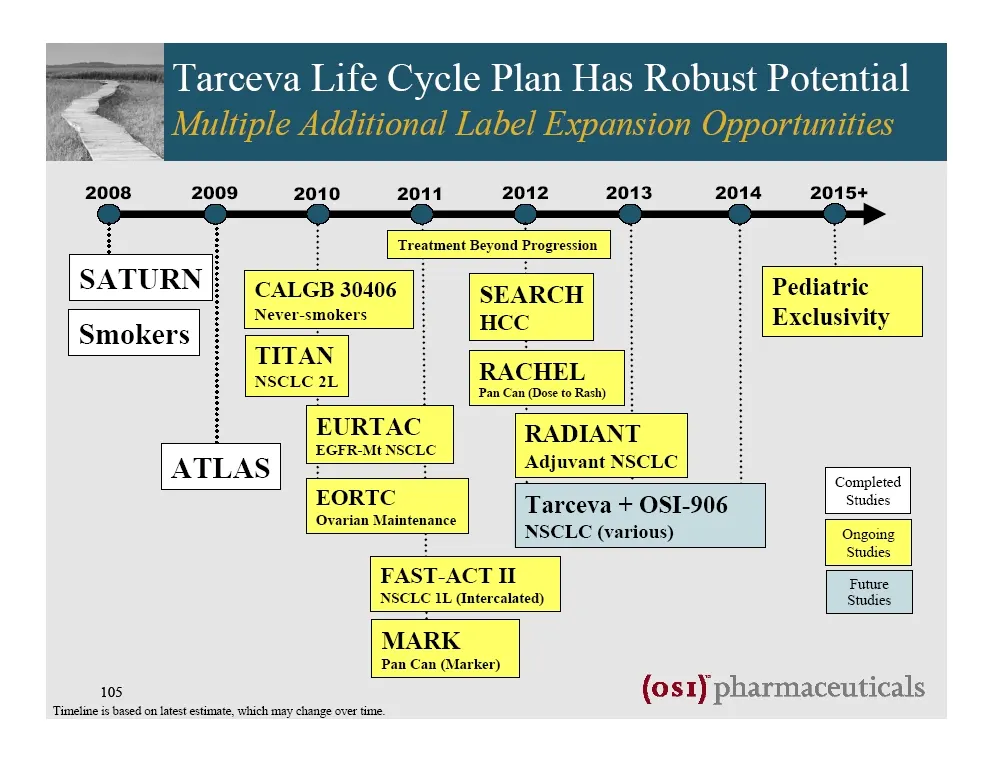
Slide 105
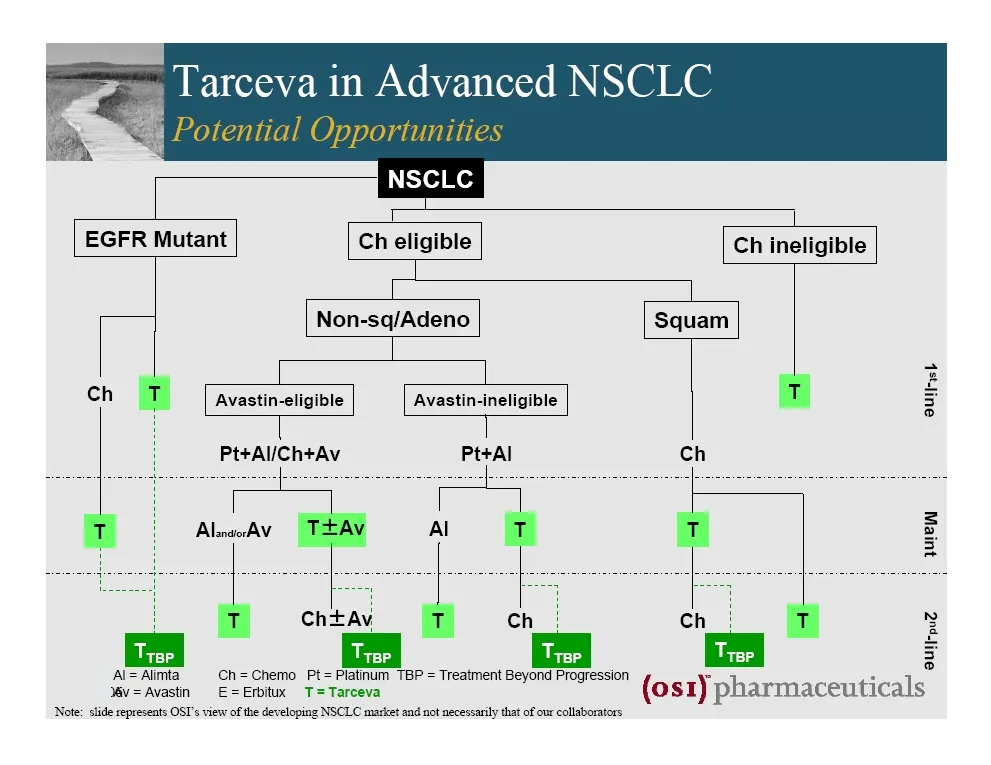
Slide 106
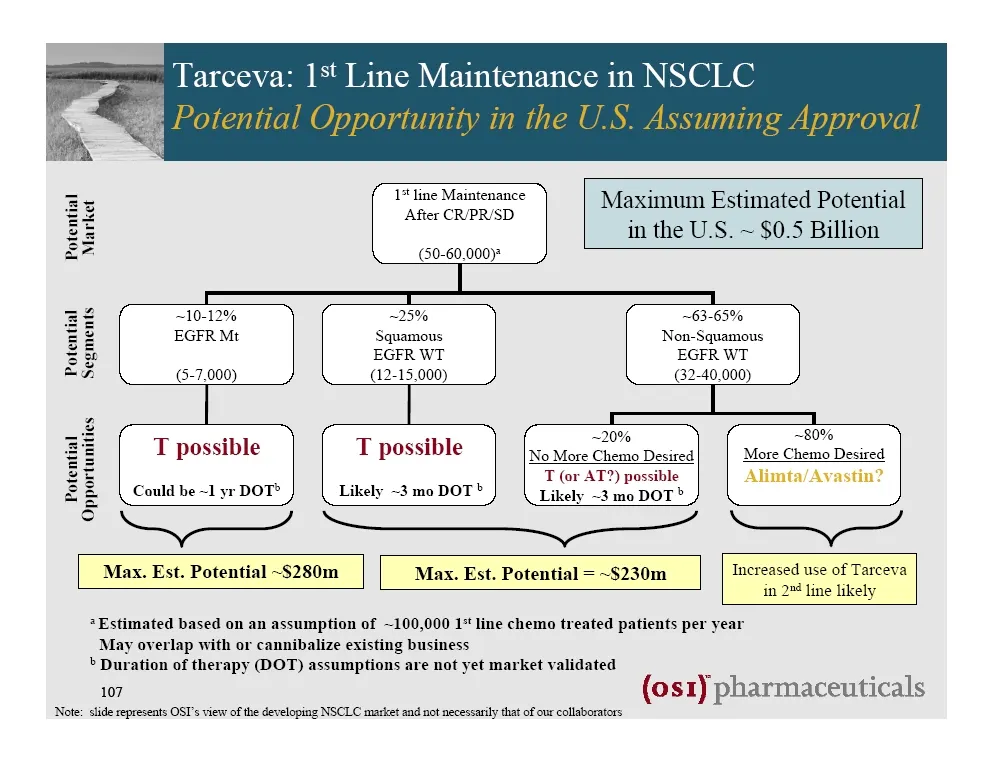
Slide 107
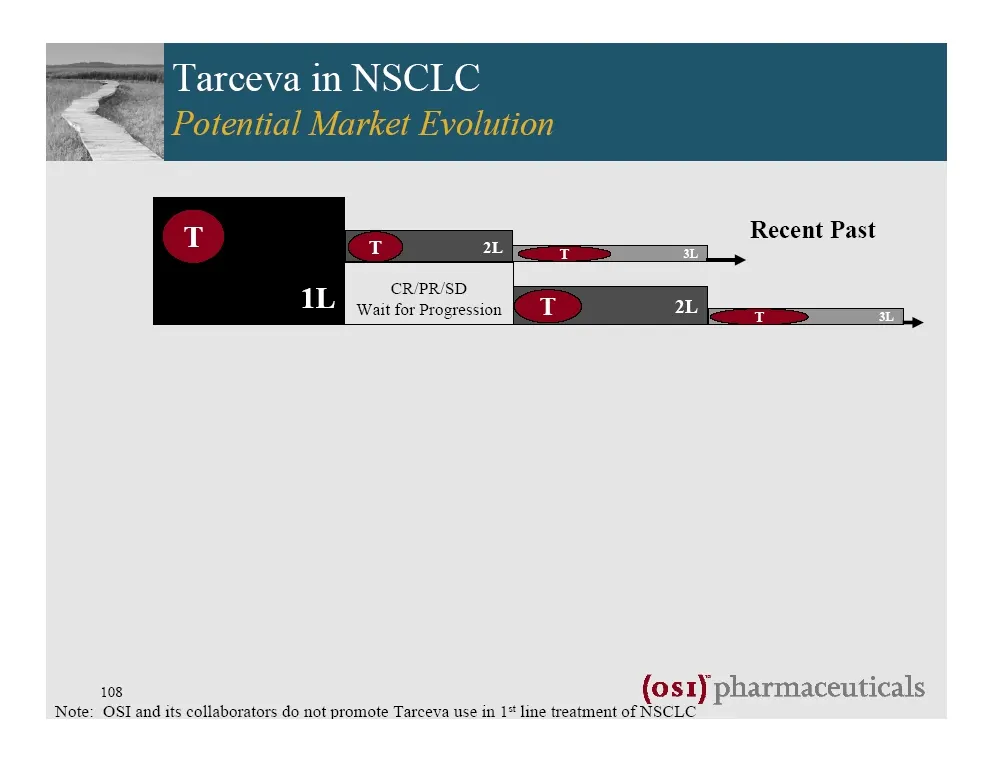
Slide 108
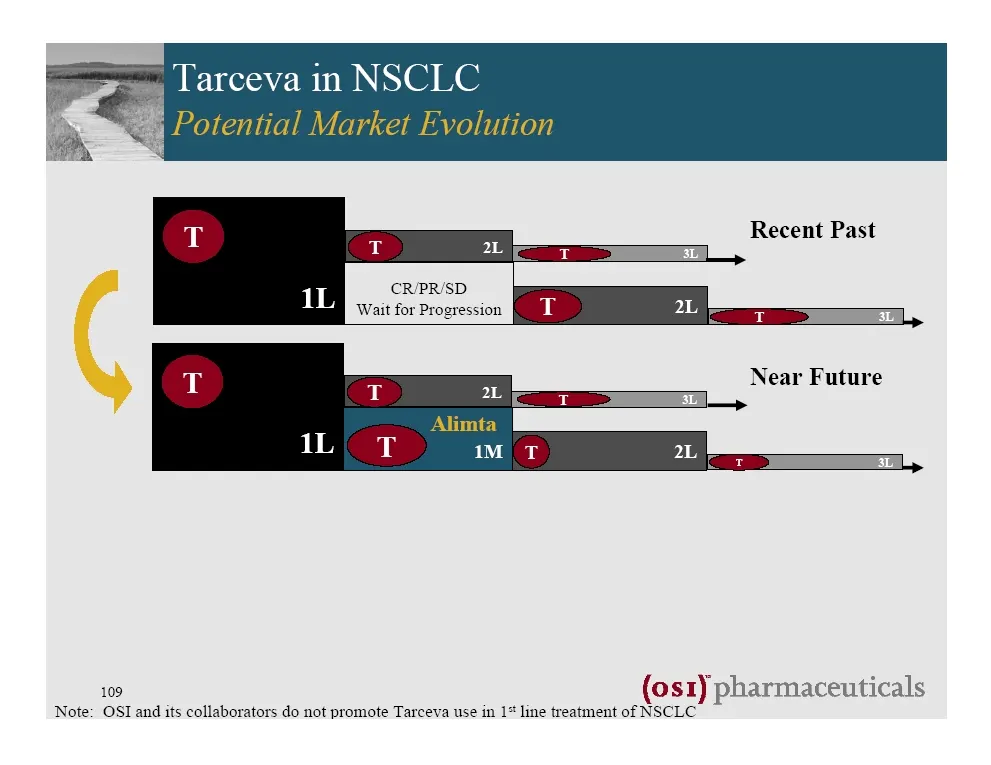
Slide 109
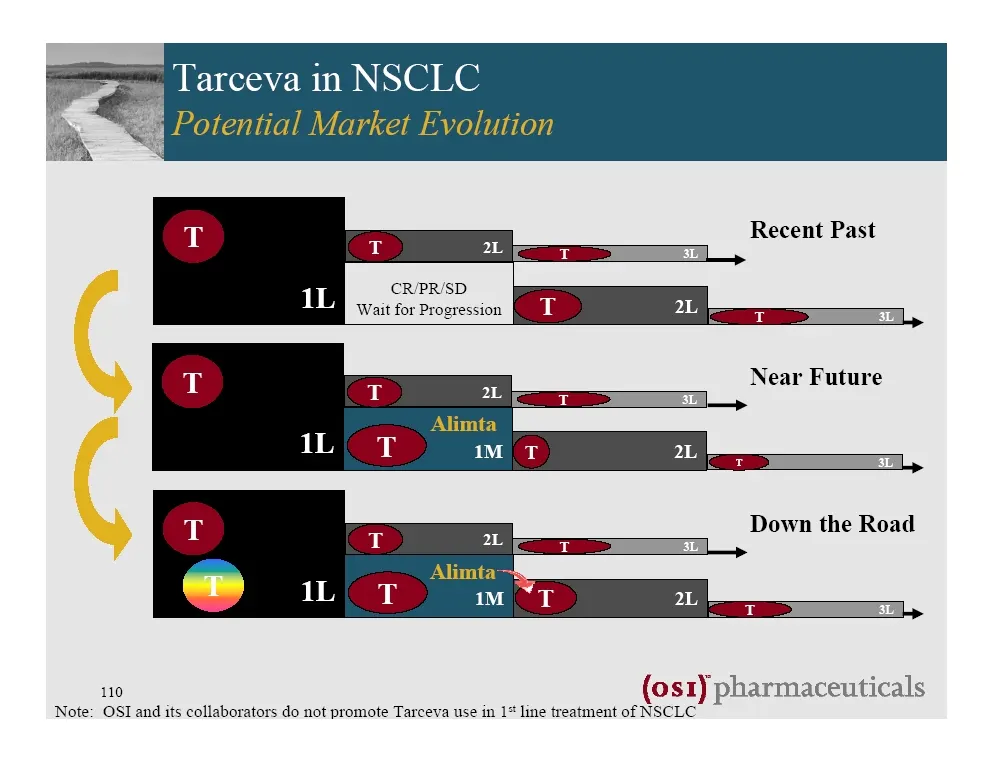
Slide 110
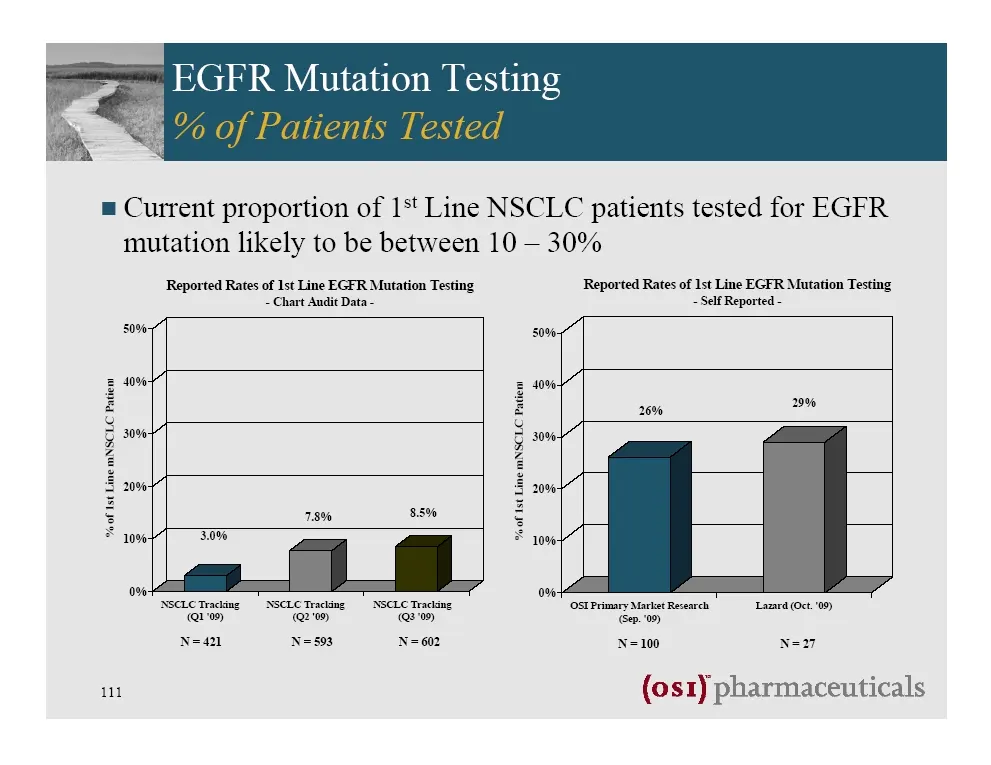
Slide 111
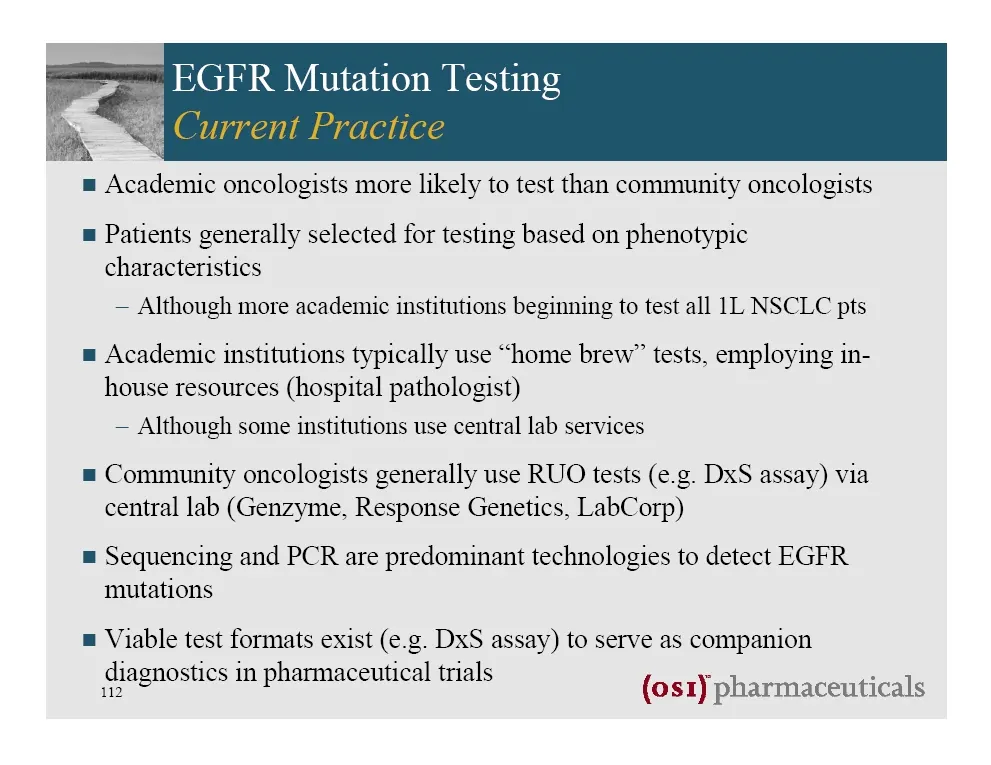
Slide 112
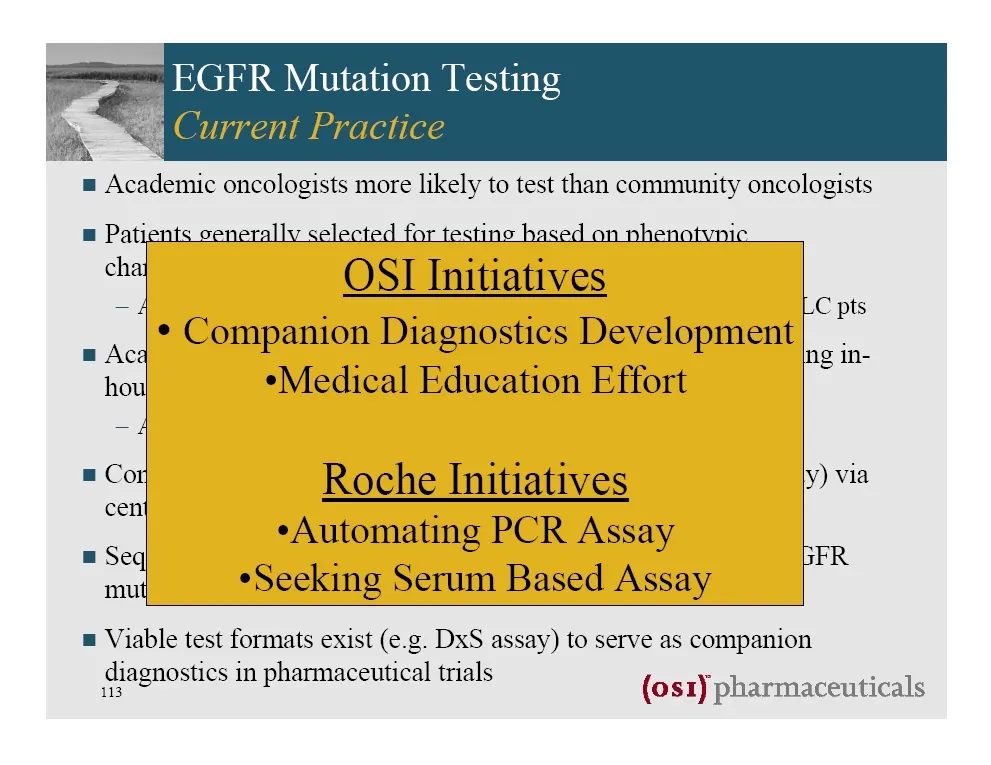
Slide 113
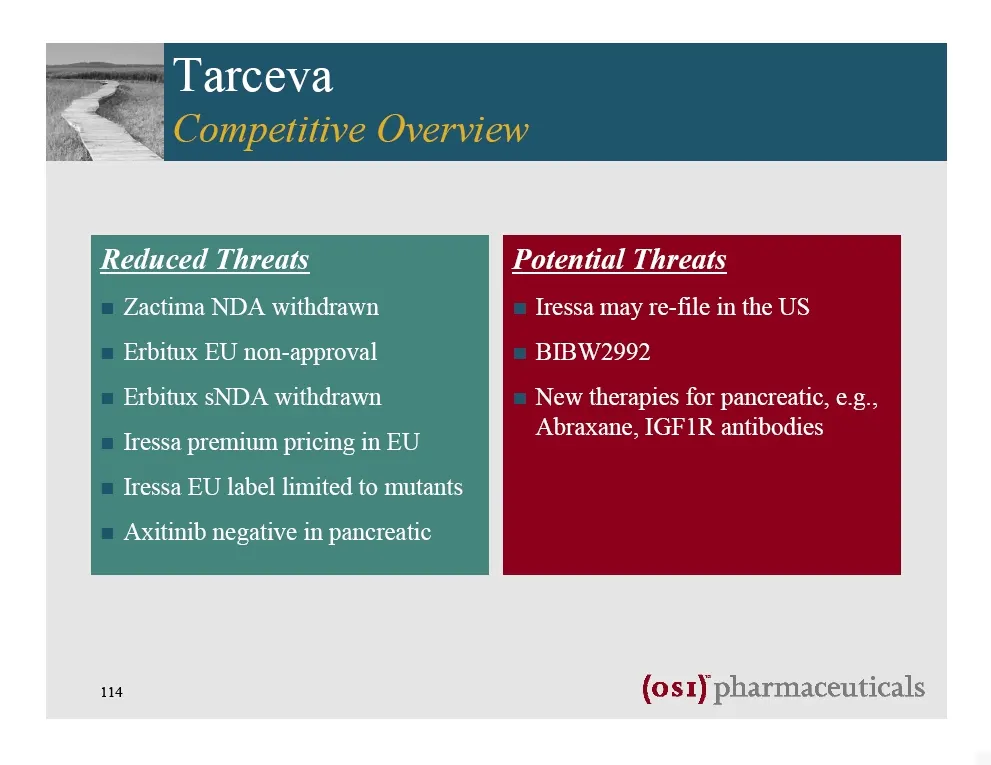
Slide 114
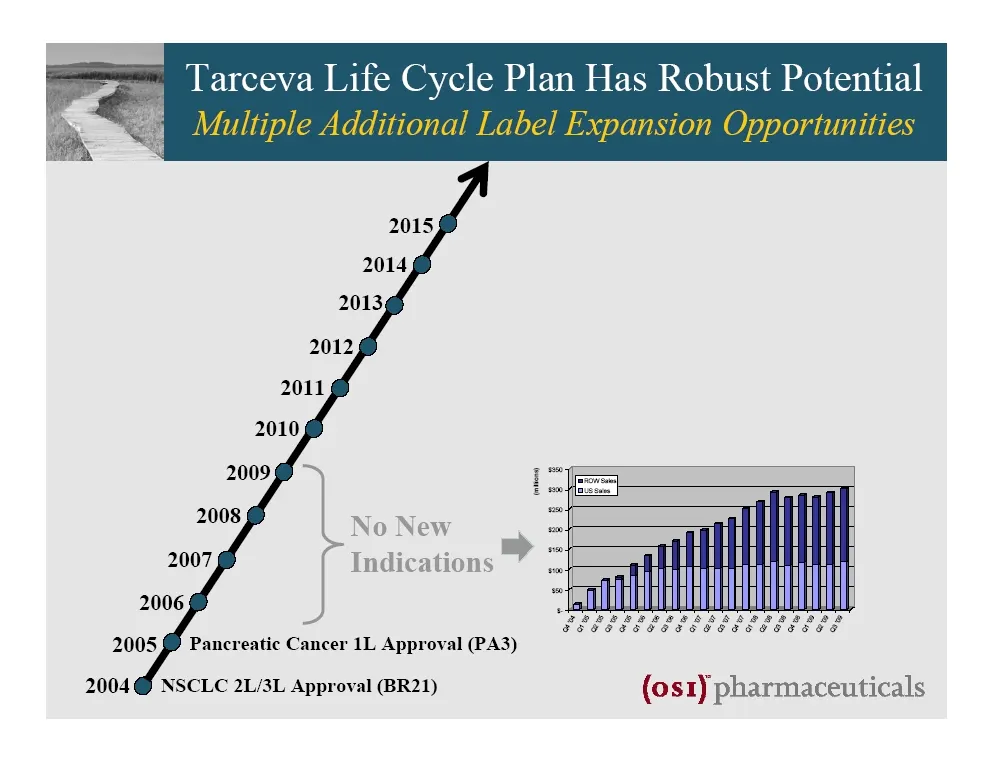
Slide 115
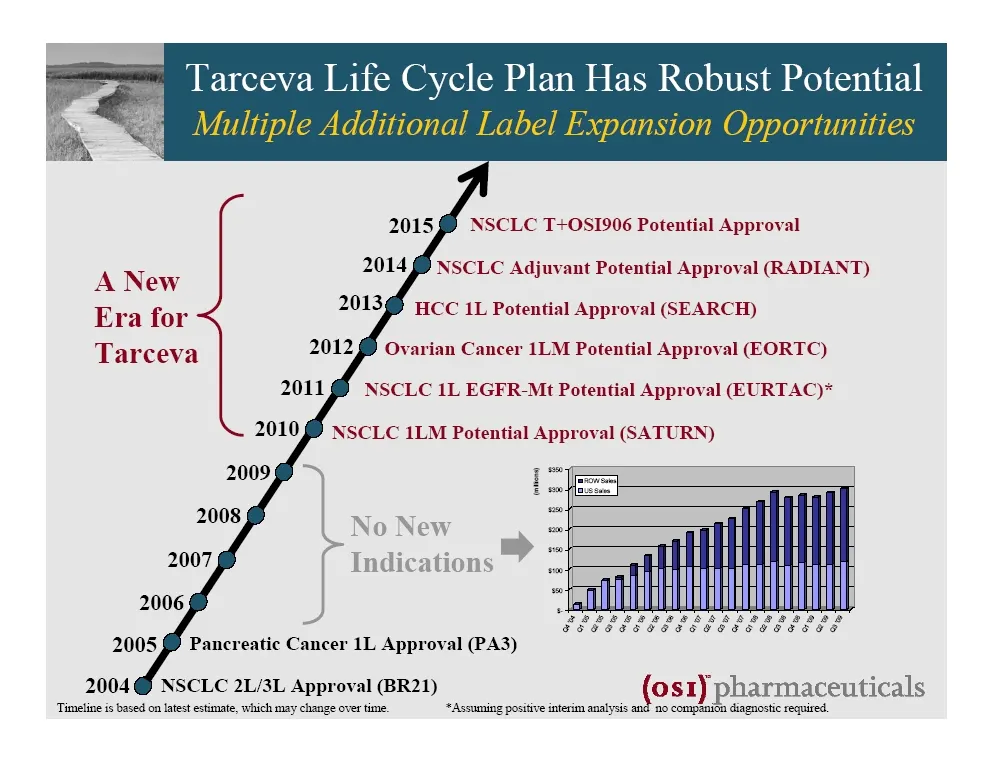
Slide 116
Slide 117
Slide 118
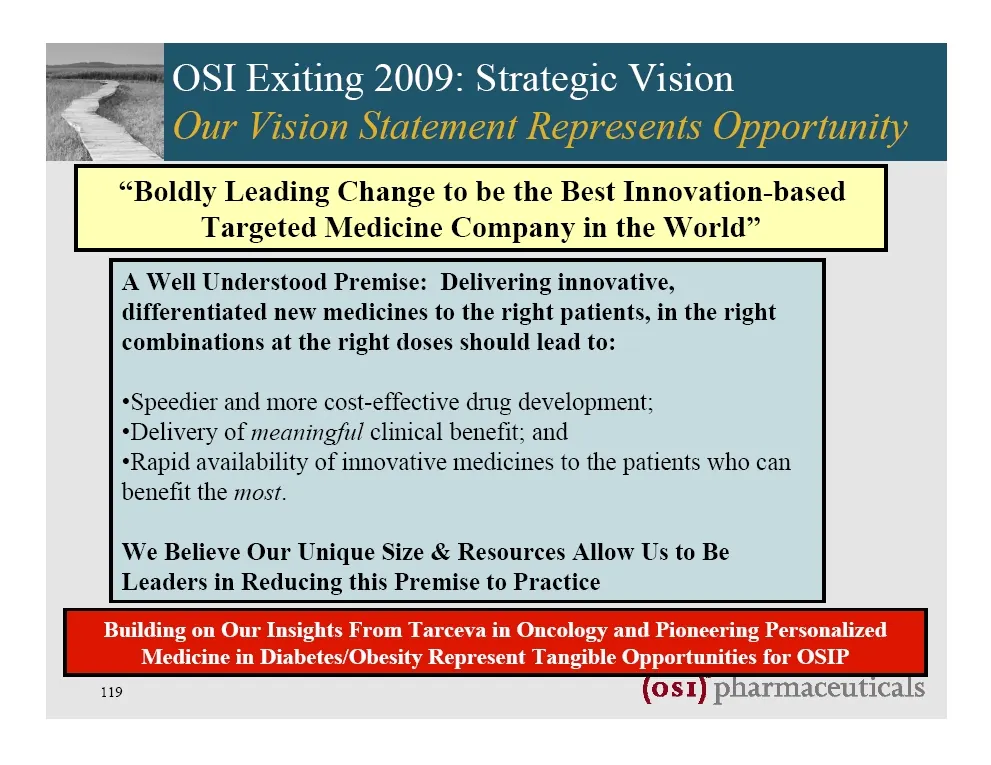
Slide 119
Slide 120
Slide 121
Slide 122
Slide 123
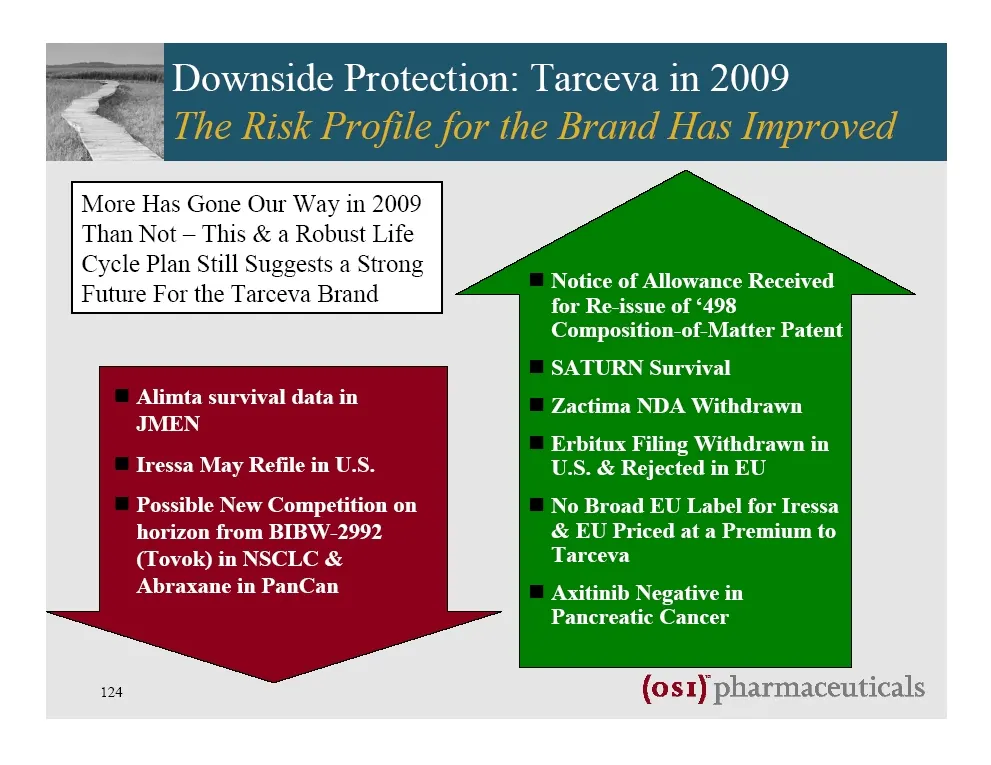
Slide 124
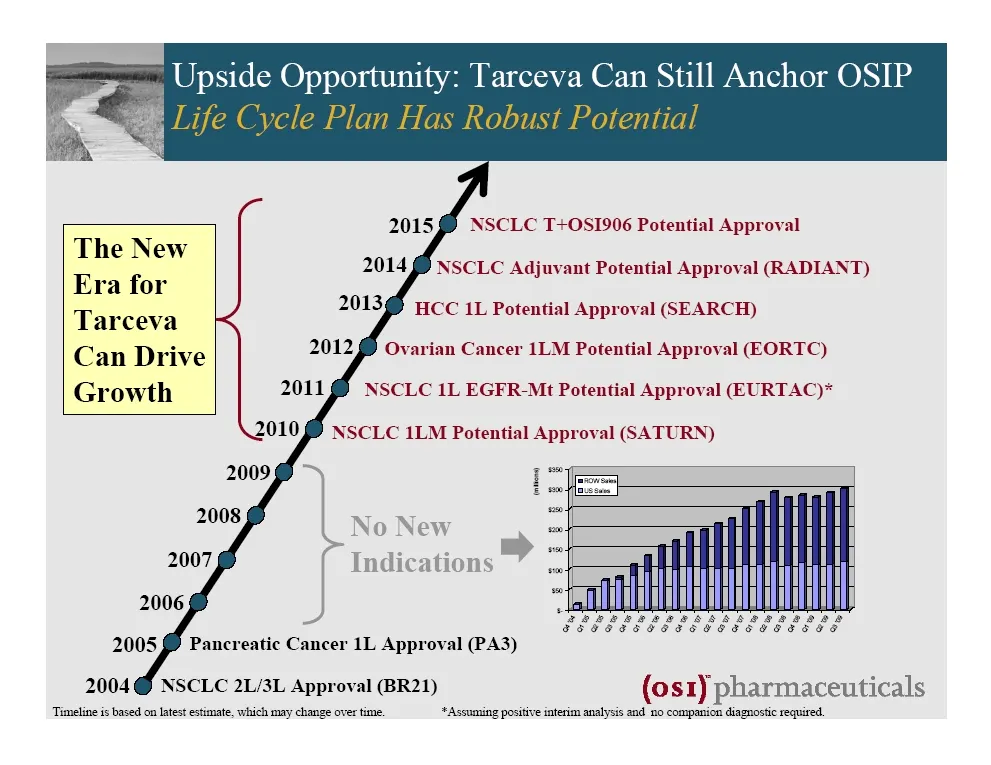
Slide 125
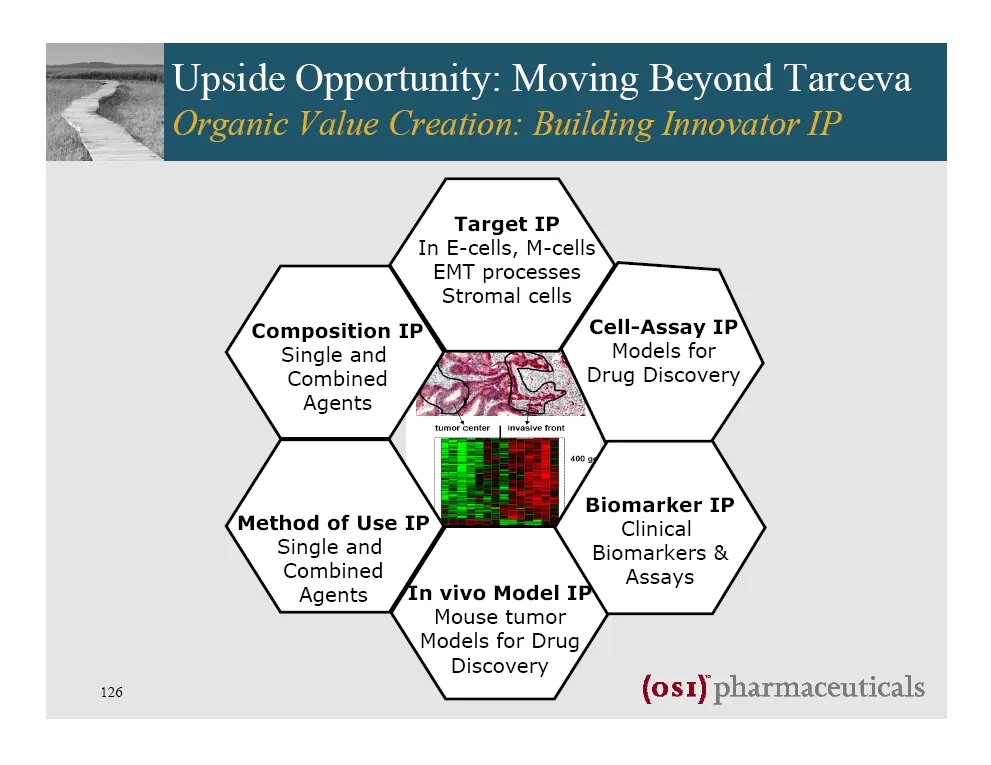
Slide 126
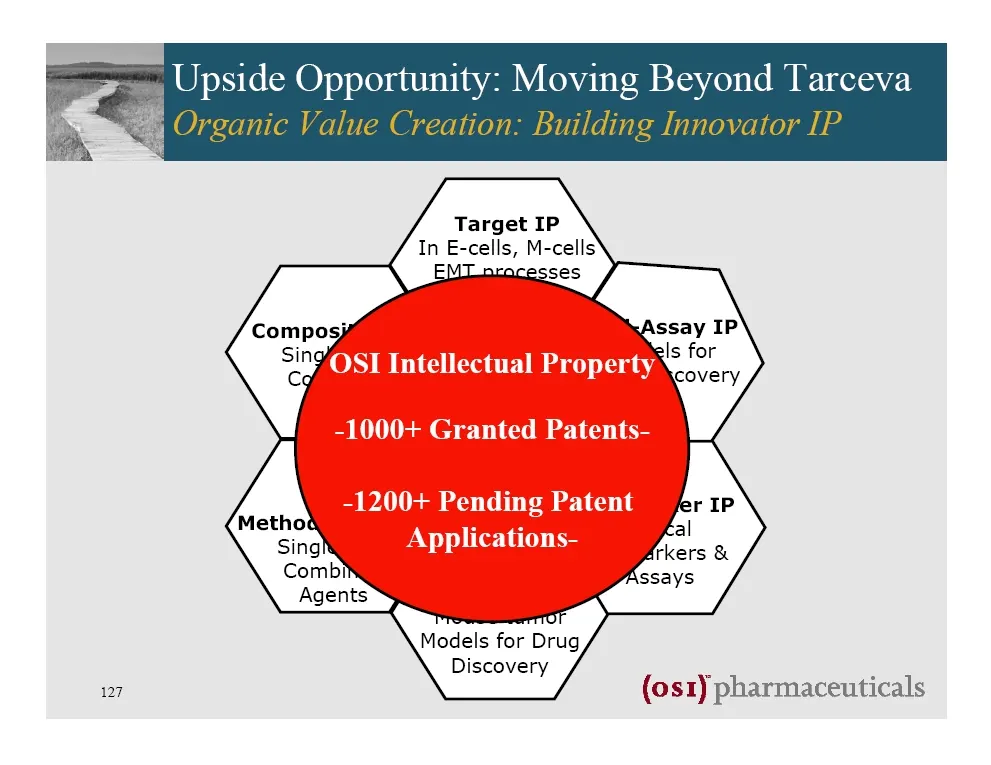
Slide 127
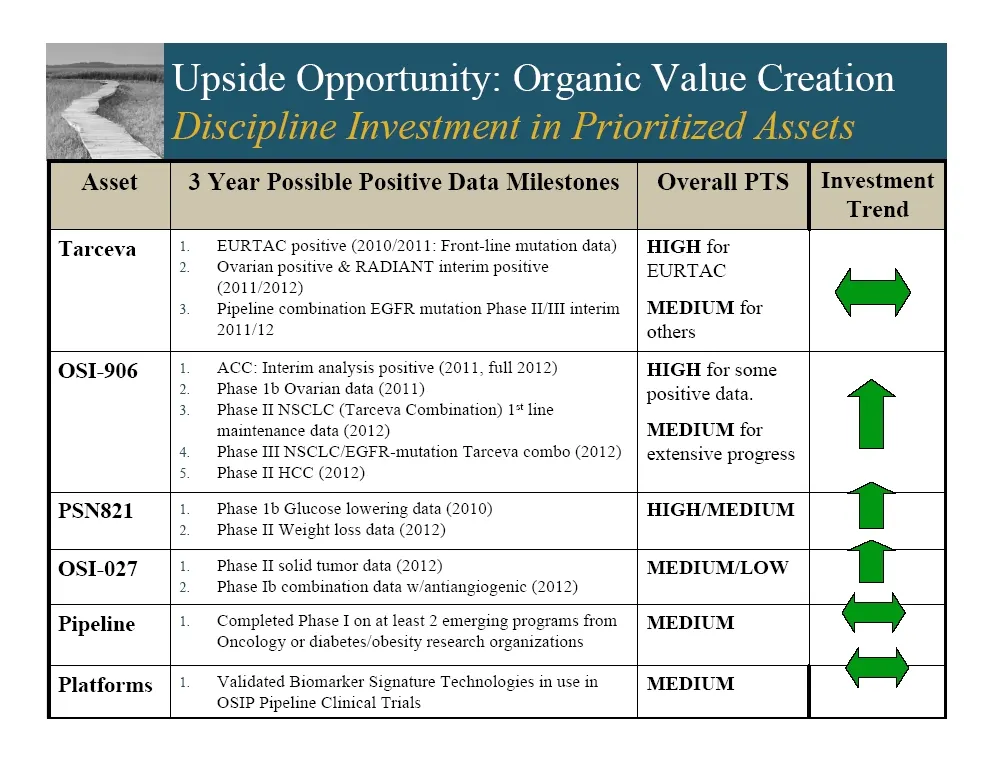
Slide 128
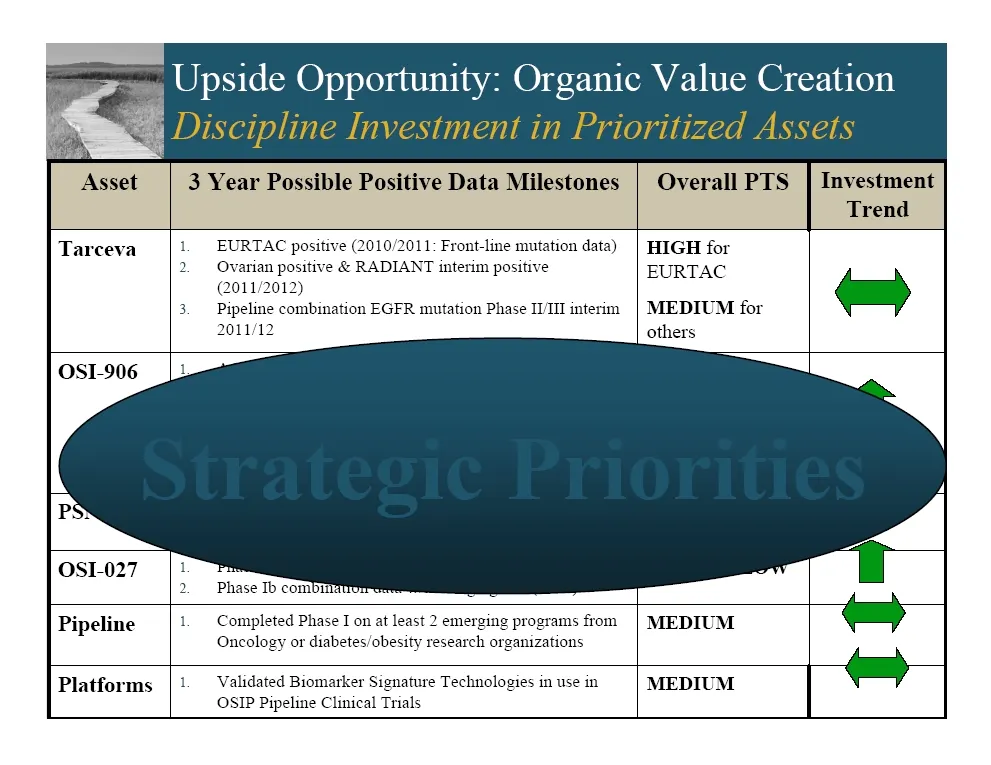
Slide 129
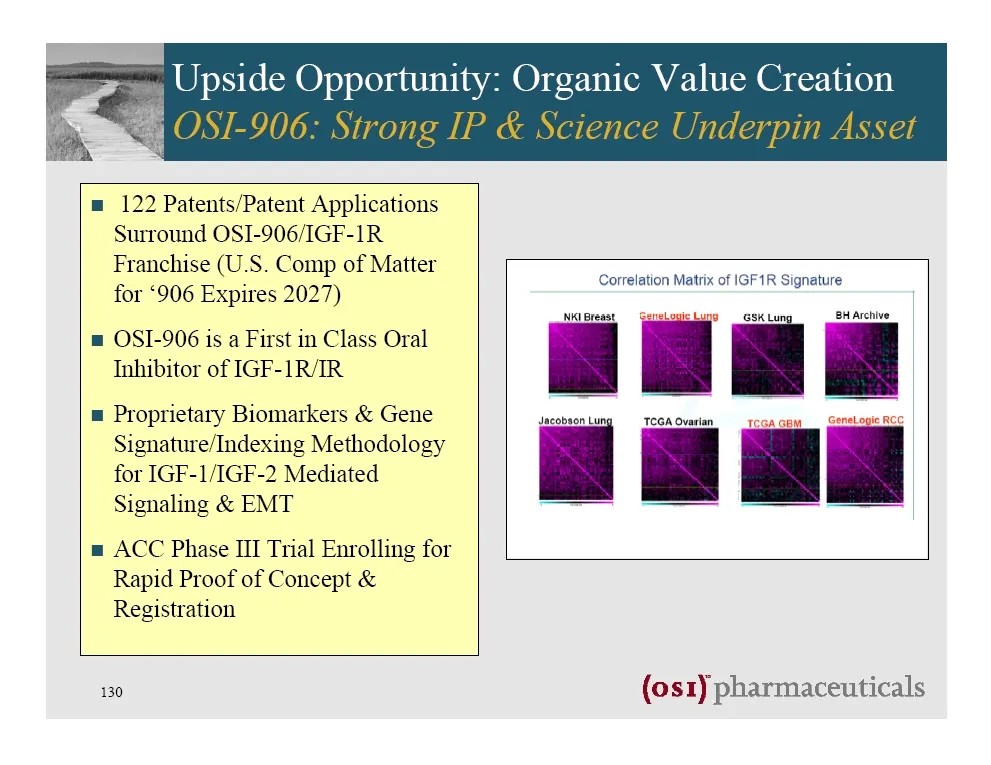
Slide 130
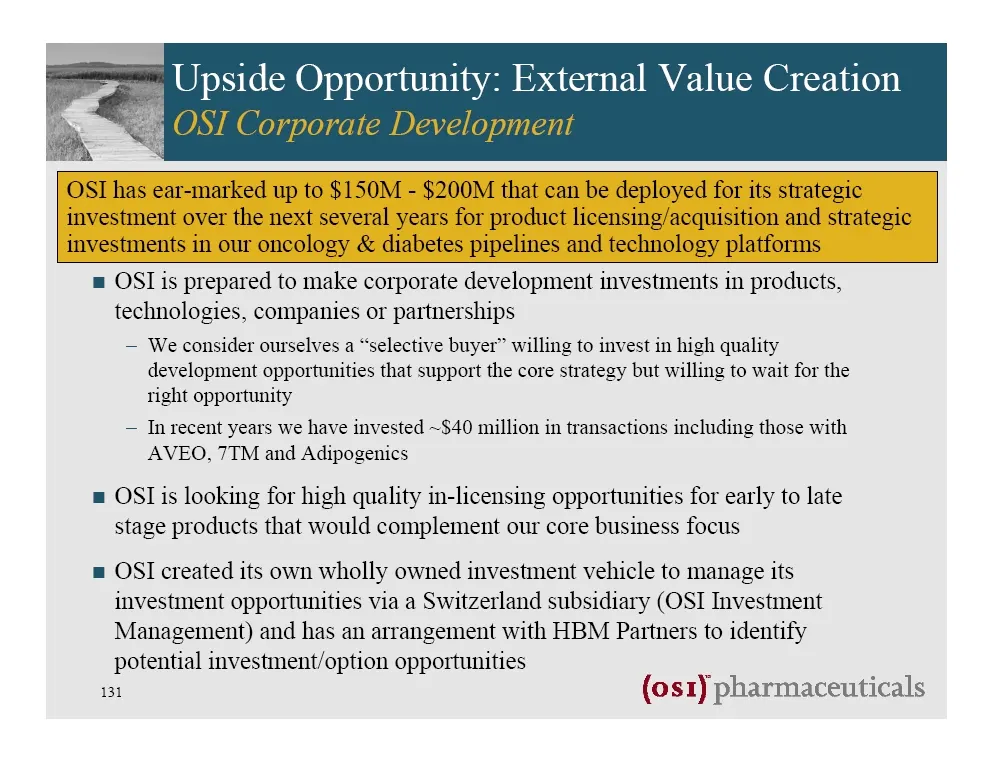
Slide 131
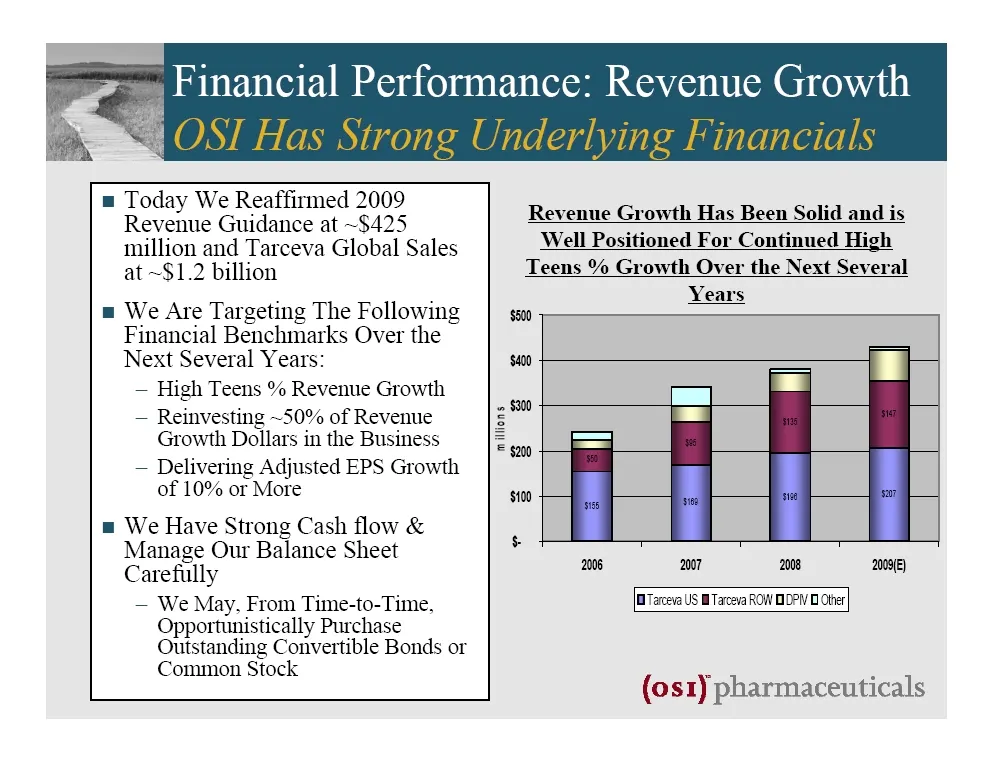
Slide 132
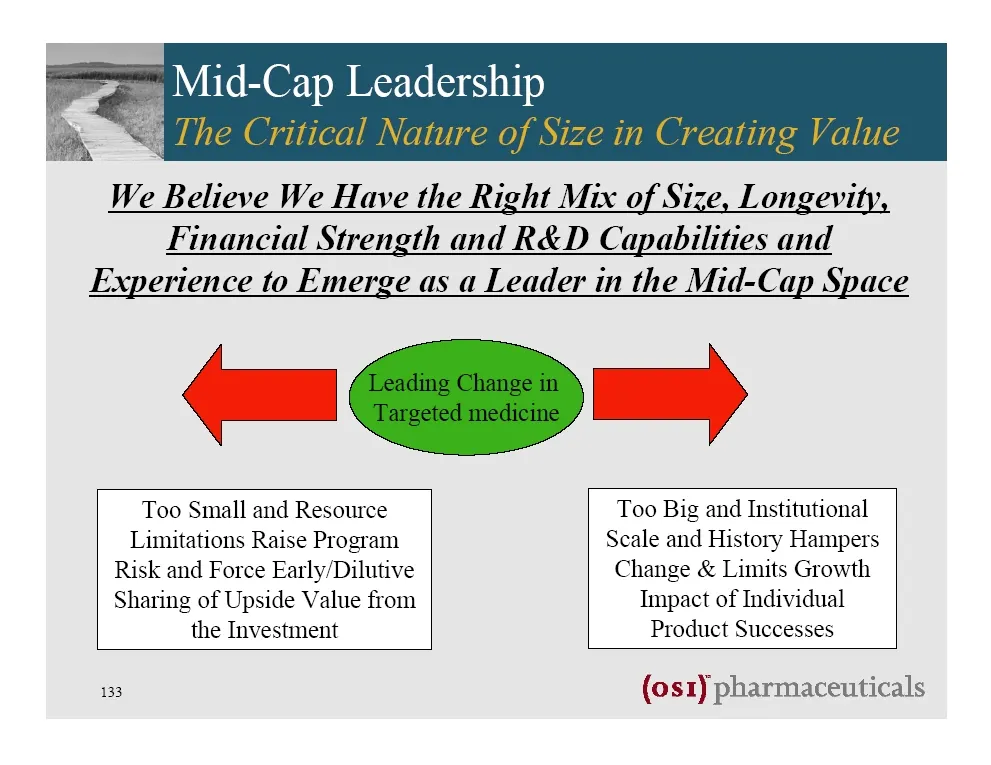
Slide 133
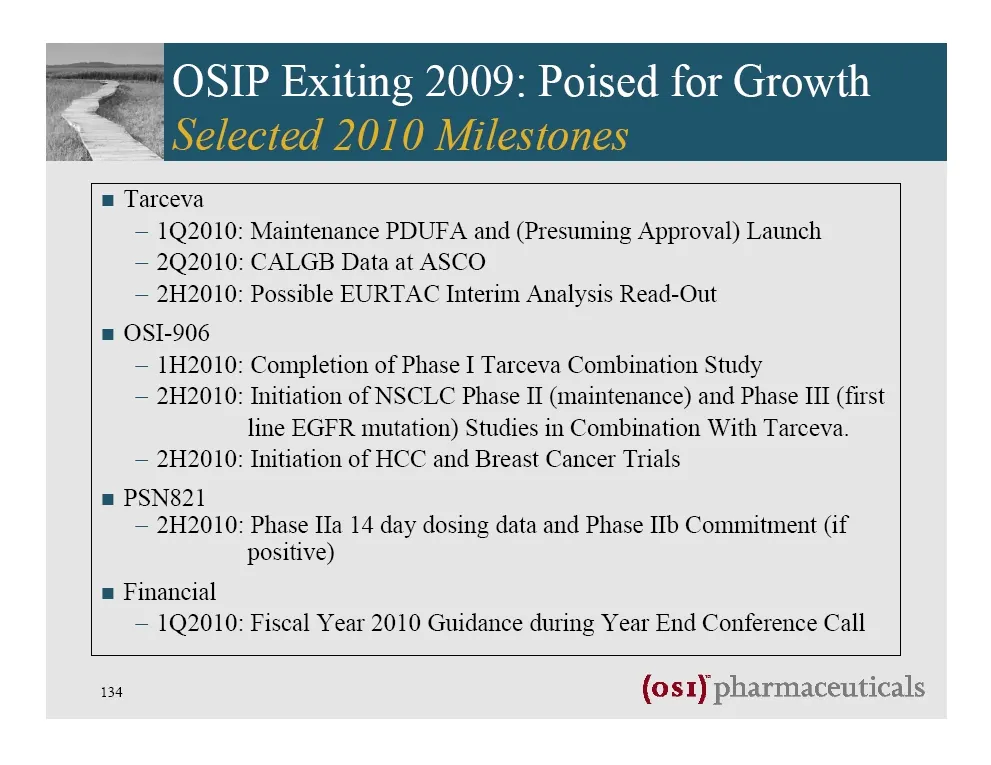
Slide 134
Slide 135
Source: SEC EDGAR · 8-K filed Dec 4, 2009