ACS, Actividades de Construccion y Servicios SA · BME:ACS
ACS, Actividades de Construccion y Servicios SA — Q1 2023 Earnings Presentation
15 slides from ACS, Actividades de Construccion y Servicios SA's earnings presentation, May 12, 2023
Slide 1: 1Q2023 Results Presentation
1Q2023 ee Aes Results Presentation May 12*, 2023
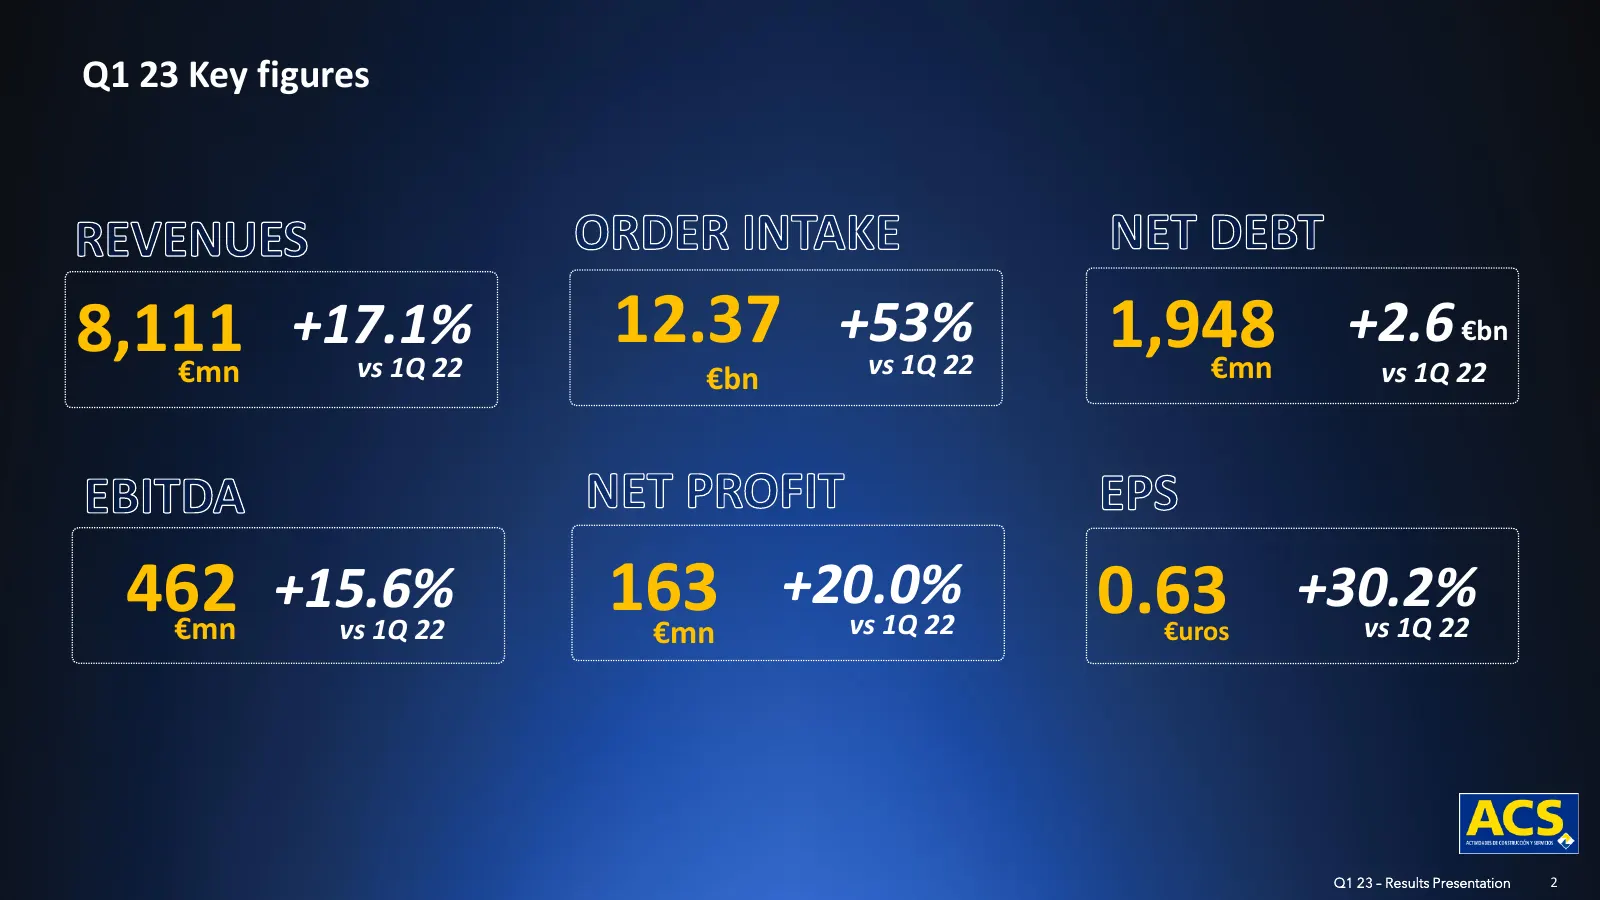
Slide 2: Q1 23 Key figures
Q1 23 Key figures 8,111 +17.1% vs 1Q 22 12.37 +53% vs 1Q 22 1,948 €mn +2.6 €bn €mn €bn vs 1Q 22 462 €mn +15.6% vs 1Q 22 163 €mn +20.0% vs 1Q 22 0.63 +30.2% €urosvs 1Q 22 Q1 23 – Results Presentation 2
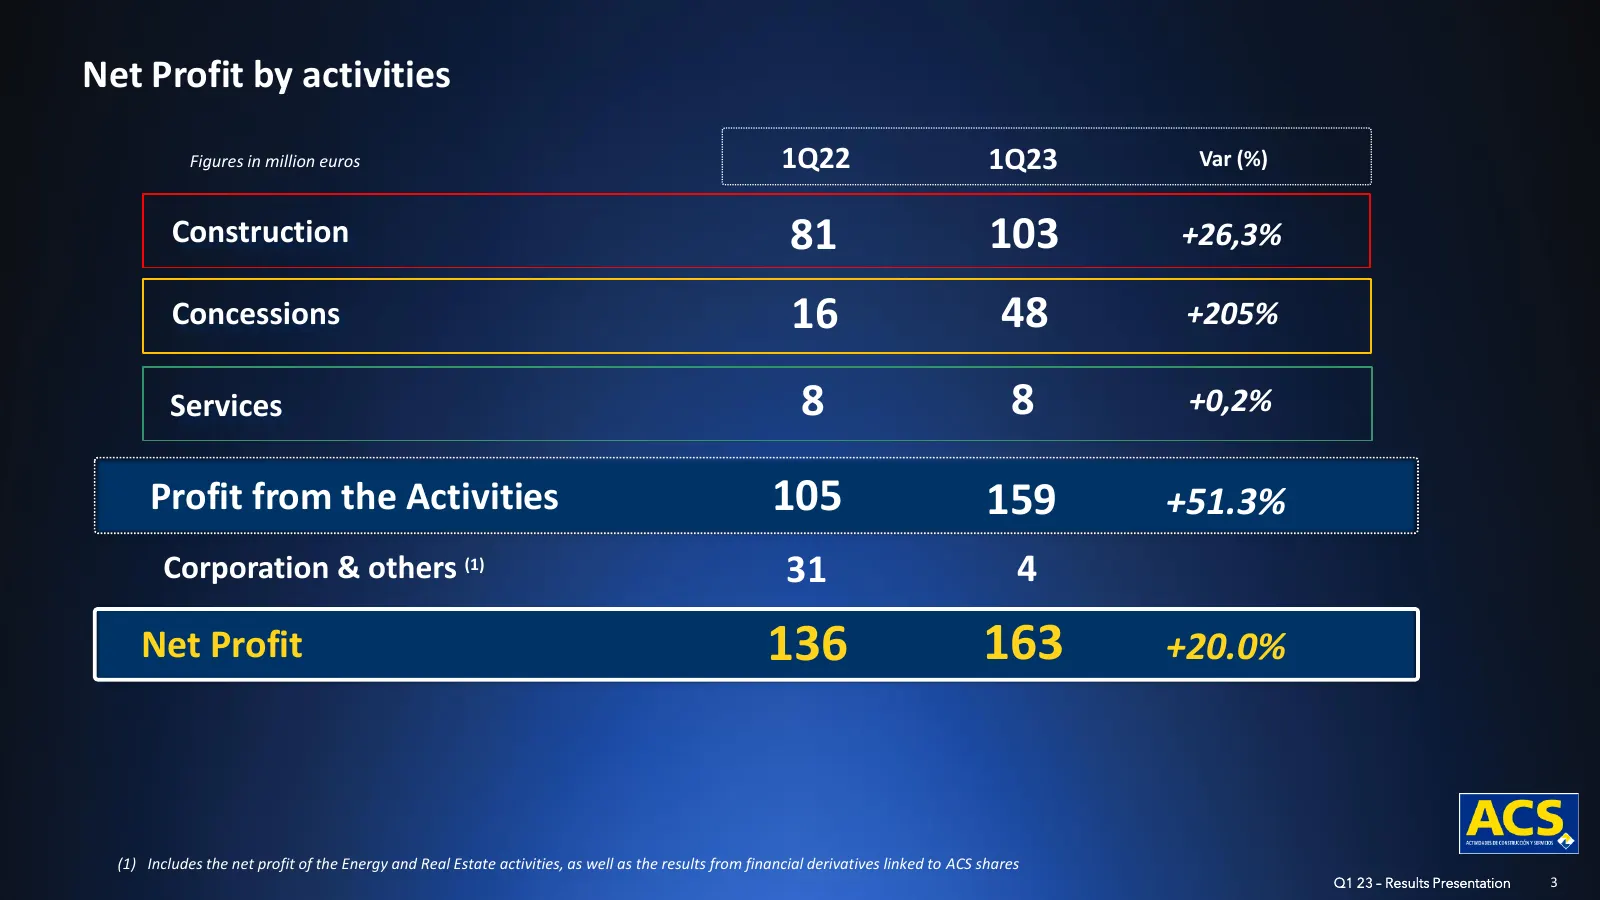
Slide 3: Net Profit by activities
Net Profit by activities Figures in million euros 1Q22 1Q23 Var (%) Construction 81 103 +26,3% Concessions 16 48 +205% Services 8 8 +0,2% Profit from the Activities 105 159 +51.3% Corporation & others (1) 31 4 Net Profit 136 163 +20.0% (1) Includes the net profit of the Energy and Real Estate activi
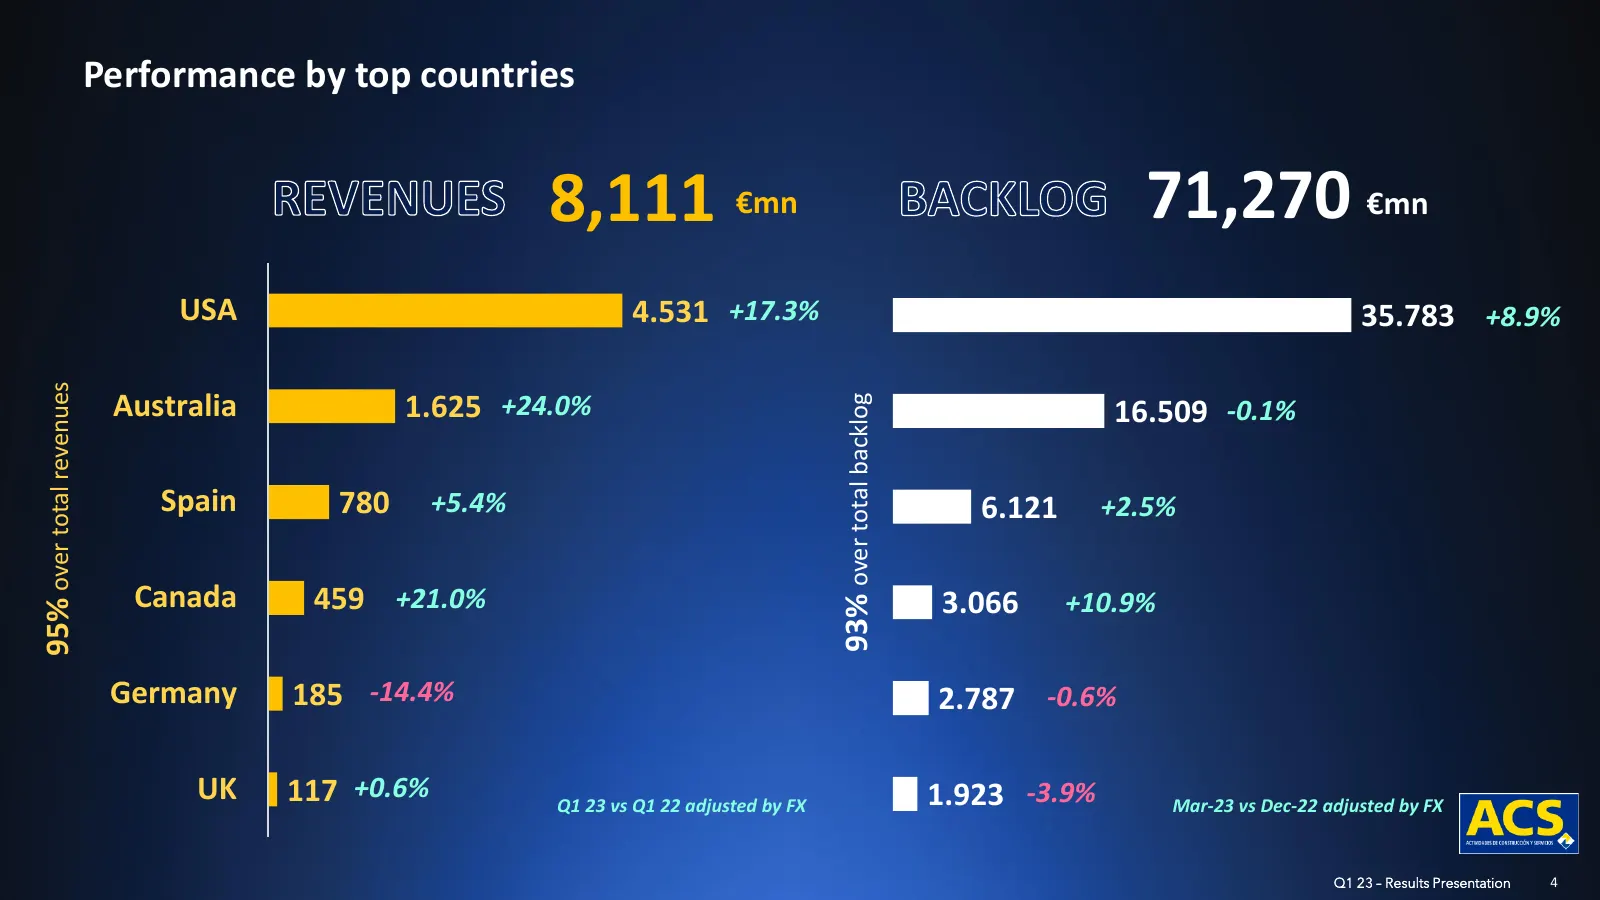
Slide 4: Performance by top countries
Performance by top countries 8,111 €mn 71,270 €mn USA 4.531 +17.3% 35.783 +8.9% 95% over total revenues Australia 1.625 +24.0% 93% over total backlog 16.509 -0.1% Spain 780 +5.4% 6.121 +2.5% Canada 459 +21.0% 3.066 +10.9% Germany 185 -14.4% 2.787 -0.6% UK 117 +0.6% Q1 23 vs Q1 22 adjusted by FX 1.92
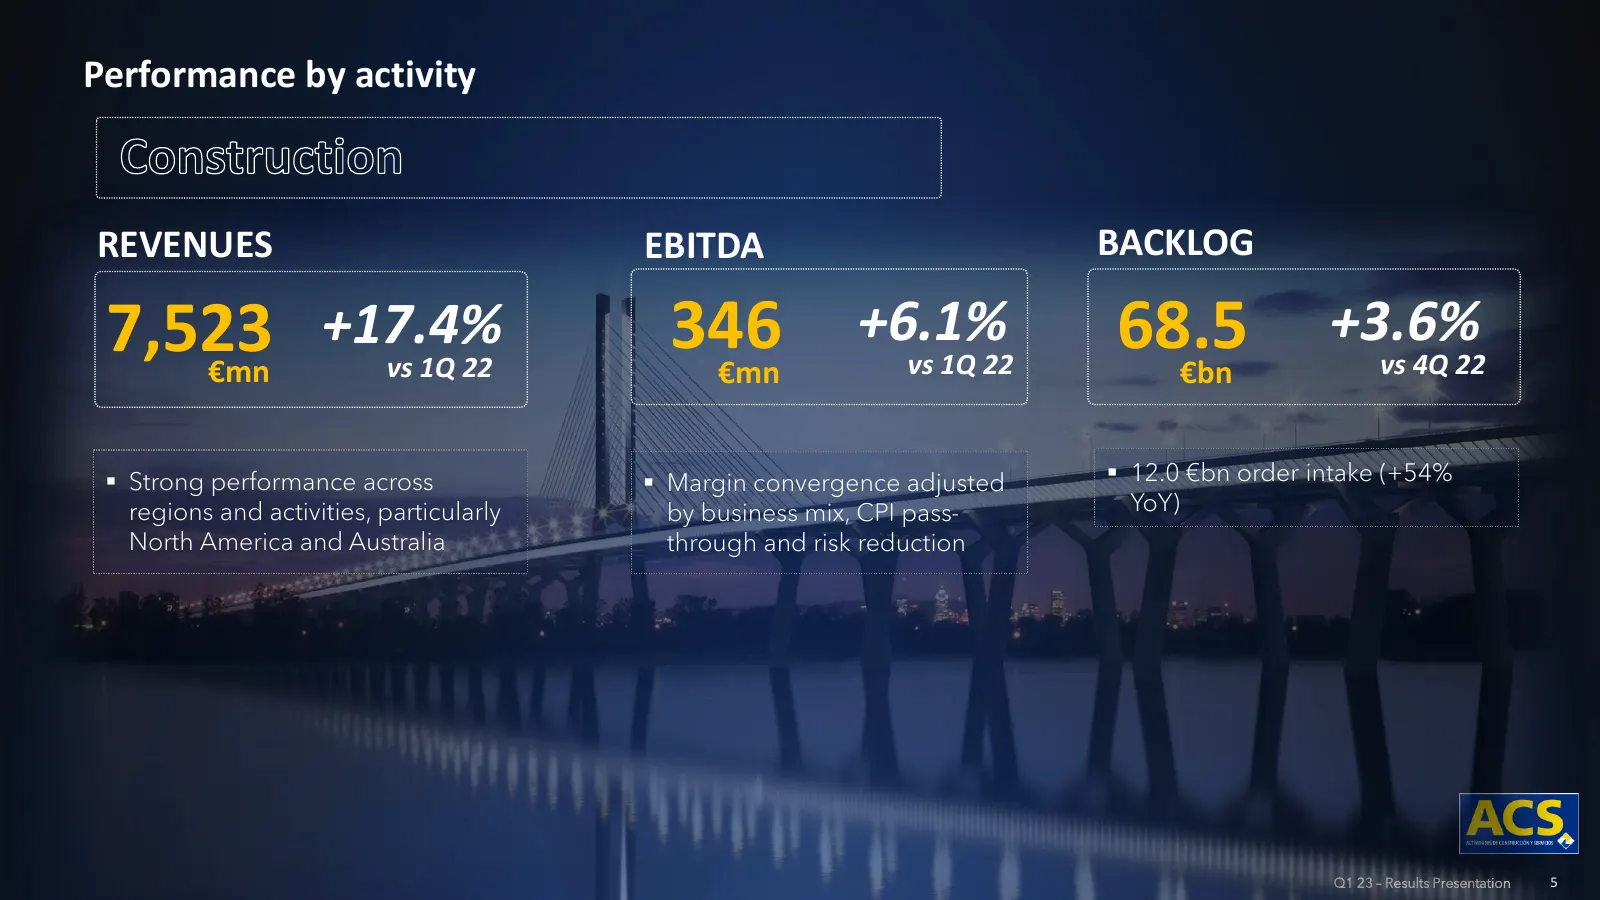
Slide 5: Performance by activity: Construction
Performance by activity REVENUES EBITDA BACKLOG 7,523 €mn +17.4% vs 1Q 22 346 €mn +6.1% vs 1Q 22 68.5 €bn +3.6% vs 4Q 22 ▪ Strong performance across ▪ Margin convergence adjusted ▪ 12.0 €bn order intake (+54% regions and activities, particularly by business mix, CPI pass- YoY) North America and Aust
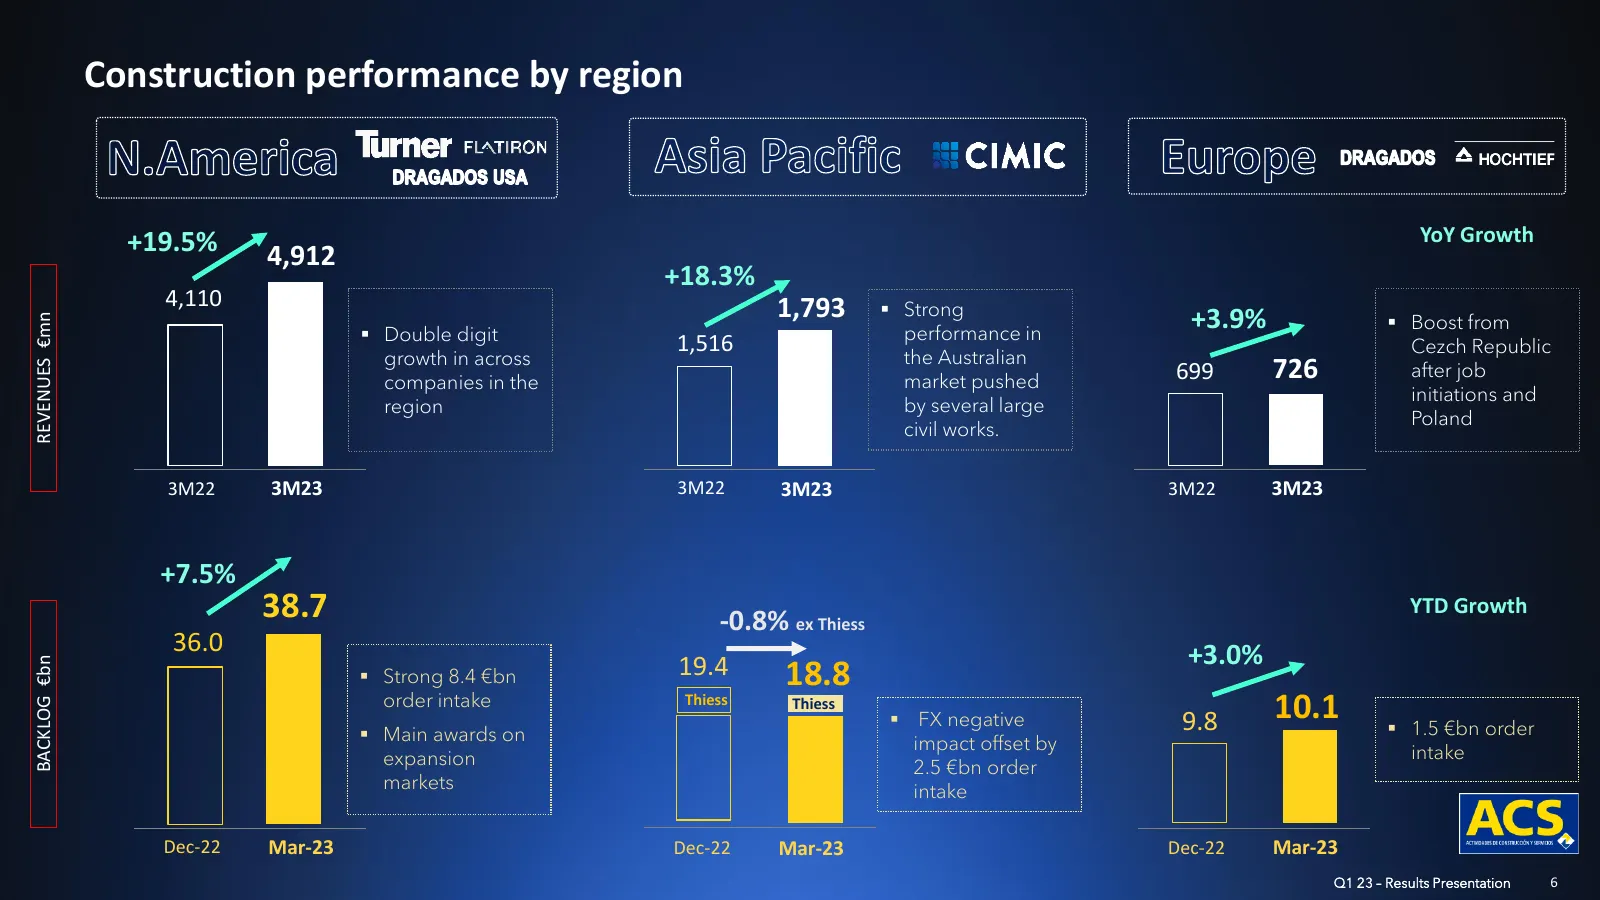
Slide 6: Construction performance by region
Construction performance by region +19.5% YoY Growth 4,912 +18.3% 4,110 1,793 ▪ Strong +3.9% ▪ Boost from REVENUES €mn ▪ Double digit performance in 1,516 Cezch Republic growth in across the Australian companies in the market pushed 699 726 after job initiations and region by several large Poland ci
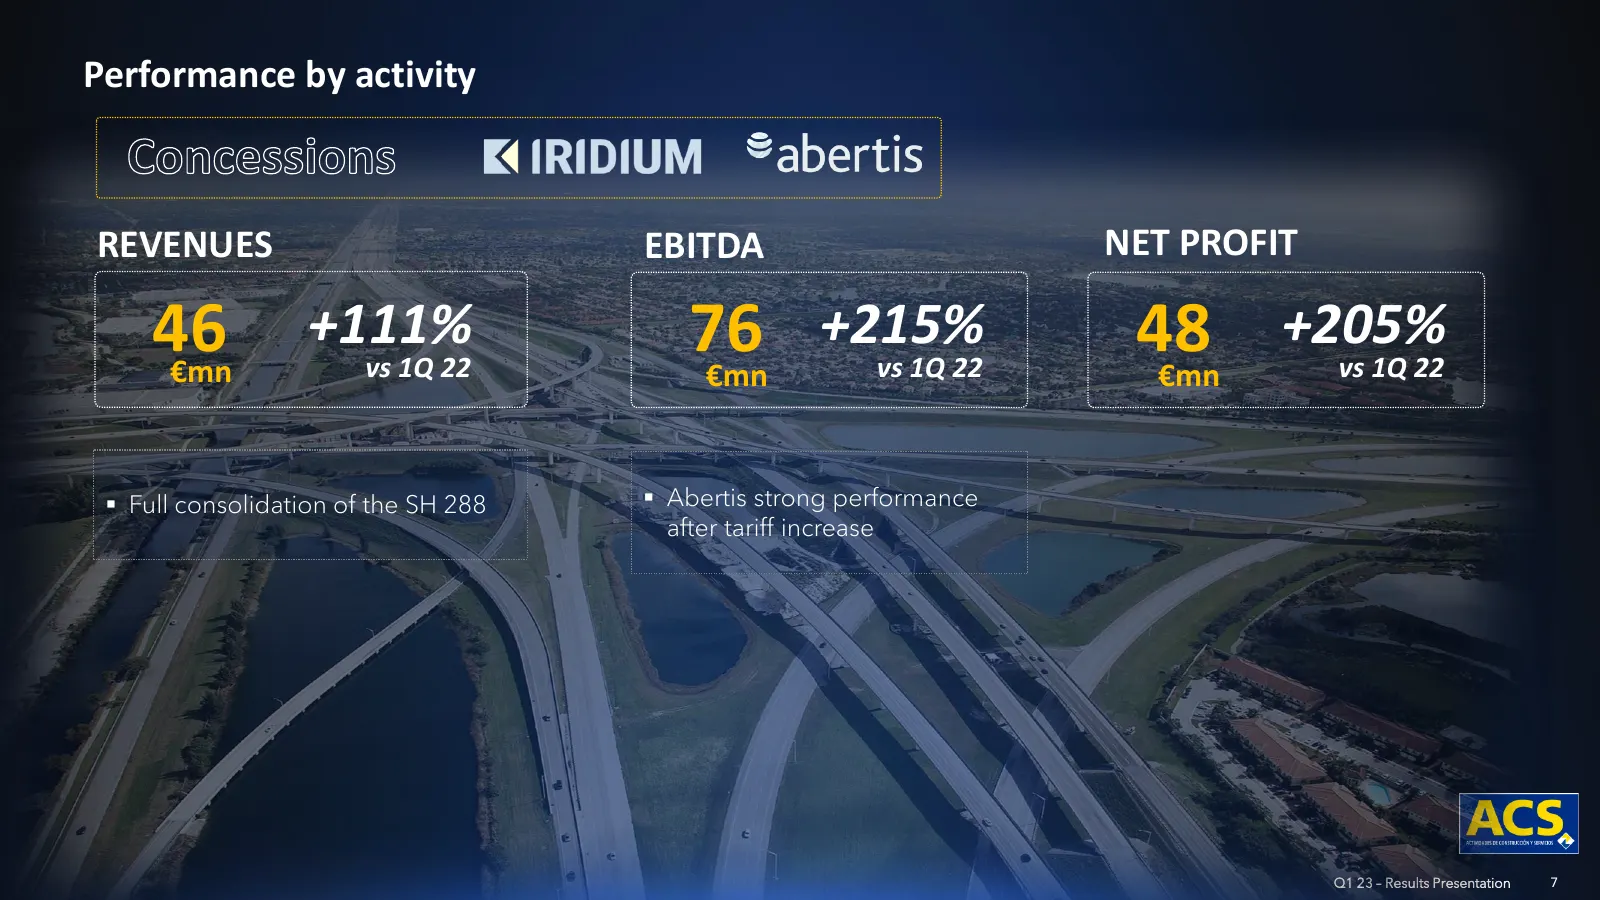
Slide 7: Performance by activity: Concessions
Performance by activity REVENUES EBITDA NET PROFIT 46 €mn +111% vs 1Q 22 76 €mn +215% vs 1Q 22 48 €mn +205% vs 1Q 22 ▪ Full consolidation of the SH 288 ▪ Abertis strong performance after tariff increase Q1 23 – Results Presentation 7
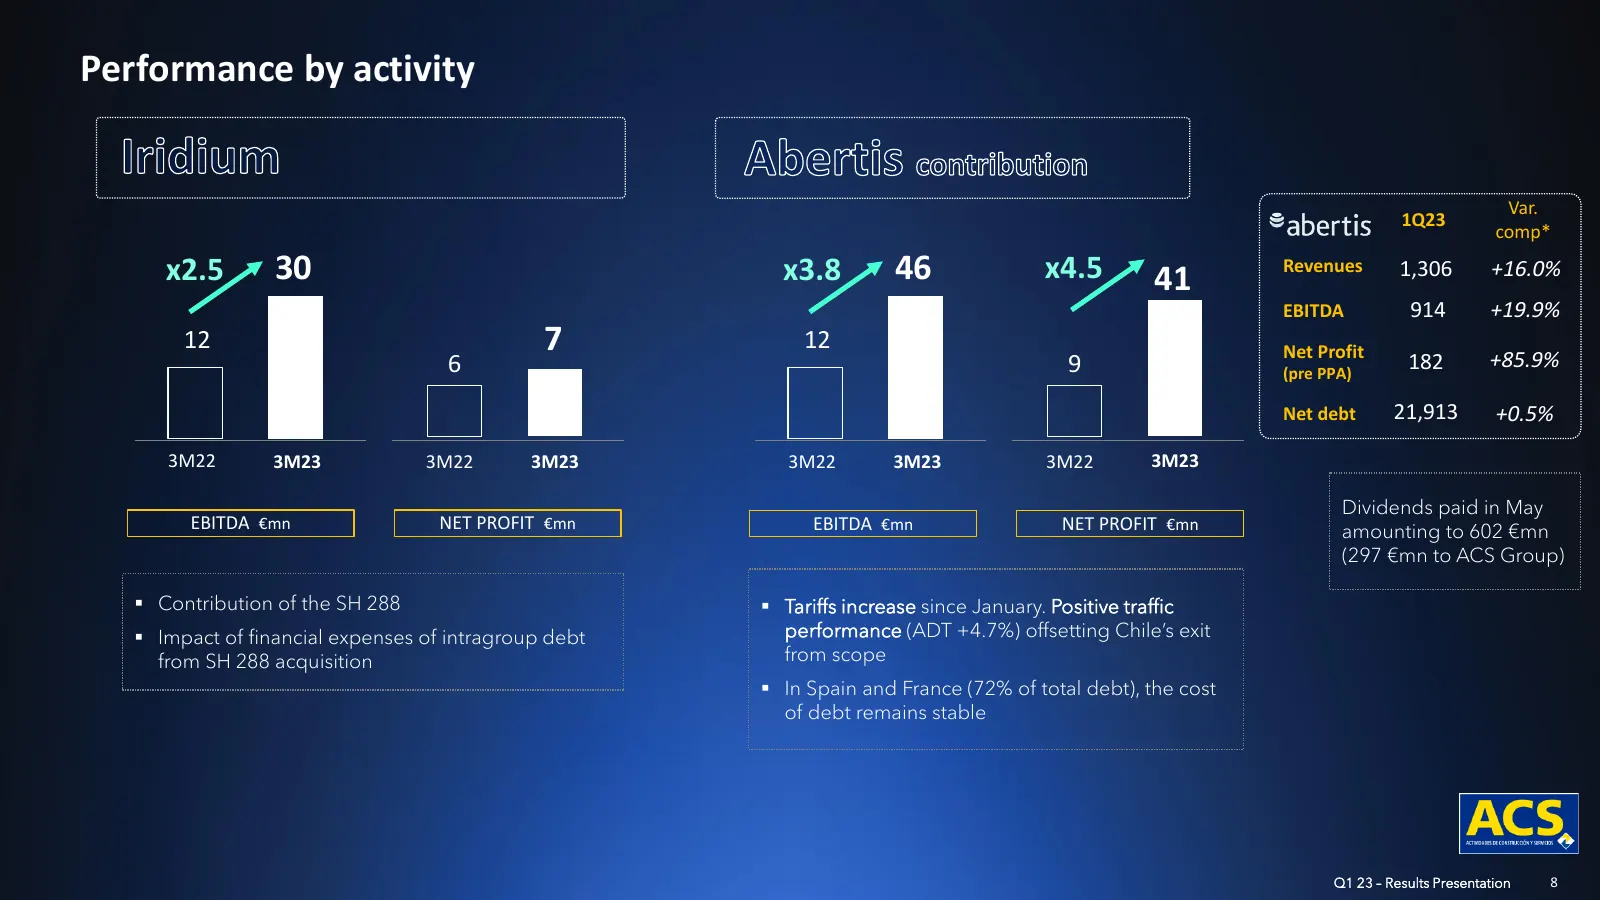
Slide 8: Performance by activity: Abertis and SH 288
Performance by activity Var. 1Q23 comp* x2.5 30 x3.8 46 x4.5 41 Revenues 1,306 +16.0% EBITDA 914 +19.9% 12 7 12 Net Profit +85.9% 6 9 (pre PPA) 182 Net debt 21,913 +0.5% 3M22 3M23 3M22 3M23 3M22 3M23 3M22 3M23 Dividends paid in May EBITDA €mn NET PROFIT €mn EBITDA €mn NET PROFIT €mn amounting to 602
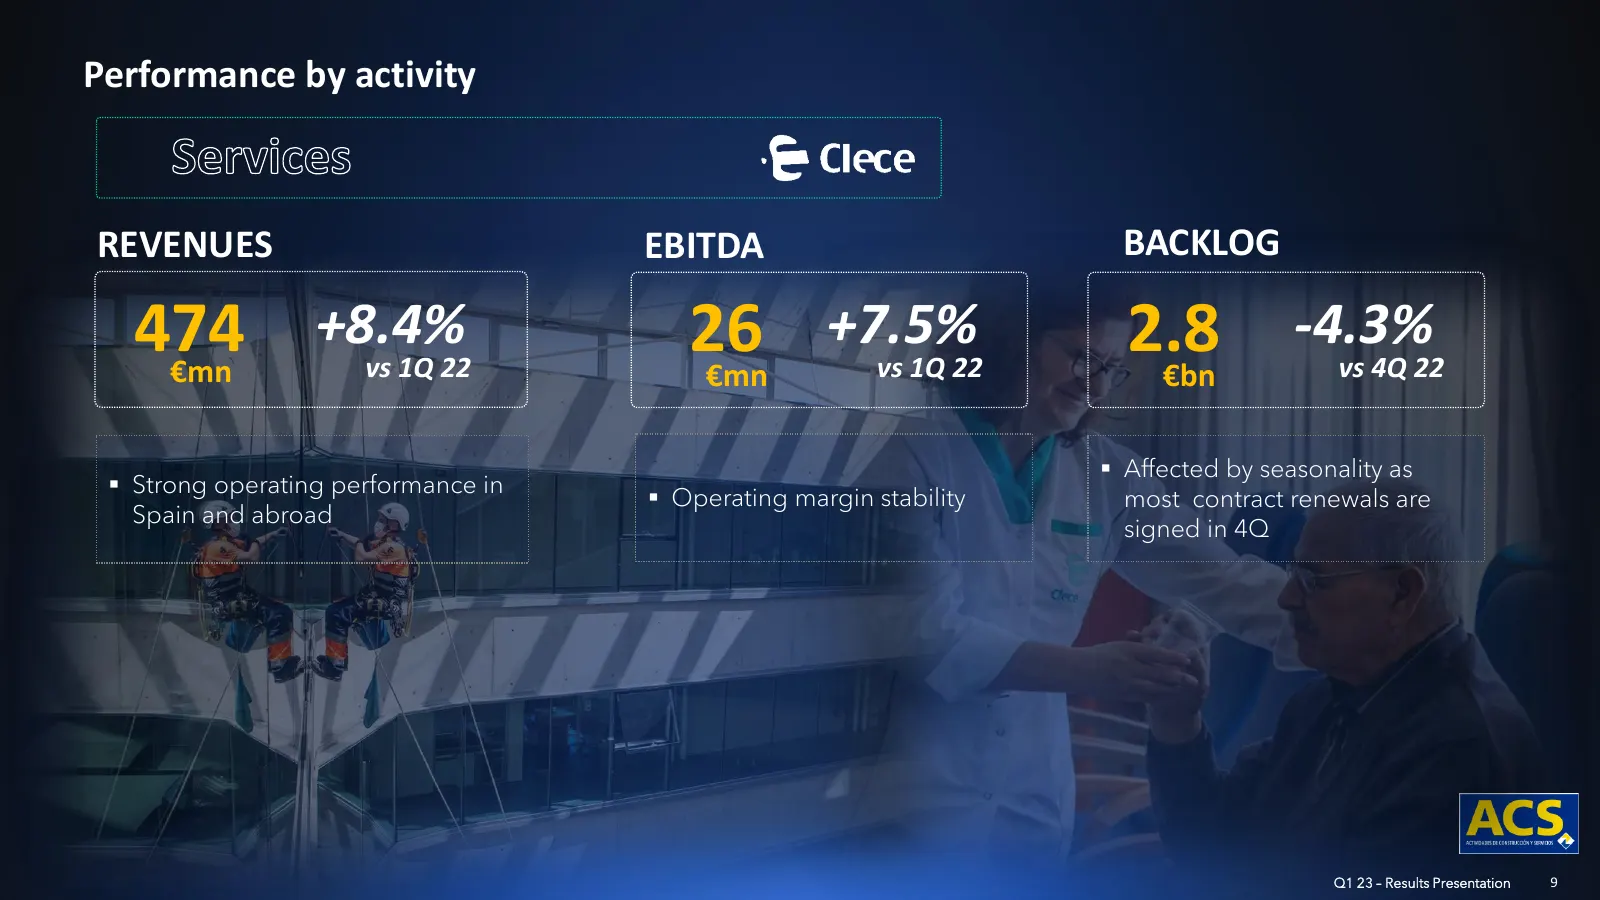
Slide 9: Performance by activity: Services
Performance by activity REVENUES EBITDA BACKLOG 474 €mn +8.4% vs 1Q 22 26 €mn +7.5% vs 1Q 22 2.8 €bn -4.3% vs 4Q 22 ▪ Affected by seasonality as ▪ Strong operating performance in ▪ Operating margin stability most contract renewals are Spain and abroad signed in 4Q Q1 23 – Results Presentation 9
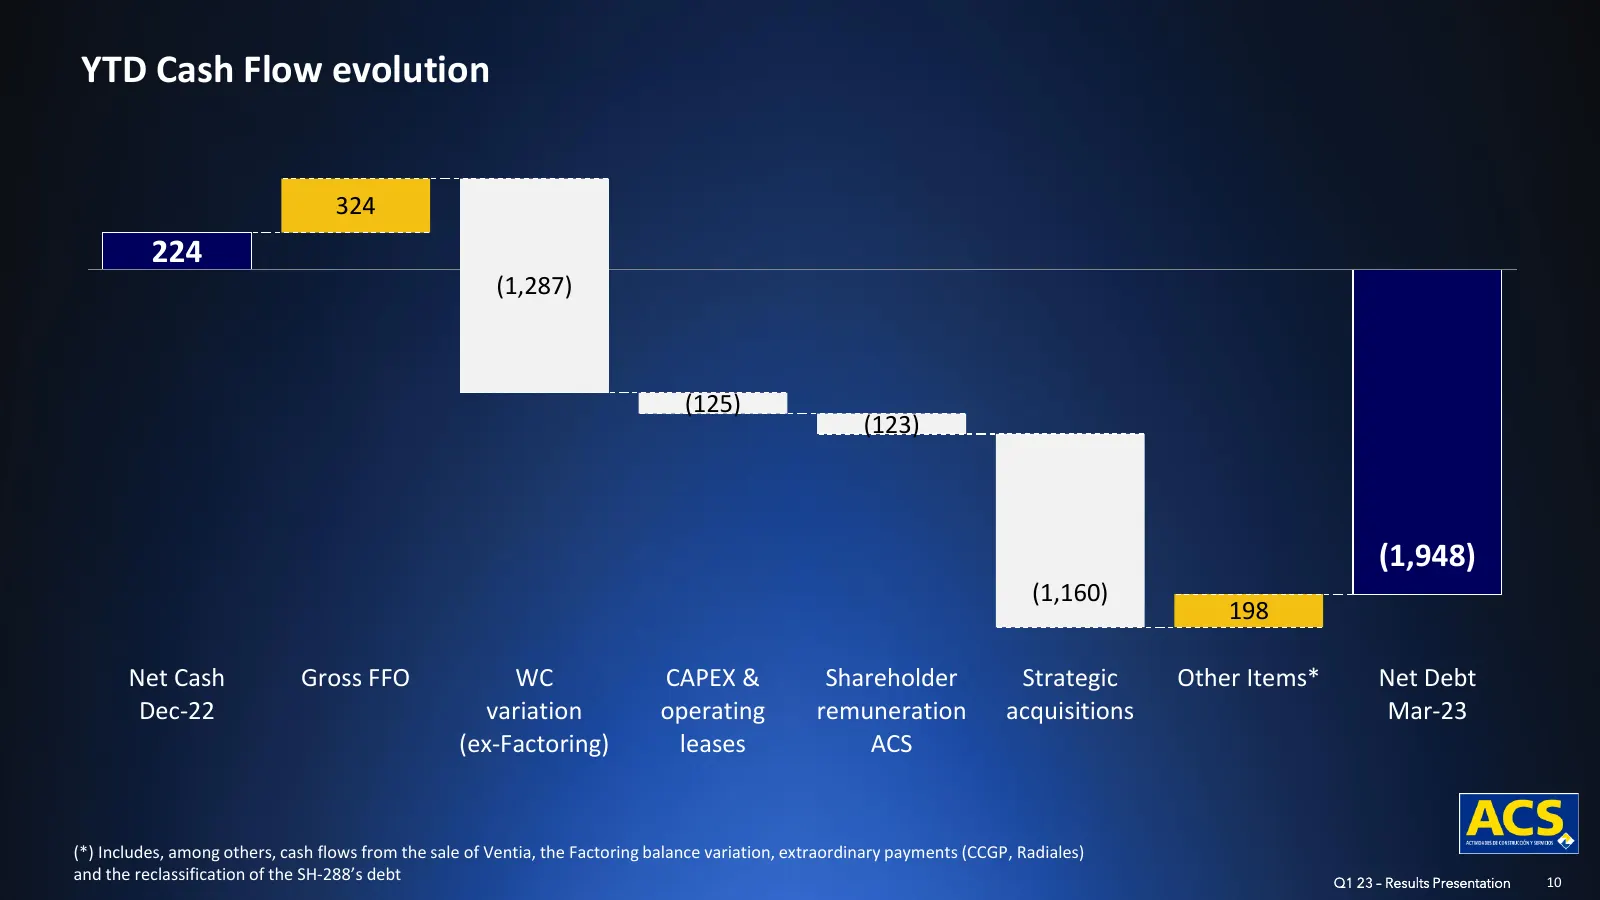
Slide 10: YTD Cash Flow evolution
YTD Cash Flow evolution 324 224 (1,287) (125) (123) (1,948) (1,160) 198 Net Cash Gross FFO WC CAPEX & Shareholder Strategic Other Items* Net Debt Dec-22 variation operating remuneration acquisitions Mar-23 (ex-Factoring) leases ACS (*) Includes, among others, cash flows from the sale of Ventia, the
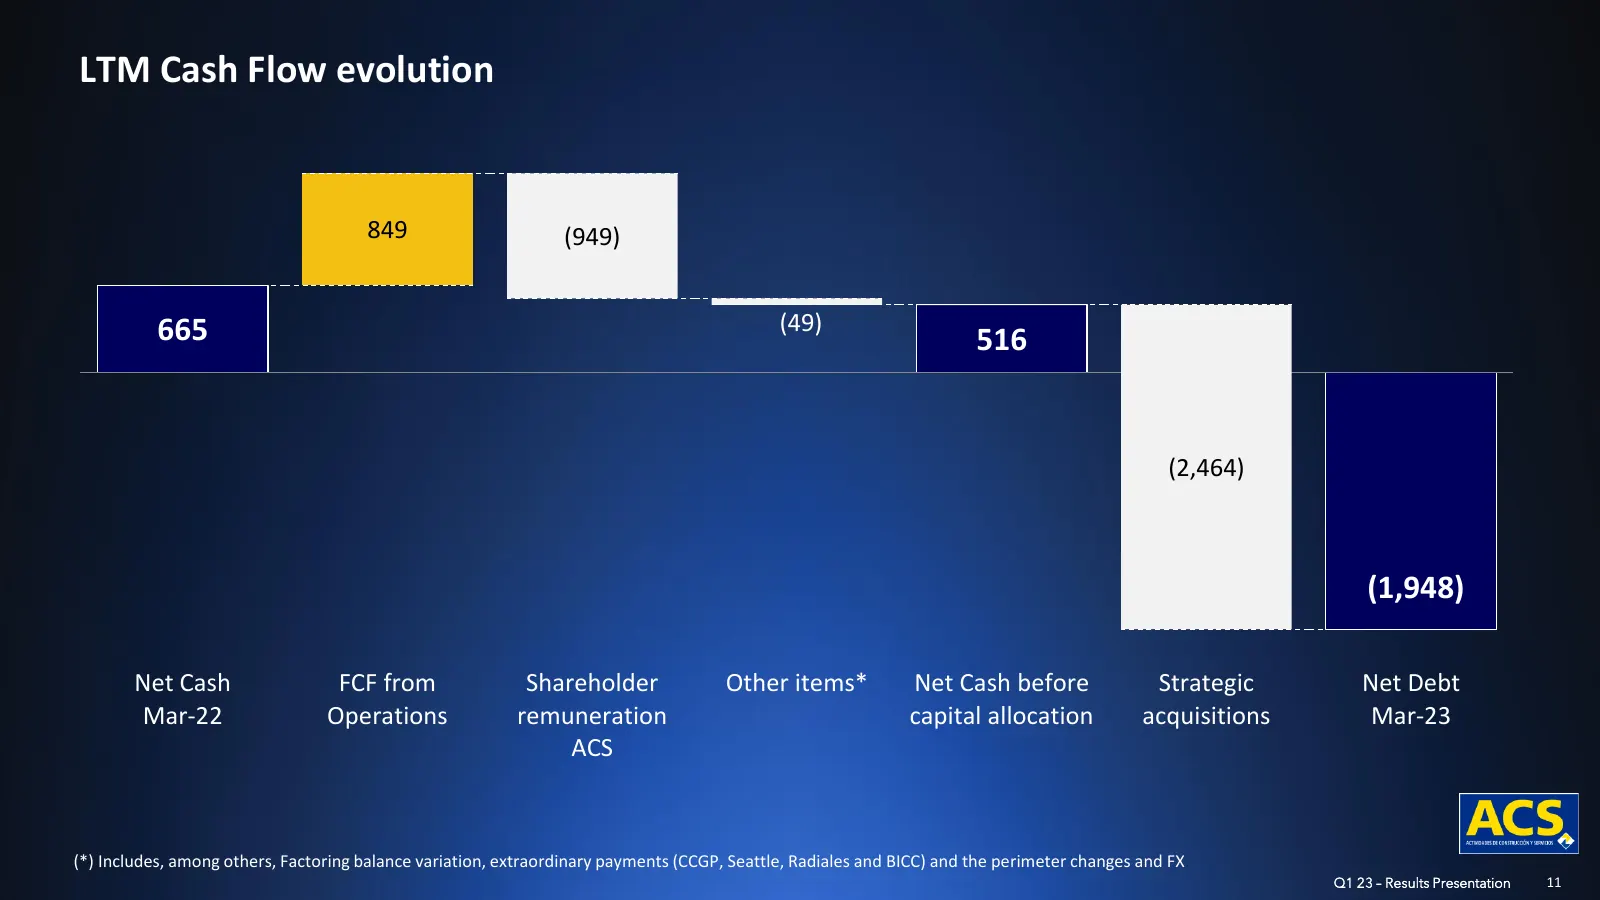
Slide 11: LTM Cash Flow evolution
LTM Cash Flow evolution 849 (949) 665 (49) 516 (2,464) (1,948) Net Cash FCF from Shareholder Other items* Net Cash before Strategic Net Debt Mar-22 Operations remuneration capital allocation acquisitions Mar-23 ACS (*) Includes, among others, Factoring balance variation, extraordinary payments (CCGP
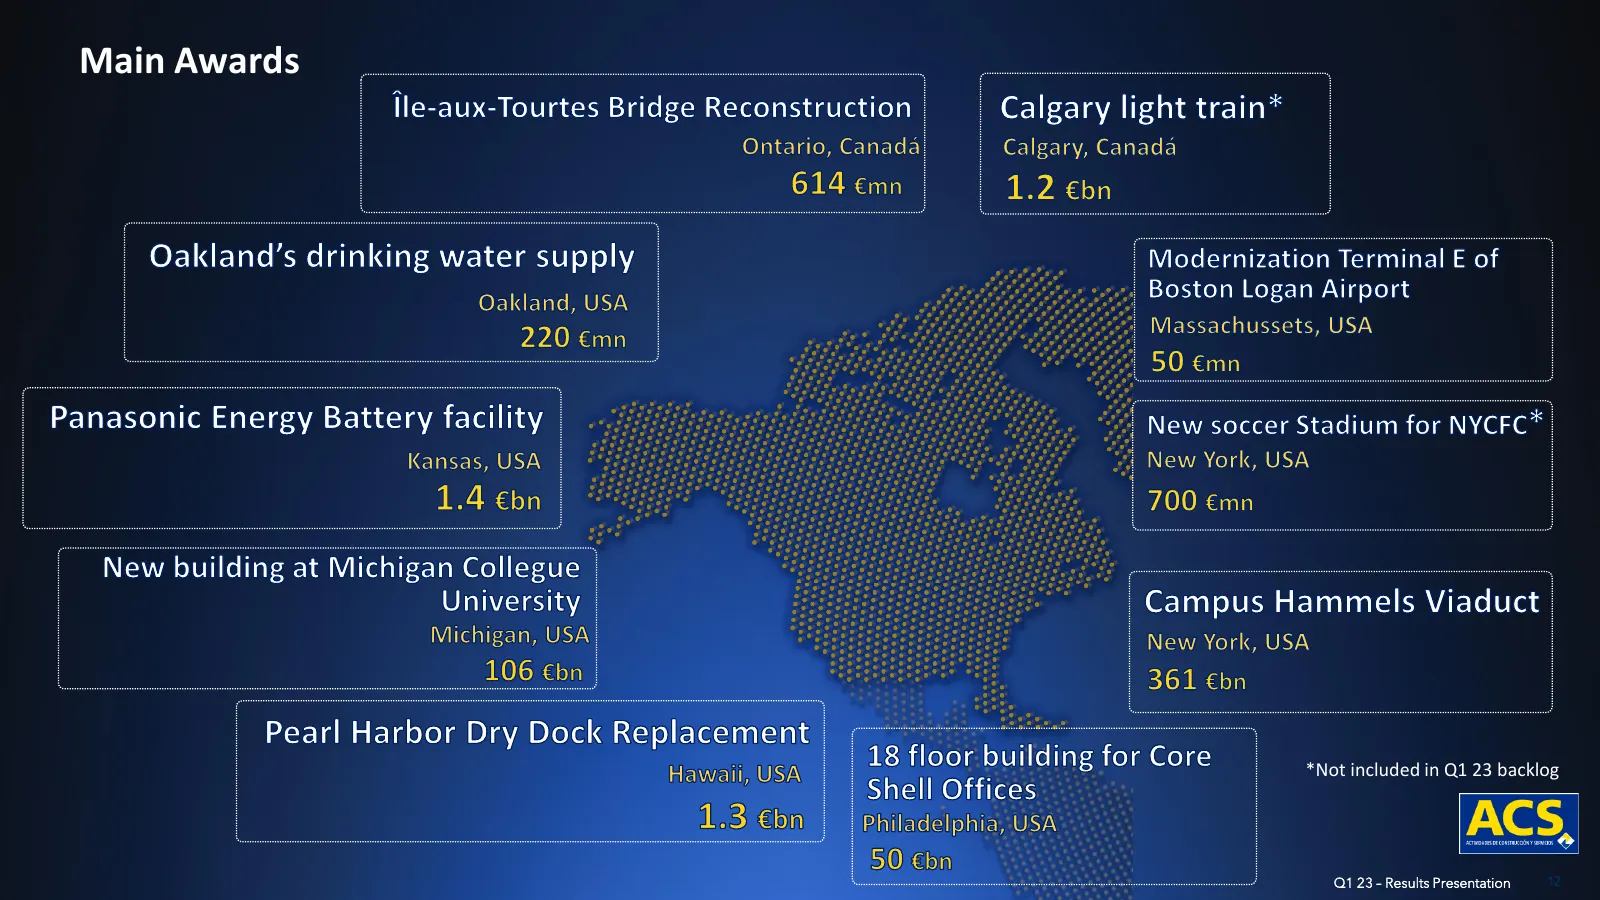
Slide 12: Main Awards
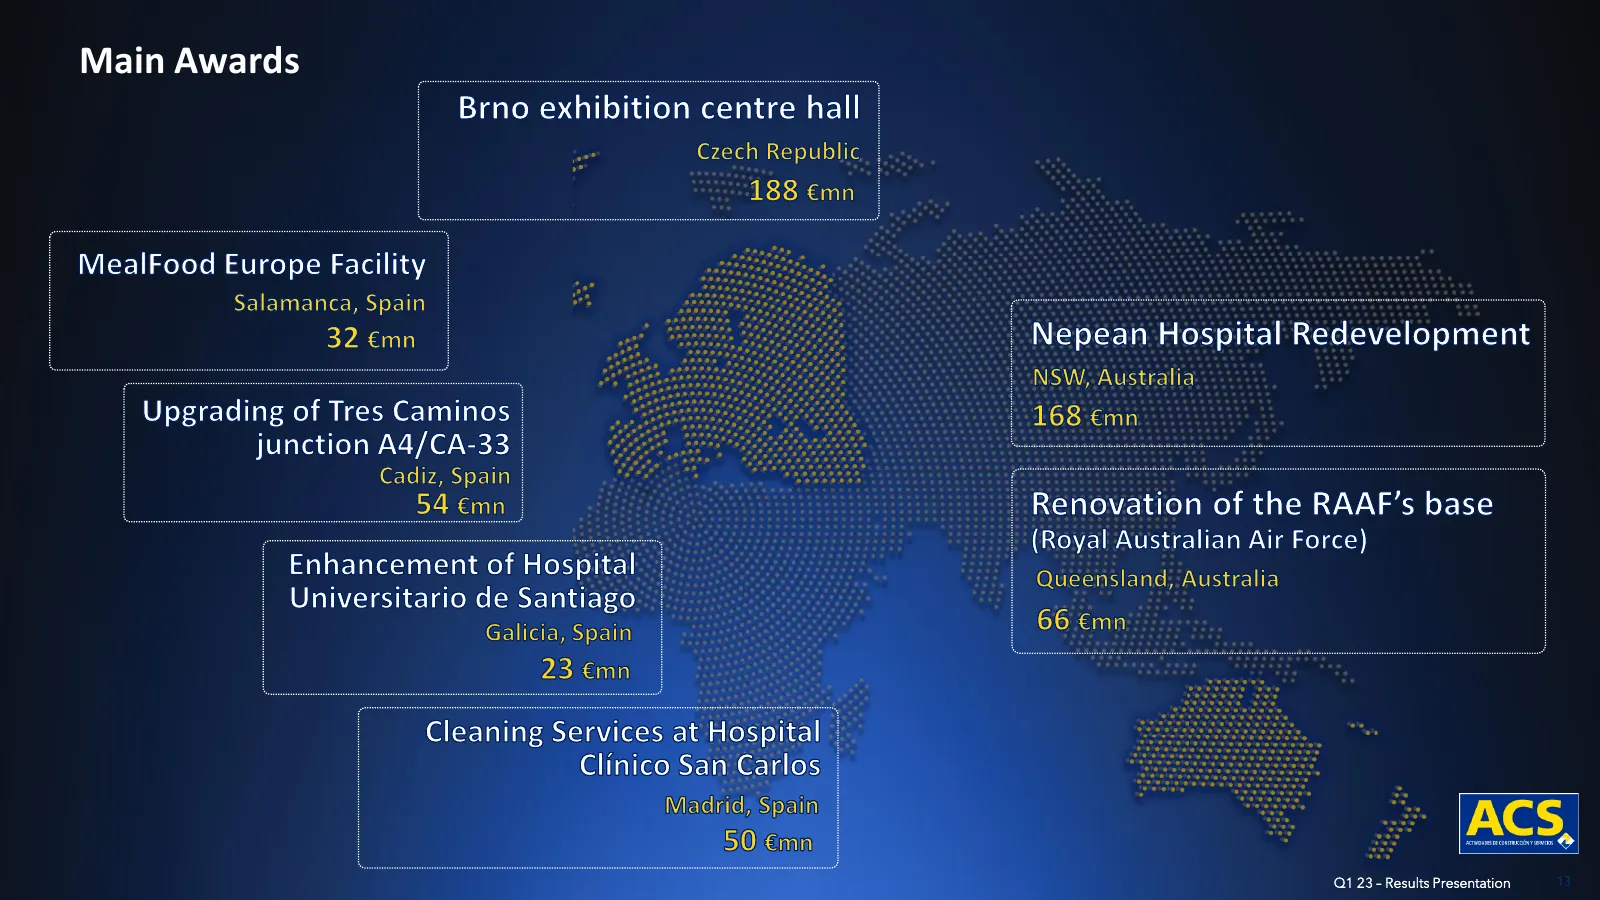
Main Awards *Not included in Q1 23 backlog Q1 23 – Results Presentation 12
Slide 13: Main Awards
Main Awards Q1 23 – Results Presentation 13
Slide 14: Conclusions
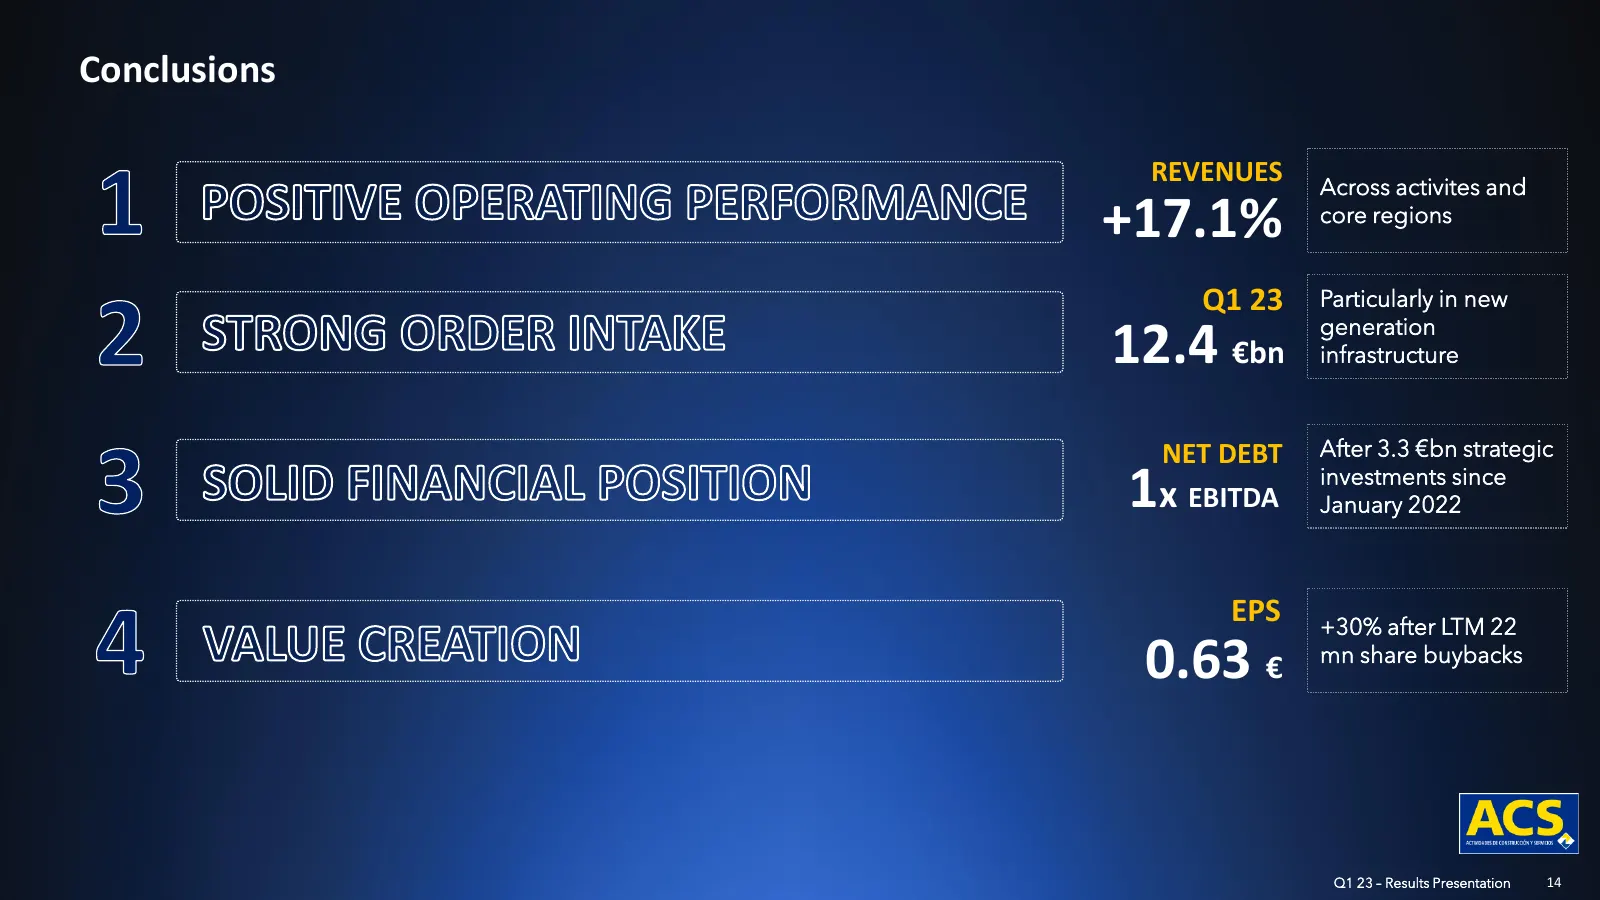
Conclusions REVENUES Across activites and +17.1% core regions Q1 23 Particularly in new generation 12.4 €bn infrastructure NET DEBT After 3.3 €bn strategic investments since 1 x EBITDA January 2022 EPS +30% after LTM 22 0.63 € mn share buybacks Q1 23 – Results Presentation 14
Slide 15: Legal Disclaimer
WIP Legal Disclaimer This document contains forward-looking statements on the intentions. expectations or forecasts of Grupo ACS or its management at the time the document was drawn up and in reference to various matters including. among others. its customer base. its performance. the foreseeable gr
Source: Internet Archive copy of grupoacs.com
More decks from ACS, Actividades de Construccion y Servicios SA
 Investor Day (November 2026)177 slides · Nov 12, 2026
 Investor Day (November 2026)104 slides · Nov 12, 2026
 Investor Day (November 2026)14 slides · Nov 12, 2026
 Investor Day (November 2026)17 slides · Nov 12, 2026
 Investor Day (November 2026)13 slides · Nov 12, 2026
 Investor Day (November 2026)17 slides · Nov 12, 2026
All 139 ACS, Actividades de Construccion y Servicios SA decks