Aspen Insurance Holdings Ltd · NYSE:AHL/PE
Aspen Insurance — Q1 2015 Earnings Presentation
19 slides from Aspen Insurance's earnings presentation, Apr 22, 2015
Slide 1: Aspen Insurance Holdings Limited Investor Presentation First Quarter 2015
Aspen Insurance Holdings Limited INVESTOR PRESENTATION FIRST QUARTER 2015
Slide 2: Safe Harbor and Non-GAAP Financial Measures
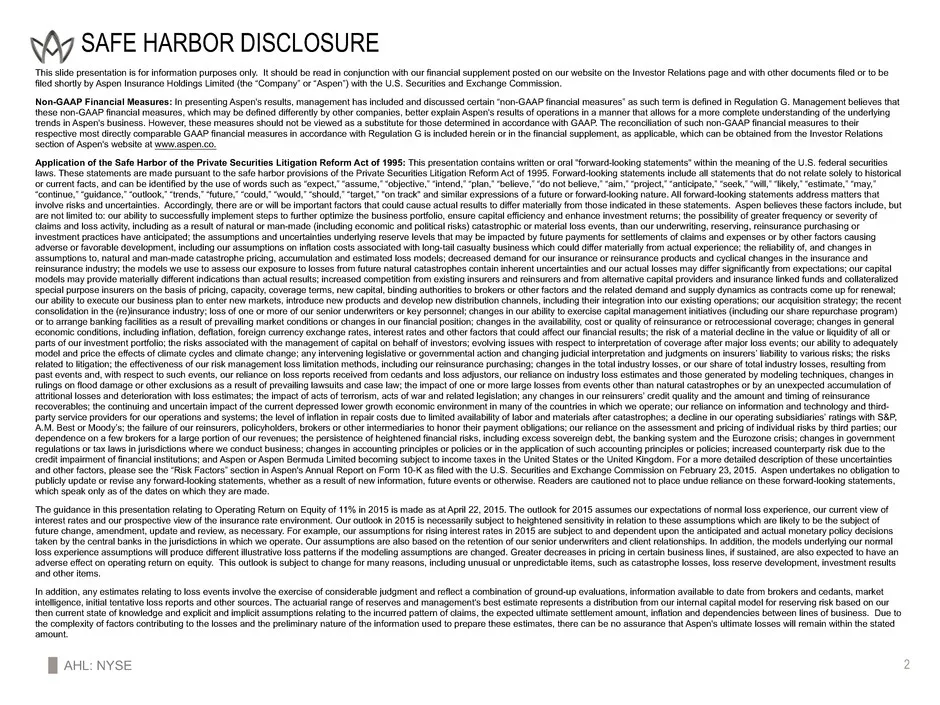
AHL: NYSE 2 This slide presentation is for information purposes only. It should be read in conjunction with our financial supplement posted on our website on the Investor Relations page and with other documents filed or to be filed shortly by Aspen Insurance Holdings Limited (the “Company” or “Aspen
Slide 3: Contents
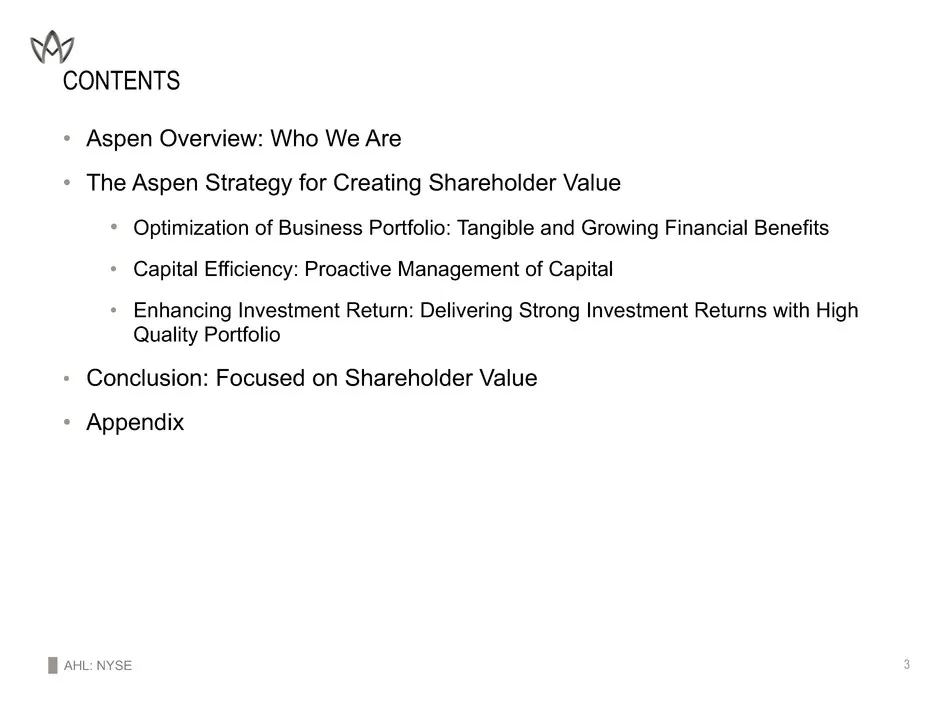
AHL: NYSE 3 CONTENTS • Aspen Overview: Who We Are • The Aspen Strategy for Creating Shareholder Value • Optimization of Business Portfolio: Tangible and Growing Financial Benefits • Capital Efficiency: Proactive Management of Capital • Enhancing Investment Return: Delivering Strong Investment Return
Slide 4: Aspen Overview: Who We Are
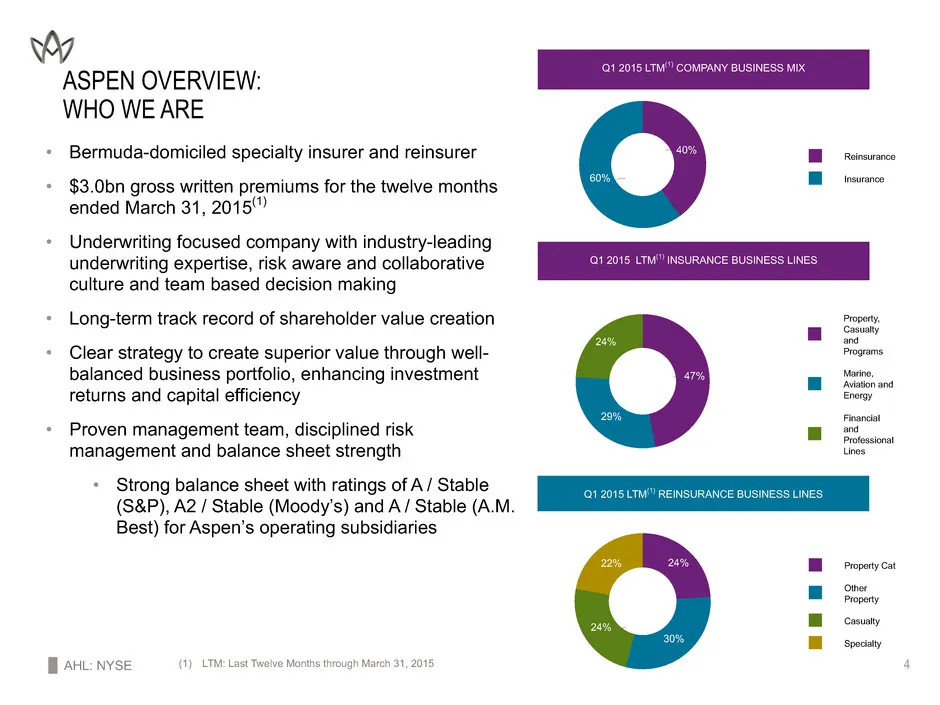
AHL: NYSE 4 Property Cat Other Property Casualty Specialty 24% 30% 24% 22% Property, Casualty and Programs Marine, Aviation and Energy Financial and Professional Lines 47% 29% 24% Reinsurance Insurance 40% 60% ASPEN OVERVIEW: WHO WE ARE • Bermuda-domiciled specialty insurer and reinsurer • $3.0bn gr
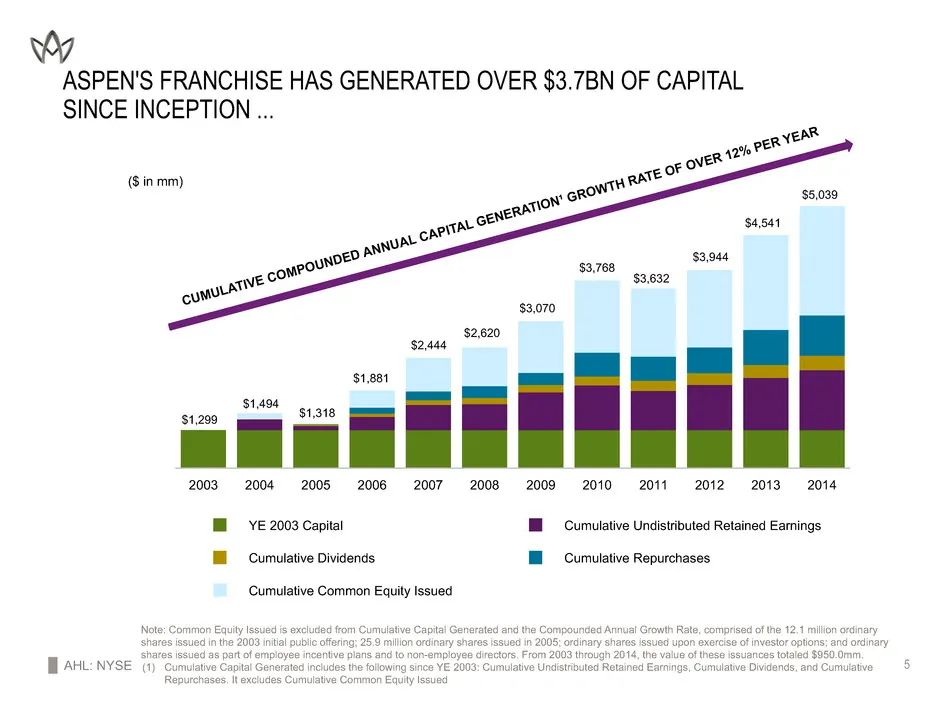
Slide 5: Aspen's franchise has generated over $3.7bn of capital since inception
AHL: NYSE 5 ASPEN'S FRANCHISE HAS GENERATED OVER $3.7BN OF CAPITAL SINCE INCEPTION ... YE 2003 Capital Cumulative Undistributed Retained Earnings Cumulative Dividends Cumulative Repurchases Cumulative Common Equity Issued 2003 2004 2005 2006 2007 2008 2009 2010 2011 2012 2013 2014 Note: Common Equit
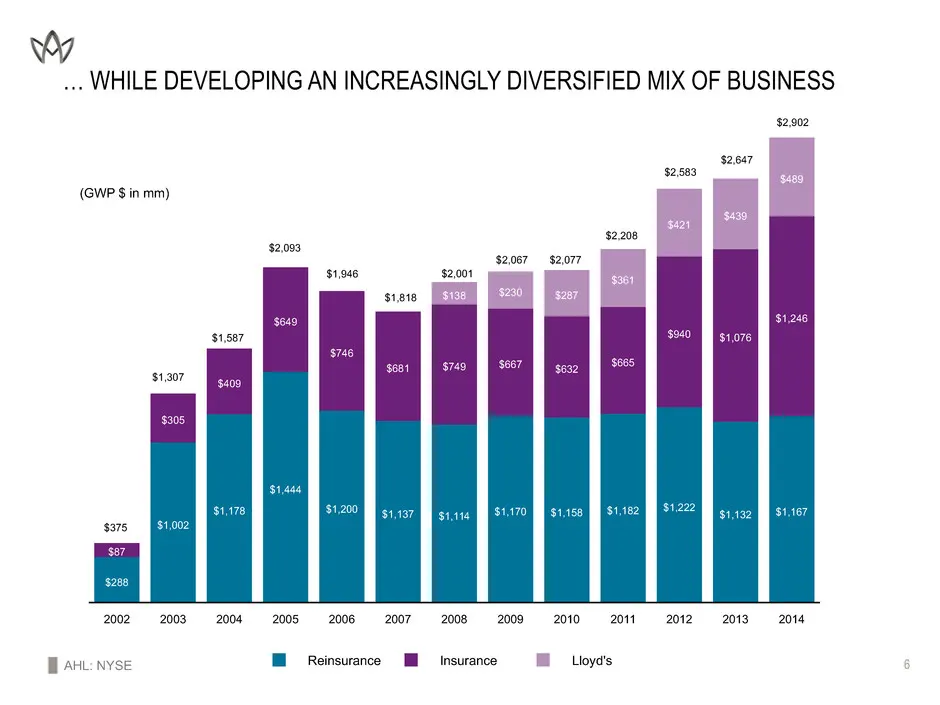
Slide 6: Developing an increasingly diversified mix of business
AHL: NYSE 6 … WHILE DEVELOPING AN INCREASINGLY DIVERSIFIED MIX OF BUSINESS Reinsurance Insurance Lloyd's 2002 2003 2004 2005 2006 2007 2008 2009 2010 2011 2012 2013 2014 $288 $1,002 $1,178 $1,444 $1,200 $1,137 $1,114 $1,170 $1,158 $1,182 $1,222 $1,132 $1,167 $87 $305 $409 $649 $746 $681 $749 $667 $6
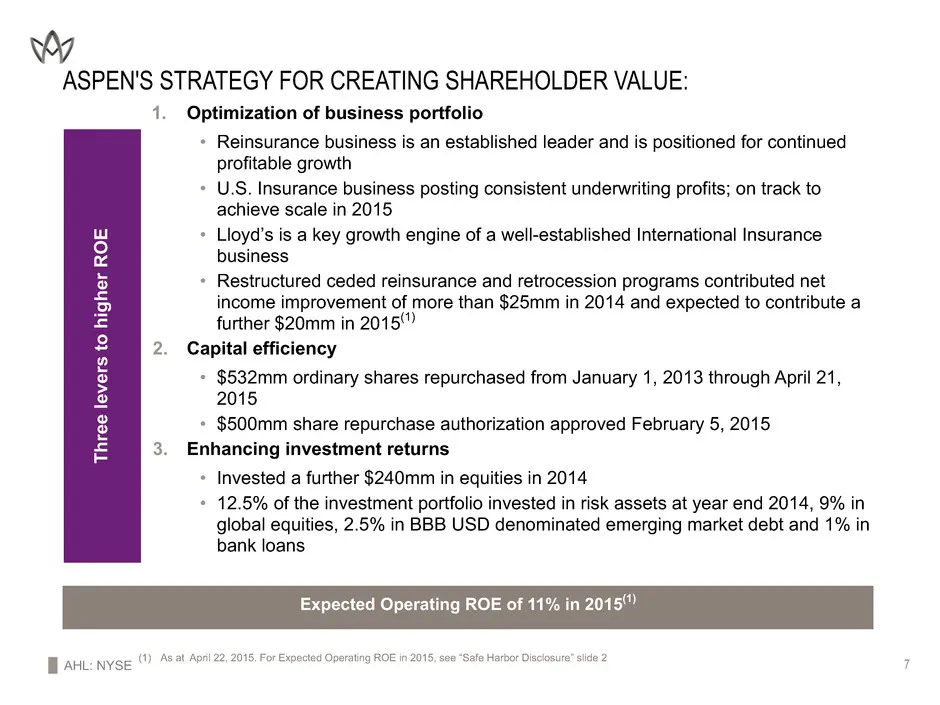
Slide 7: Aspen's Strategy for Creating Shareholder Value
AHL: NYSE 7 ASPEN'S STRATEGY FOR CREATING SHAREHOLDER VALUE: 1. Optimization of business portfolio • Reinsurance business is an established leader and is positioned for continued profitable growth • U.S. Insurance business posting consistent underwriting profits; on track to achieve scale in 2015 •
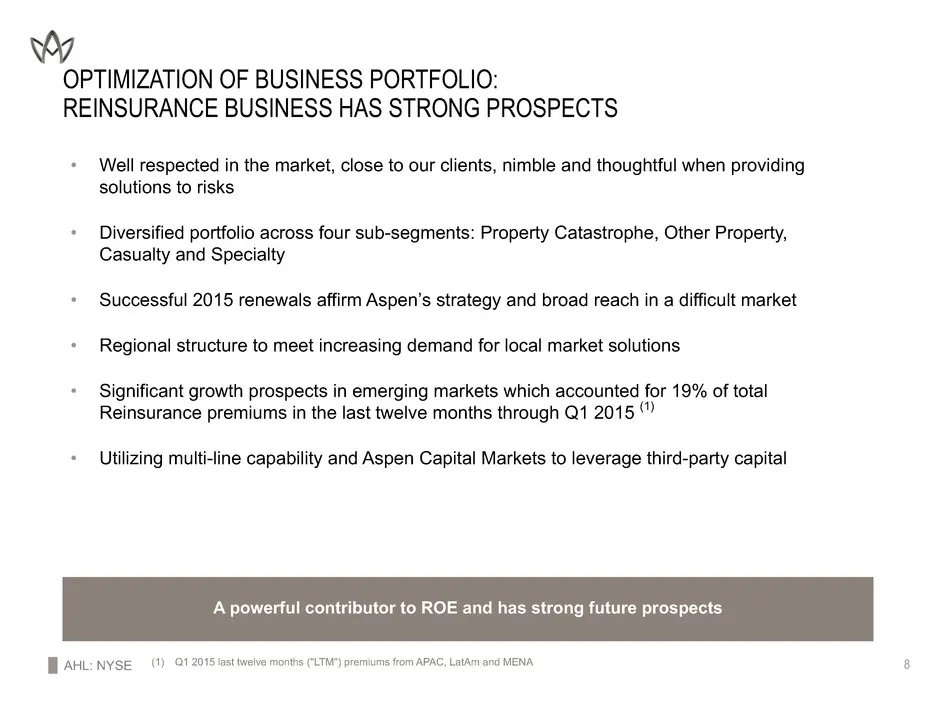
Slide 8: Optimization of Business Portfolio: Reinsurance Business Has Strong Prospects
AHL: NYSE 8 OPTIMIZATION OF BUSINESS PORTFOLIO: REINSURANCE BUSINESS HAS STRONG PROSPECTS • Well respected in the market, close to our clients, nimble and thoughtful when providing solutions to risks • Diversified portfolio across four sub-segments: Property Catastrophe, Other Property, Casualty and
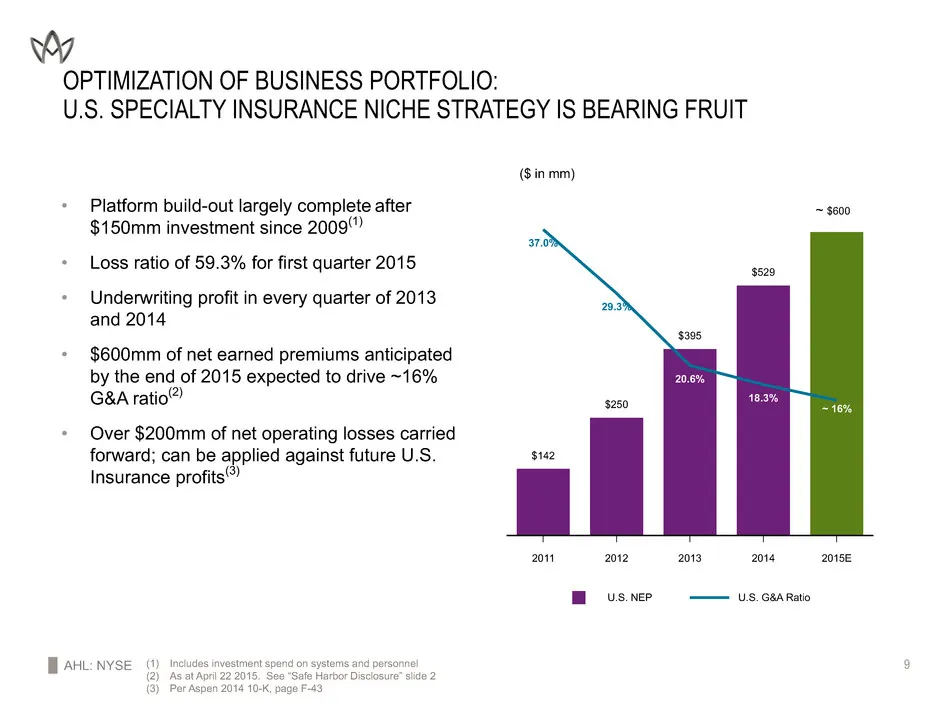
Slide 9: Optimization of Business Portfolio: U.S. Specialty Insurance Niche Strategy Is Bearing Fruit
AHL: NYSE 9 OPTIMIZATION OF BUSINESS PORTFOLIO: U.S. SPECIALTY INSURANCE NICHE STRATEGY IS BEARING FRUIT (1) Includes investment spend on systems and personnel (2) As at April 22 2015. See “Safe Harbor Disclosure” slide 2 (3) Per Aspen 2014 10-K, page F-43 ($ in mm) • Platform build-out largely comp
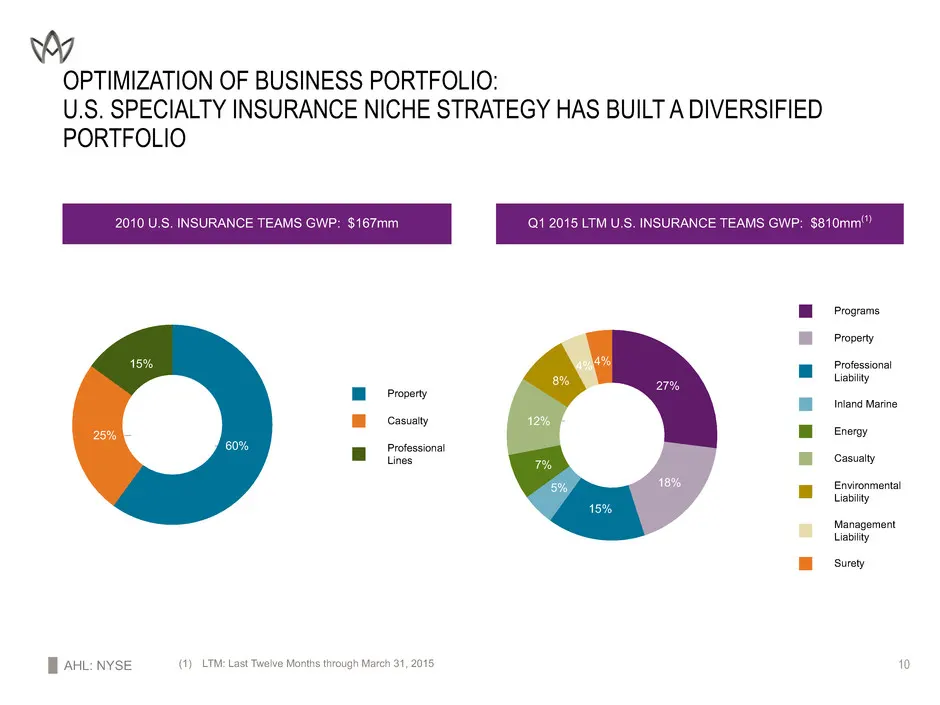
Slide 10: U.S. Specialty Insurance Niche Strategy Has Built a Diversified Portfolio
AHL: NYSE 10 OPTIMIZATION OF BUSINESS PORTFOLIO: U.S. SPECIALTY INSURANCE NICHE STRATEGY HAS BUILT A DIVERSIFIED PORTFOLIO 2010 U.S. INSURANCE TEAMS GWP: $167mm Q1 2015 LTM U.S. INSURANCE TEAMS GWP: $810mm(1) (1) LTM: Last Twelve Months through March 31, 2015 Property Casualty Professional Lines 60%
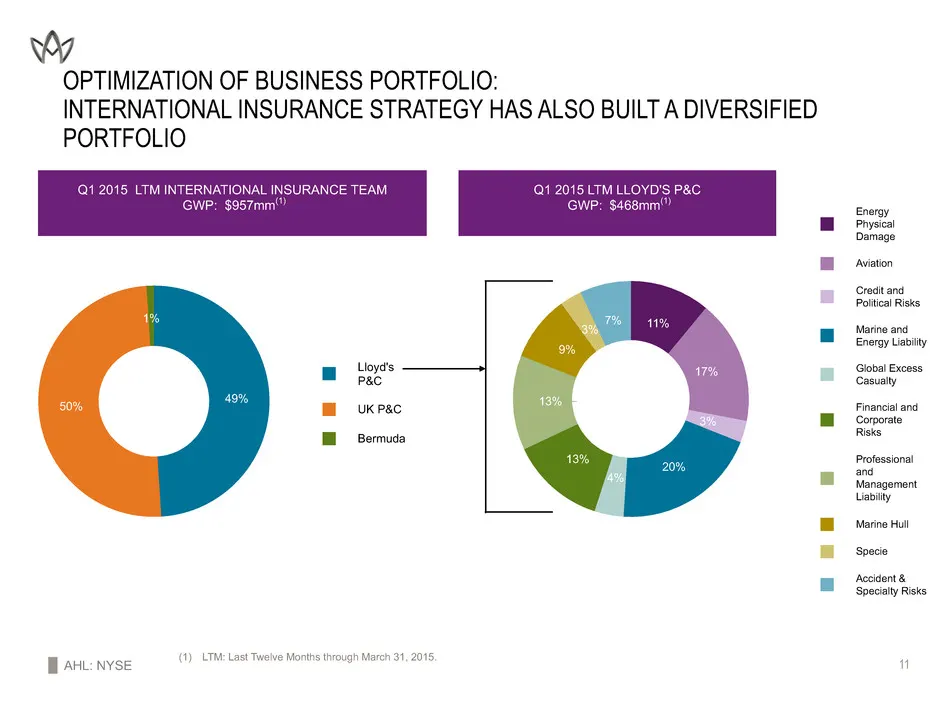
Slide 11: International Insurance Strategy Has Also Built a Diversified Portfolio
AHL: NYSE 11 OPTIMIZATION OF BUSINESS PORTFOLIO: INTERNATIONAL INSURANCE STRATEGY HAS ALSO BUILT A DIVERSIFIED PORTFOLIO Lloyd's P&C UK P&C Bermuda 49%50% 1% Energy Physical Damage Aviation Credit and Political Risks Marine and Energy Liability Global Excess Casualty Financial and Corporate Risks Pr
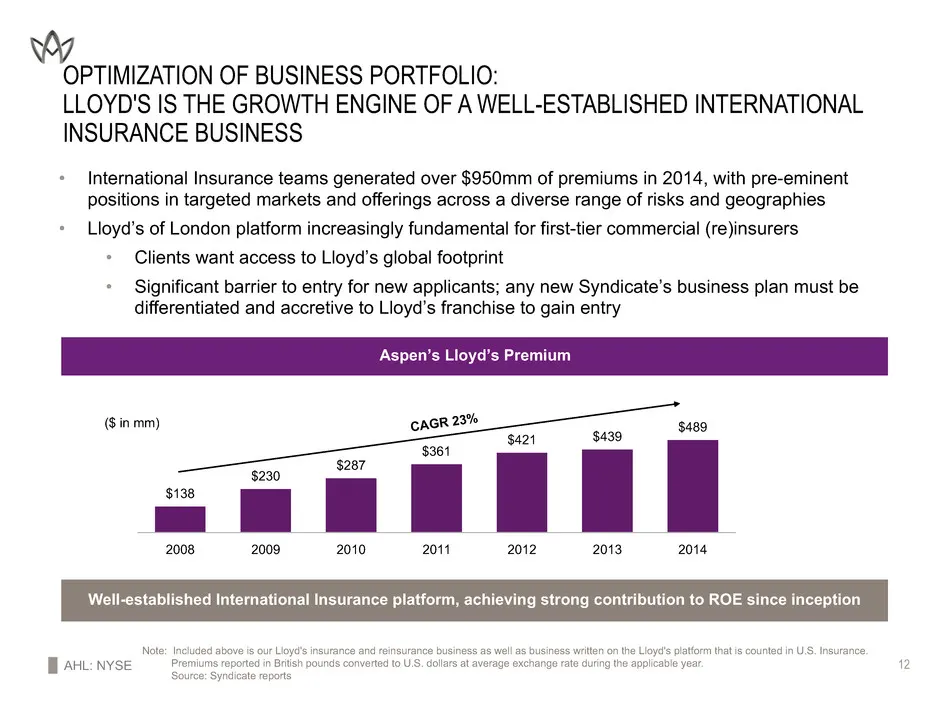
Slide 12: Lloyd's Is the Growth Engine of International Insurance Business
AHL: NYSE 12 2008 2009 2010 2011 2012 2013 2014 $138 $230 $287 $361 $421 $439 $489 OPTIMIZATION OF BUSINESS PORTFOLIO: LLOYD'S IS THE GROWTH ENGINE OF A WELL-ESTABLISHED INTERNATIONAL INSURANCE BUSINESS CAGR 23% Note: Included above is our Lloyd's insurance and reinsurance business as well as busine
Slide 13: Restructured Ceded Reinsurance and Retrocession Programs
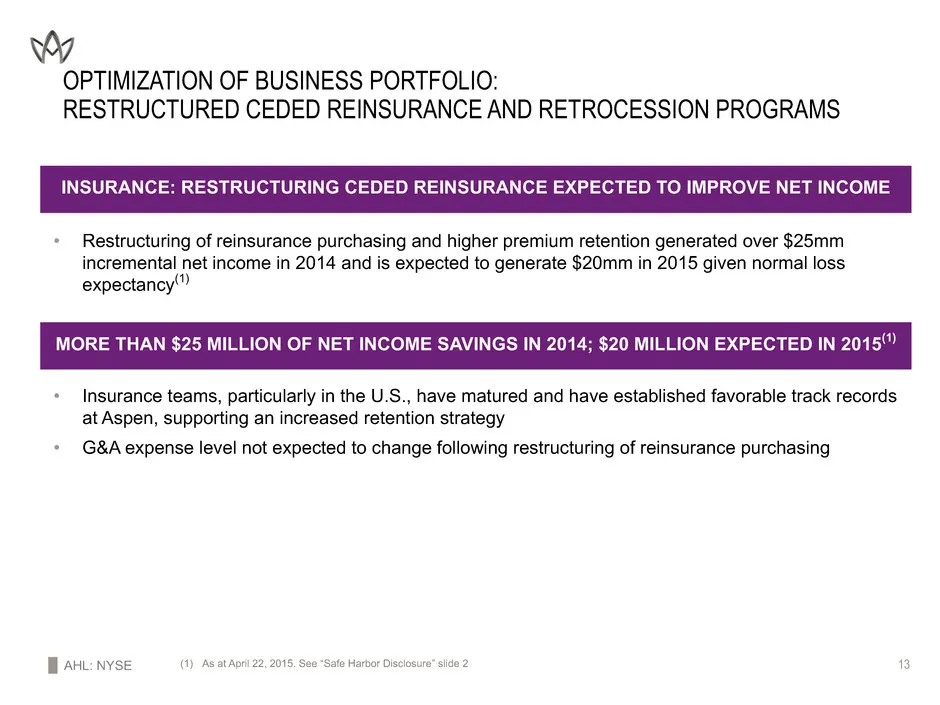
AHL: NYSE 13 OPTIMIZATION OF BUSINESS PORTFOLIO: RESTRUCTURED CEDED REINSURANCE AND RETROCESSION PROGRAMS • Restructuring of reinsurance purchasing and higher premium retention generated over $25mm incremental net income in 2014 and is expected to generate $20mm in 2015 given normal loss expectancy(
Slide 14: Capital Efficiency: Sustained Record of Proactive Management of Capital
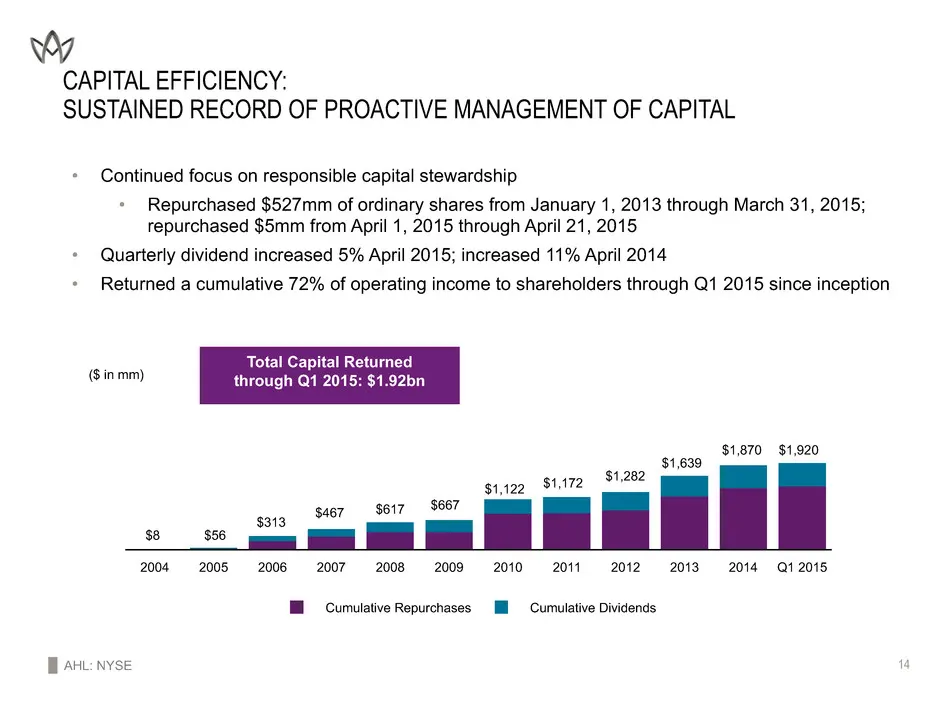
AHL: NYSE 14 CAPITAL EFFICIENCY: SUSTAINED RECORD OF PROACTIVE MANAGEMENT OF CAPITAL • Continued focus on responsible capital stewardship • Repurchased $527mm of ordinary shares from January 1, 2013 through March 31, 2015; repurchased $5mm from April 1, 2015 through April 21, 2015 • Quarterly divide
Slide 15: Enhancing Investment Return: Portfolio Allocations
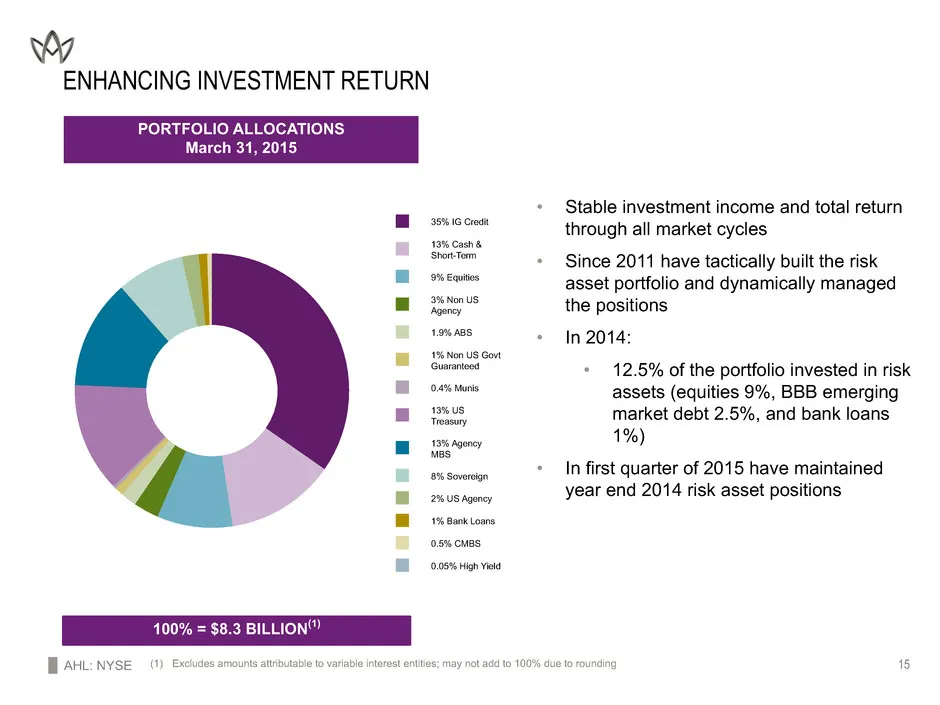
AHL: NYSE 15 PORTFOLIO ALLOCATIONS March 31, 2015 100% = $8.3 BILLION(1) • Stable investment income and total return through all market cycles • Since 2011 have tactically built the risk asset portfolio and dynamically managed the positions • In 2014: • 12.5% of the portfolio invested in risk assets
Slide 16: Conclusion: Focused on Shareholder Value
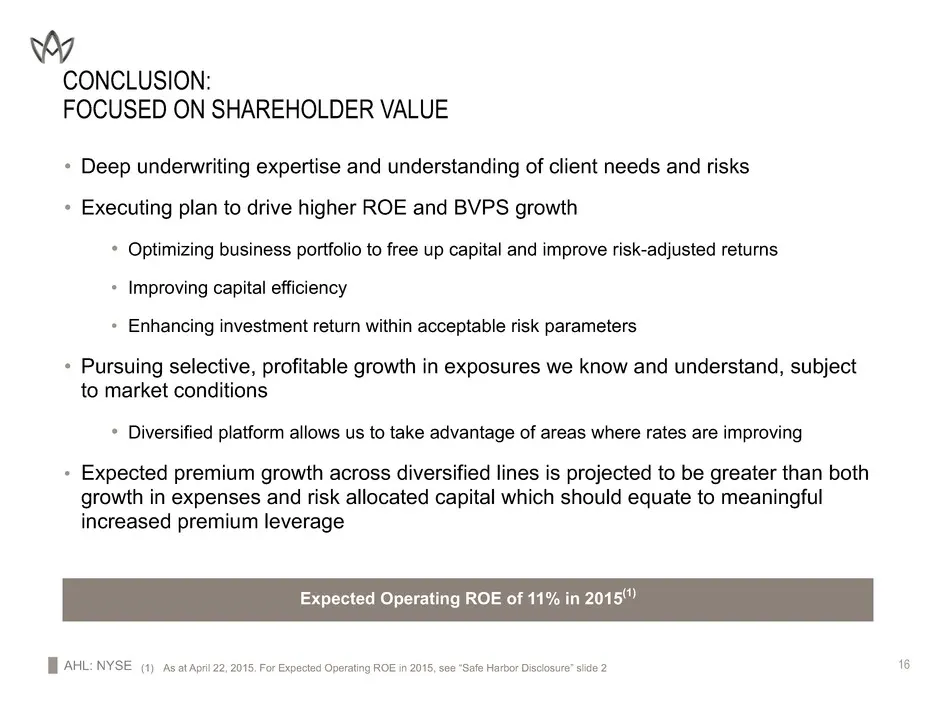
AHL: NYSE 16 CONCLUSION: FOCUSED ON SHAREHOLDER VALUE • Deep underwriting expertise and understanding of client needs and risks • Executing plan to drive higher ROE and BVPS growth • Optimizing business portfolio to free up capital and improve risk-adjusted returns • Improving capital efficiency • E

Slide 17: Appendix
APPENDIX
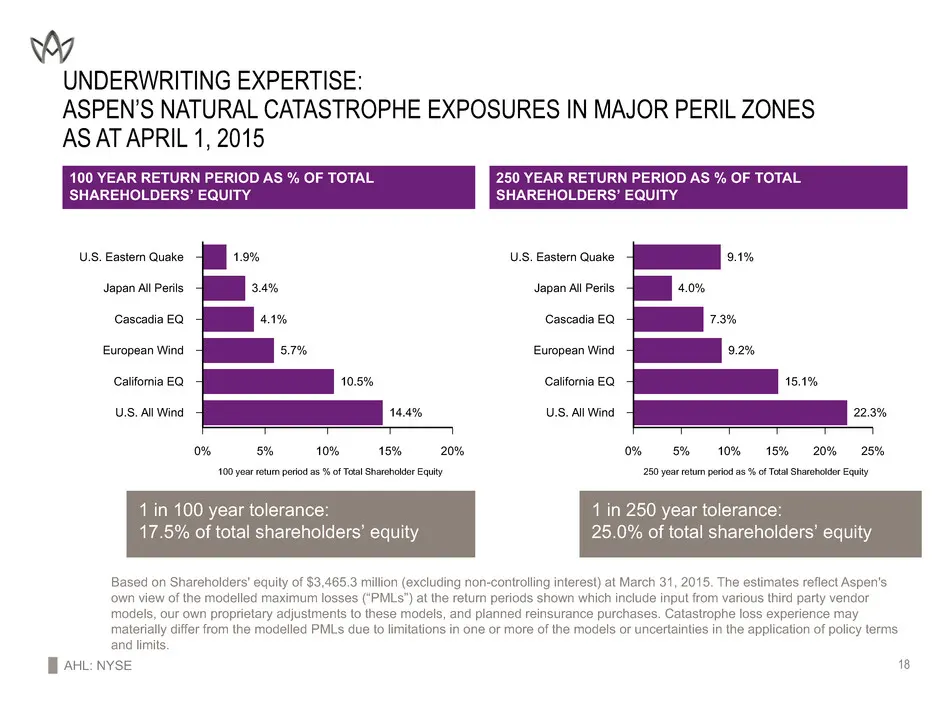
Slide 18: Underwriting Expertise: Natural Catastrophe Exposures in Major Peril Zones
AHL: NYSE 18 UNDERWRITING EXPERTISE: ASPEN’S NATURAL CATASTROPHE EXPOSURES IN MAJOR PERIL ZONES AS AT APRIL 1, 2015 100 YEAR RETURN PERIOD AS % OF TOTAL SHAREHOLDERS’ EQUITY 250 YEAR RETURN PERIOD AS % OF TOTAL SHAREHOLDERS’ EQUITY 1 in 100 year tolerance: 17.5% of total shareholders’ equity 1 in 25
Slide 19: Aspen Insurance Holdings Limited First Quarter 2015
Aspen Insurance Holdings Limited INVESTOR PRESENTATION FIRST QUARTER 2015
Source: SEC EDGAR · 8-K filed Apr 22, 2015
More decks from Aspen Insurance Holdings Ltd
 Q1 2018 Earnings Presentation13 slides · May 2, 2018
 Q3 2017 Earnings Presentation20 slides · Nov 15, 2017
 Q2 2017 Earnings Presentation20 slides · Jul 26, 2017
 Q1 2017 Earnings Presentation20 slides · Apr 26, 2017
 Q4 2016 Earnings Presentation16 slides · Feb 14, 2017
 Q3 2016 Earnings Presentation16 slides · Oct 26, 2016