New Senior Investment Group Inc
New Senior Investment — Q1 2020 Earnings Presentation
29 slides from New Senior Investment's earnings presentation, May 8, 2020
Slide 1: Company Presentation May 8, 2020
Company Presentation May 8, 2020 PinegateMacon, GA
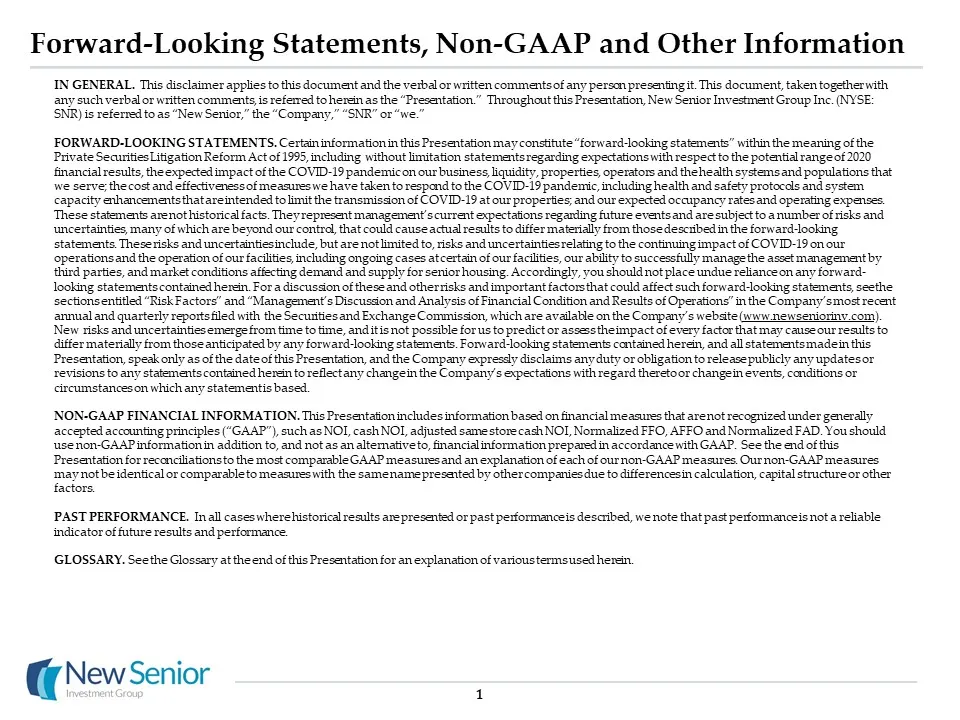
Slide 2: Forward-Looking Statements, Non-GAAP and Other Information
Forward-Looking Statements, Non-GAAP and Other Information 1 IN GENERAL. This disclaimer applies to this document and the verbal or written comments of any person presenting it. This document, taken together with any such verbal or written comments, is referred to herein as the “Presentation.” Throu
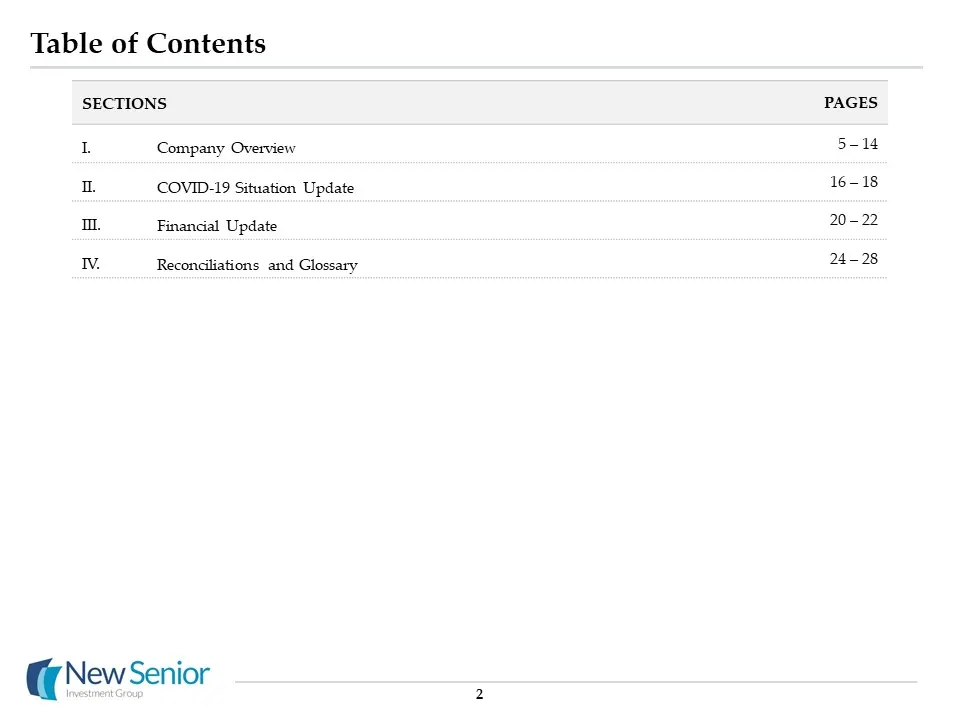
Slide 3: Table of Contents
Table of Contents SECTIONS PAGES I. Company Overview 5 – 14 II. COVID-19 Situation Update 16 – 18 III. Financial Update 20 – 22 IV. Reconciliations and Glossary 24 – 28 2
Slide 4: Executive Summary
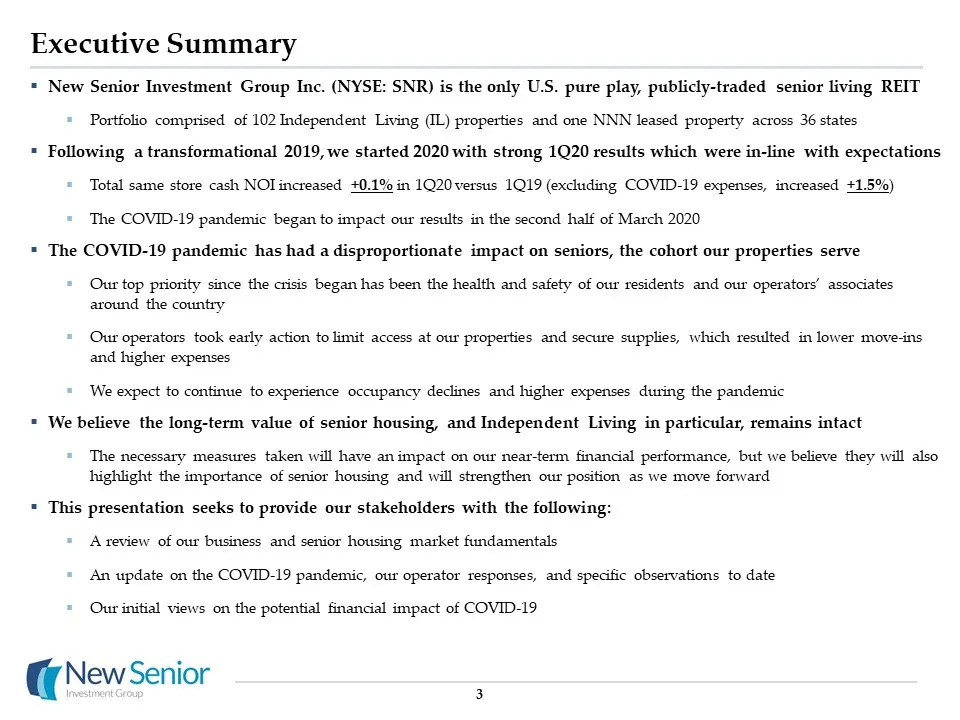
Executive Summary 3 New Senior Investment Group Inc. (NYSE: SNR) is the only U.S. pure play, publicly-traded senior living REITPortfolio comprised of 102 Independent Living (IL) properties and one NNN leased property across 36 statesFollowing a transformational 2019, we started 2020 with strong 1Q20
Slide 5: Company Overview
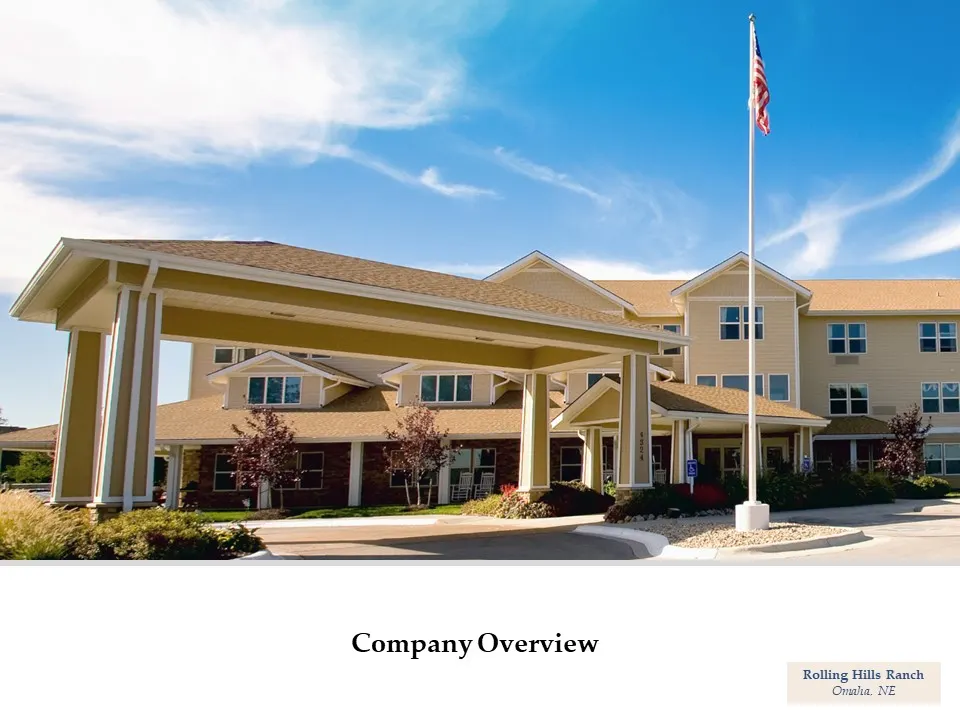
Company Overview Rolling Hills RanchOmaha, NE
Slide 6: New Senior Overview
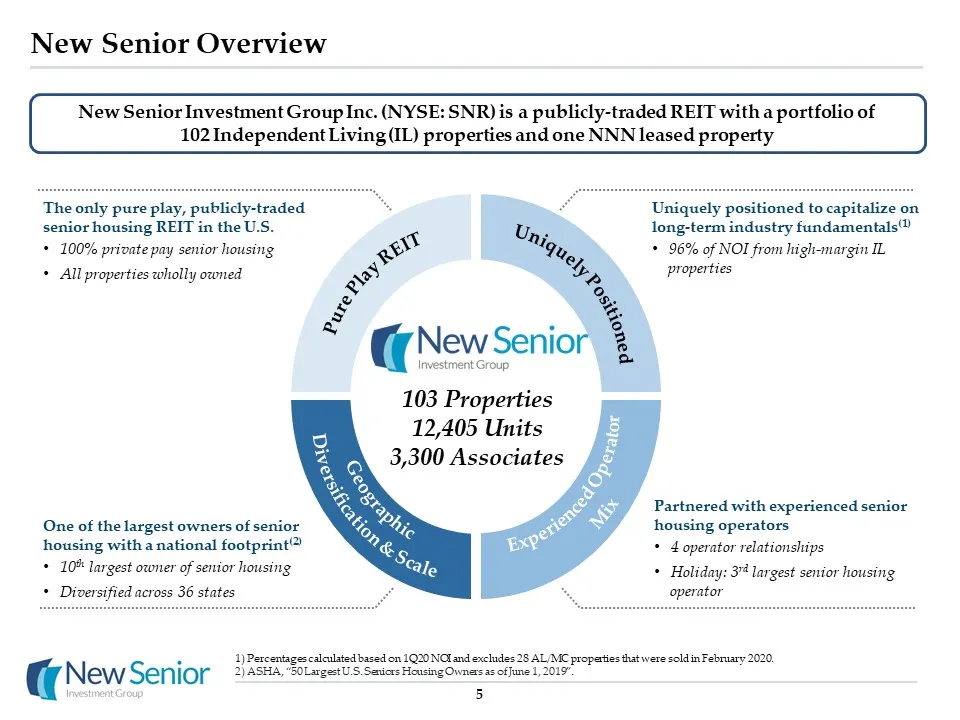
New Senior Overview New Senior Investment Group Inc. (NYSE: SNR) is a publicly-traded REIT with a portfolio of 102 Independent Living (IL) properties and one NNN leased property Pure Play REIT Uniquely Positioned Geographic Diversification & Scale Experienced Operator Mix Uniquely positioned to capi
Slide 7: Geographically Diversified Portfolio
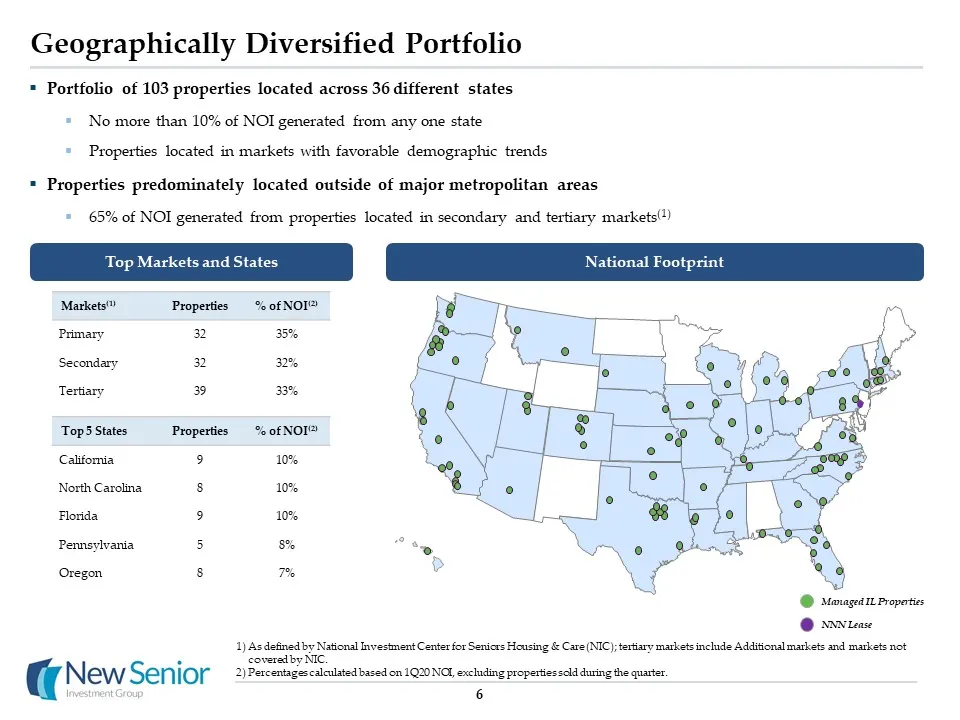
Geographically Diversified Portfolio Portfolio of 103 properties located across 36 different statesNo more than 10% of NOI generated from any one stateProperties located in markets with favorable demographic trends Properties predominately located outside of major metropolitan areas65% of NOI genera
Slide 8: Overview of Senior Housing Acuity Spectrum
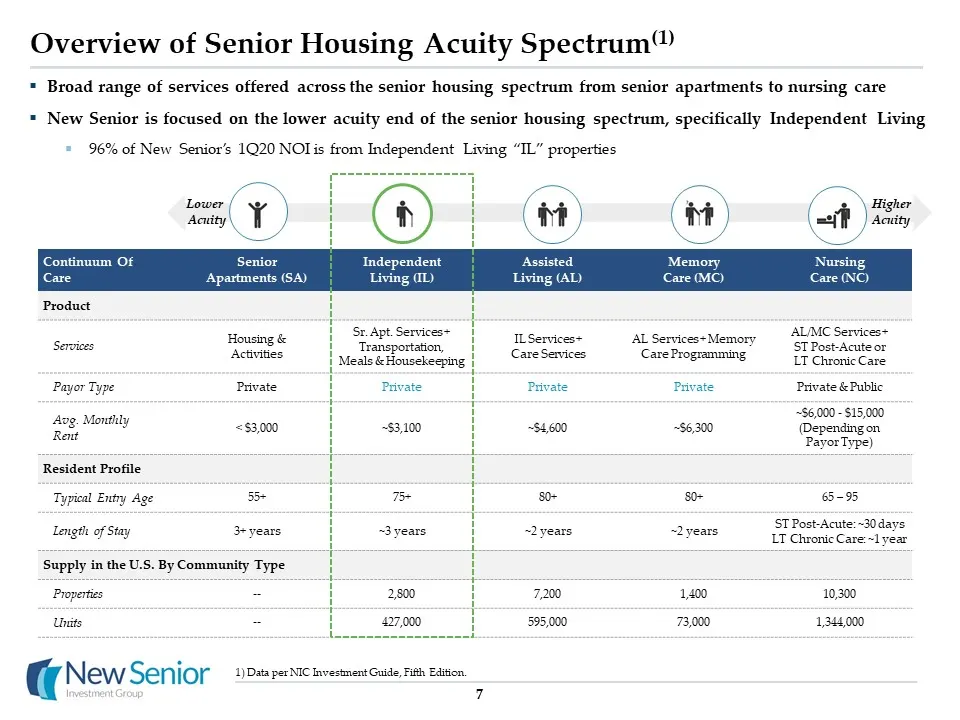
Overview of Senior Housing Acuity Spectrum(1) 7 Data per NIC Investment Guide, Fifth Edition. Continuum Of Care Senior Apartments (SA) Independent Living (IL) Assisted Living (AL) Memory Care (MC) Nursing Care (NC) Product Services Housing & Activities Sr. Apt. Services + Transportation,Meals & Hous
Slide 9: Benefits of Independent Living
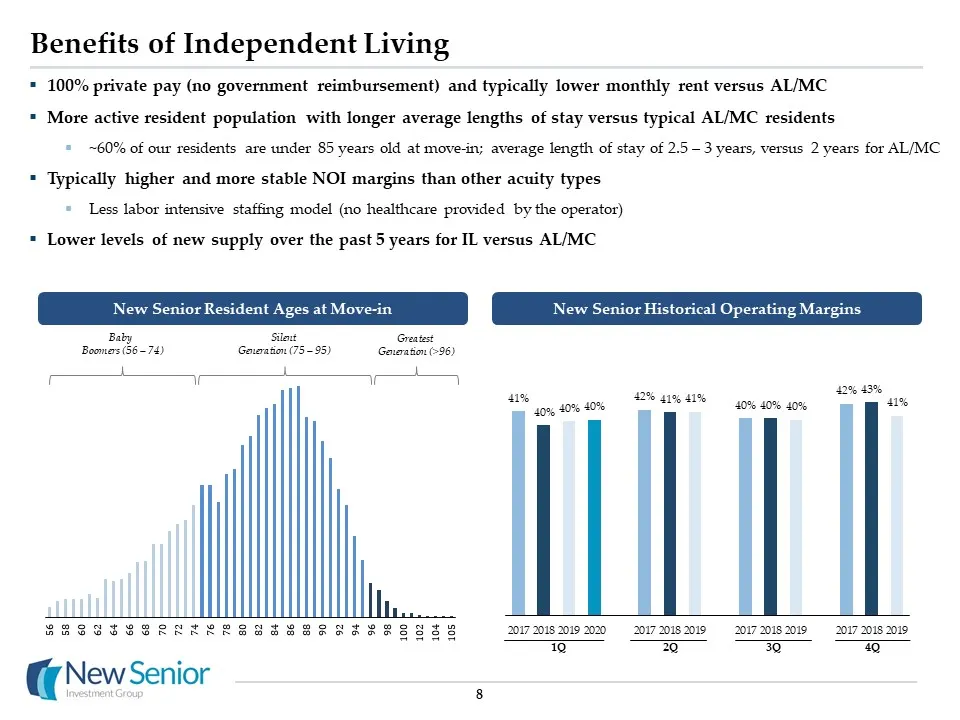
Benefits of Independent Living 8 1Q 2Q 3Q 4Q Baby Boomers (56 – 74) Silent Generation (75 – 95) Greatest Generation (>96) New Senior Resident Ages at Move-in New Senior Historical Operating Margins 100% private pay (no government reimbursement) and typically lower monthly rent versus AL/MCMore activ
Slide 10: Purpose Built, Uniform Independent Living Portfolio
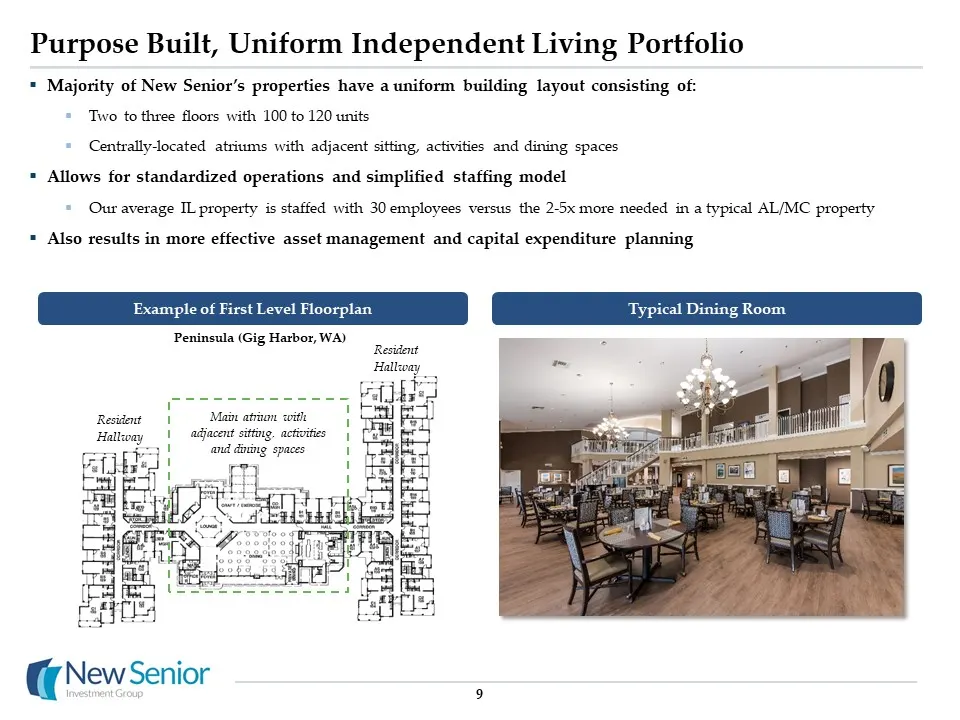
Purpose Built, Uniform Independent Living Portfolio Peninsula (Gig Harbor, WA) Example of First Level Floorplan Main atrium with adjacent sitting, activities and dining spaces Resident Hallway Resident Hallway 9 Typical Dining Room Majority of New Senior’s properties have a uniform building layout c
Slide 11: Senior Housing Industry is Large and Fragmented
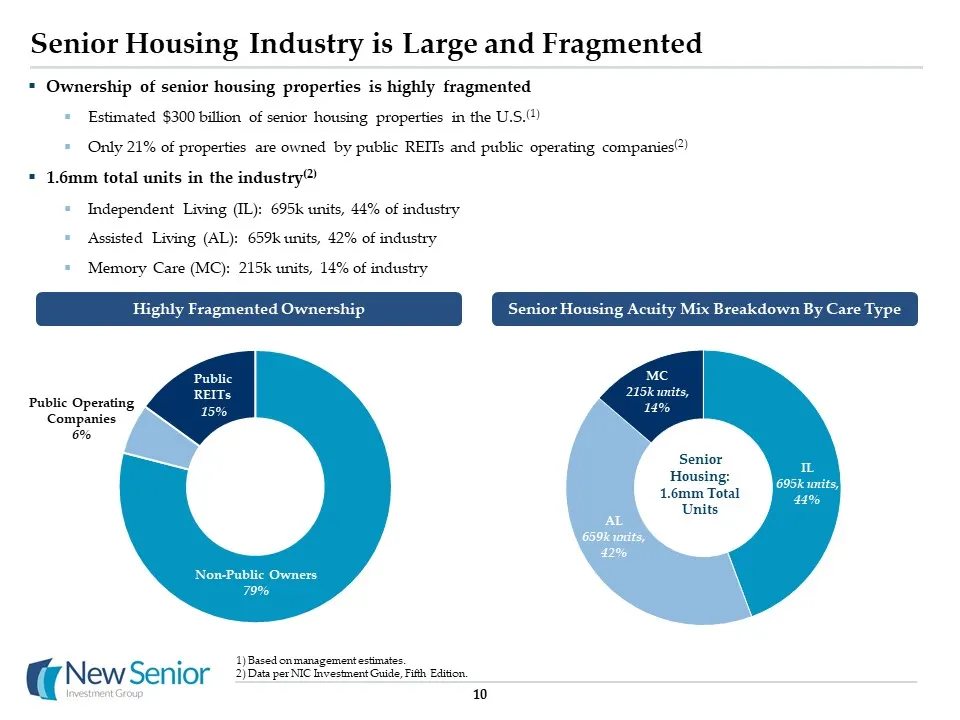
Senior Housing Industry is Large and Fragmented Ownership of senior housing properties is highly fragmentedEstimated $300 billion of senior housing properties in the U.S.(1)Only 21% of properties are owned by public REITs and public operating companies(2)1.6mm total units in the industry(2)Independe
Slide 12: Compelling Demographic Tailwinds
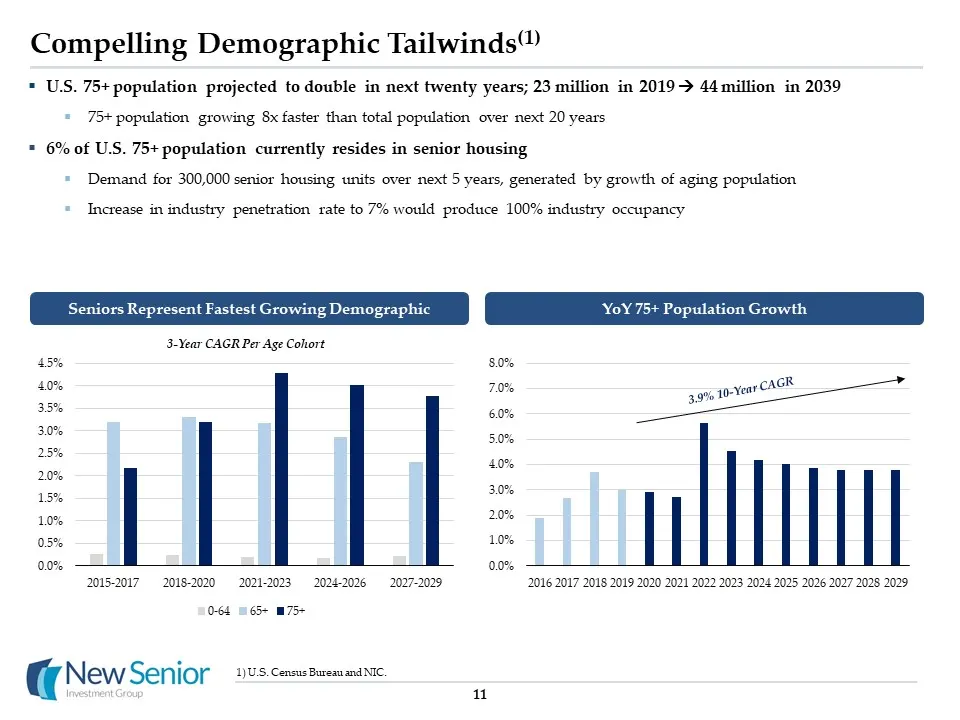
Compelling Demographic Tailwinds(1) 11 Seniors Represent Fastest Growing Demographic YoY 75+ Population Growth U.S. Census Bureau and NIC. 3-Year CAGR Per Age Cohort 3.9% 10-Year CAGR U.S. 75+ population projected to double in next twenty years; 23 million in 2019 44 million in 2039 75+ population
Slide 13: Growing Need for Middle Income Housing for Seniors
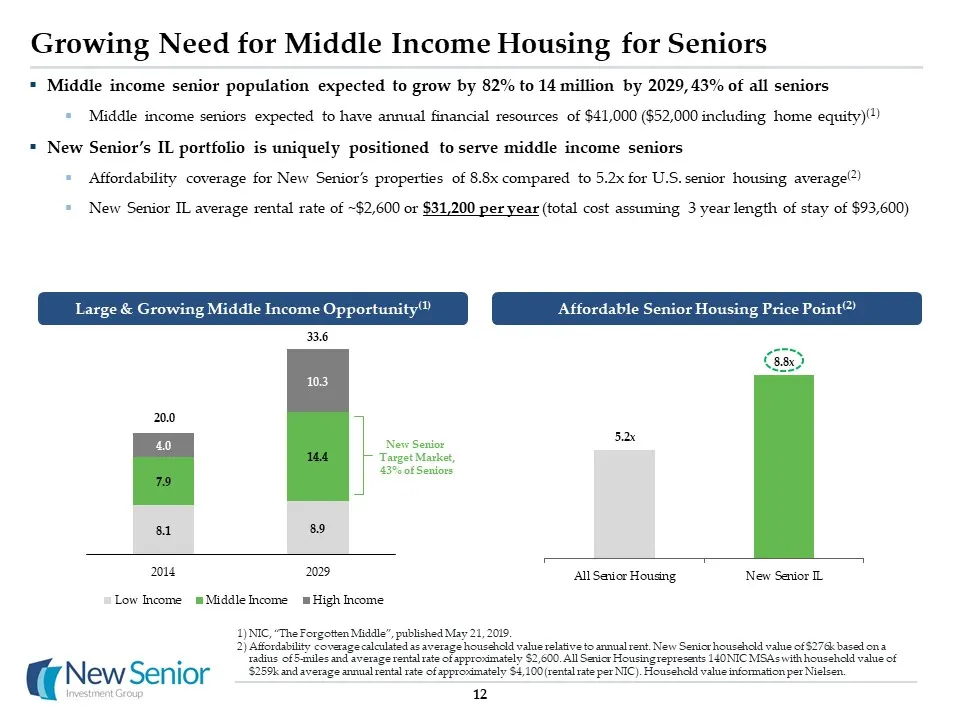
Growing Need for Middle Income Housing for Seniors NIC, “The Forgotten Middle”, published May 21, 2019.Affordability coverage calculated as average household value relative to annual rent. New Senior household value of $276k based on a radius of 5-miles and average rental rate of approximately $2,60
Slide 14: Value Proposition of Senior Housing
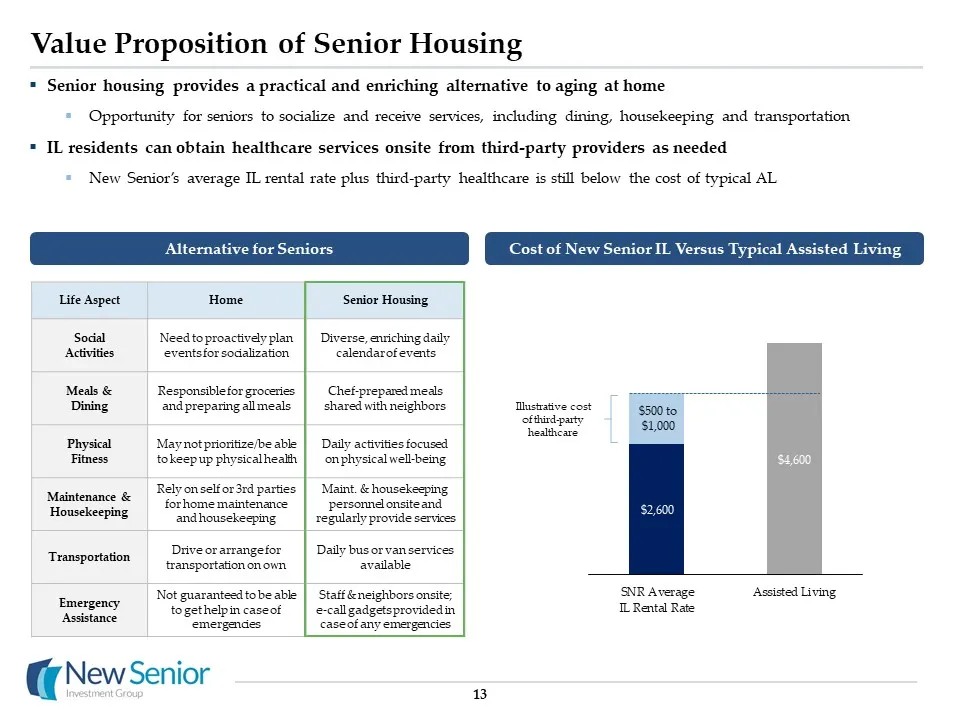
Value Proposition of Senior Housing Senior housing provides a practical and enriching alternative to aging at homeOpportunity for seniors to socialize and receive services, including dining, housekeeping and transportationIL residents can obtain healthcare services onsite from third-party providers
Slide 15: Recent Company Updates
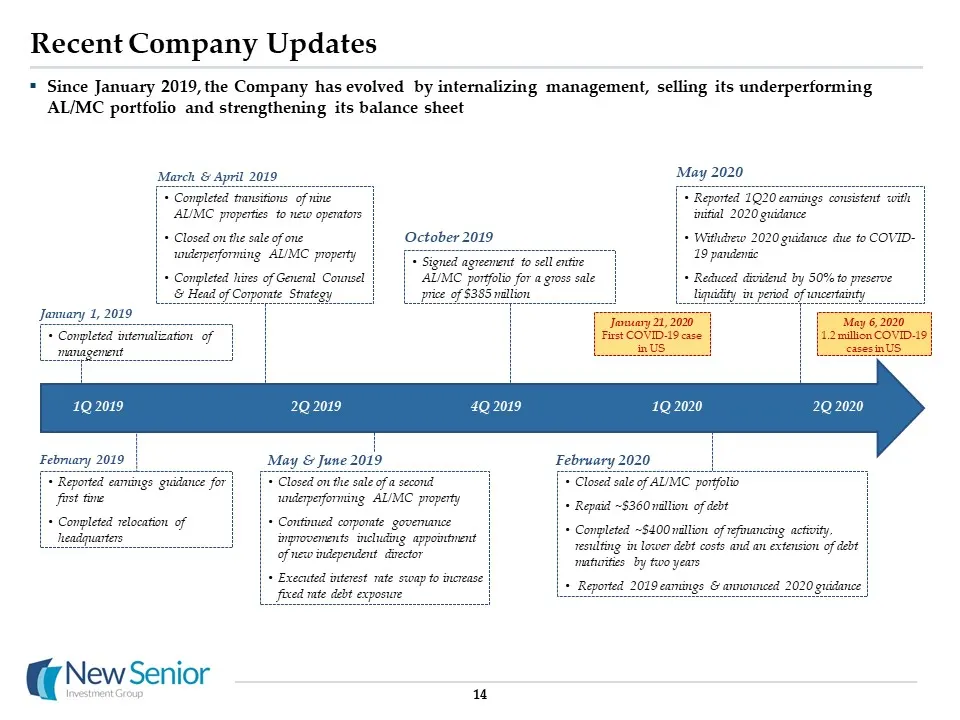
14 Recent Company Updates Since January 2019, the Company has evolved by internalizing management, selling its underperforming AL/MC portfolio and strengthening its balance sheet Completed internalization of management January 1, 2019 Reported earnings guidance for first timeCompleted relocation of
Slide 16: COVID-19 Situation Update
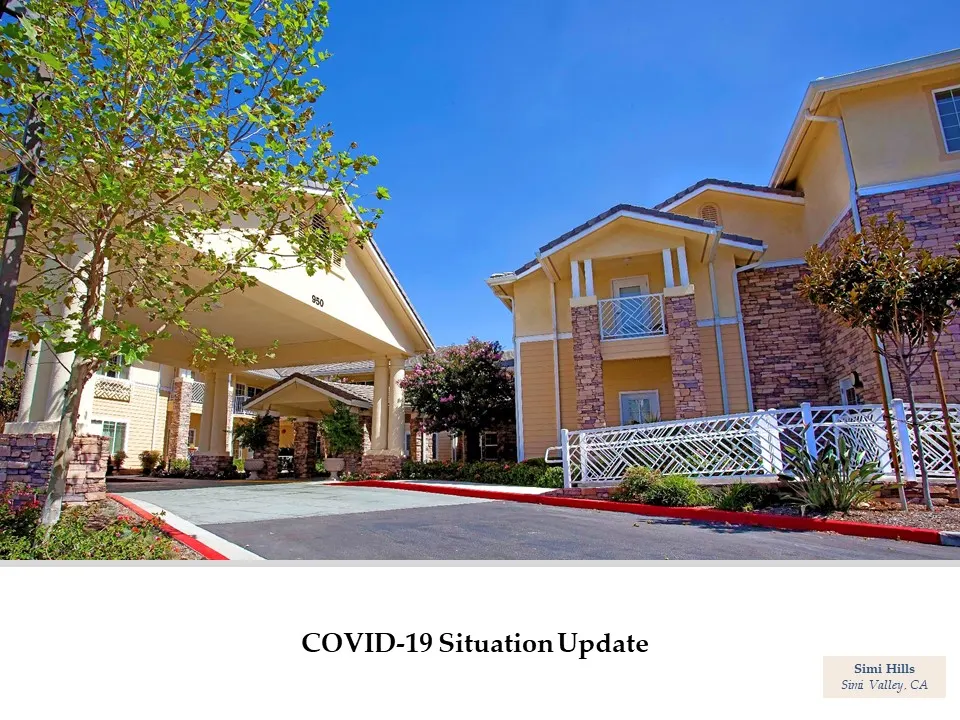
COVID-19 Situation Update Simi HillsSimi Valley, CA
Slide 17: Operator Response to COVID-19
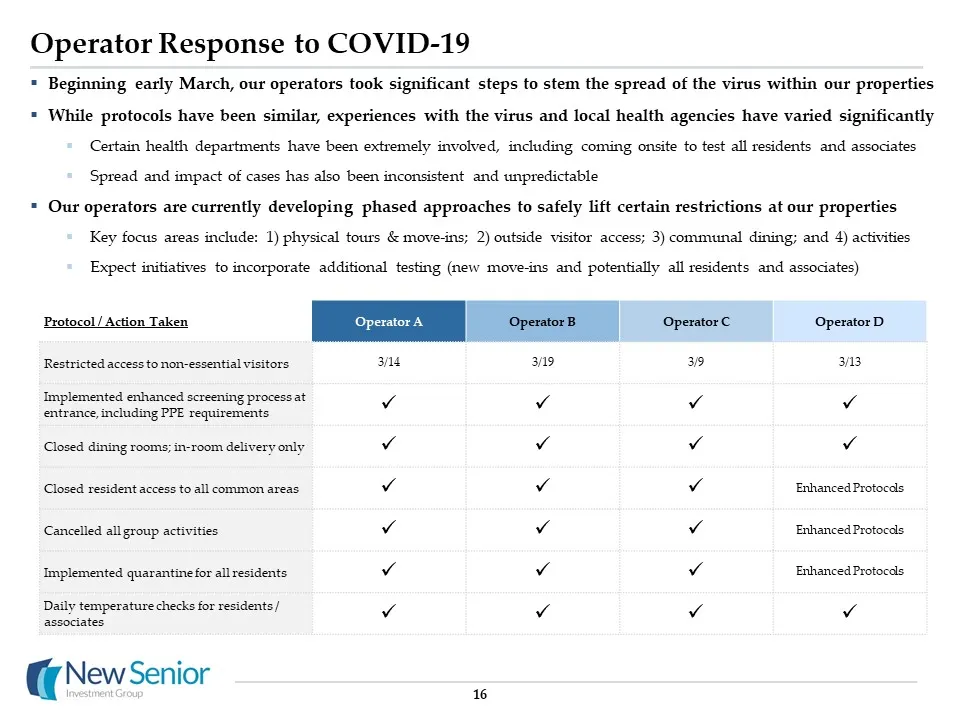
16 Operator Response to COVID-19 Protocol / Action Taken Operator A Operator B Operator C Operator D Restricted access to non-essential visitors 3/14 3/19 3/9 3/13 Implemented enhanced screening process at entrance, including PPE requirements Closed dining rooms; in-room delivery only
Slide 18: Known COVID-19 Cases & Status
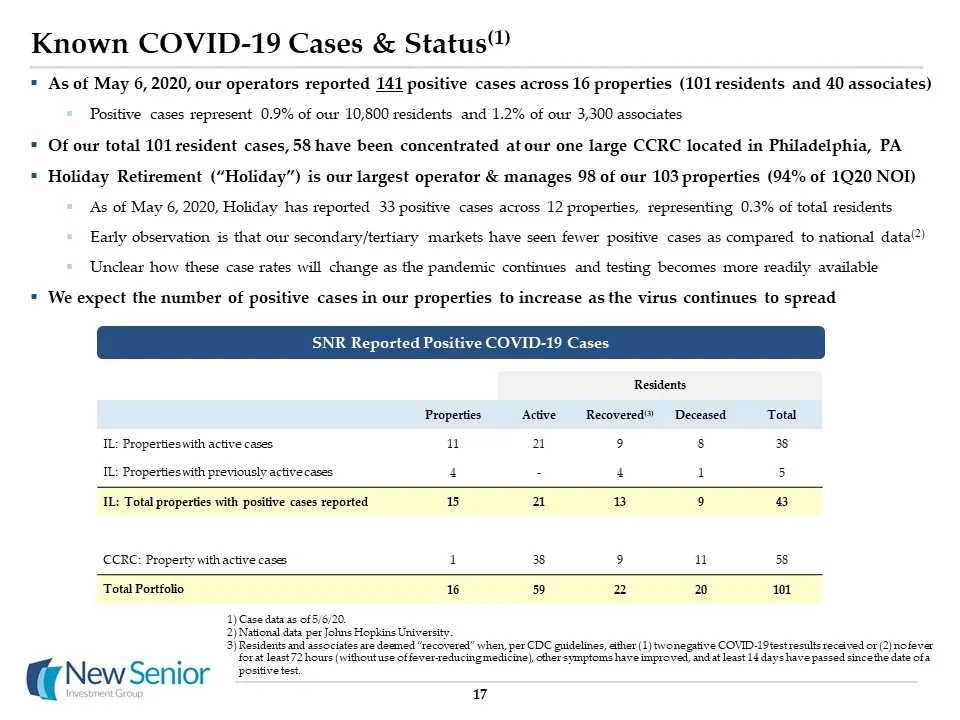
Residents Properties Active Recovered(3) Deceased Total IL: Properties with active cases 11 21 9 8 38 IL: Properties with previously active cases 4 - 4 1 5 IL: Total properties with positive cases reported 15 21 13 9 43 CCRC: Property with active cases 1 38 9 11 58 Total Portfolio 16 59 22 20 101 Kn
Slide 19: Observations on March & April Results
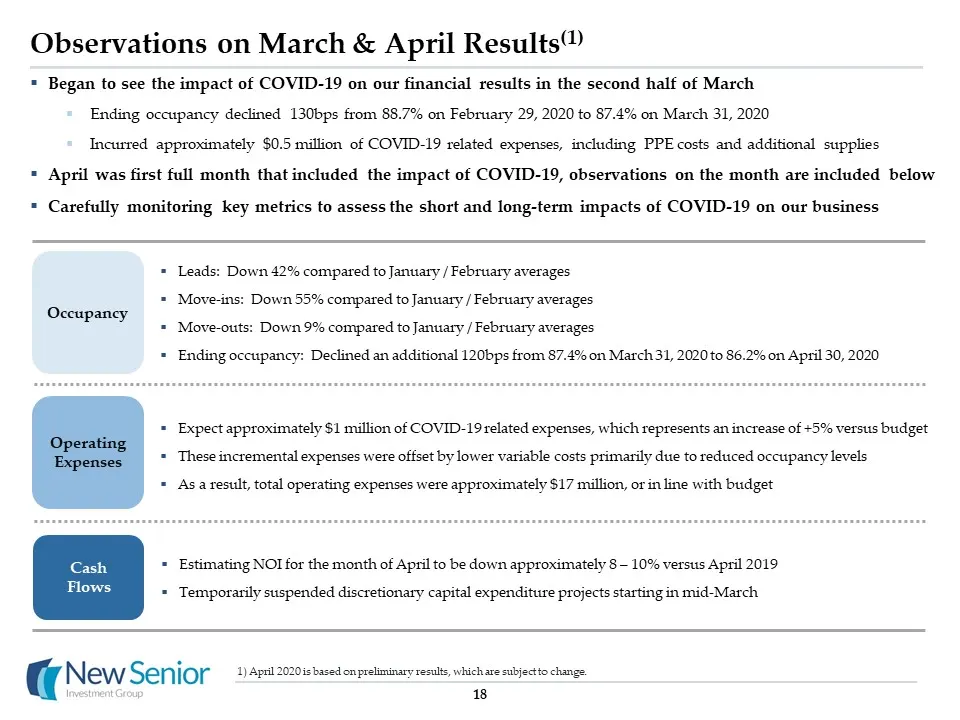
Observations on March & April Results(1) 18 Leads: Down 42% compared to January / February averagesMove-ins: Down 55% compared to January / February averages Move-outs: Down 9% compared to January / February averagesEnding occupancy: Declined an additional 120bps from 87.4% on March 31, 2020 to 86.2
Slide 20: Financial Update
Financial Update The Chateau at HarvestonTemecula, CA
Slide 21: Same Store Results – 1Q 2020
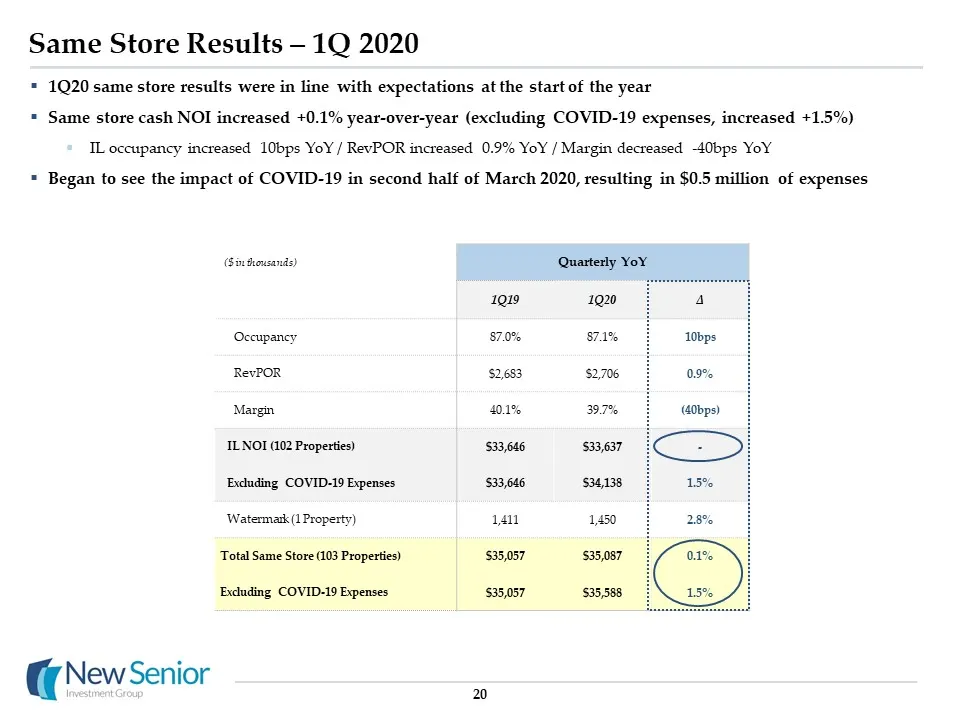
20 Same Store Results – 1Q 2020 1Q20 same store results were in line with expectations at the start of the yearSame store cash NOI increased +0.1% year-over-year (excluding COVID-19 expenses, increased +1.5%)IL occupancy increased 10bps YoY / RevPOR increased 0.9% YoY / Margin decreased -40bps YoYBe
Slide 22: Potential Future Impact of COVID-19
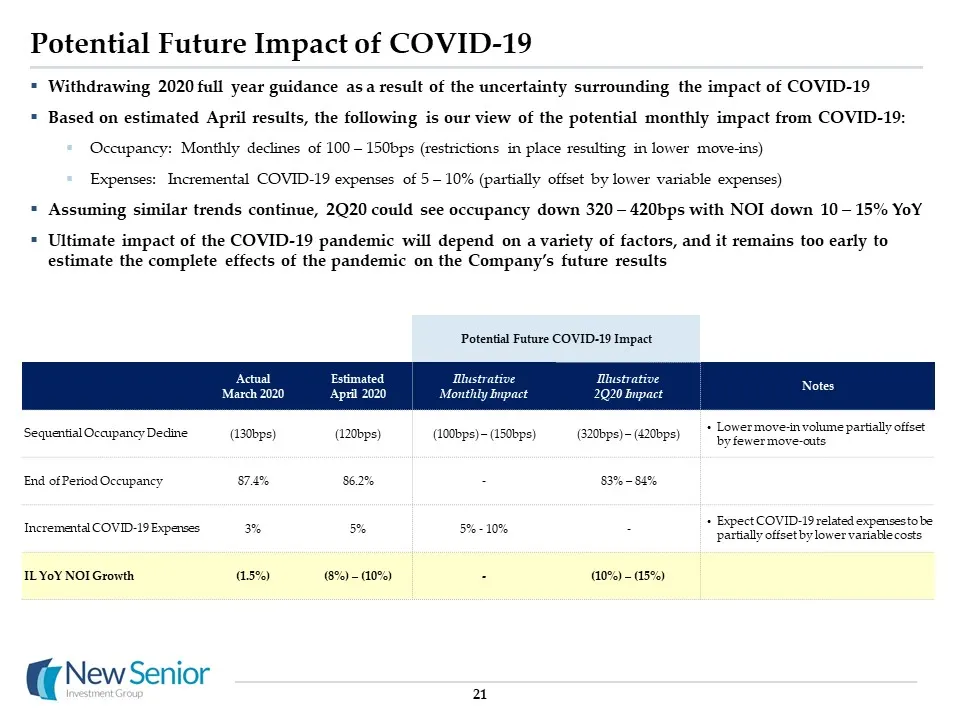
Potential Future Impact of COVID-19 21 Withdrawing 2020 full year guidance as a result of the uncertainty surrounding the impact of COVID-19Based on estimated April results, the following is our view of the potential monthly impact from COVID-19:Occupancy: Monthly declines of 100 – 150bps (restricti
Slide 23: Capital Structure, Debt Maturities & Liquidity
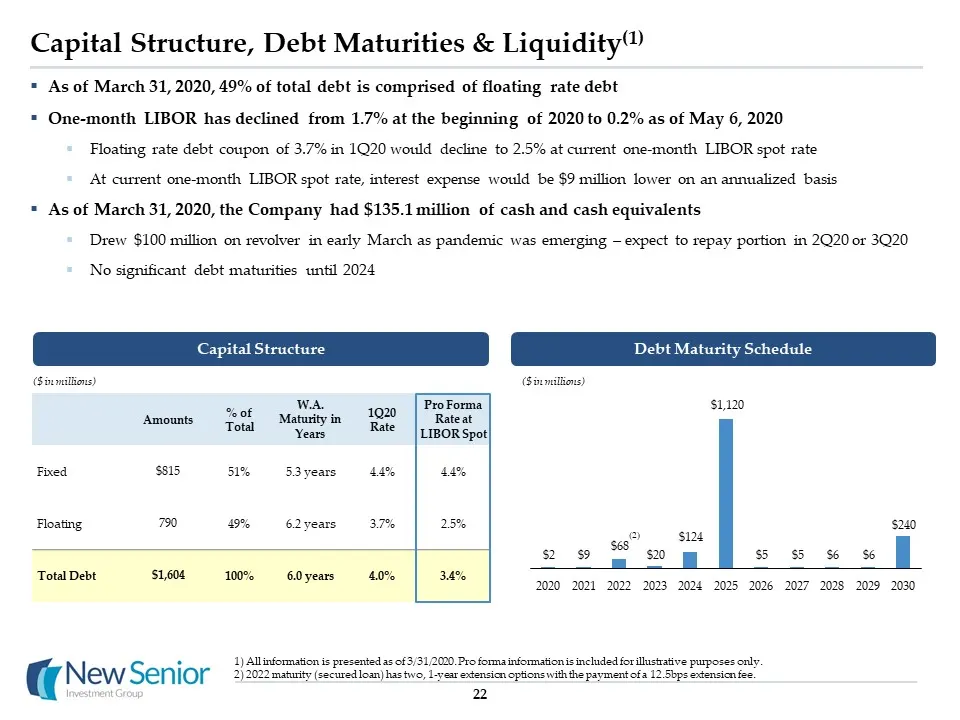
Capital Structure, Debt Maturities & Liquidity(1) All information is presented as of 3/31/2020. Pro forma information is included for illustrative purposes only. 2022 maturity (secured loan) has two, 1-year extension options with the payment of a 12.5bps extension fee. 22 Amounts % of Total W.A. Mat
Slide 24: Reconciliations & Glossary
Reconciliations & Glossary Marion WoodsOcala, FL
Slide 25: NOI Reconciliation – 1Q 2020 Year-over-Year
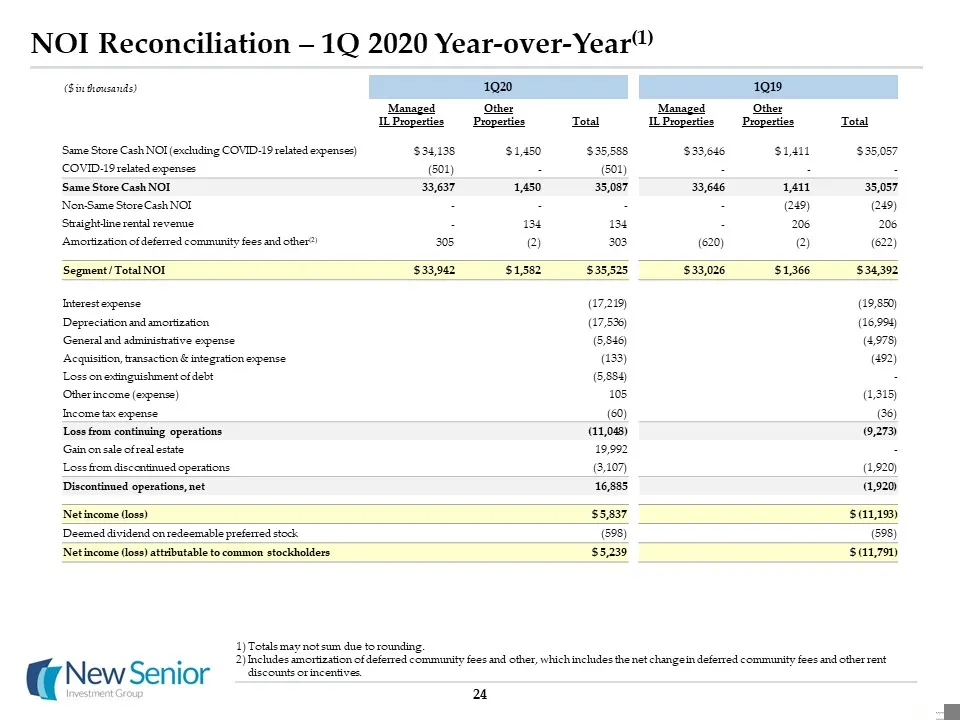
NOI Reconciliation – 1Q 2020 Year-over-Year(1) ($ in thousands) 24 Totals may not sum due to rounding.Includes amortization of deferred community fees and other, which includes the net change in deferred community fees and other rent discounts or incentives. 1Q20 1Q19 Managed IL Properties Other Pro
Slide 26: NOI Reconciliation – 1Q 2020 Quarter-over-Quarter
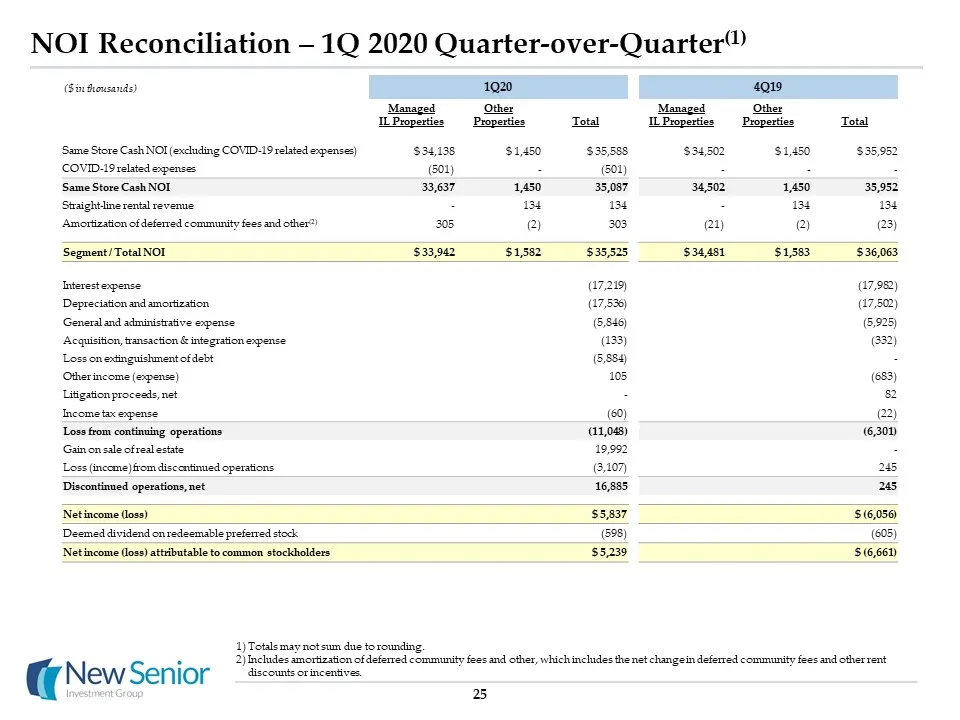
NOI Reconciliation – 1Q 2020 Quarter-over-Quarter(1) 25 Totals may not sum due to rounding.Includes amortization of deferred community fees and other, which includes the net change in deferred community fees and other rent discounts or incentives. 1Q20 4Q19 Managed IL Properties Other Properties Tot
Slide 27: GAAP Reconciliation of FFO, Normalized FFO, AFFO and Normalized FAD
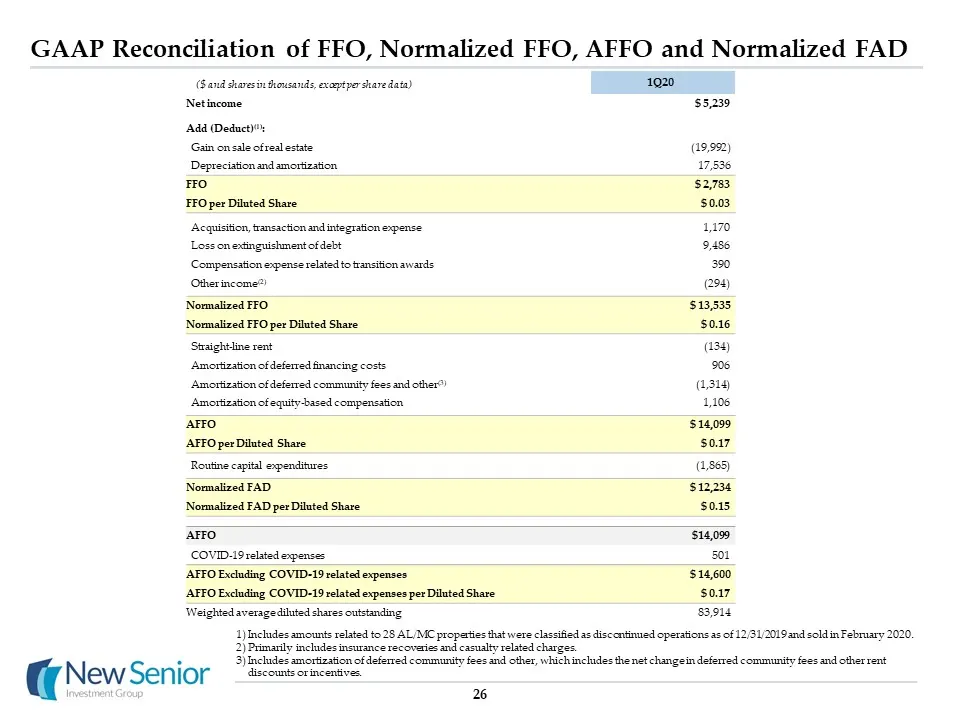
GAAP Reconciliation of FFO, Normalized FFO, AFFO and Normalized FAD 26 Includes amounts related to 28 AL/MC properties that were classified as discontinued operations as of 12/31/2019 and sold in February 2020. Primarily includes insurance recoveries and casualty related charges.Includes amortizatio
Slide 28: Glossary
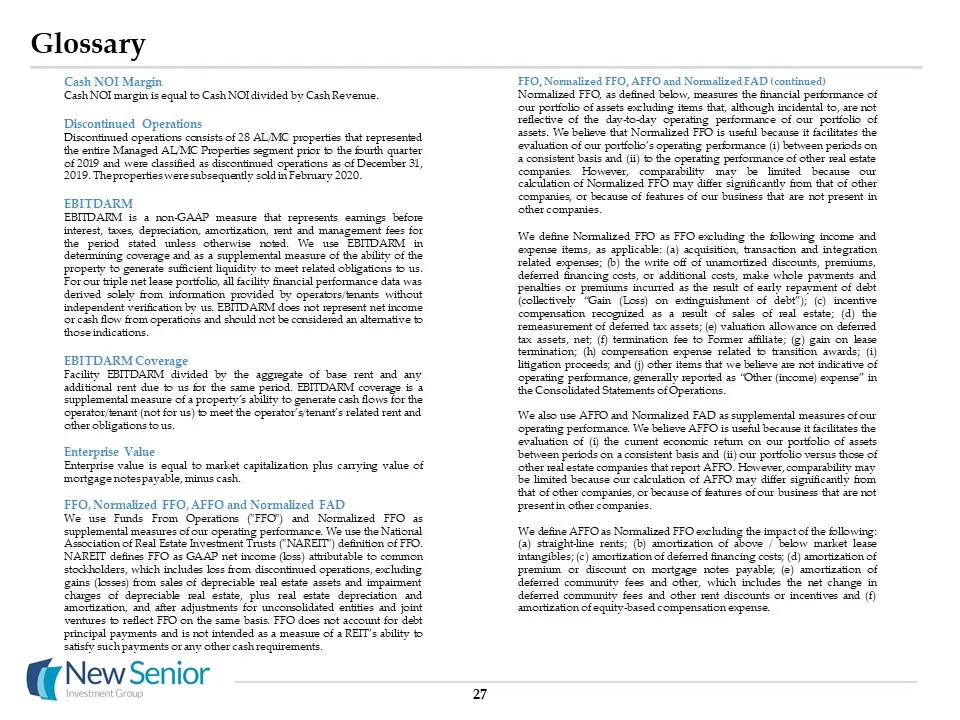
Glossary Cash NOI MarginCash NOI margin is equal to Cash NOI divided by Cash Revenue.Discontinued OperationsDiscontinued operations consists of 28 AL/MC properties that represented the entire Managed AL/MC Properties segment prior to the fourth quarter of 2019 and were classified as discontinued ope
Slide 29: Glossary FFO, Normalized FFO, AFFO and Normalized FAD (continued)
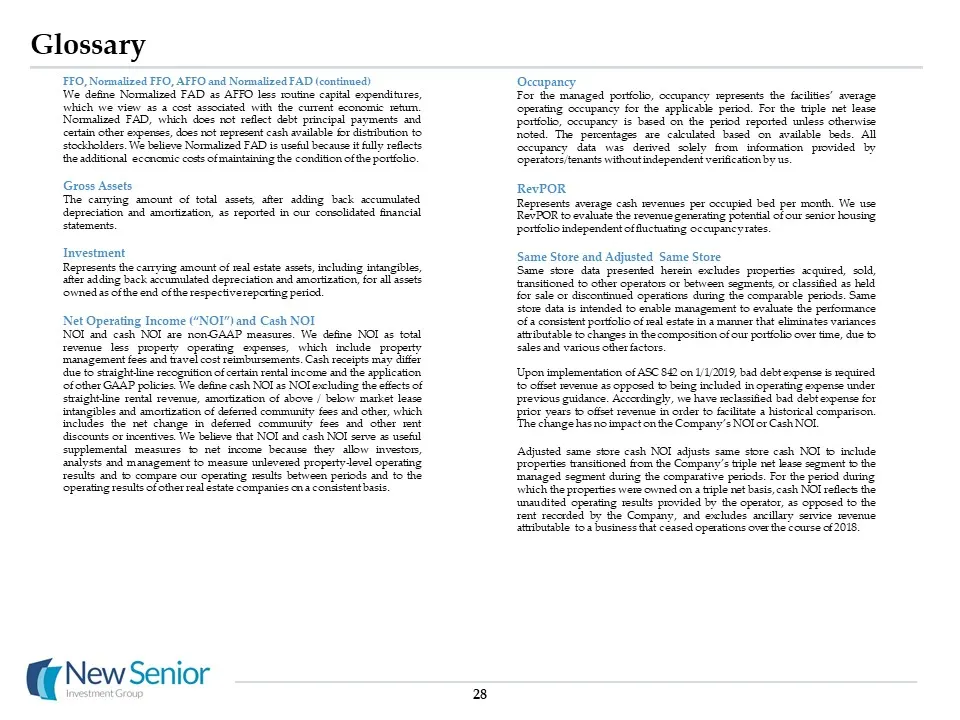
Glossary FFO, Normalized FFO, AFFO and Normalized FAD (continued)We define Normalized FAD as AFFO less routine capital expenditures, which we view as a cost associated with the current economic return. Normalized FAD, which does not reflect debt principal payments and certain other expenses, does no
Source: SEC EDGAR · 8-K filed May 8, 2020