New Senior Investment Group Inc
New Senior Investment — Q2 2020 Earnings Presentation
28 slides from New Senior Investment's earnings presentation, Aug 7, 2020
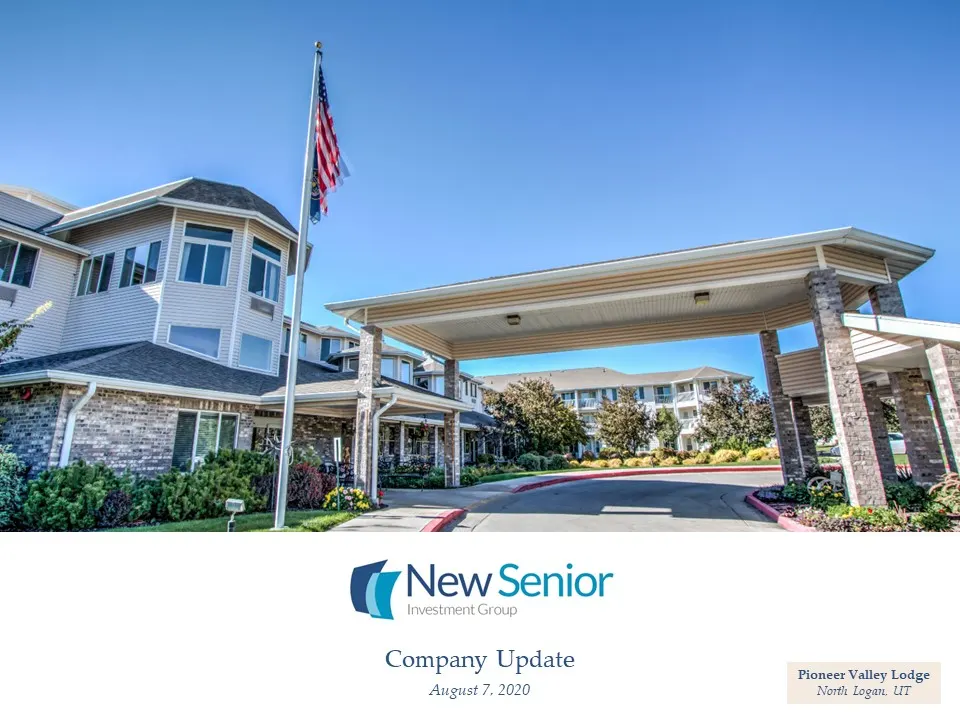
Slide 1: Company Update August 7, 2020
Company Update August 7, 2020 Pioneer Valley LodgeNorth Logan, UT
Slide 2: Forward-Looking Statements, Non-GAAP and Other Information
Forward-Looking Statements, Non-GAAP and Other Information 1 IN GENERAL. This disclaimer applies to this document and the verbal or written comments of any person presenting it. This document, taken together with any such verbal or written comments, is referred to herein as the “Presentation.” Throu
Slide 3: Table of Contents
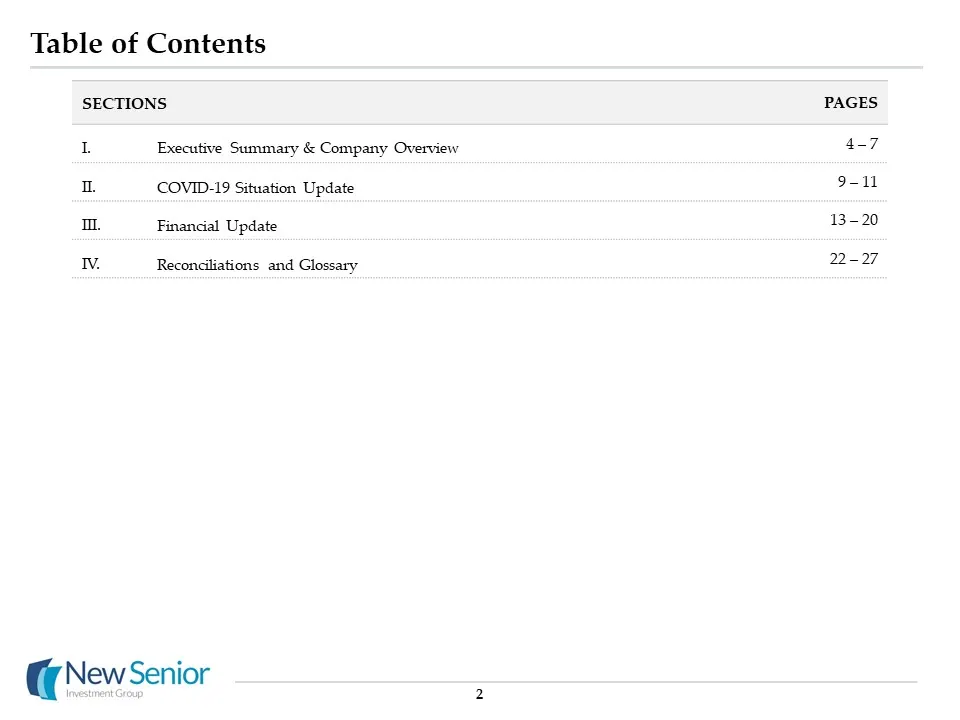
Table of Contents SECTIONS PAGES I. Executive Summary & Company Overview 4 – 7 II. COVID-19 Situation Update 9 – 11 III. Financial Update 13 – 20 IV. Reconciliations and Glossary 22 – 27 2

Slide 4: Executive Summary & Company Overview
Executive Summary & Company Overview Madison EstatesSan Antonio, TX
Slide 5: Executive Summary
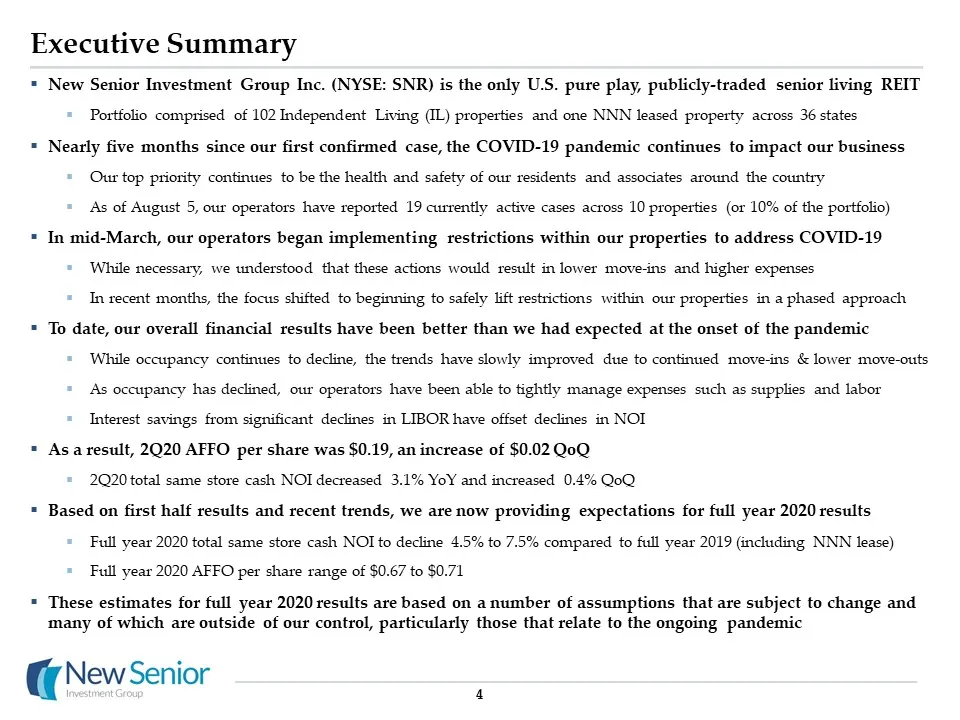
Executive Summary 4 New Senior Investment Group Inc. (NYSE: SNR) is the only U.S. pure play, publicly-traded senior living REITPortfolio comprised of 102 Independent Living (IL) properties and one NNN leased property across 36 statesNearly five months since our first confirmed case, the COVID-19 pan
Slide 6: New Senior Overview
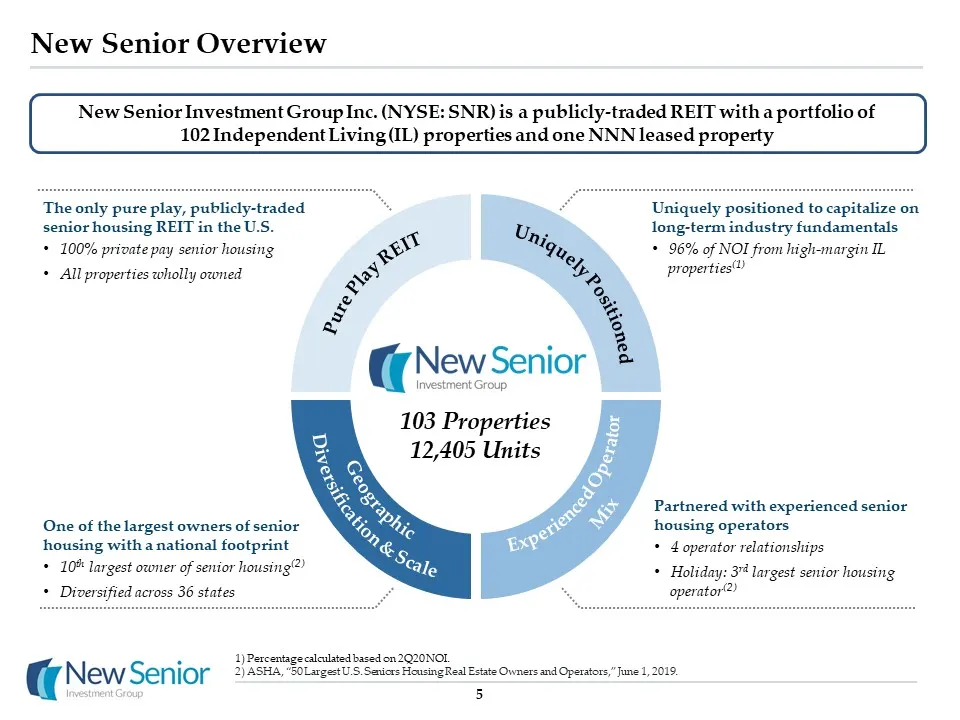
New Senior Overview New Senior Investment Group Inc. (NYSE: SNR) is a publicly-traded REIT with a portfolio of 102 Independent Living (IL) properties and one NNN leased property Pure Play REIT Uniquely Positioned Geographic Diversification & Scale Experienced Operator Mix Uniquely positioned to capi
Slide 7: Geographically Diversified Portfolio
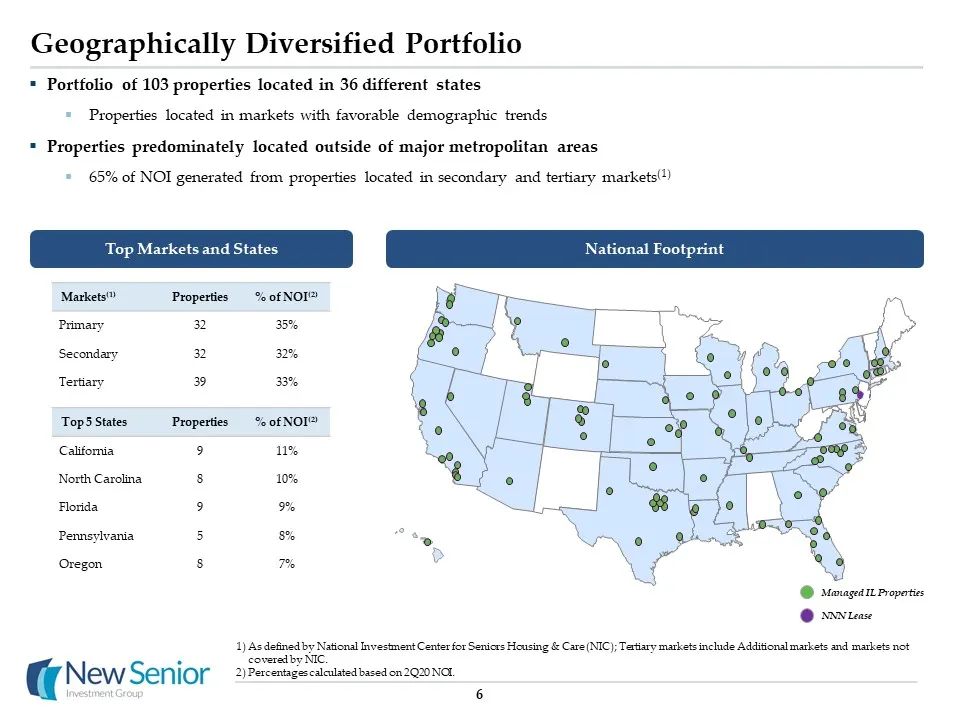
Geographically Diversified Portfolio Portfolio of 103 properties located in 36 different statesProperties located in markets with favorable demographic trends Properties predominately located outside of major metropolitan areas65% of NOI generated from properties located in secondary and tertiary ma
Slide 8: Recent Company Updates
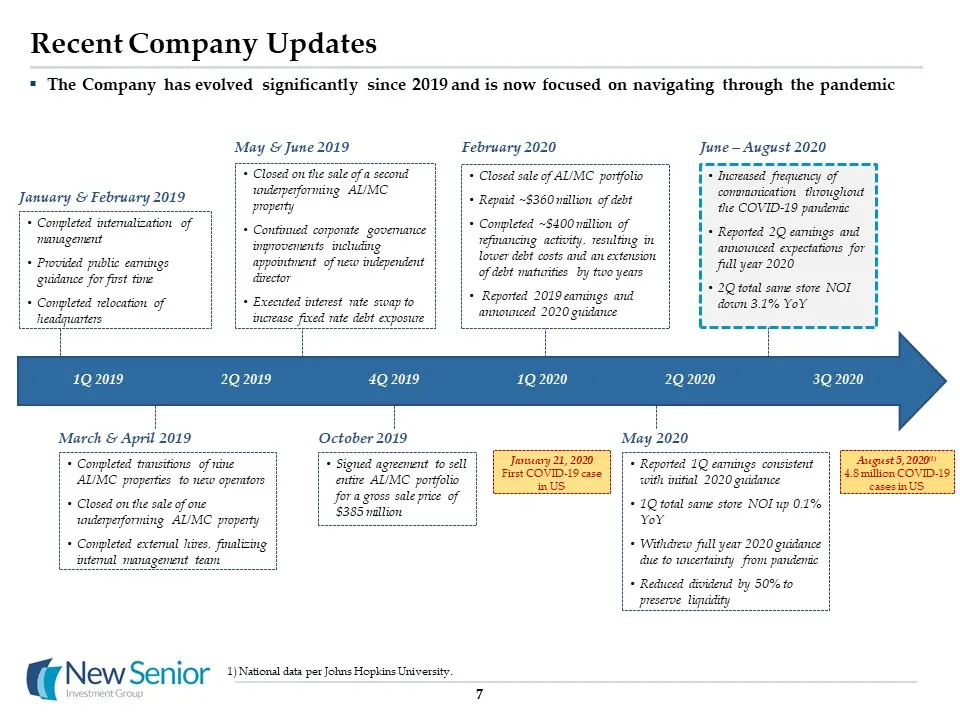
7 Recent Company Updates The Company has evolved significantly since 2019 and is now focused on navigating through the pandemic Completed internalization of managementProvided public earnings guidance for first timeCompleted relocation of headquarters January & February 2019 Completed transitions of
Slide 9: COVID-19 Situation Update
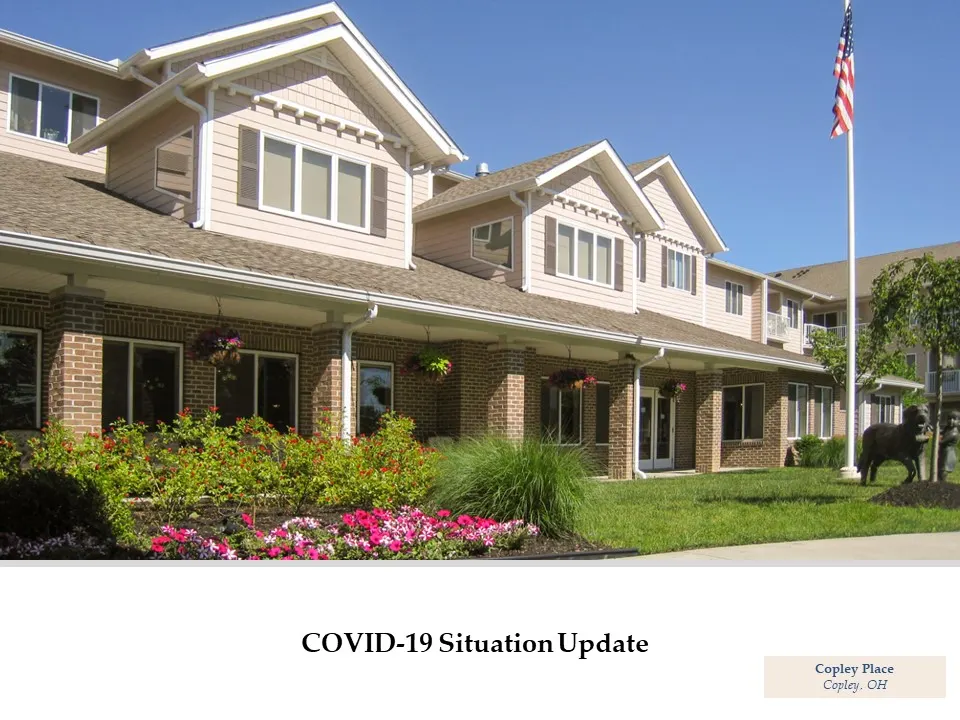
COVID-19 Situation Update Copley PlaceCopley, OH
Slide 10: Known COVID-19 Cases & Status
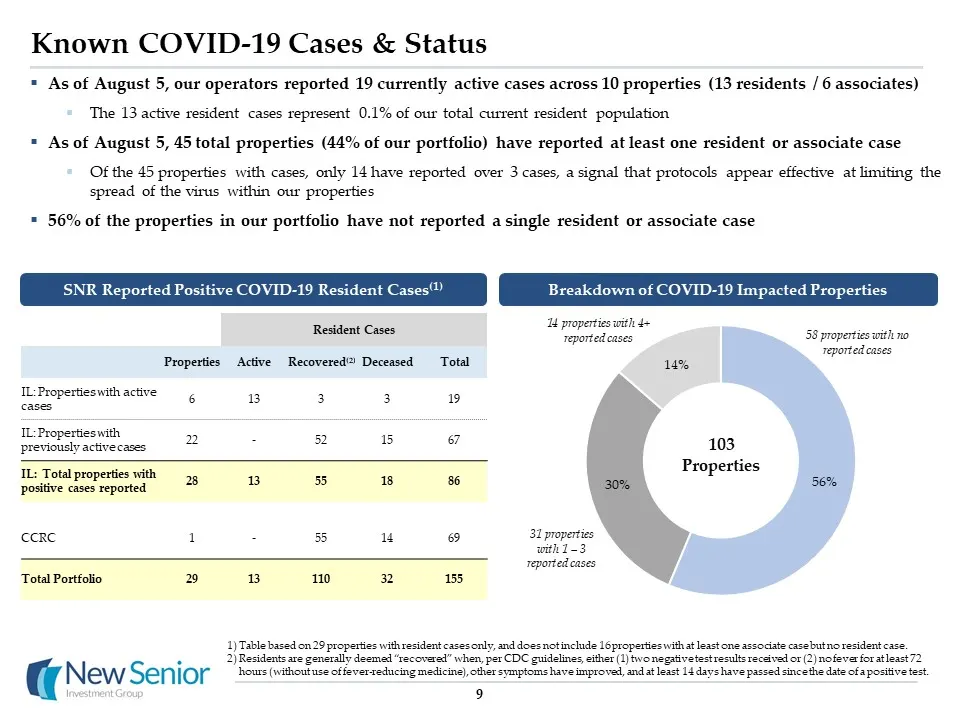
Known COVID-19 Cases & Status Table based on 29 properties with resident cases only, and does not include 16 properties with at least one associate case but no resident case.Residents are generally deemed “recovered” when, per CDC guidelines, either (1) two negative test results received or (2) no f
Slide 11: Trend of New COVID-19 Cases
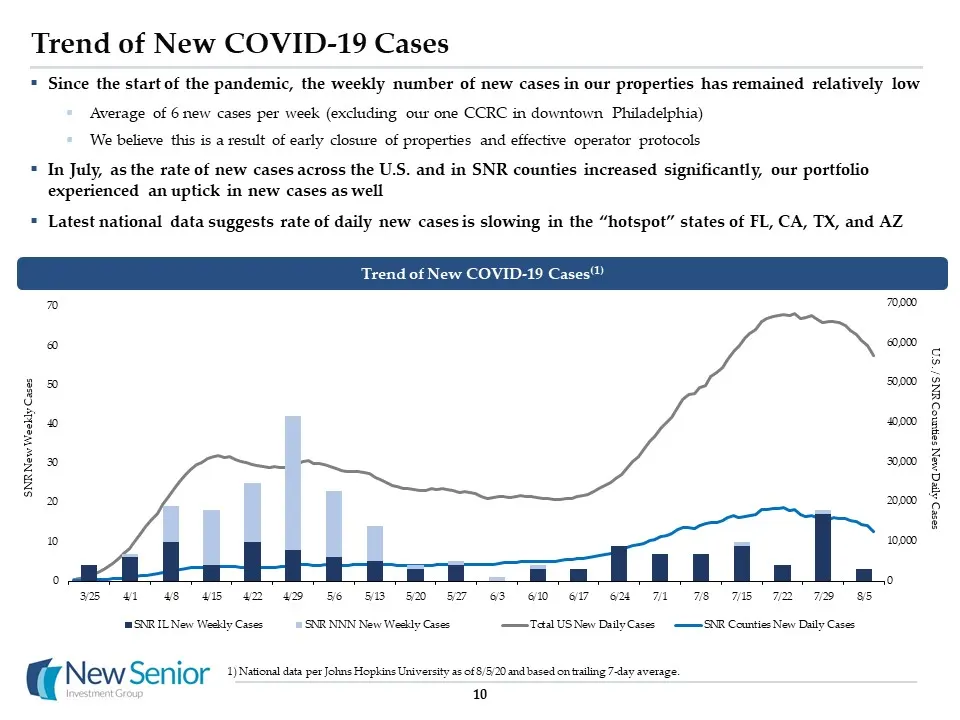
Trend of New COVID-19 Cases Since the start of the pandemic, the weekly number of new cases in our properties has remained relatively lowAverage of 6 new cases per week (excluding our one CCRC in downtown Philadelphia)We believe this is a result of early closure of properties and effective operator
Slide 12: Status of Our Properties
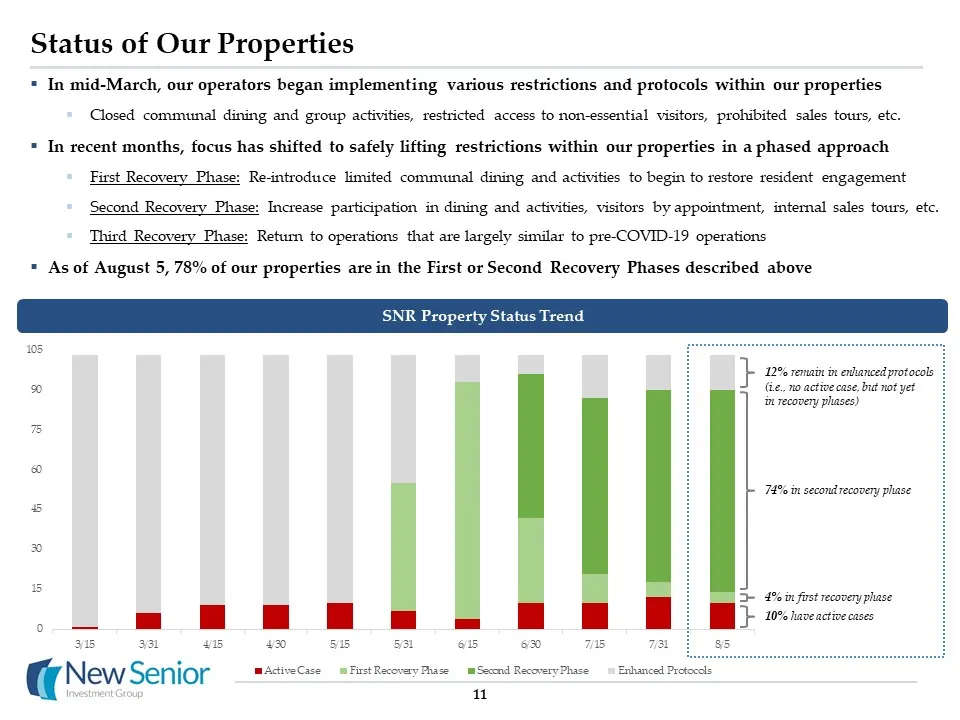
11 Status of Our Properties In mid-March, our operators began implementing various restrictions and protocols within our propertiesClosed communal dining and group activities, restricted access to non-essential visitors, prohibited sales tours, etc.In recent months, focus has shifted to safely lifti
Slide 13: Financial Update
Financial Update The JeffersonMiddleton, WI
Slide 14: Key Observations From COVID-19 Impact To Date
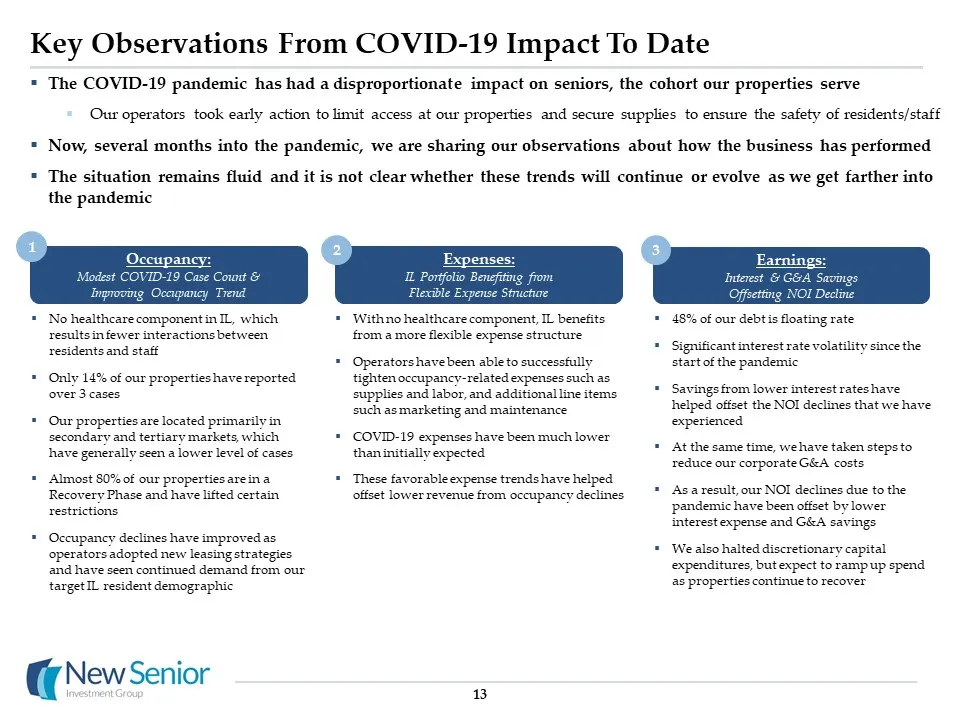
Key Observations From COVID-19 Impact To Date 13 Occupancy:Modest COVID-19 Case Count & Improving Occupancy Trend Expenses:IL Portfolio Benefiting from Flexible Expense Structure Earnings:Interest & G&A Savings Offsetting NOI Decline No healthcare component in IL, which results in fewer interactions
Slide 15: Summary of 2Q 2020 Results & July Trends
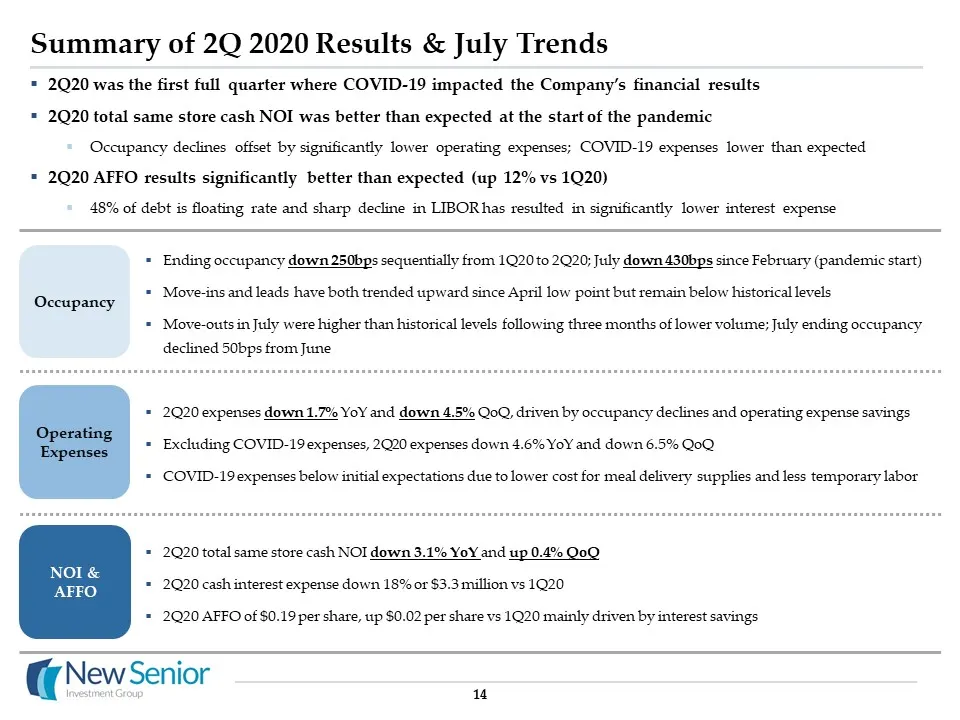
Summary of 2Q 2020 Results & July Trends 14 Ending occupancy down 250bps sequentially from 1Q20 to 2Q20; July down 430bps since February (pandemic start) Move-ins and leads have both trended upward since April low point but remain below historical levelsMove-outs in July were higher than historical
Slide 16: Year-to-Date Results / Financial Results – 2Q 2020
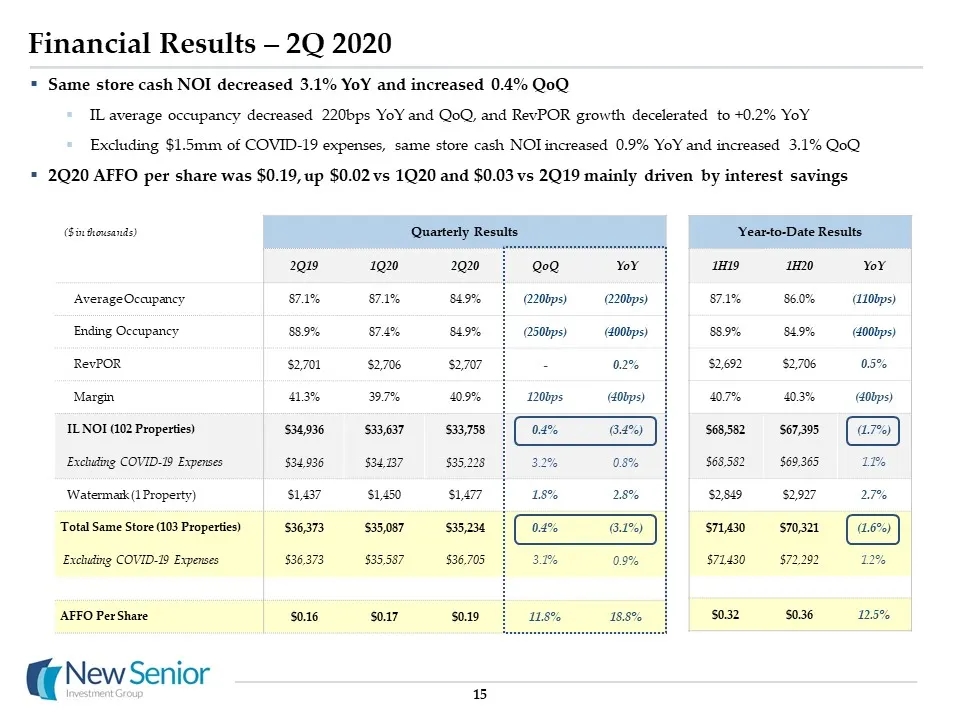
Year-to-Date Results 1H19 1H20 YoY 87.1% 86.0% (110bps) 88.9% 84.9% (400bps) $2,692 $2,706 0.5% 40.7% 40.3% (40bps) $68,582 $67,395 (1.7%) $68,582 $69,365 1.1% $2,849 $2,927 2.7% $71,430 $70,321 (1.6%) $71,430 $72,292 1.2% $0.32 $0.36 12.5% 15 Financial Results – 2Q 2020 Same store cash NOI decrease
Slide 17: Lead and Move-in Trends
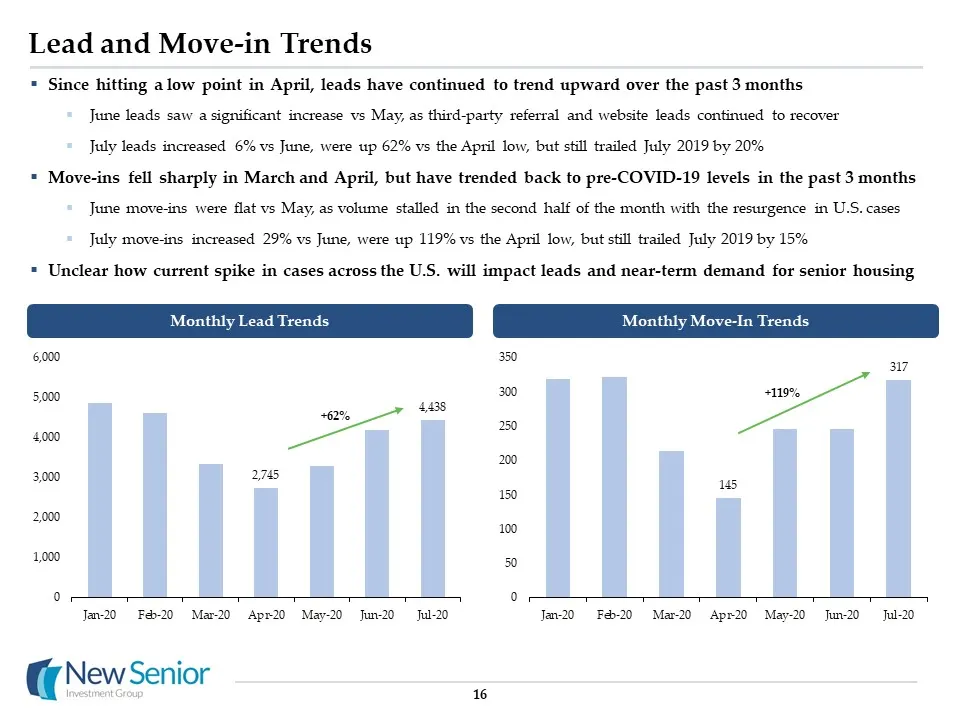
Lead and Move-in Trends 16 Monthly Lead Trends Monthly Move-In Trends +62% +119% Since hitting a low point in April, leads have continued to trend upward over the past 3 monthsJune leads saw a significant increase vs May, as third-party referral and website leads continued to recoverJuly leads incre
Slide 18: Move-Out and Occupancy Trends
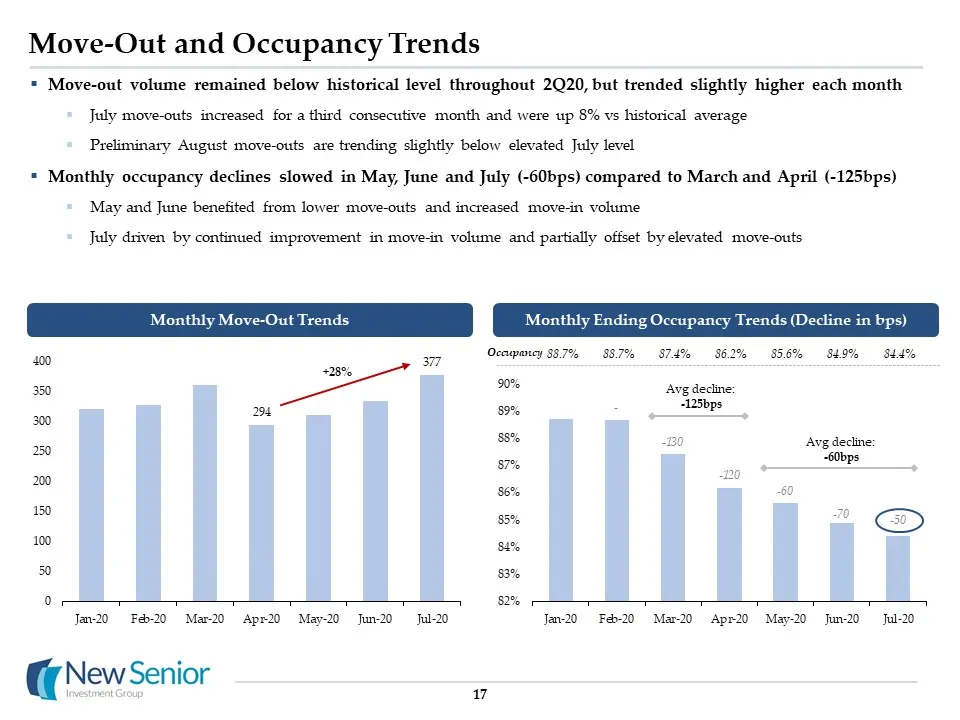
Move-Out and Occupancy Trends 17 Monthly Move-Out Trends Monthly Ending Occupancy Trends (Decline in bps) +28% Move-out volume remained below historical level throughout 2Q20, but trended slightly higher each monthJuly move-outs increased for a third consecutive month and were up 8% vs historical av
Slide 19: Expense – Trends
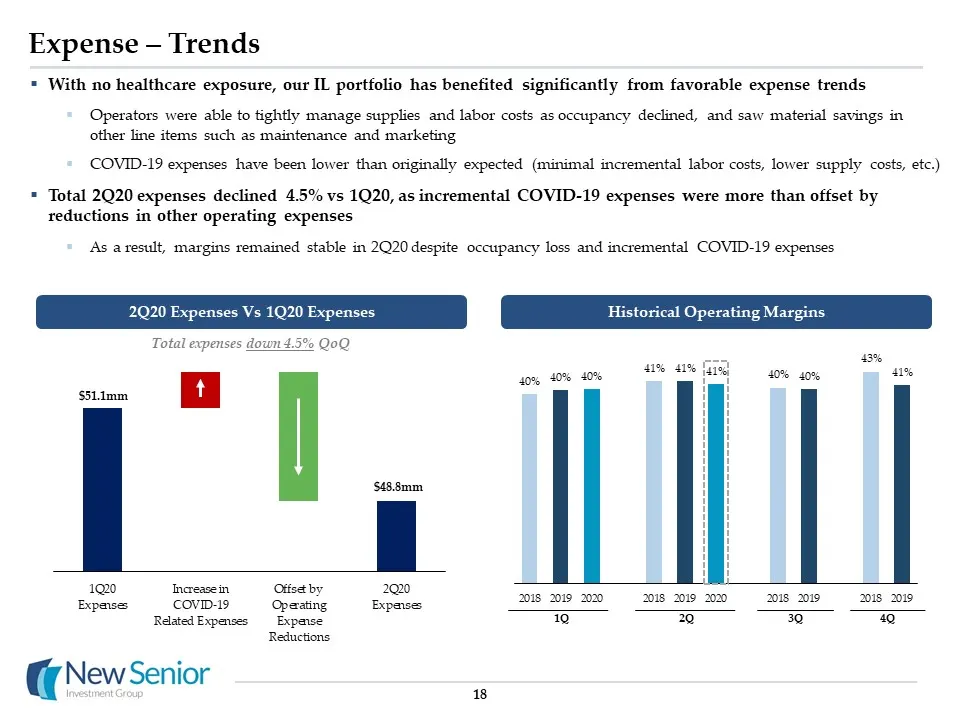
18 Expense – Trends With no healthcare exposure, our IL portfolio has benefited significantly from favorable expense trendsOperators were able to tightly manage supplies and labor costs as occupancy declined, and saw material savings in other line items such as maintenance and marketingCOVID-19 expe
Slide 20: Capital Structure, Debt Maturities & Liquidity
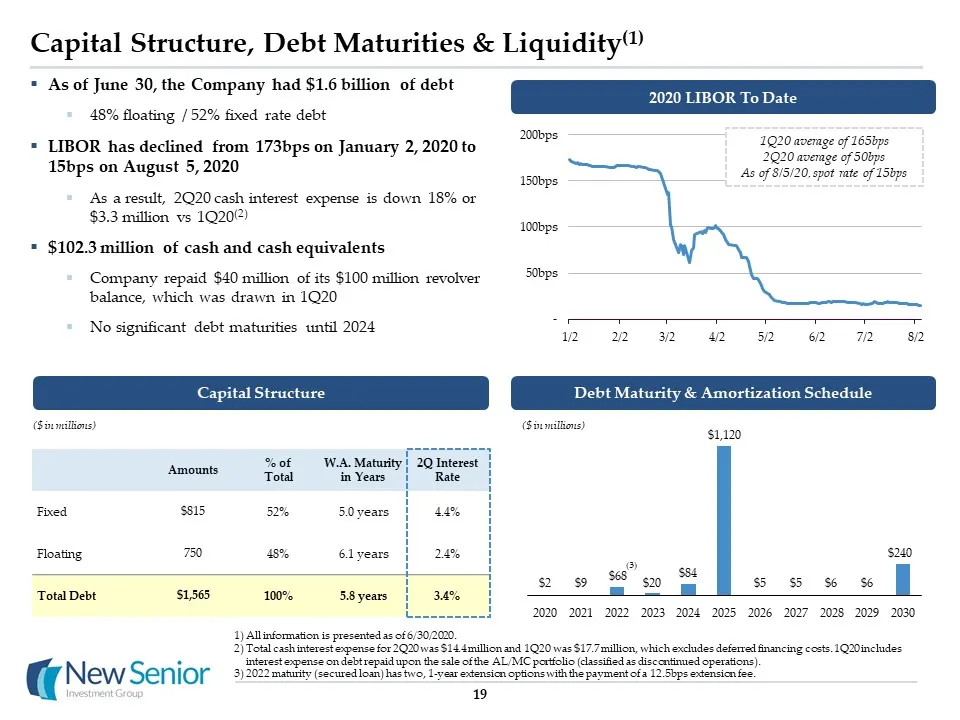
Capital Structure, Debt Maturities & Liquidity(1) All information is presented as of 6/30/2020. Total cash interest expense for 2Q20 was $14.4 million and 1Q20 was $17.7 million, which excludes deferred financing costs. 1Q20 includes interest expense on debt repaid upon the sale of the AL/MC portfol
Slide 21: Full Year 2020 Expectations
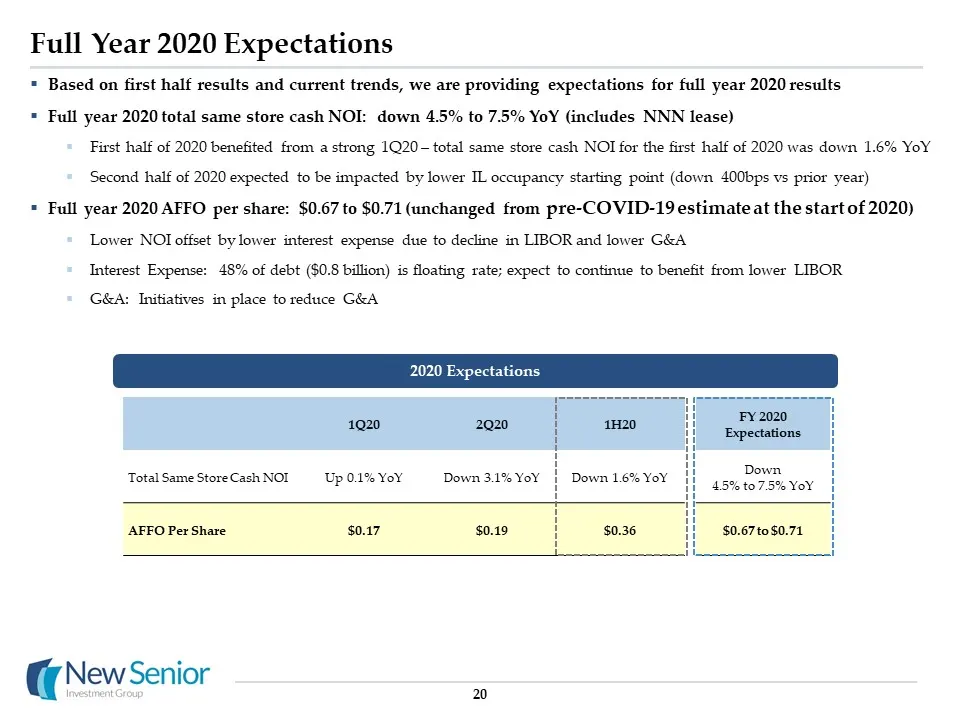
Full Year 2020 Expectations 20 Based on first half results and current trends, we are providing expectations for full year 2020 results Full year 2020 total same store cash NOI: down 4.5% to 7.5% YoY (includes NNN lease)First half of 2020 benefited from a strong 1Q20 – total same store cash NOI for
Slide 22: Reconciliations & Glossary
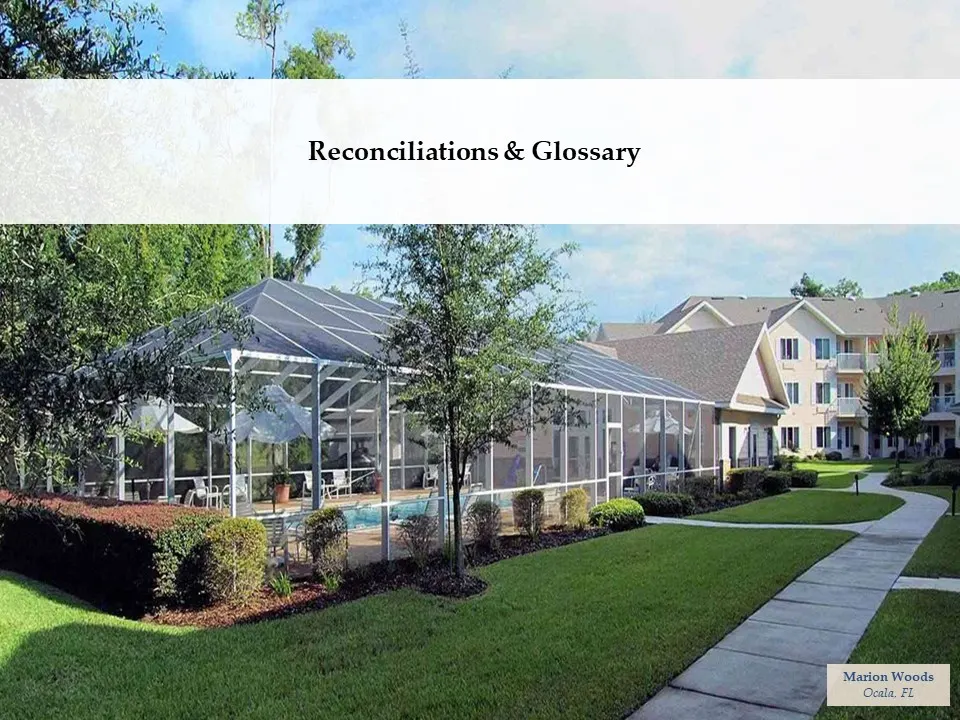
Reconciliations & Glossary Marion WoodsOcala, FL
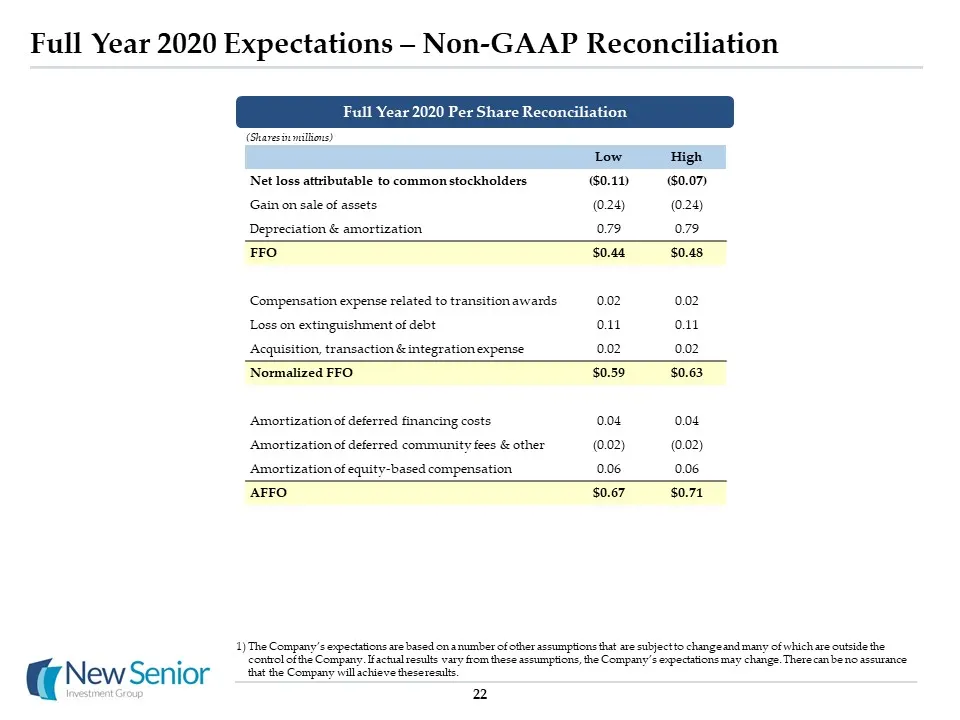
Slide 23: Full Year 2020 Expectations – Non-GAAP Reconciliation
Full Year 2020 Expectations – Non-GAAP Reconciliation 22 Low High Net loss attributable to common stockholders ($0.11) ($0.07) Gain on sale of assets (0.24) (0.24) Depreciation & amortization 0.79 0.79 FFO $0.44 $0.48 Compensation expense related to transition awards 0.02 0.02 Loss on extinguishment
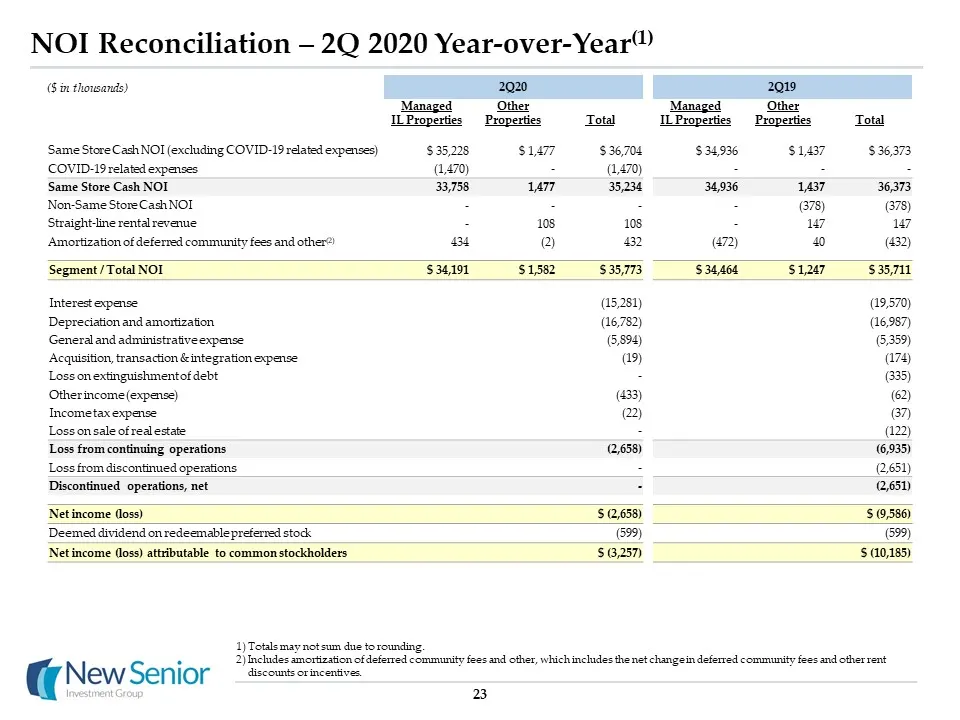
Slide 24: NOI Reconciliation – 2Q20 vs 2Q19
2Q20 2Q19 Managed IL Properties Other Properties Total Managed IL Properties Other Properties Total Same Store Cash NOI (excluding COVID-19 related expenses) $ 35,228 $ 1,477 $ 36,704 $ 34,936 $ 1,437 $ 36,373 COVID-19 related expenses (1,470) - (1,470) - - - Same Store Cash NOI 33,758 1,477 35,234
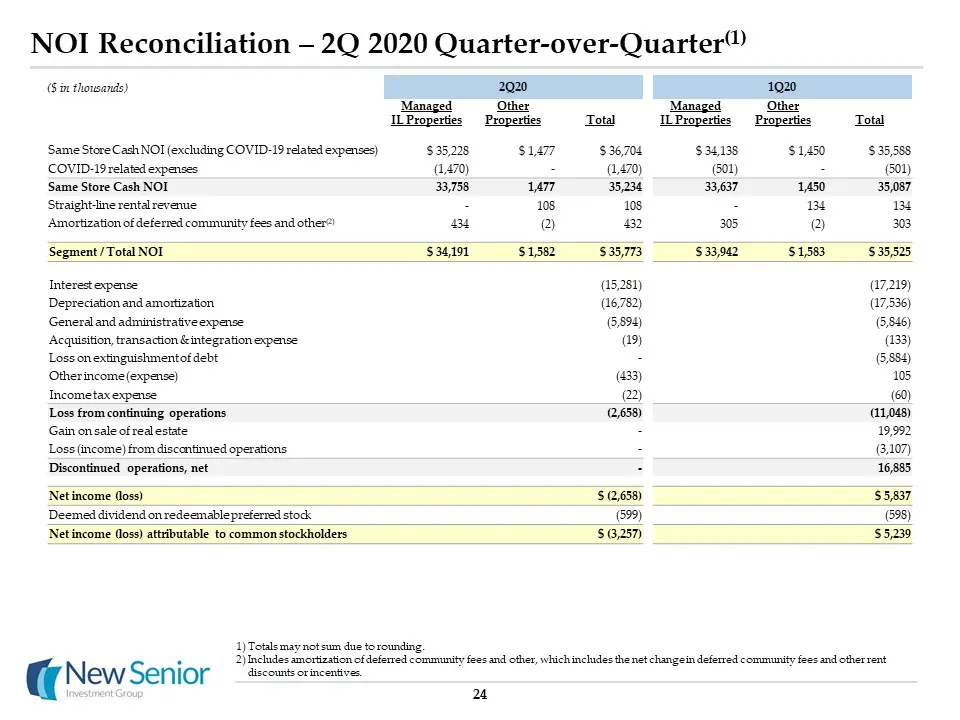
Slide 25: NOI Reconciliation – 2Q 2020 Quarter-over-Quarter
NOI Reconciliation – 2Q 2020 Quarter-over-Quarter(1) 24 Totals may not sum due to rounding.Includes amortization of deferred community fees and other, which includes the net change in deferred community fees and other rent discounts or incentives. 2Q20 1Q20 Managed IL Properties Other Properties Tot
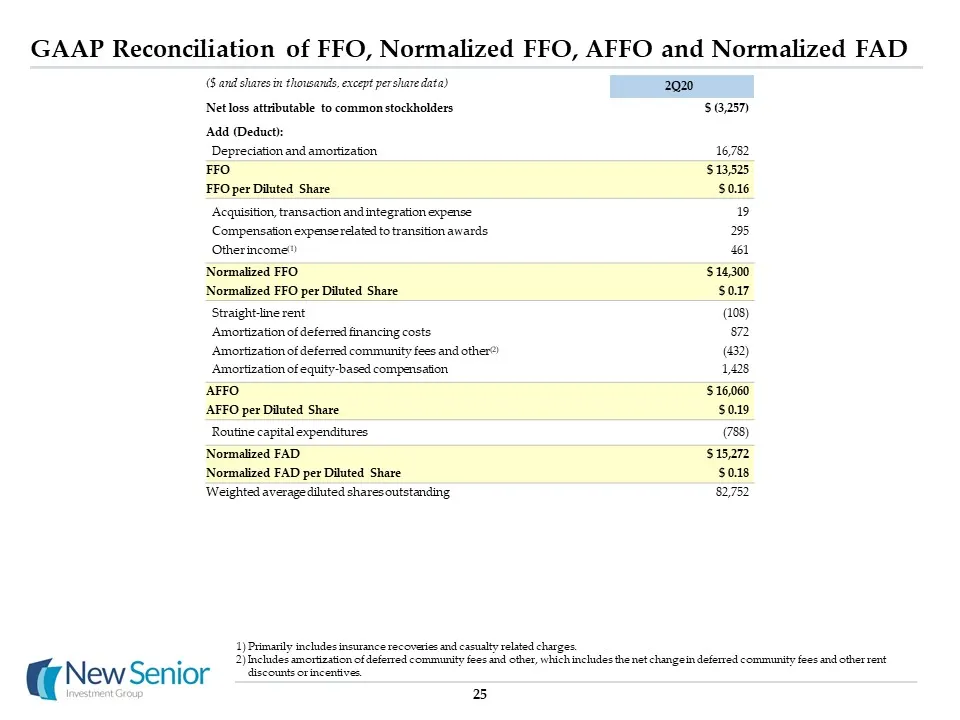
Slide 26: GAAP Reconciliation of FFO, Normalized FFO, AFFO and Normalized FAD
GAAP Reconciliation of FFO, Normalized FFO, AFFO and Normalized FAD 25 Primarily includes insurance recoveries and casualty related charges.Includes amortization of deferred community fees and other, which includes the net change in deferred community fees and other rent discounts or incentives. 2Q2
Slide 27: Glossary
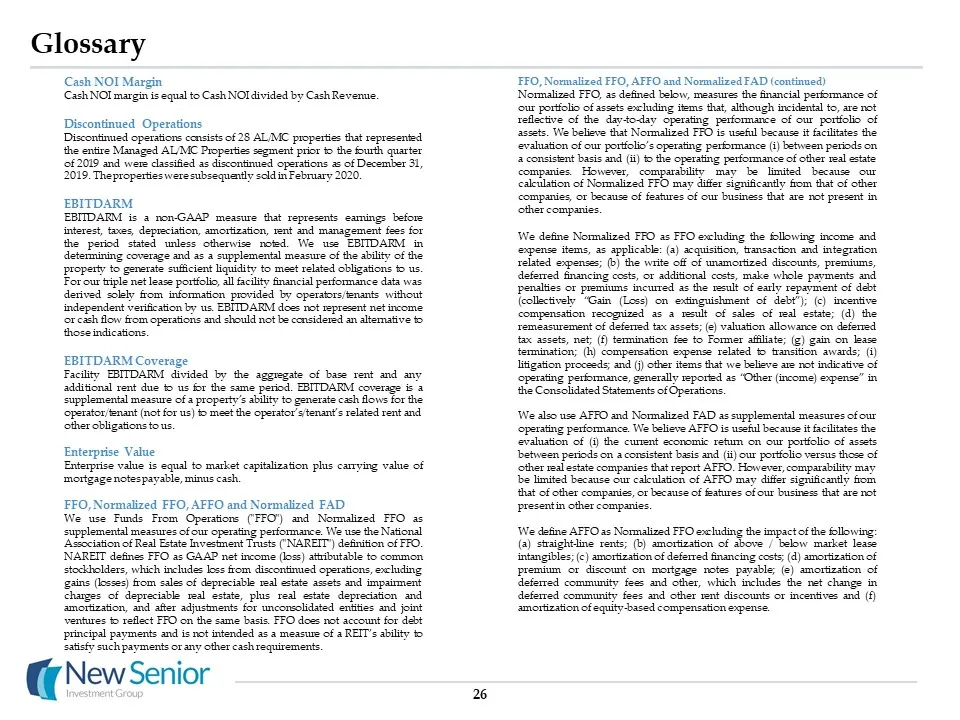
Glossary Cash NOI MarginCash NOI margin is equal to Cash NOI divided by Cash Revenue.Discontinued OperationsDiscontinued operations consists of 28 AL/MC properties that represented the entire Managed AL/MC Properties segment prior to the fourth quarter of 2019 and were classified as discontinued ope
Slide 28: Glossary (continued)
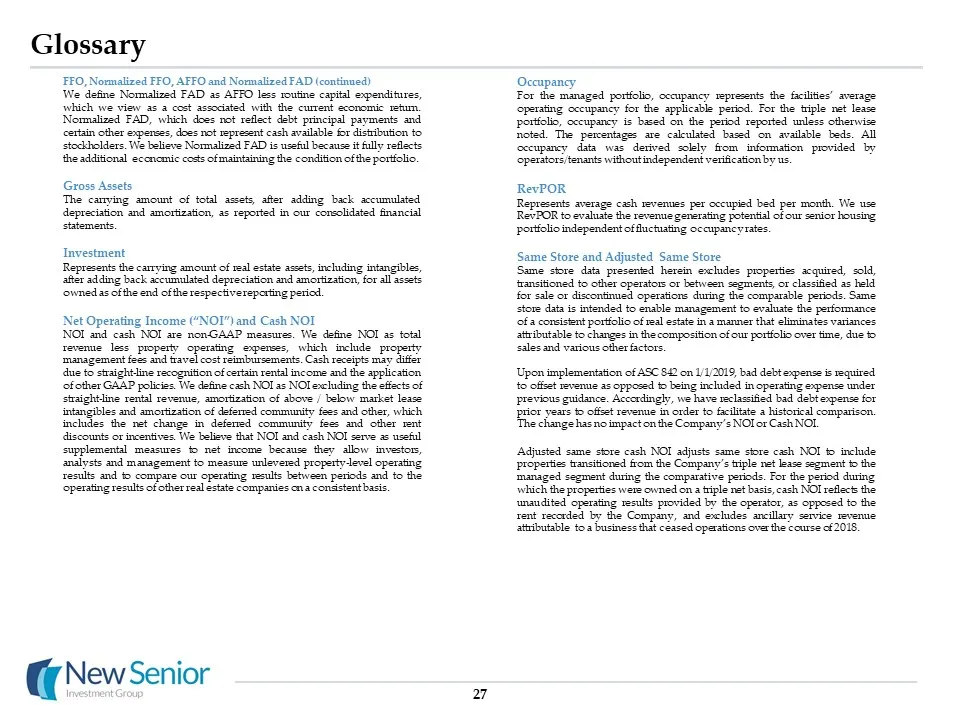
Glossary FFO, Normalized FFO, AFFO and Normalized FAD (continued)We define Normalized FAD as AFFO less routine capital expenditures, which we view as a cost associated with the current economic return. Normalized FAD, which does not reflect debt principal payments and certain other expenses, does no
Source: SEC EDGAR · 8-K filed Aug 7, 2020