Navistar International Corporation
Navistar International — Q3 2015 Earnings Presentation
41 slides from Navistar International's earnings presentation, Sep 2, 2015

Slide 1: Q3 2015 Earnings Presentation
Exhibit 99.2 Q3 2015 EARNINGS PRESENTATION SEPTEMBER 2, 2015 International ® , Inc. is a registered trademark of
Slide 2: Safe Harbor Statement and Other Cautionary Notes
Safe Harbor Statement and Other Cautionary Notes Information provided and statements contained in this presentation that are not purely historical are forward-looking statements within the meaning of Section 27A of the Securities Act of 1933, as amended, Section 21E of the Securities Exchange Act of
Slide 3: Agenda
Agenda Overview Troy Clarke Financial Results Walter Borst Summary Troy Clarke NYSE: NAV 3 Q3 2015 Earnings – 9/2/2015
Slide 4: 3rd Quarter 2015 Results
3RD QUARTER 2015 RESULTS Troy Clarke, President & CEO NYSE: NAV
Slide 5: 3rd Quarter Summary
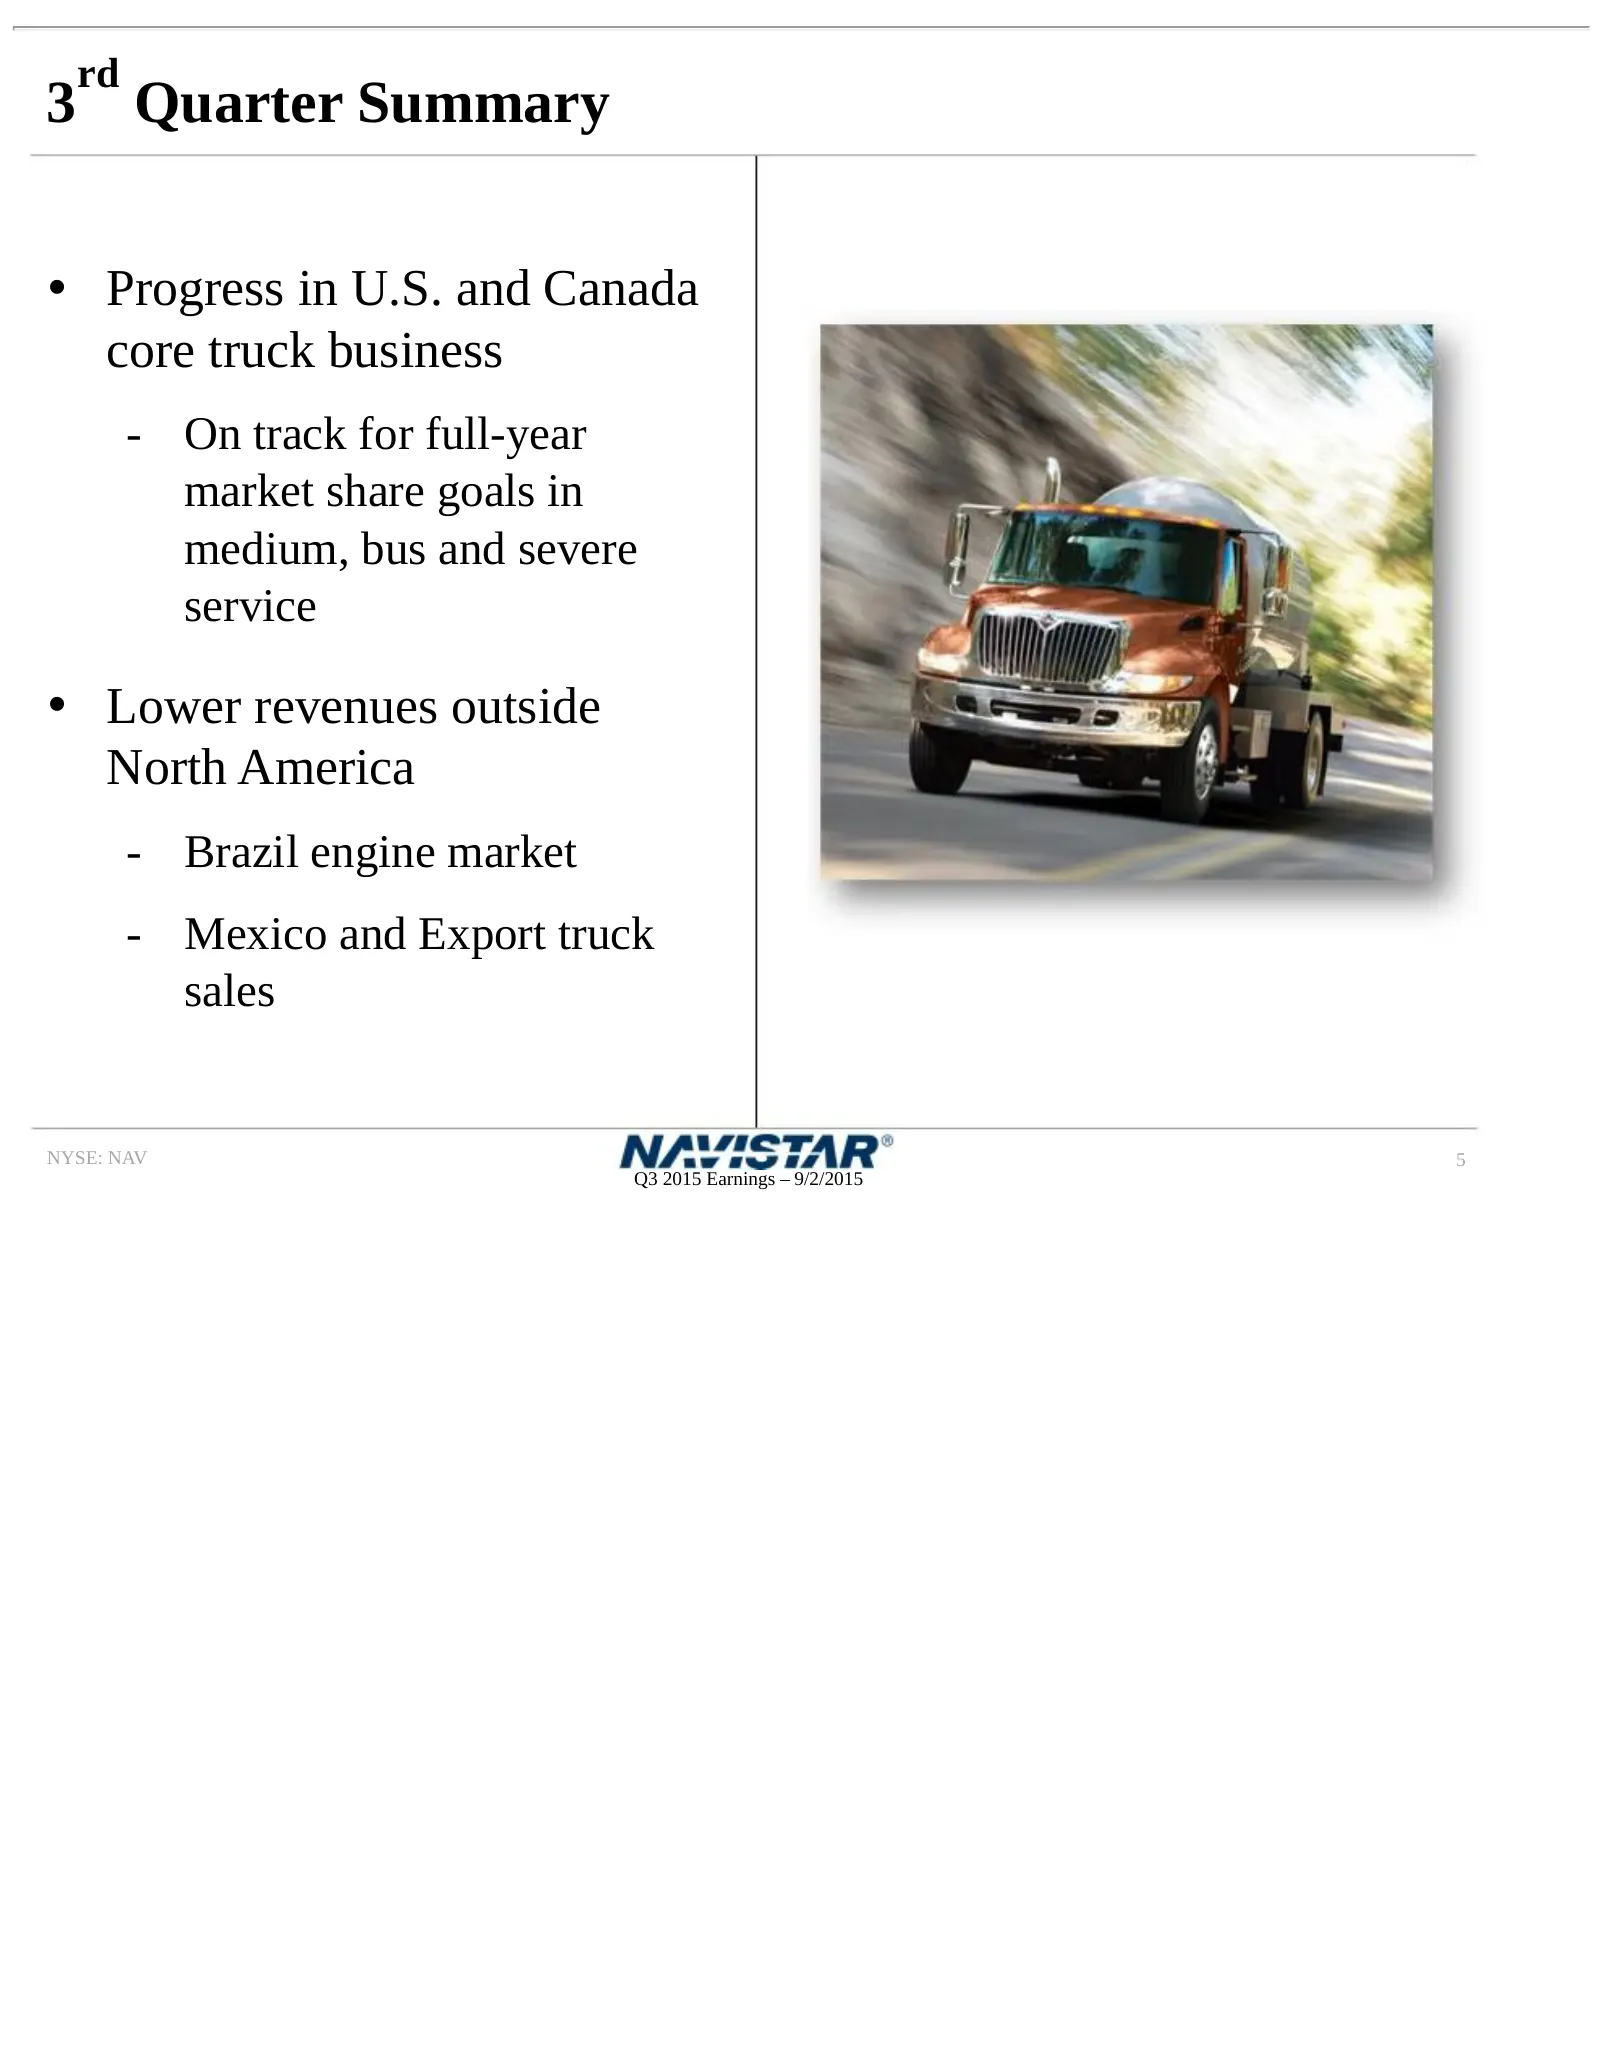
rd 3 Quarter Summary • Progress in U.S. and Canada core truck business - On track for full-year market share goals in medium, bus and severe service • Lower revenues outside North America - Brazil engine market - Mexico and Export truck sales NYSE: NAV 5 Q3 2015 Earnings – 9/2/2015
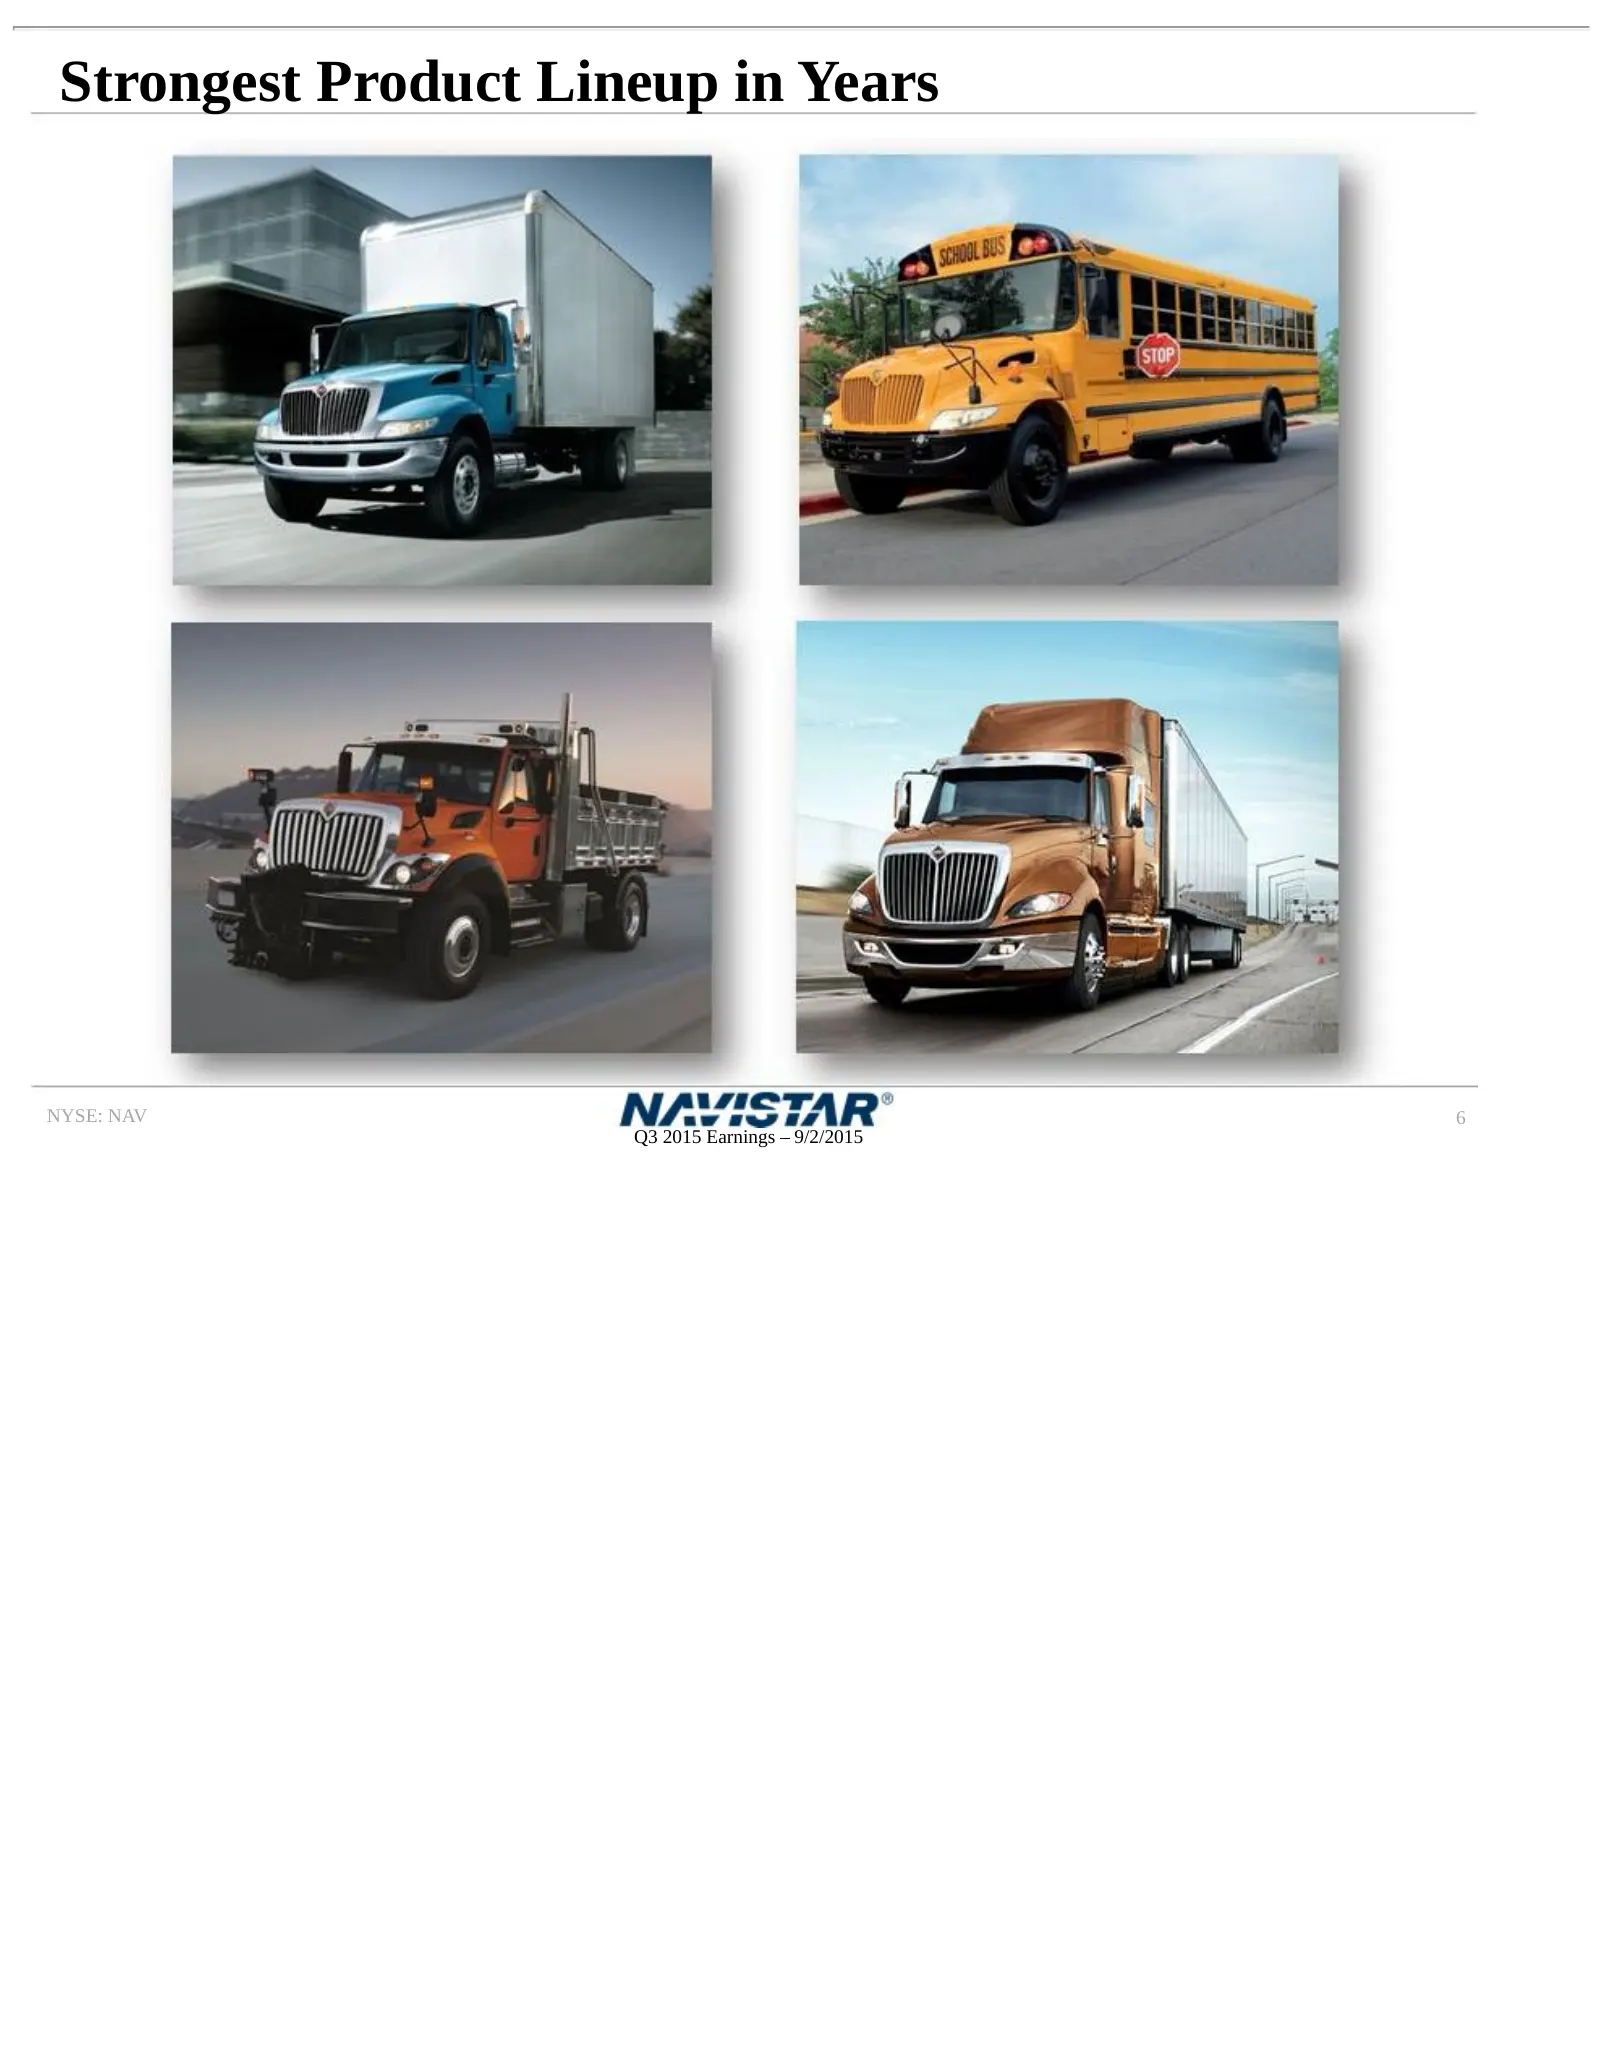
Slide 6: Strongest Product Lineup in Years
Strongest Product Lineup in Years NYSE: NAV 6 Q3 2015 Earnings – 9/2/2015
Slide 7: Next Phase Cost Alignments
Next Phase Cost Alignments • Three years of strong progress • Actively planning for additional cost improvements - Structural costs - Material costs - Manufacturing efficiencies • Improved competitiveness - Profitable market share - Support key strategic investments NYSE: NAV 7 Q3 2015 Earnings – 9/
Slide 8: Financial Results
FINANCIAL RESULTS Walter Borst, Executive Vice President & CFO NYSE: NAV
Slide 9: Income Statement Summary
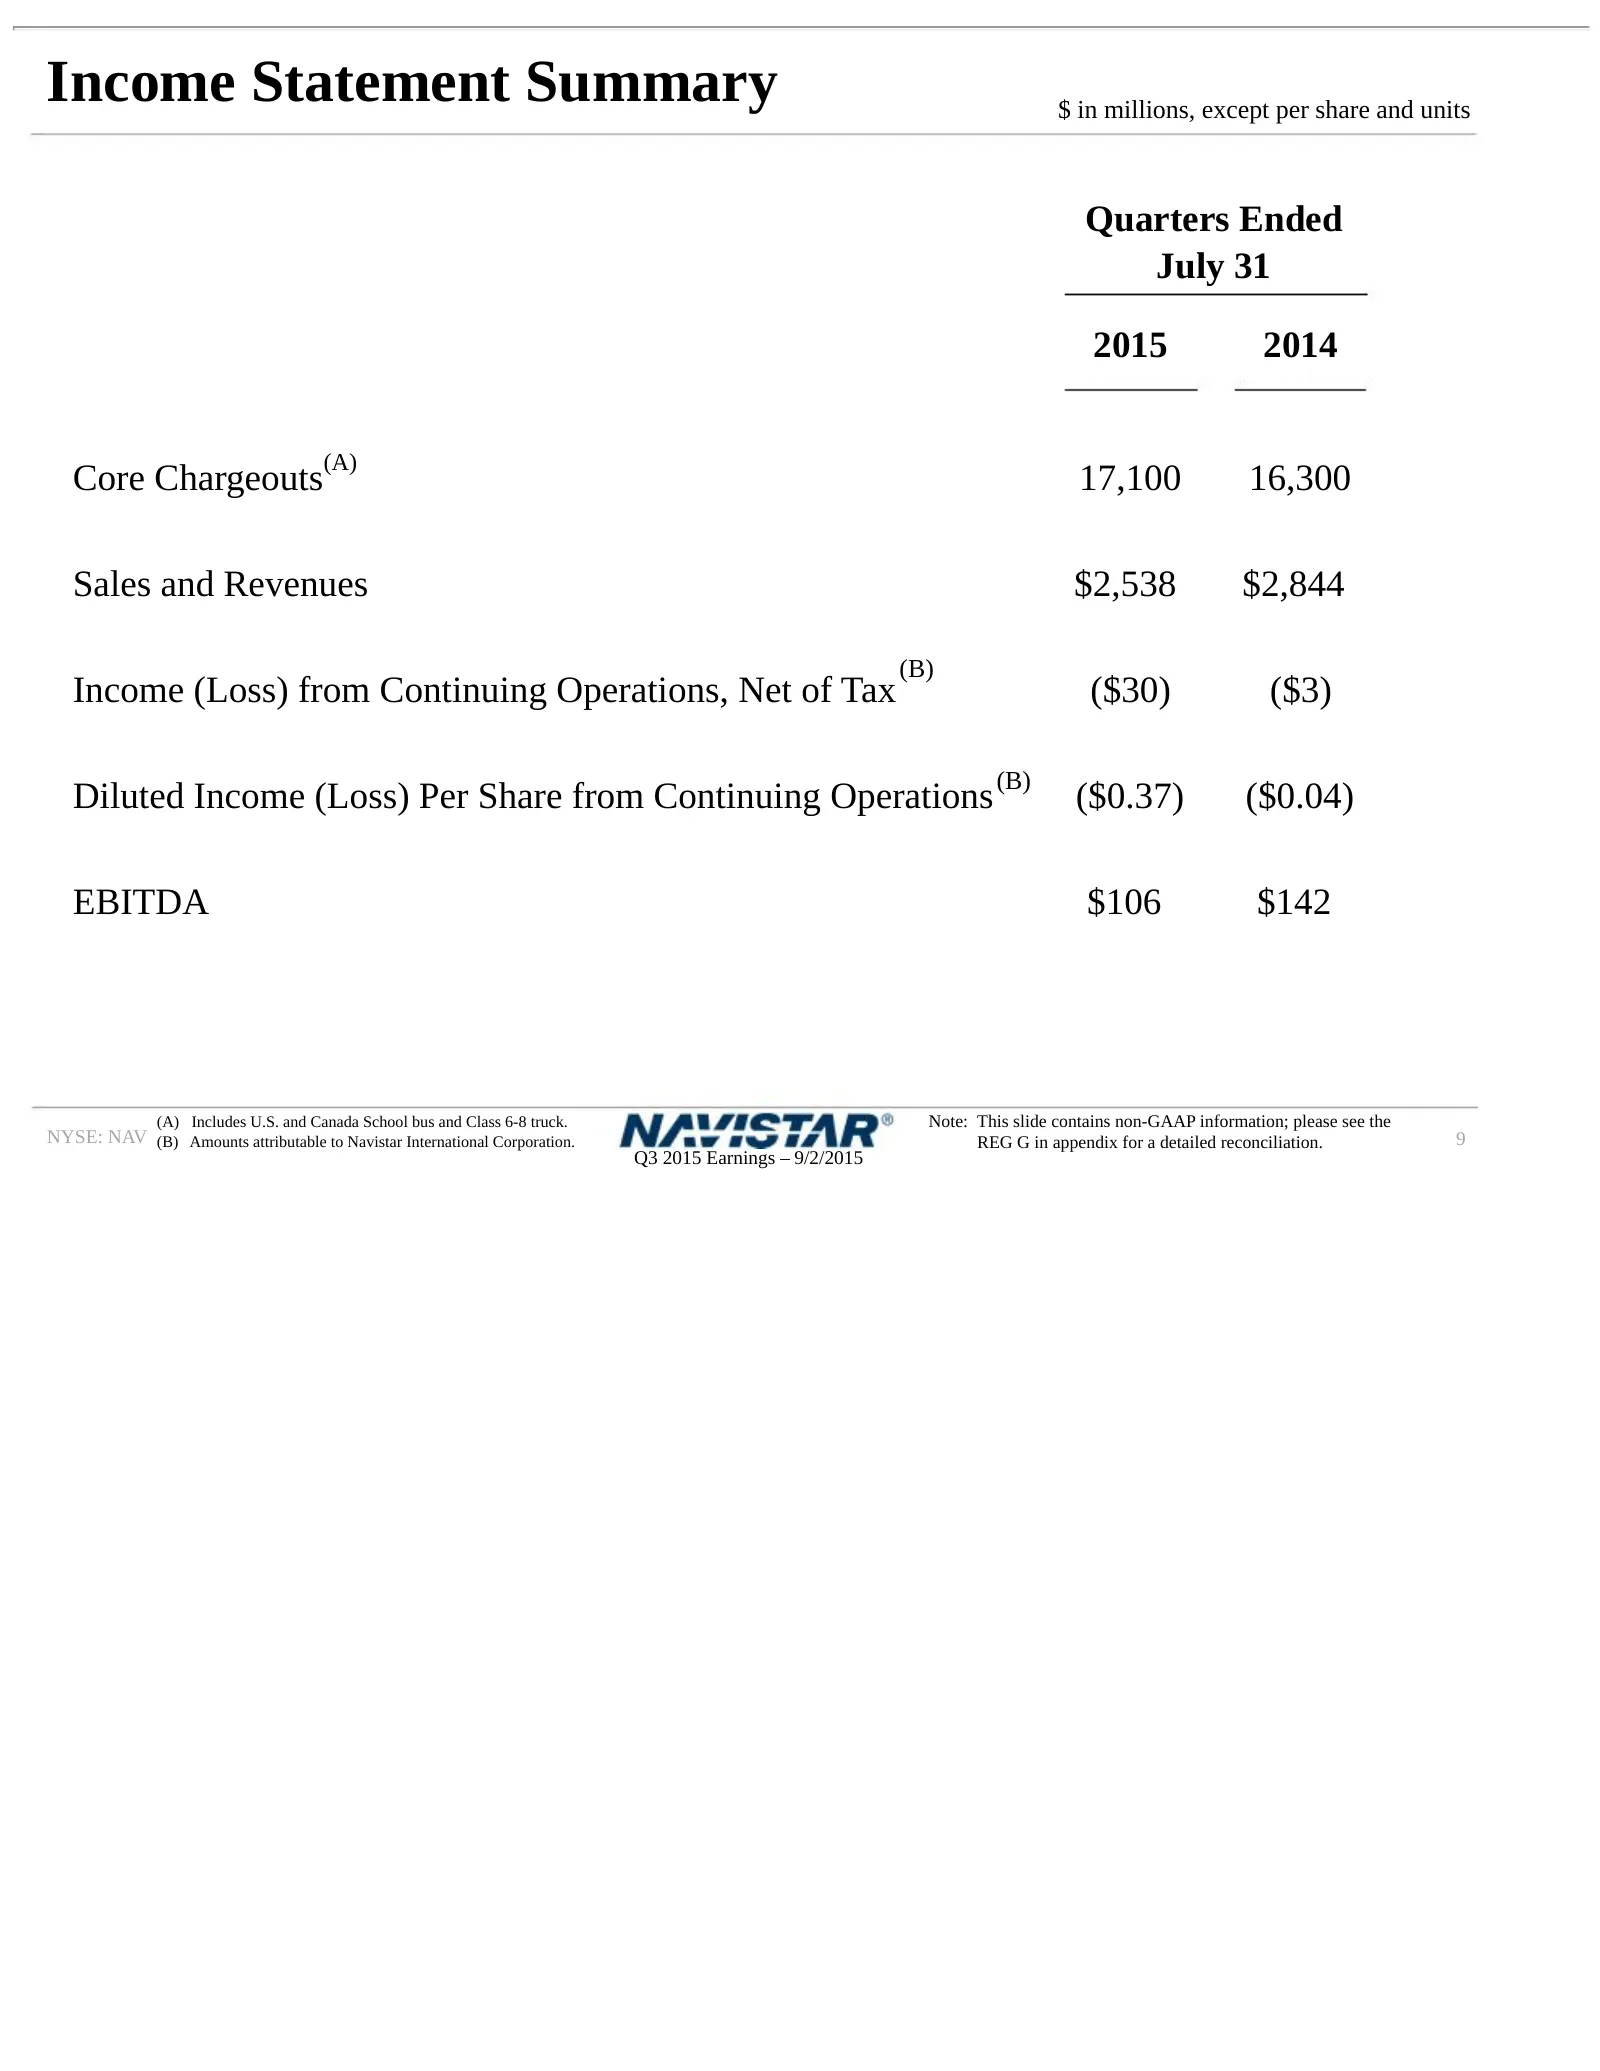
Income Statement Summary $ in millions, except per share and units Quarters Ended July 31 2015 2014 (A) Core Chargeouts 17,100 16,300 Sales and Revenues $2,538 $2,844 (B) Income (Loss) from Continuing Operations, Net of Tax ($30) ($3) (B) Diluted Income (Loss) Per Share from Continuing Operations ($
Slide 10: Q3 2015 Adjusted EBITDA Within Guidance
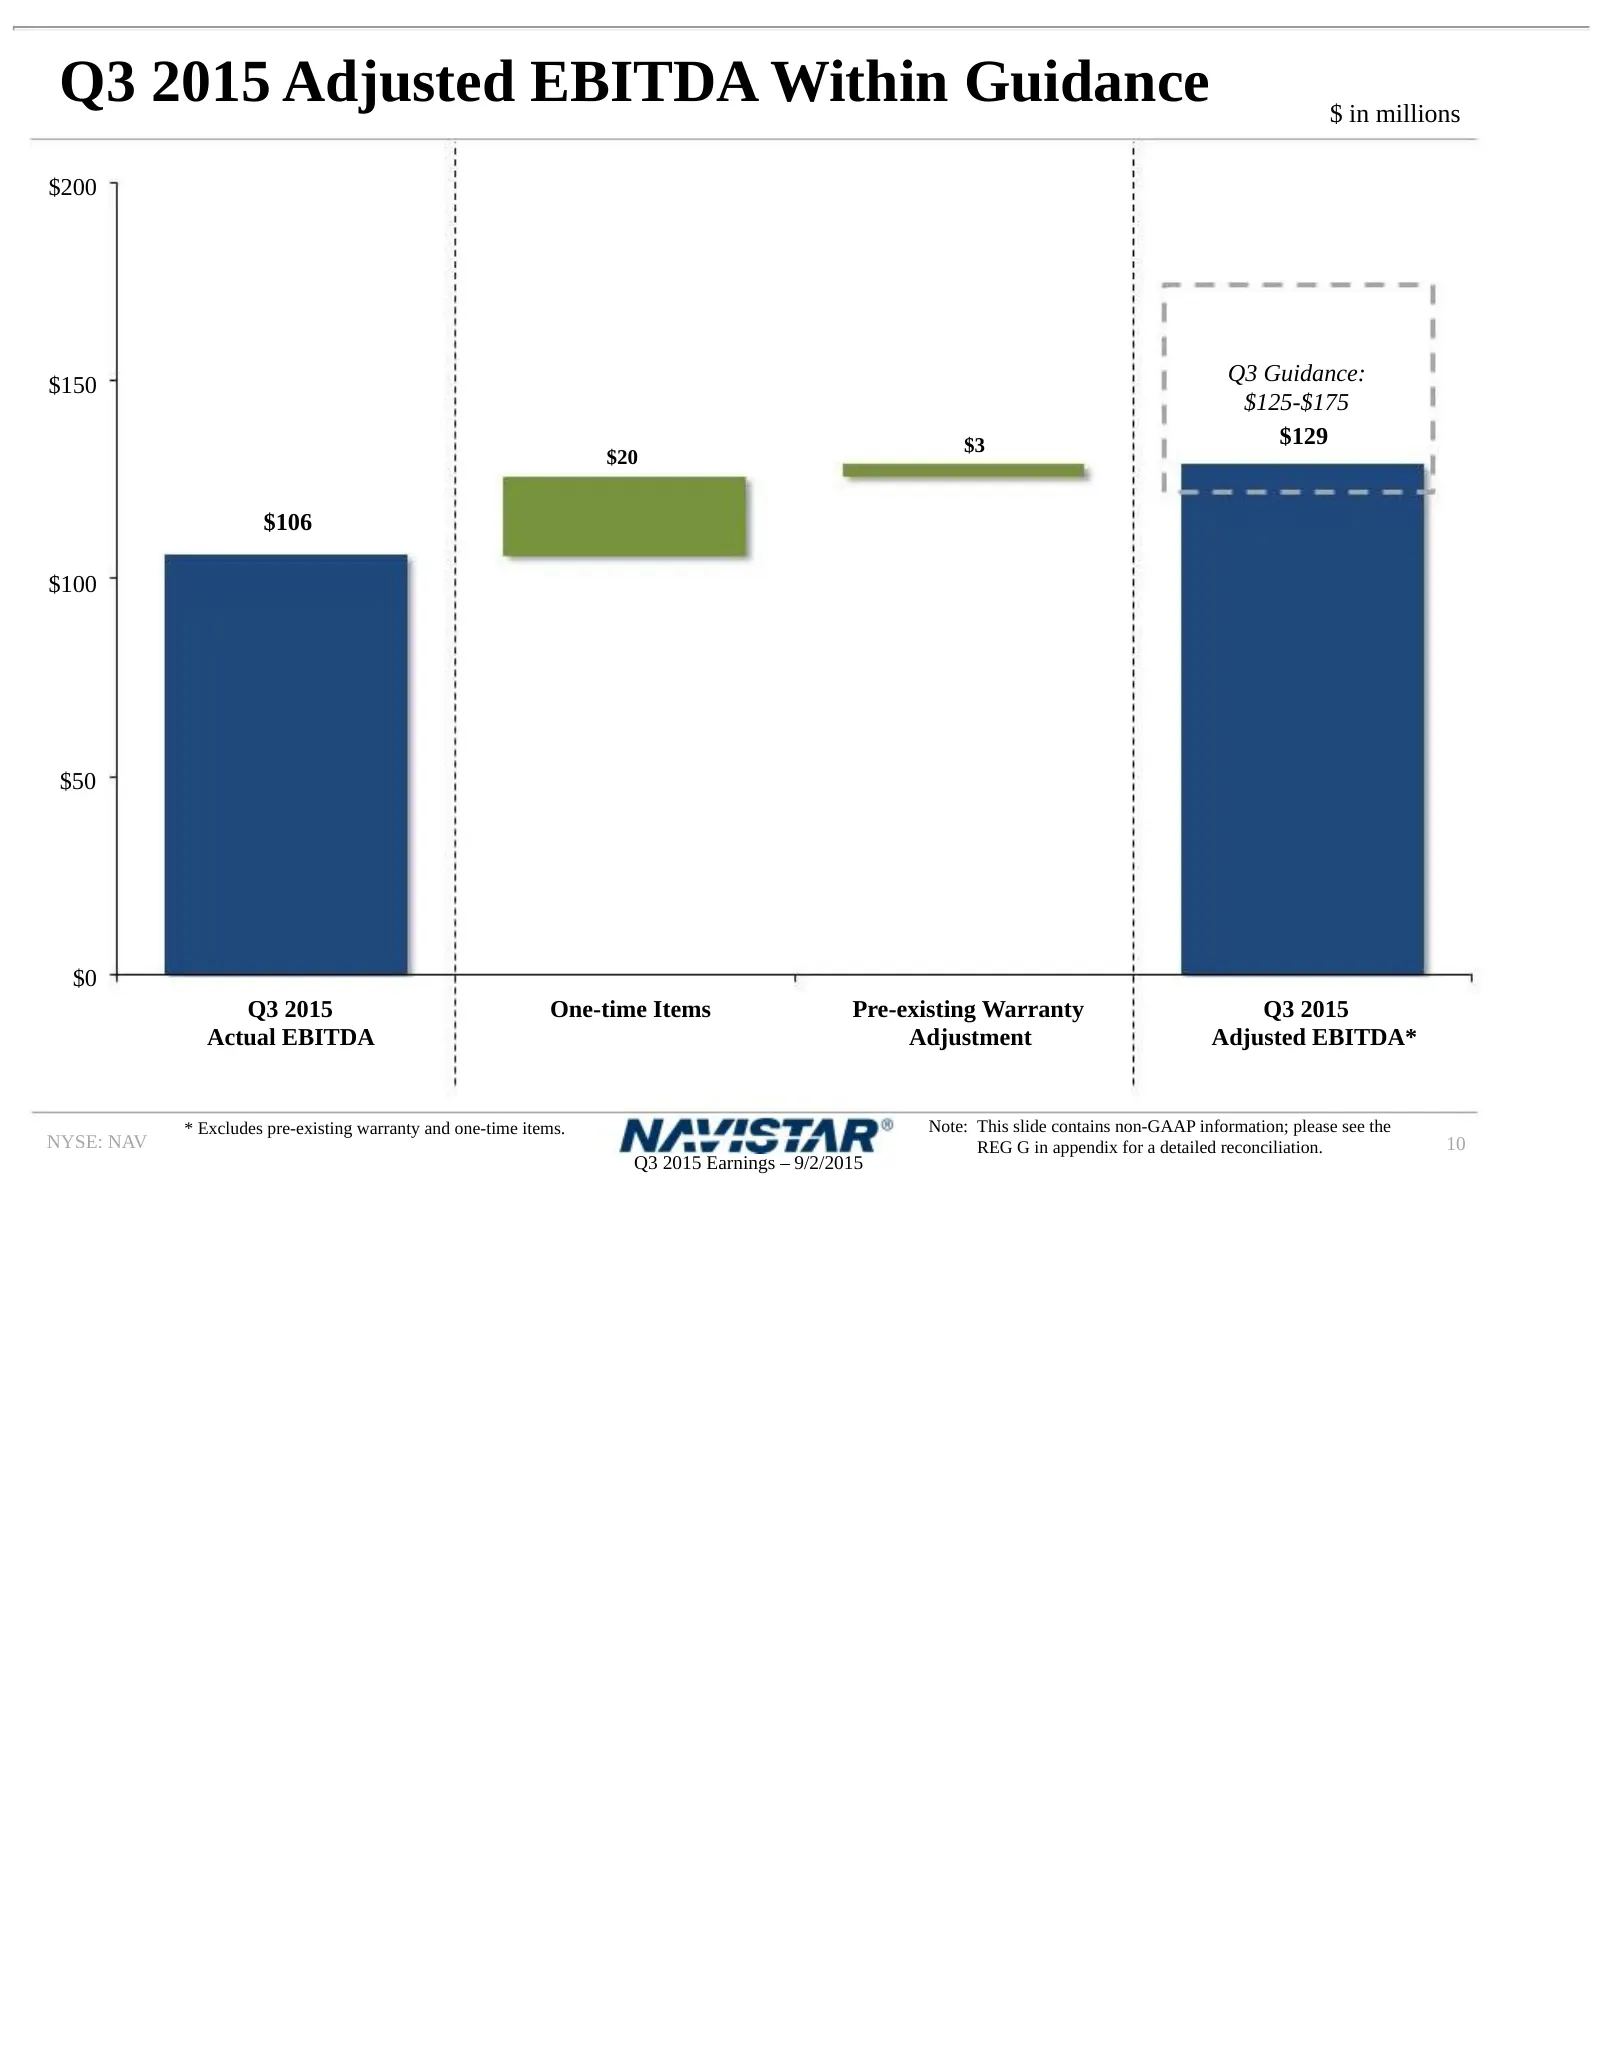
Q3 2015 Adjusted EBITDA Within Guidance $ in millions $200 $150 Q3 Guidance: $125-$175 $3 $129 $20 $106 $100 $50 $0 Q3 2015 One-time Items Pre-existing Warranty Q3 2015 Actual EBITDA Adjustment Adjusted EBITDA* * Excludes pre-existing warranty and one-time items. Note: This slide contains non-GAAP i
Slide 11: Revenue Trends: Core Higher, Global Lower
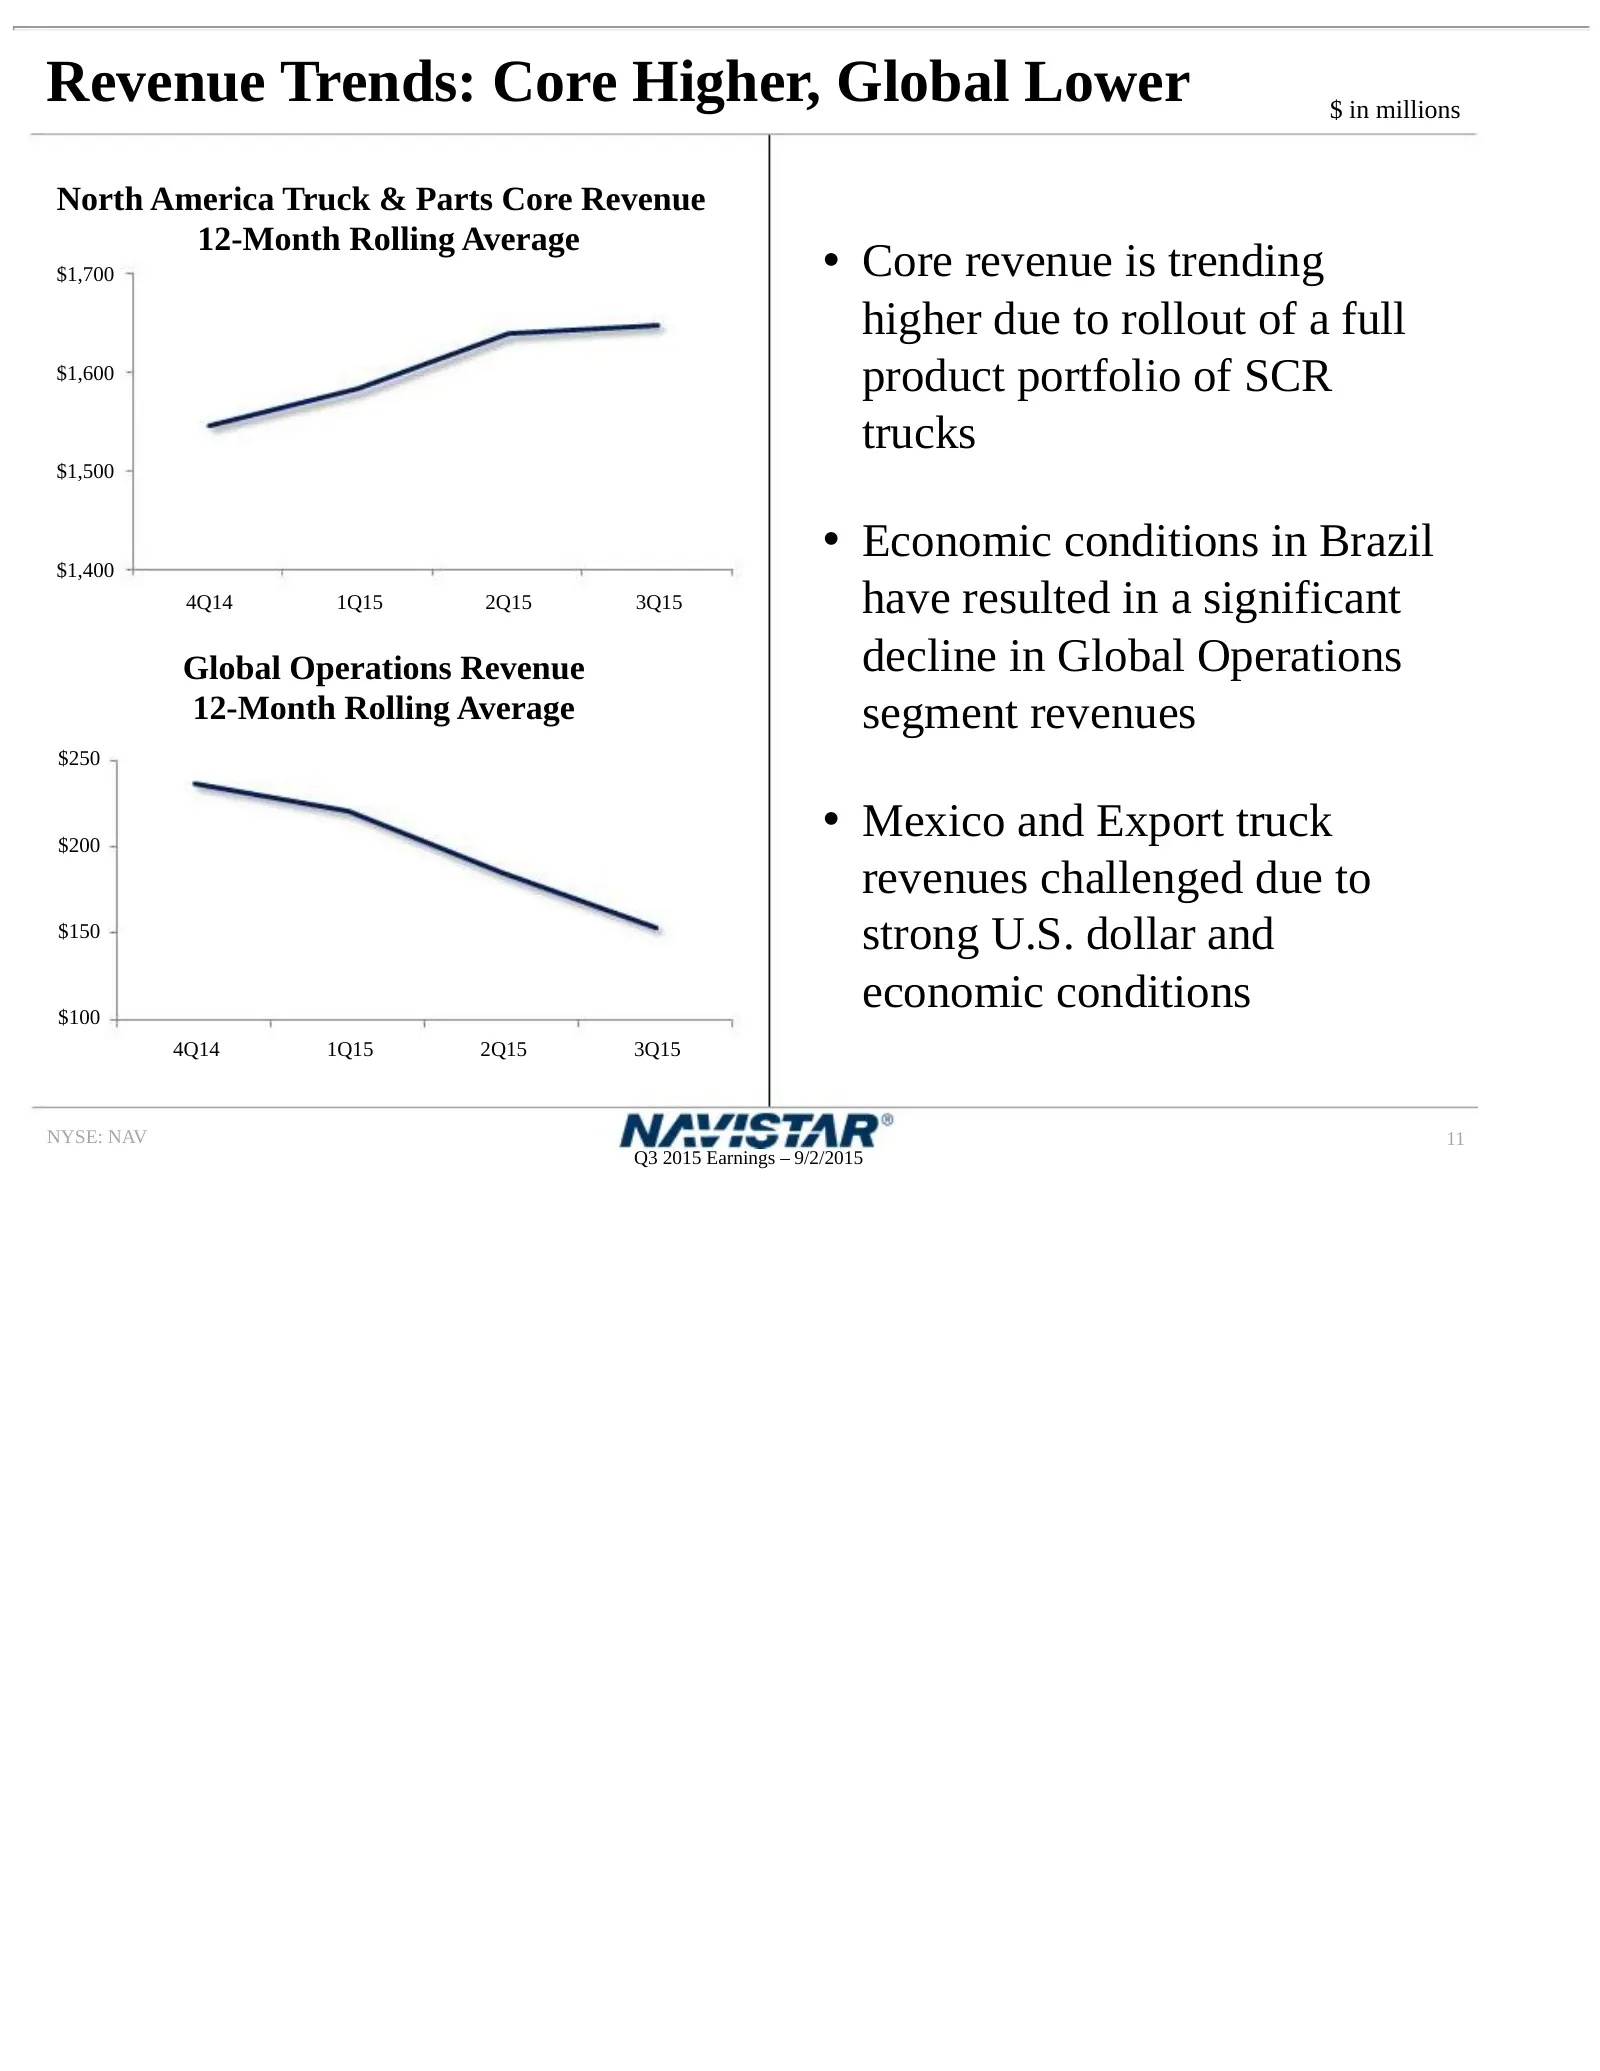
Revenue Trends: Core Higher, Global Lower $ in millions North America Truck & Parts Core Revenue 12-Month Rolling Average $1,700 • Core revenue is trending higher due to rollout of a full $1,600 product portfolio of SCR trucks $1,500 $1,400 • Economic conditions in Brazil 4Q14 1Q15 2Q15 3Q15 have re
Slide 12: Q3 2015 Segment Results
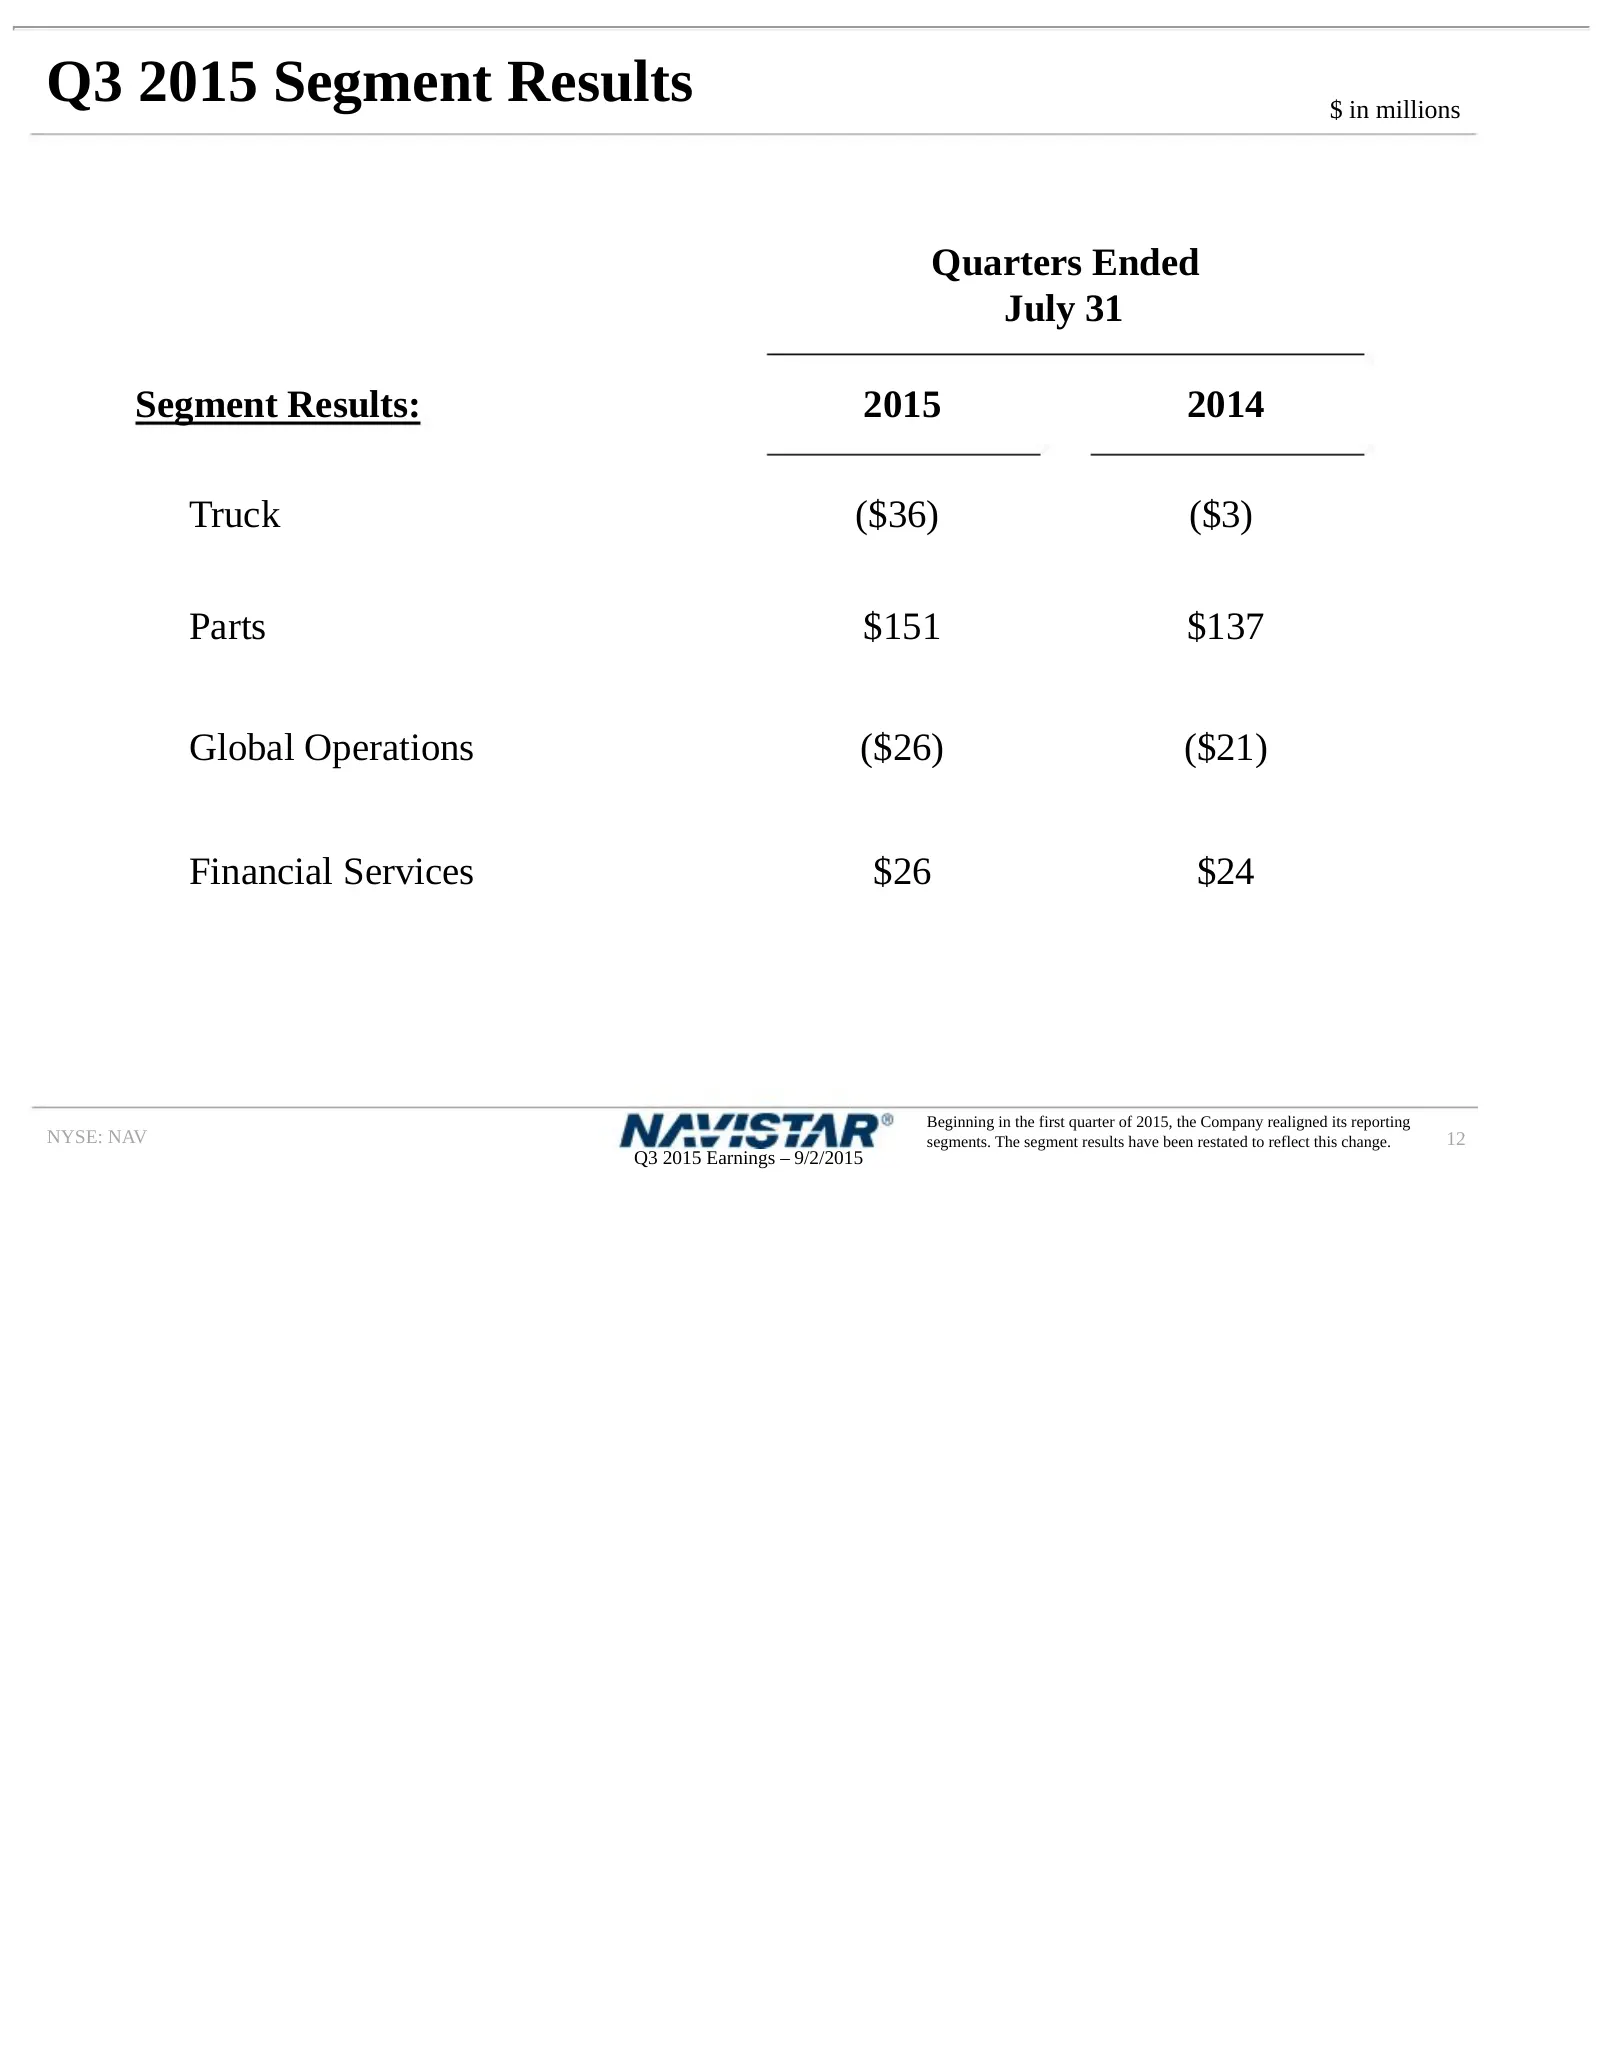
Q3 2015 Segment Results $ in millions Quarters Ended July 31 Segment Results: 2015 2014 Truck ($36) ($3) Parts $151 $137 Global Operations ($26) ($21) Financial Services $26 $24 Beginning in the first quarter of 2015, the Company realigned its reporting NYSE: NAV segments. The segment results have b
Slide 13: Progress Continues in the Third Quarter
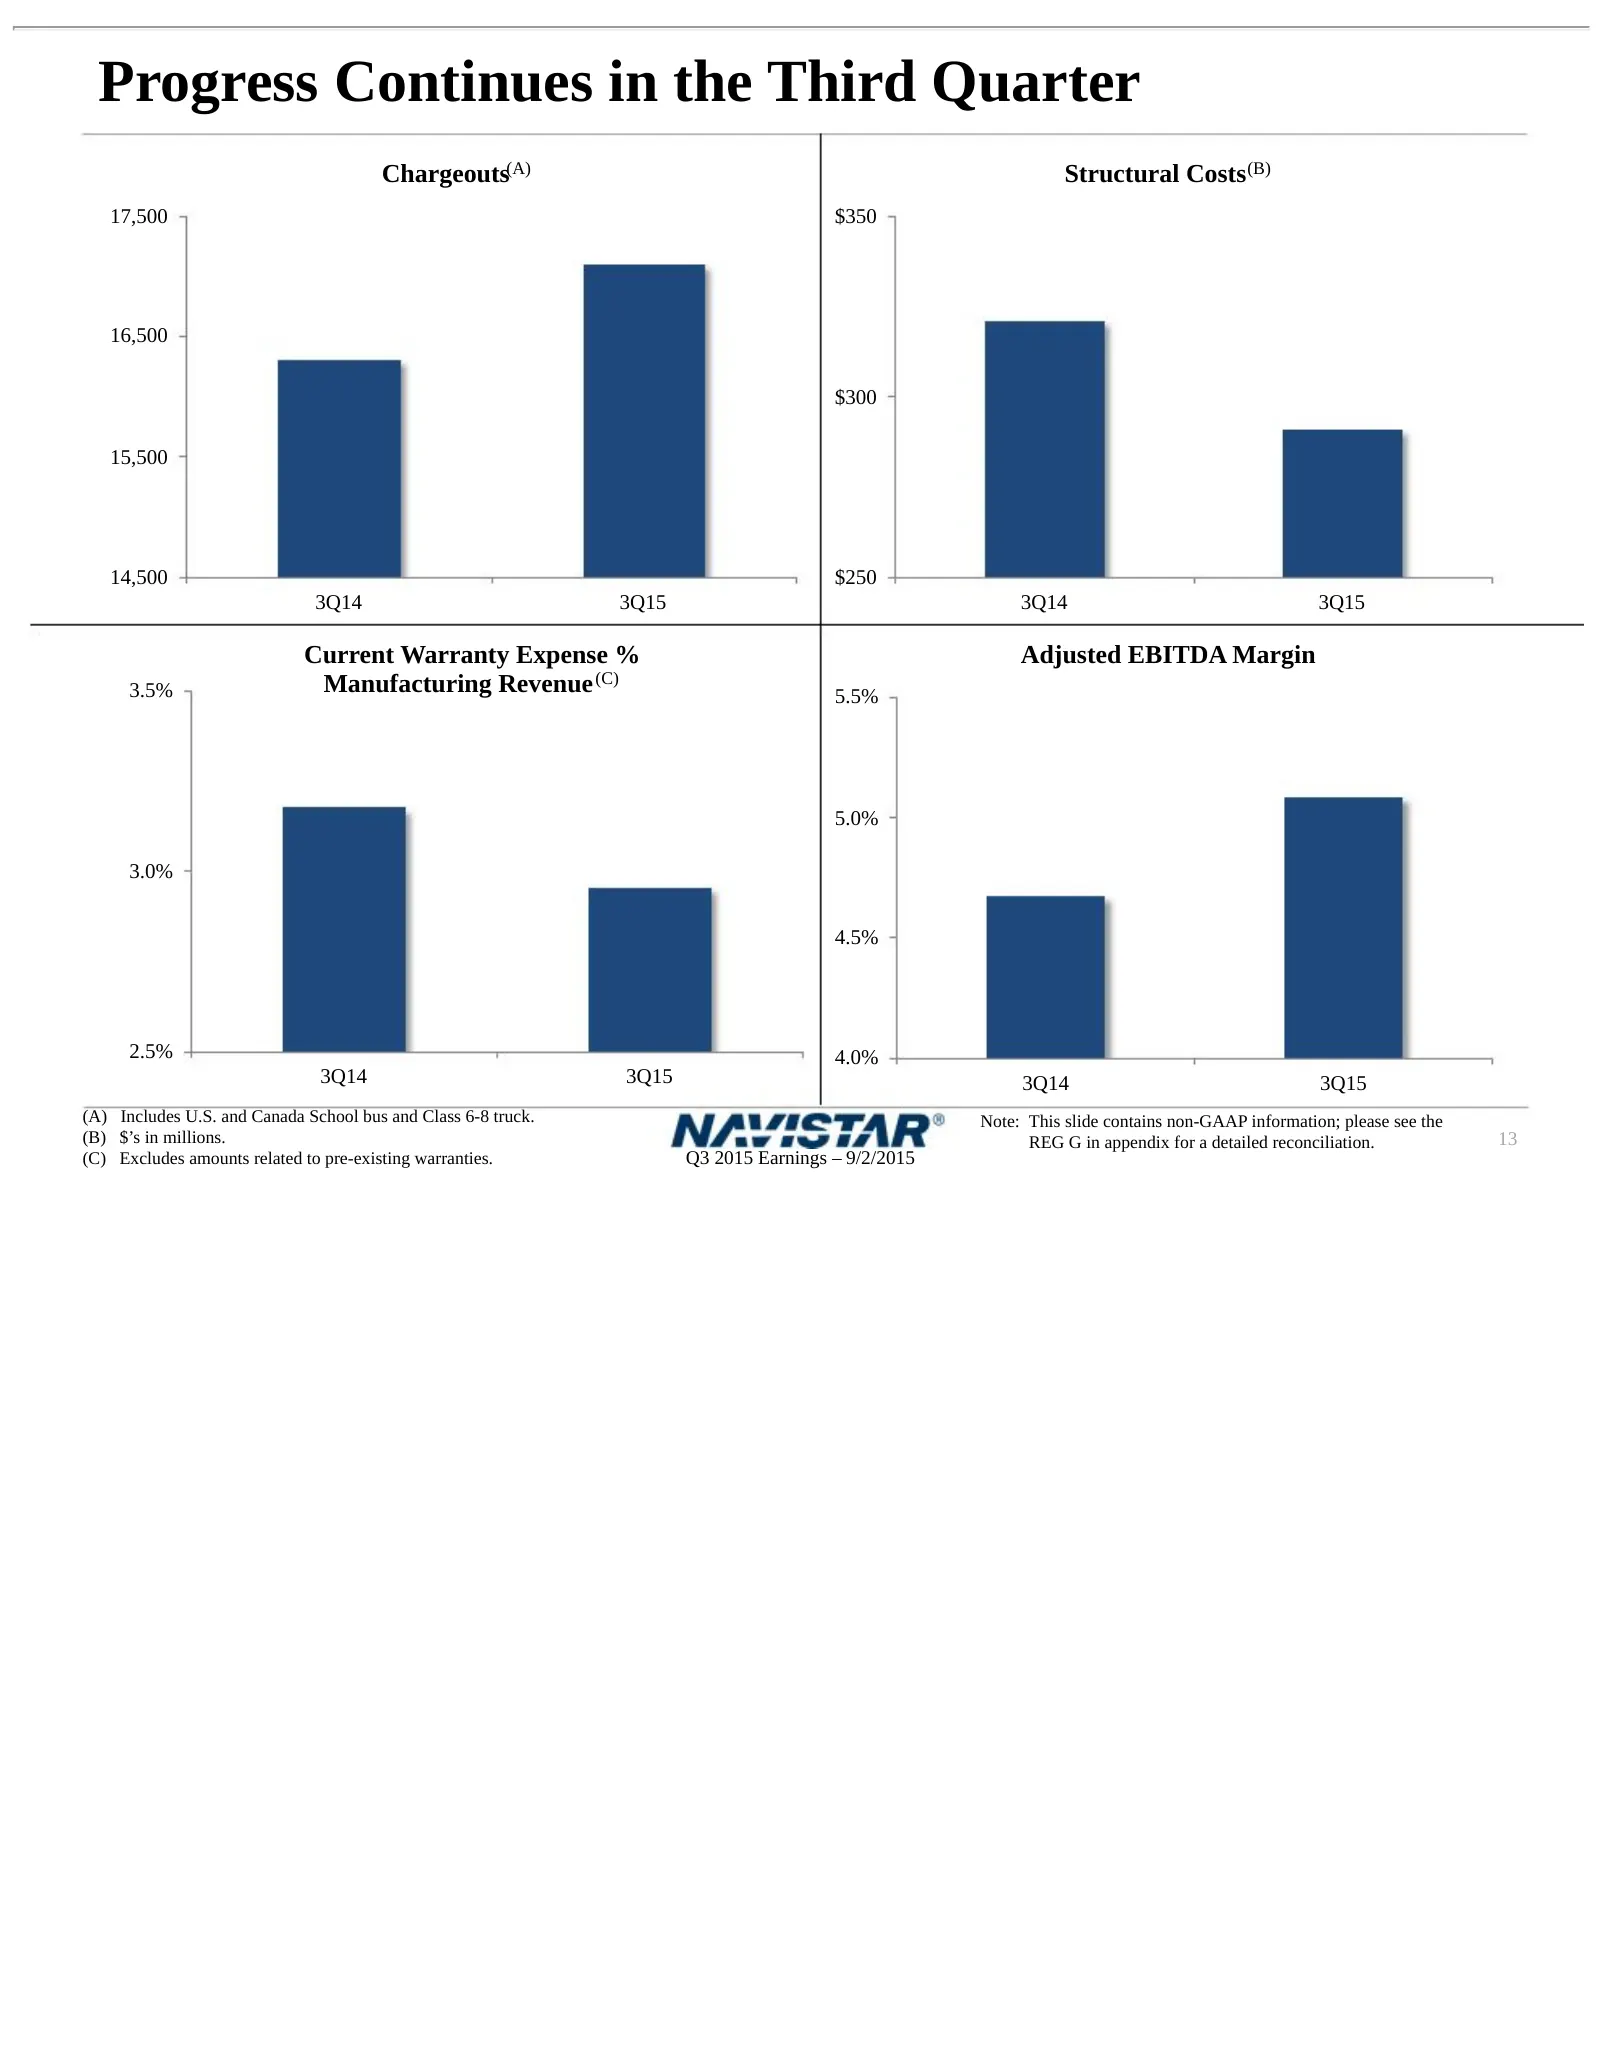
Progress Continues in the Third Quarter Chargeouts(A) Structural Costs (B) 17,500 $350 16,500 $300 15,500 14,500 $250 3Q14 3Q15 3Q14 3Q15 Current Warranty Expense % Adjusted EBITDA Margin 3.5% Manufacturing Revenue (C) 5.5% 5.0% 3.0% 4.5% 2.5% 4.0% 3Q14 3Q15 3Q14 3Q15 (A) Includes U.S. and Canada Sc
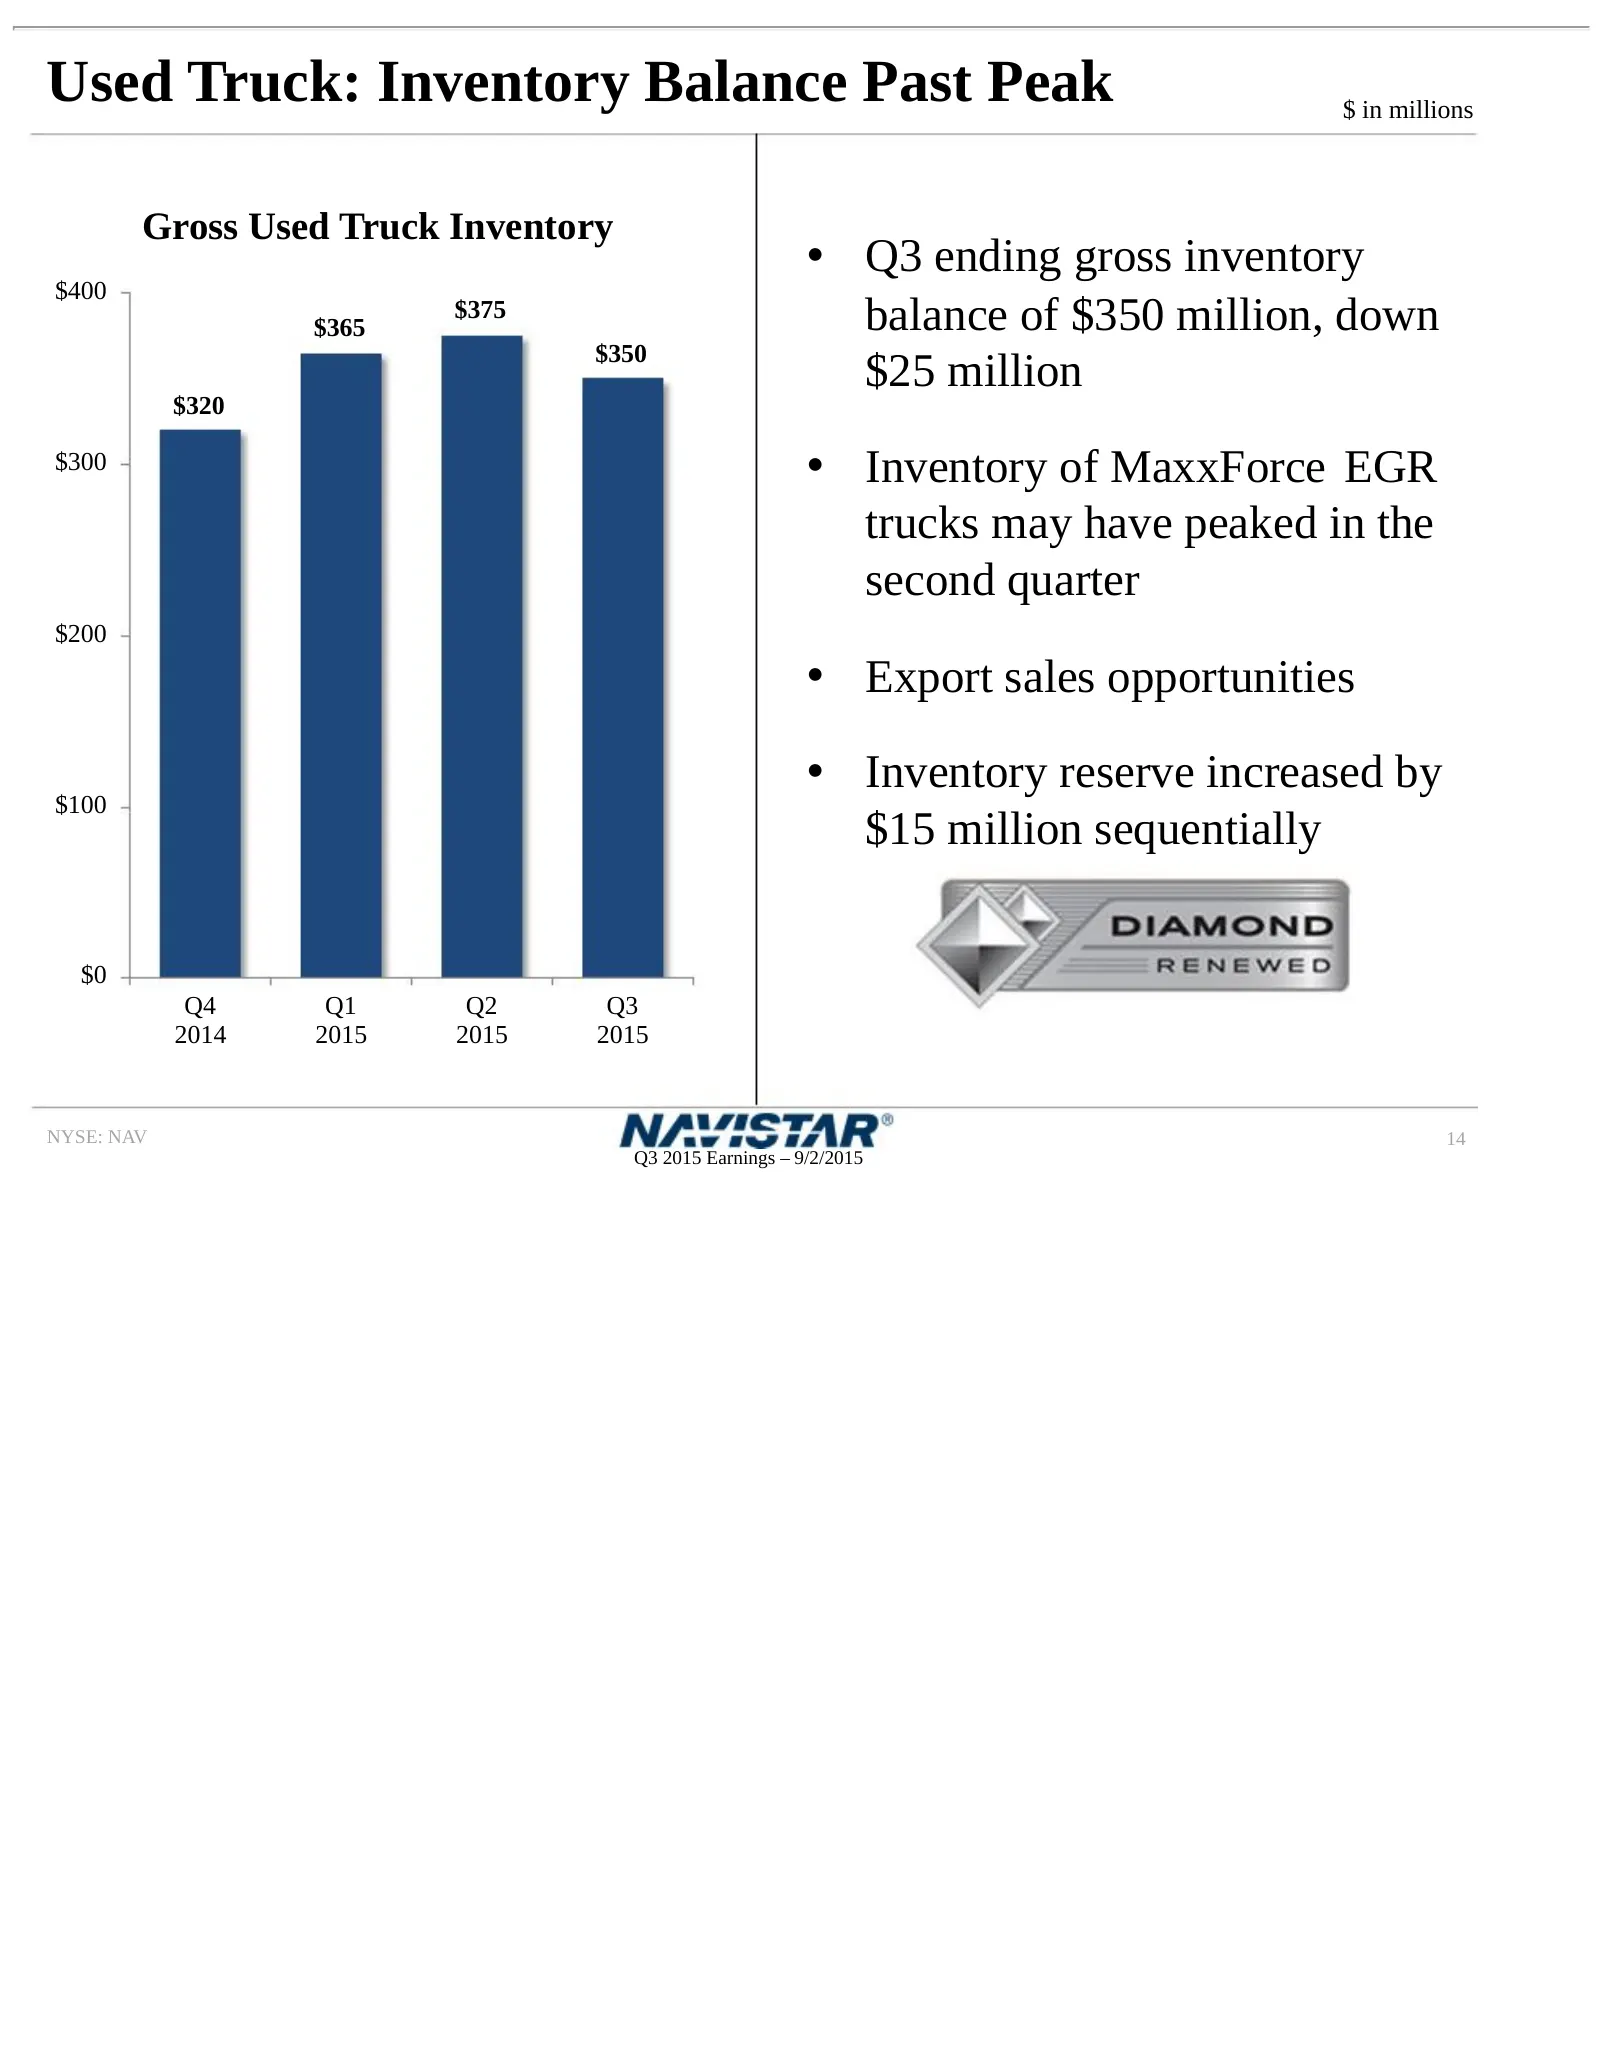
Slide 14: Used Truck: Inventory Balance Past Peak
Used Truck: Inventory Balance Past Peak $ in millions Gross Used Truck Inventory • Q3 ending gross inventory $400 $365 $375 balance of $350 million, down $350 $25 million $320 $300 • Inventory of MaxxForce EGR trucks may have peaked in the second quarter $200 • Export sales opportunities • Inventory
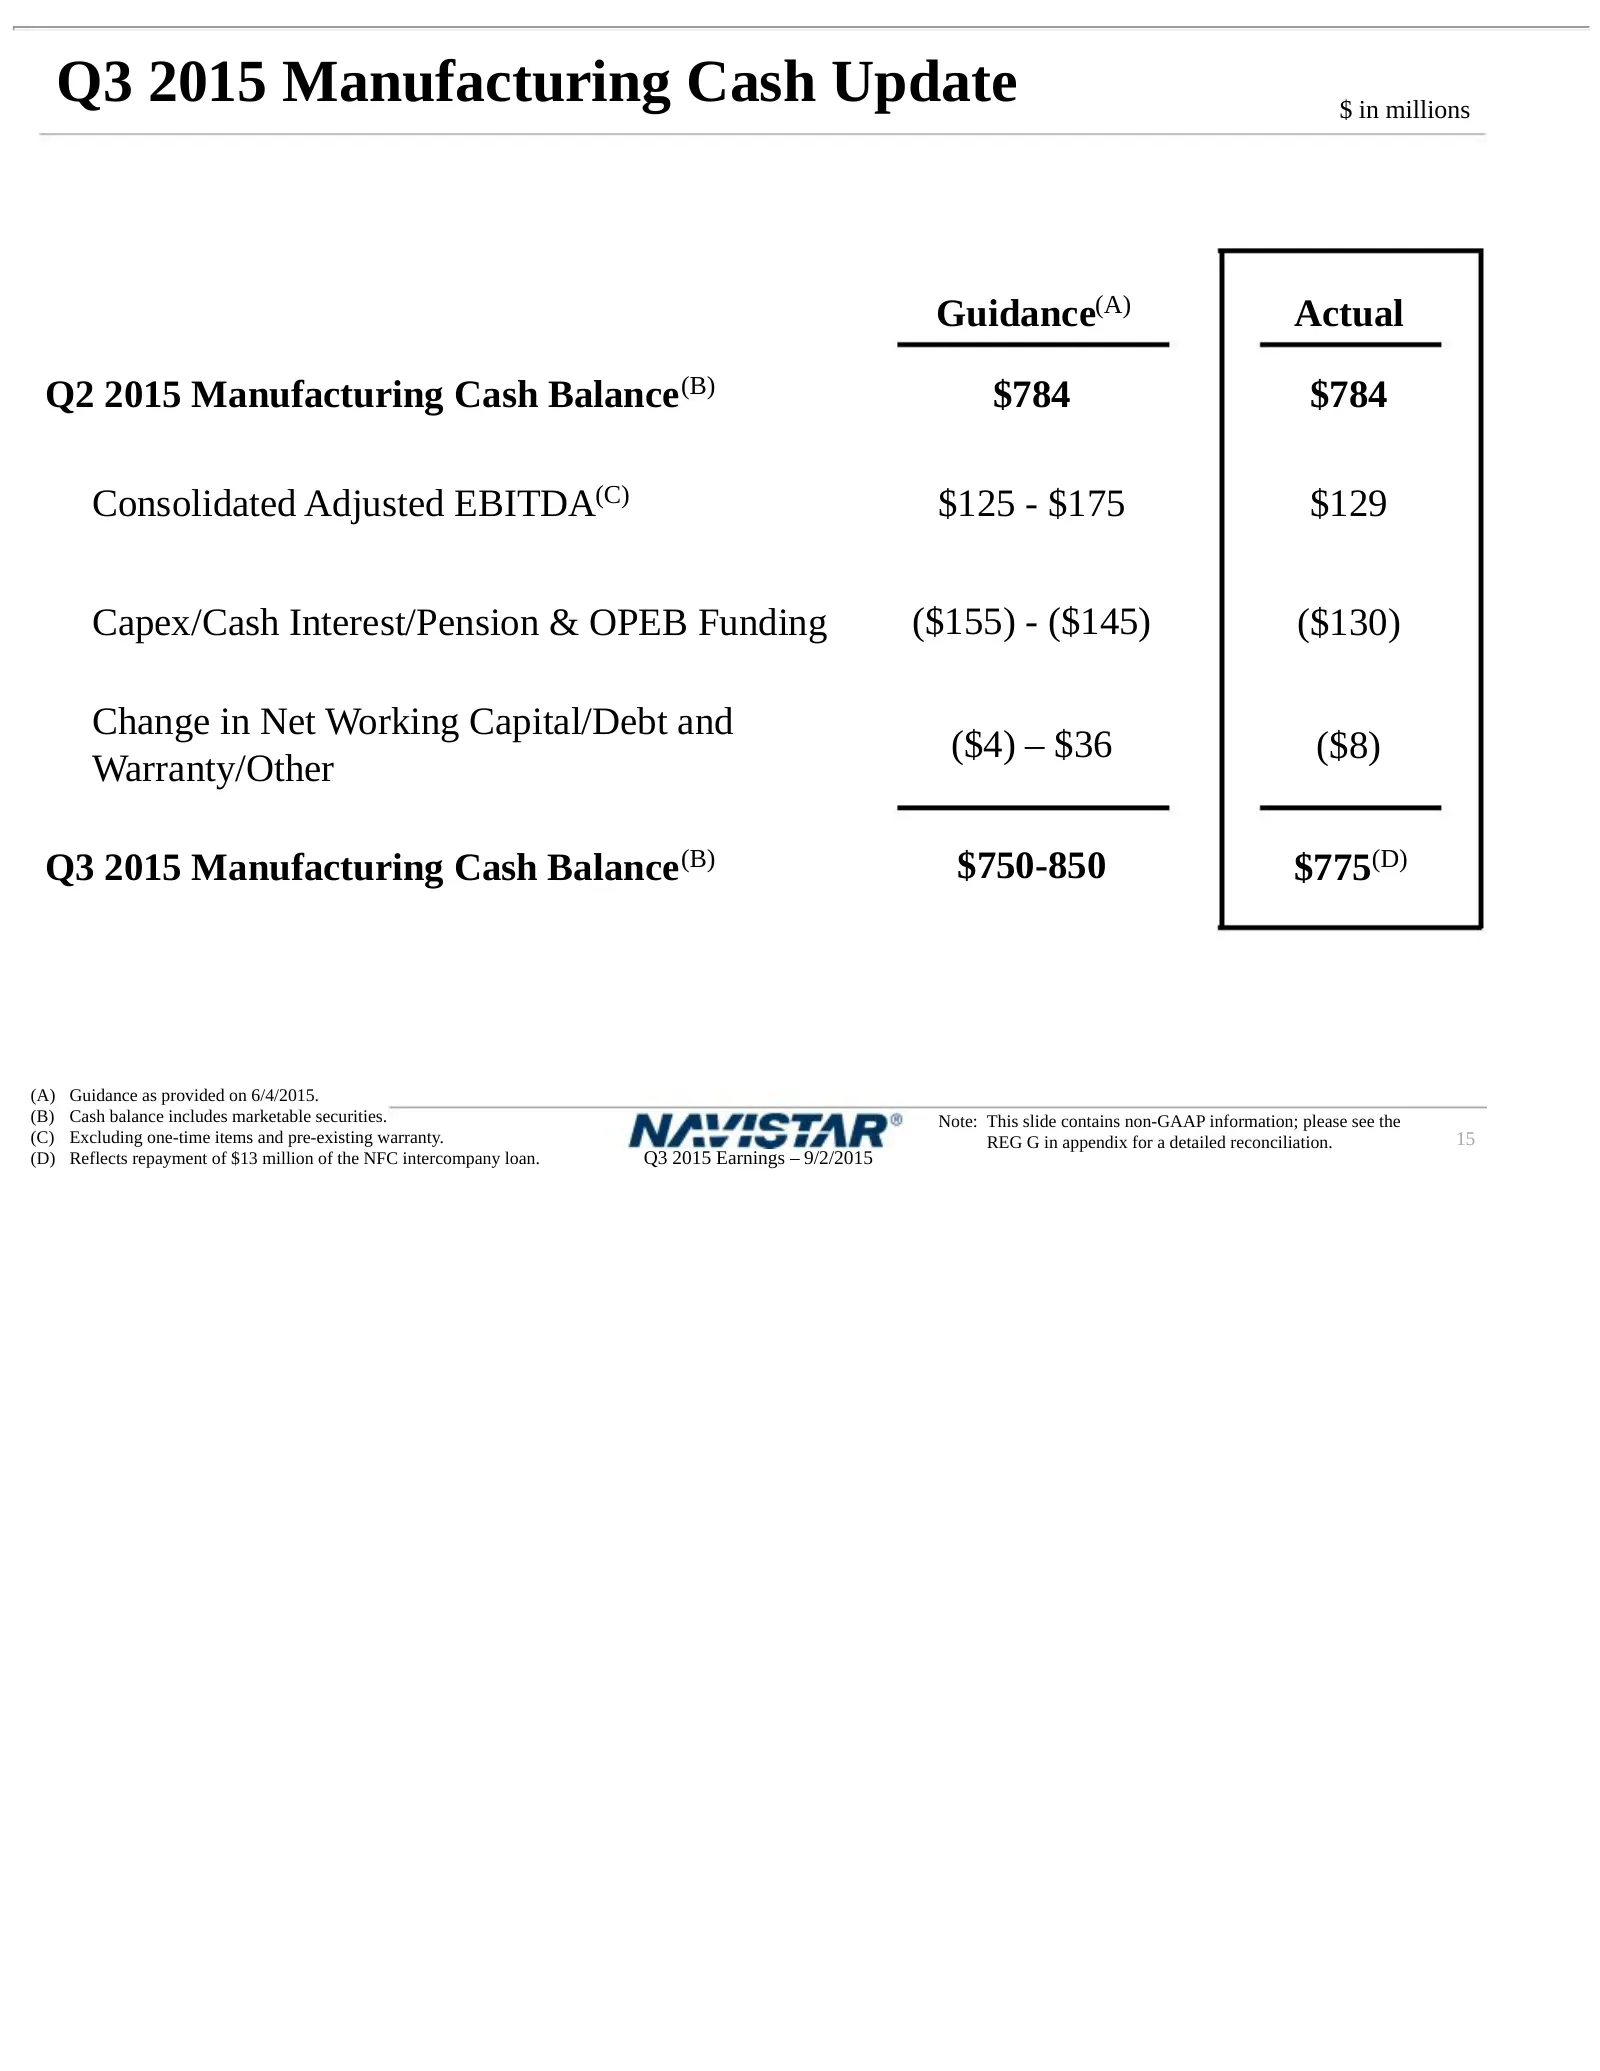
Slide 15: Q3 2015 Manufacturing Cash Update
Q3 2015 Manufacturing Cash Update $ in millions Guidance(A) Actual Q2 2015 Manufacturing Cash Balance(B) $784 $784 Consolidated Adjusted EBITDA(C) $125 - $175 $129 Capex/Cash Interest/Pension & OPEB Funding ($155) - ($145) ($130) Change in Net Working Capital/Debt and ($4) – $36 ($8) Warranty/Other
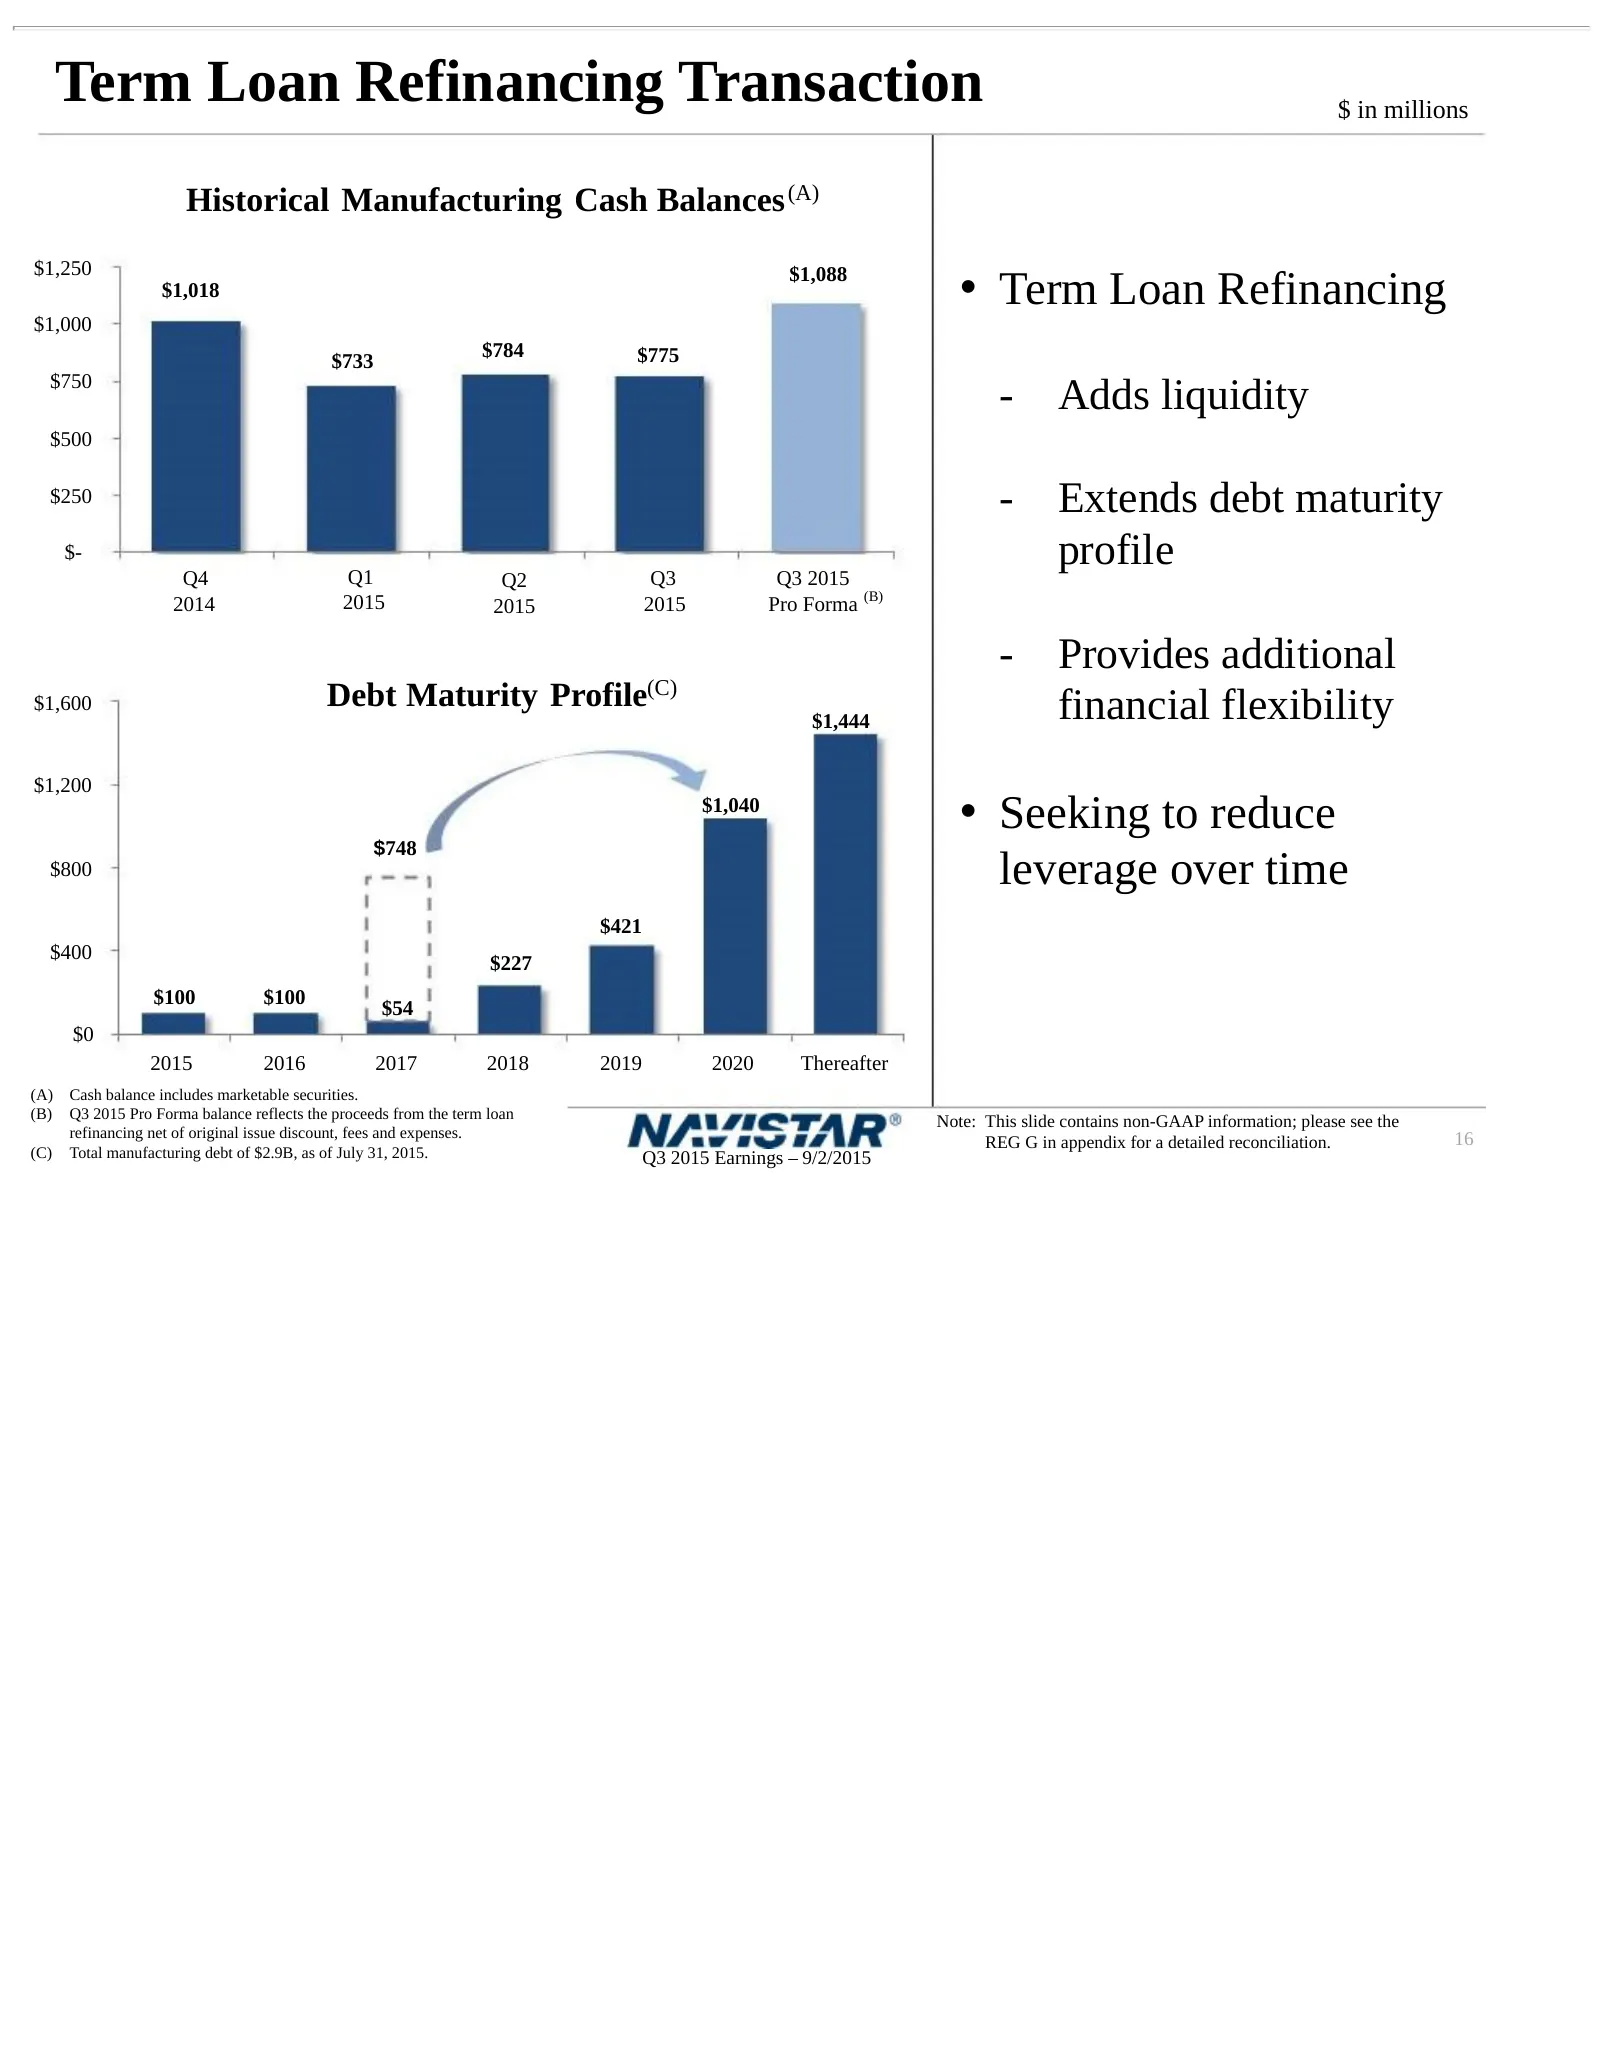
Slide 16: Term Loan Refinancing Transaction
Term Loan Refinancing Transaction $ in millions Historical Manufacturing Cash Balances (A) $1,250 $1,018 $1,088 • Term Loan Refinancing $1,000 $784 $775 $733 $750 - Adds liquidity $500 $250 - Extends debt maturity $- Q4 Q1 Q3 Q3 2015 profile Q2 2014 2015 2015 2015 Pro Forma (B) - Provides additional
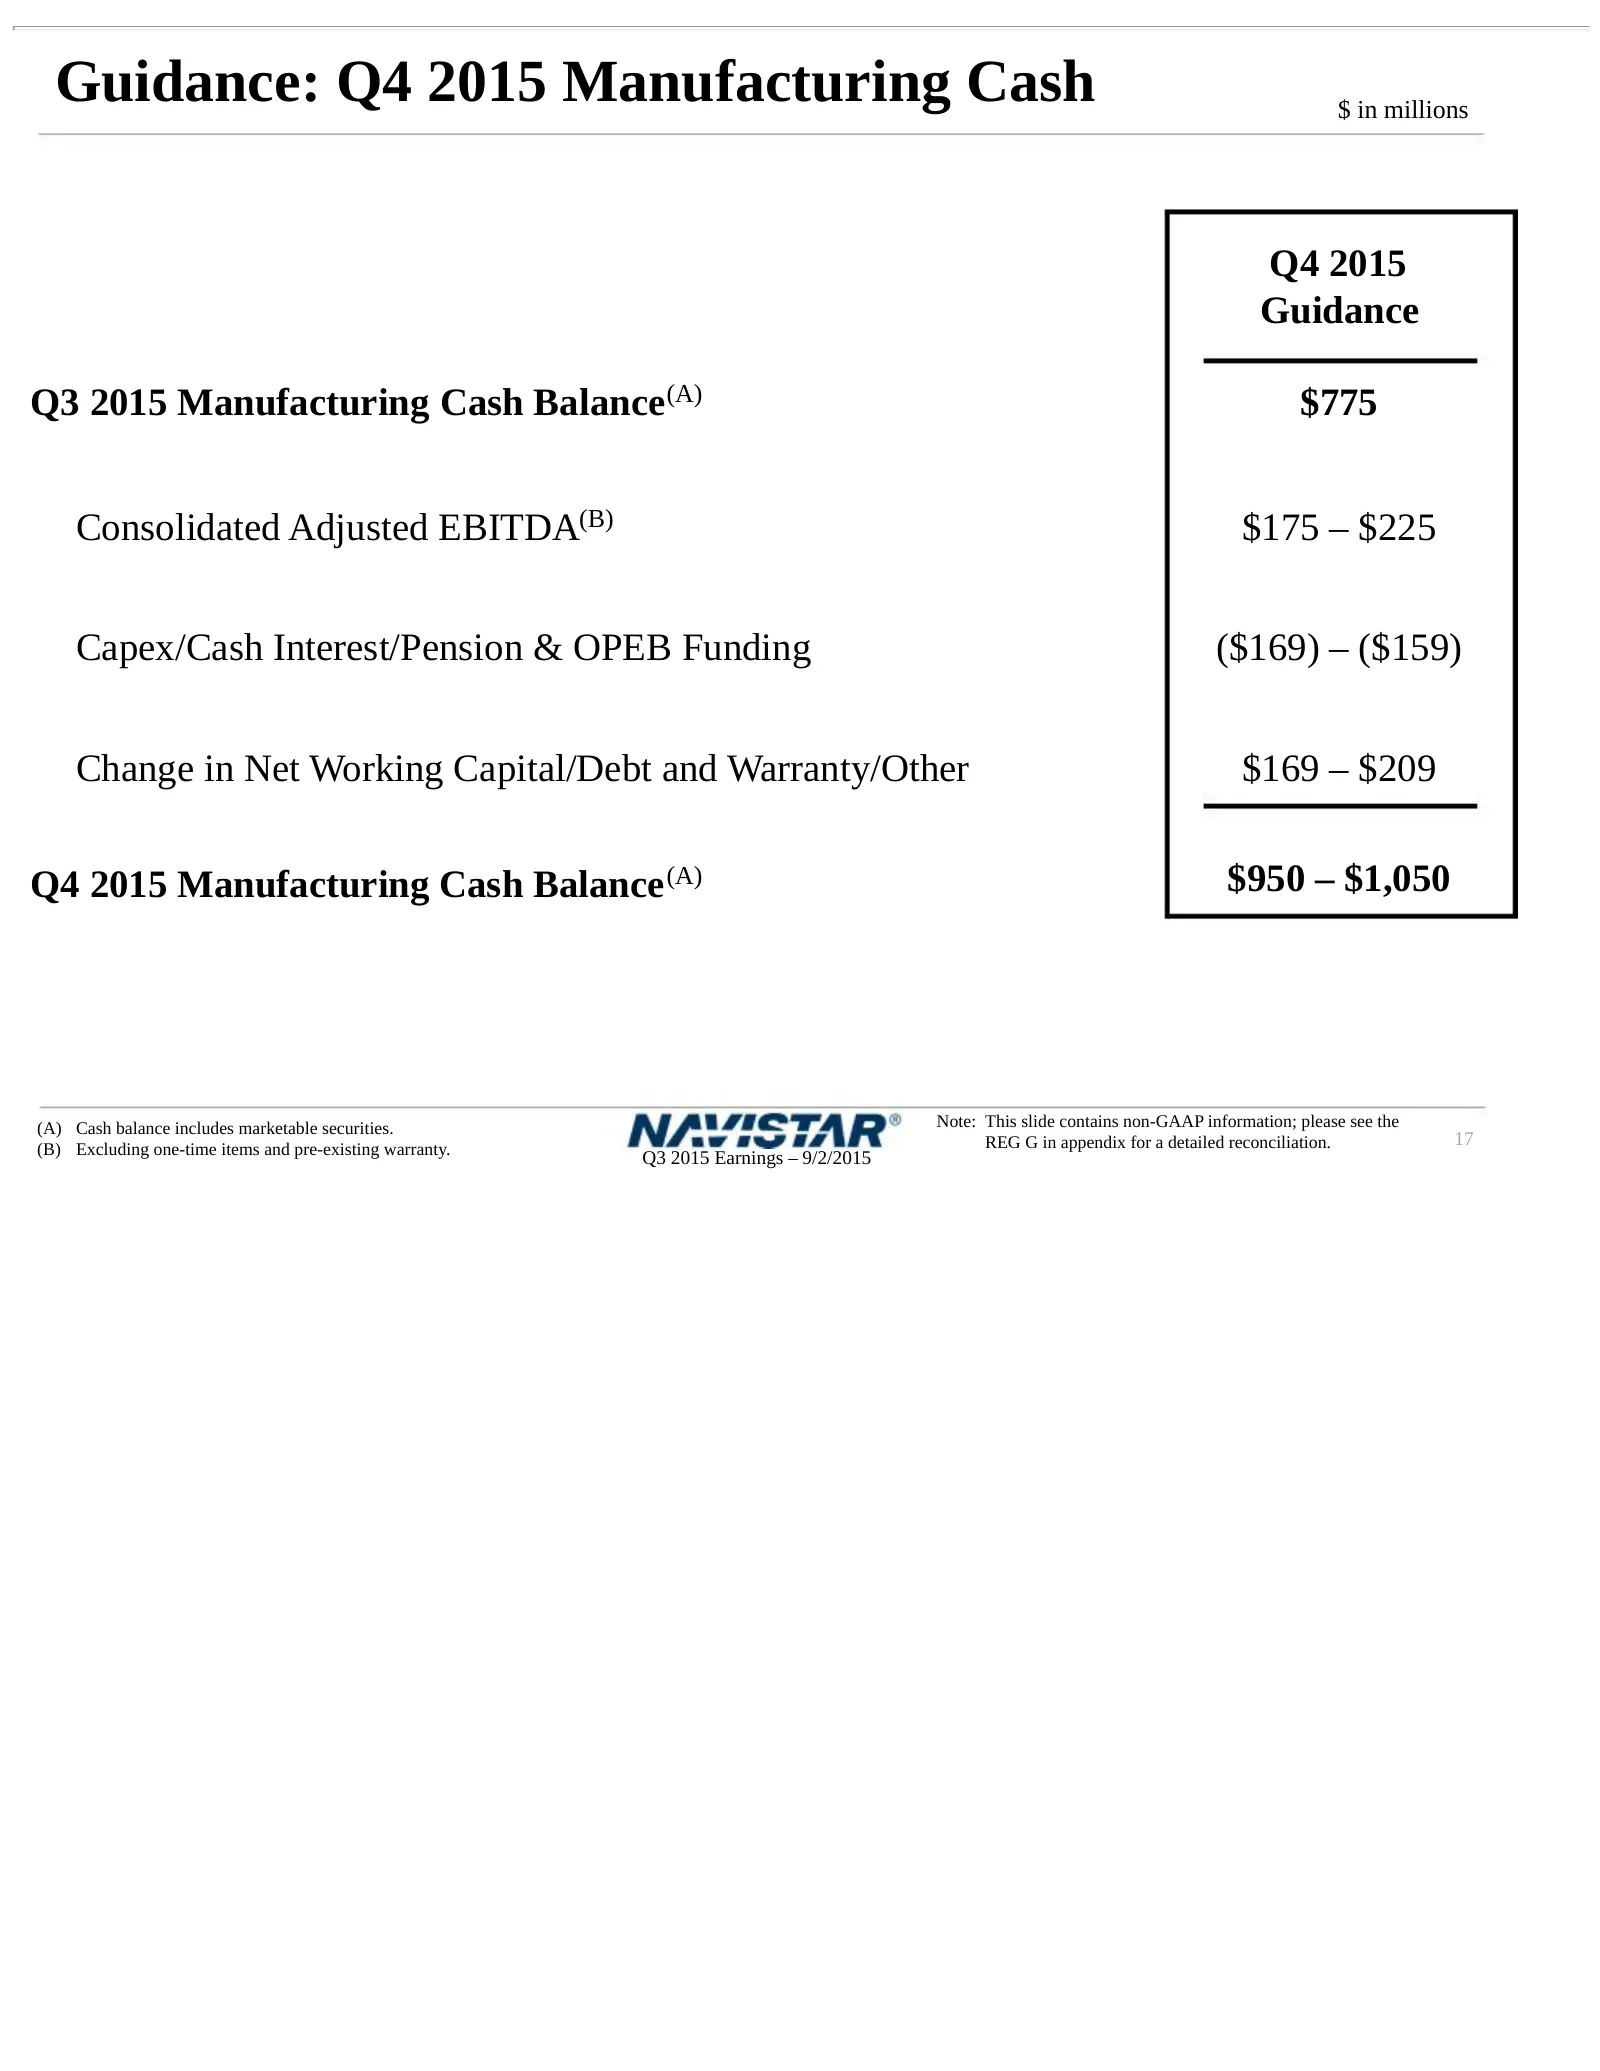
Slide 17: Guidance: Q4 2015 Manufacturing Cash
Guidance: Q4 2015 Manufacturing Cash $ in millions Q4 2015 Guidance Q3 2015 Manufacturing Cash Balance(A) $775 Consolidated Adjusted EBITDA(B) $175 – $225 Capex/Cash Interest/Pension & OPEB Funding ($169) – ($159) Change in Net Working Capital/Debt and Warranty/Other $169 – $209 Q4 2015 Manufacturin
Slide 18: Factors Weighing on Adjusted EBITDA Margin
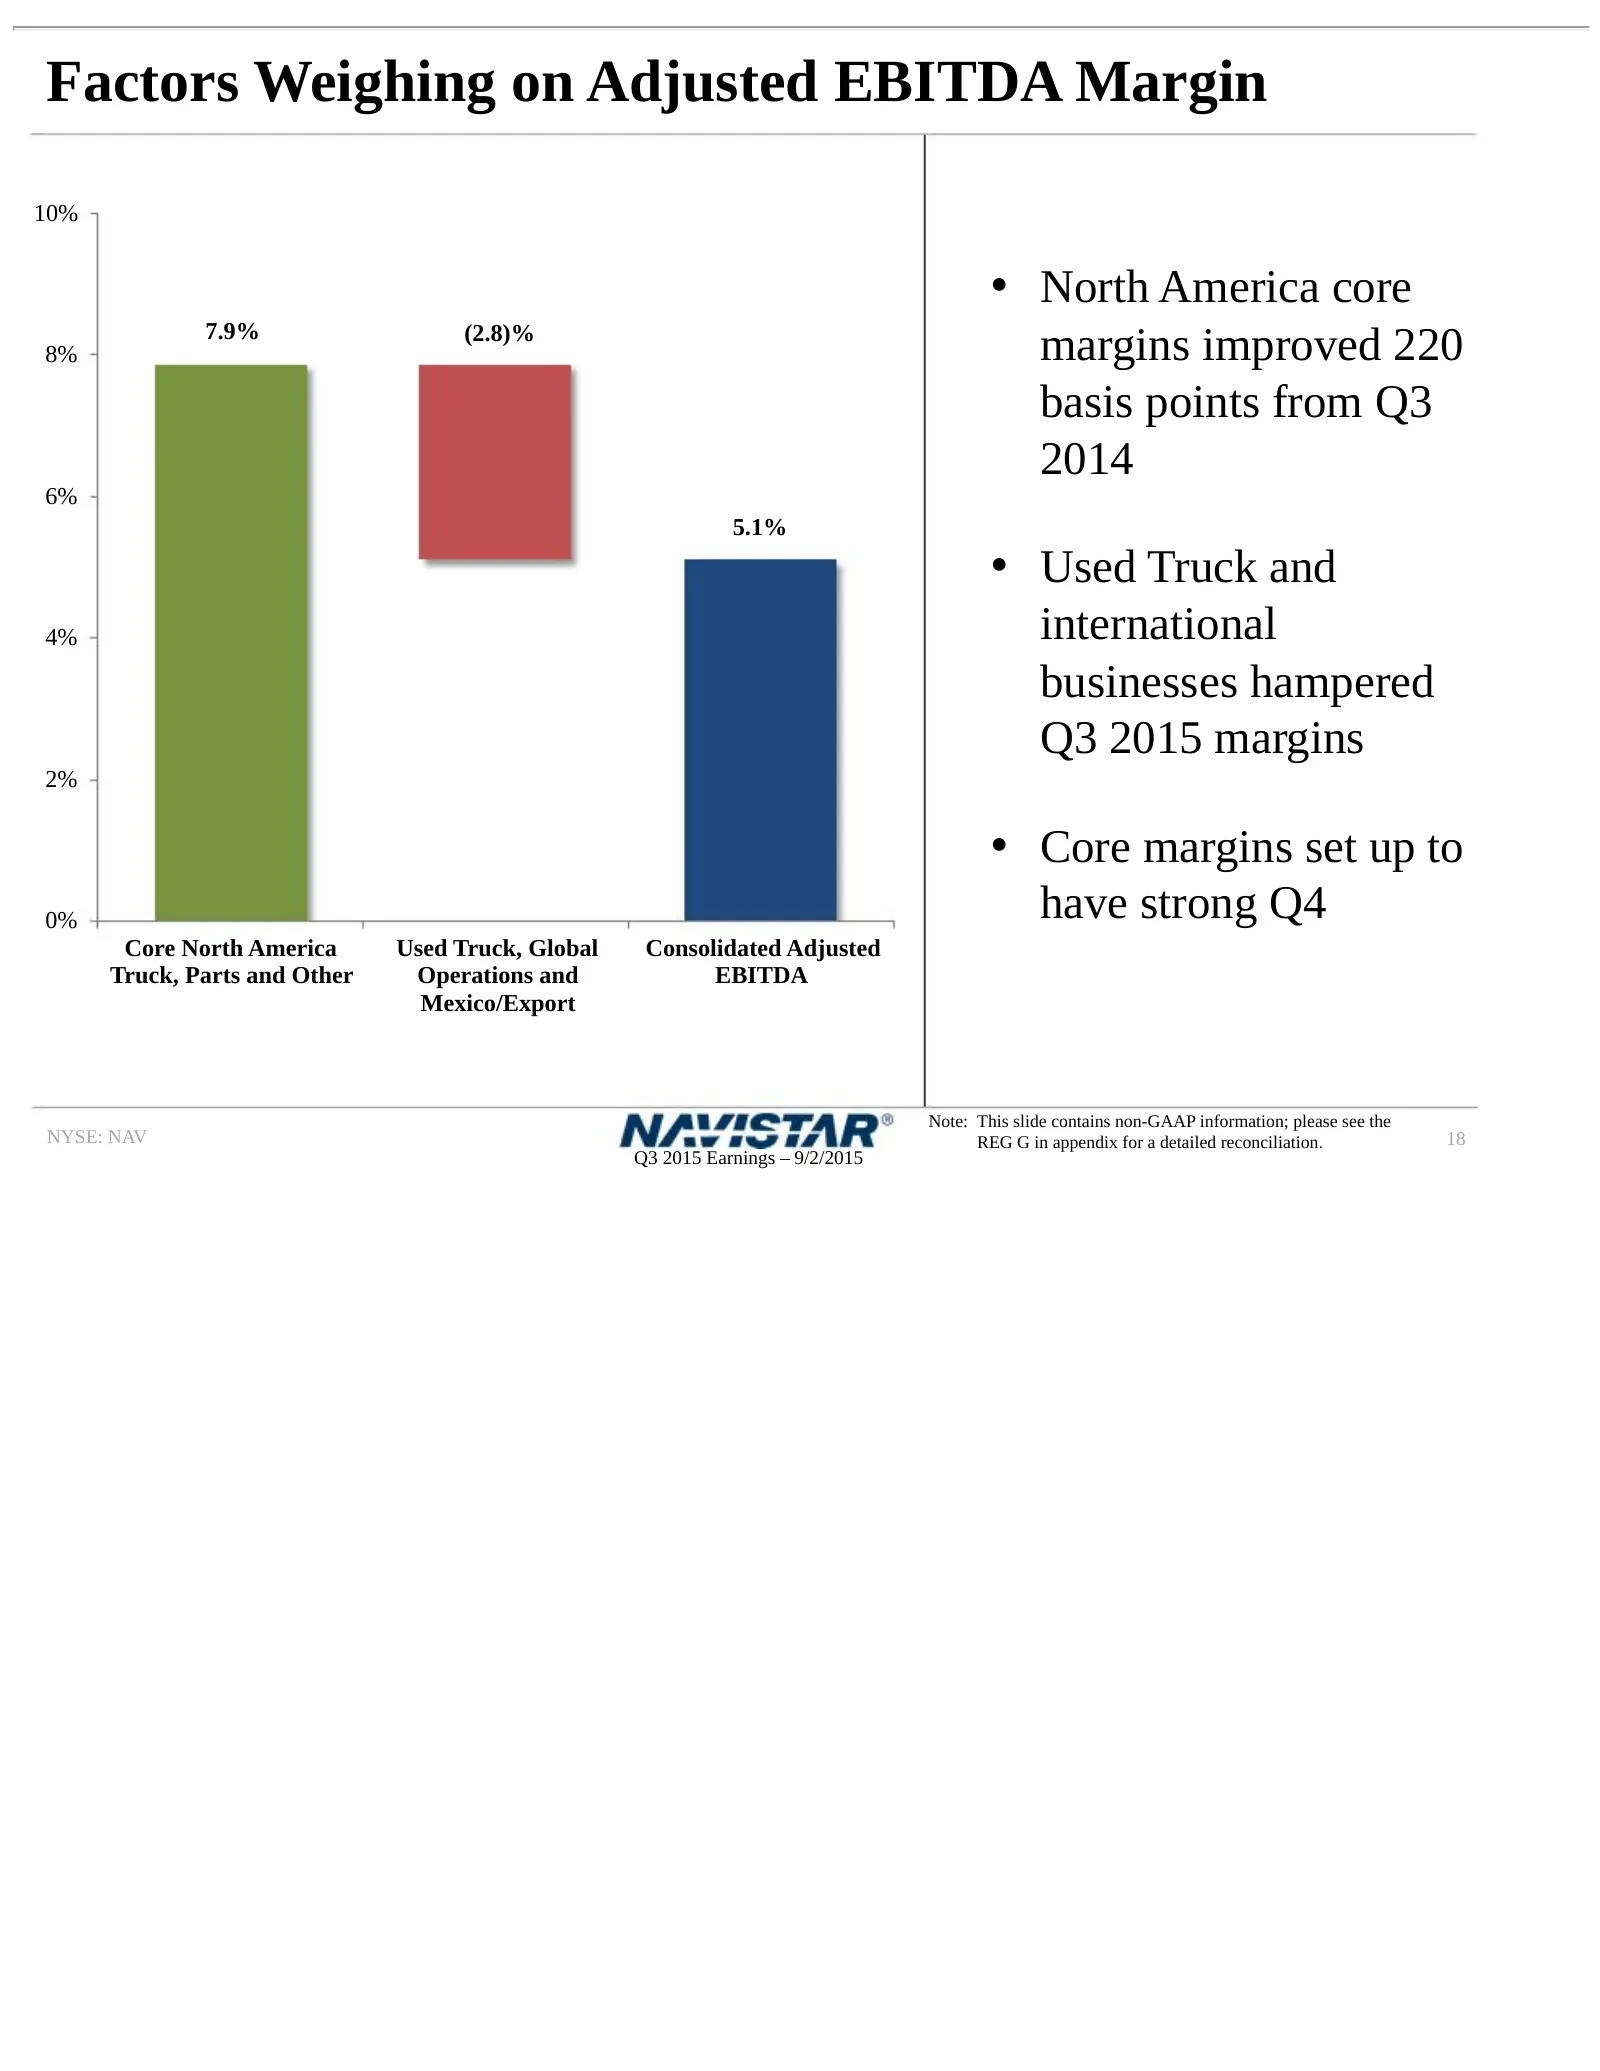
Factors Weighing on Adjusted EBITDA Margin 10% • North America core 7.9% ( 8% (2.8)% margins improved 220 basis points from Q3 2014 6% 5.1% • Used Truck and 4% international businesses hampered Q3 2015 margins 2% • Core margins set up to 0% have strong Q4 Core North America Used Truck, Global Consol
Slide 19: Q4 2015: Delivering on our Margin Goals
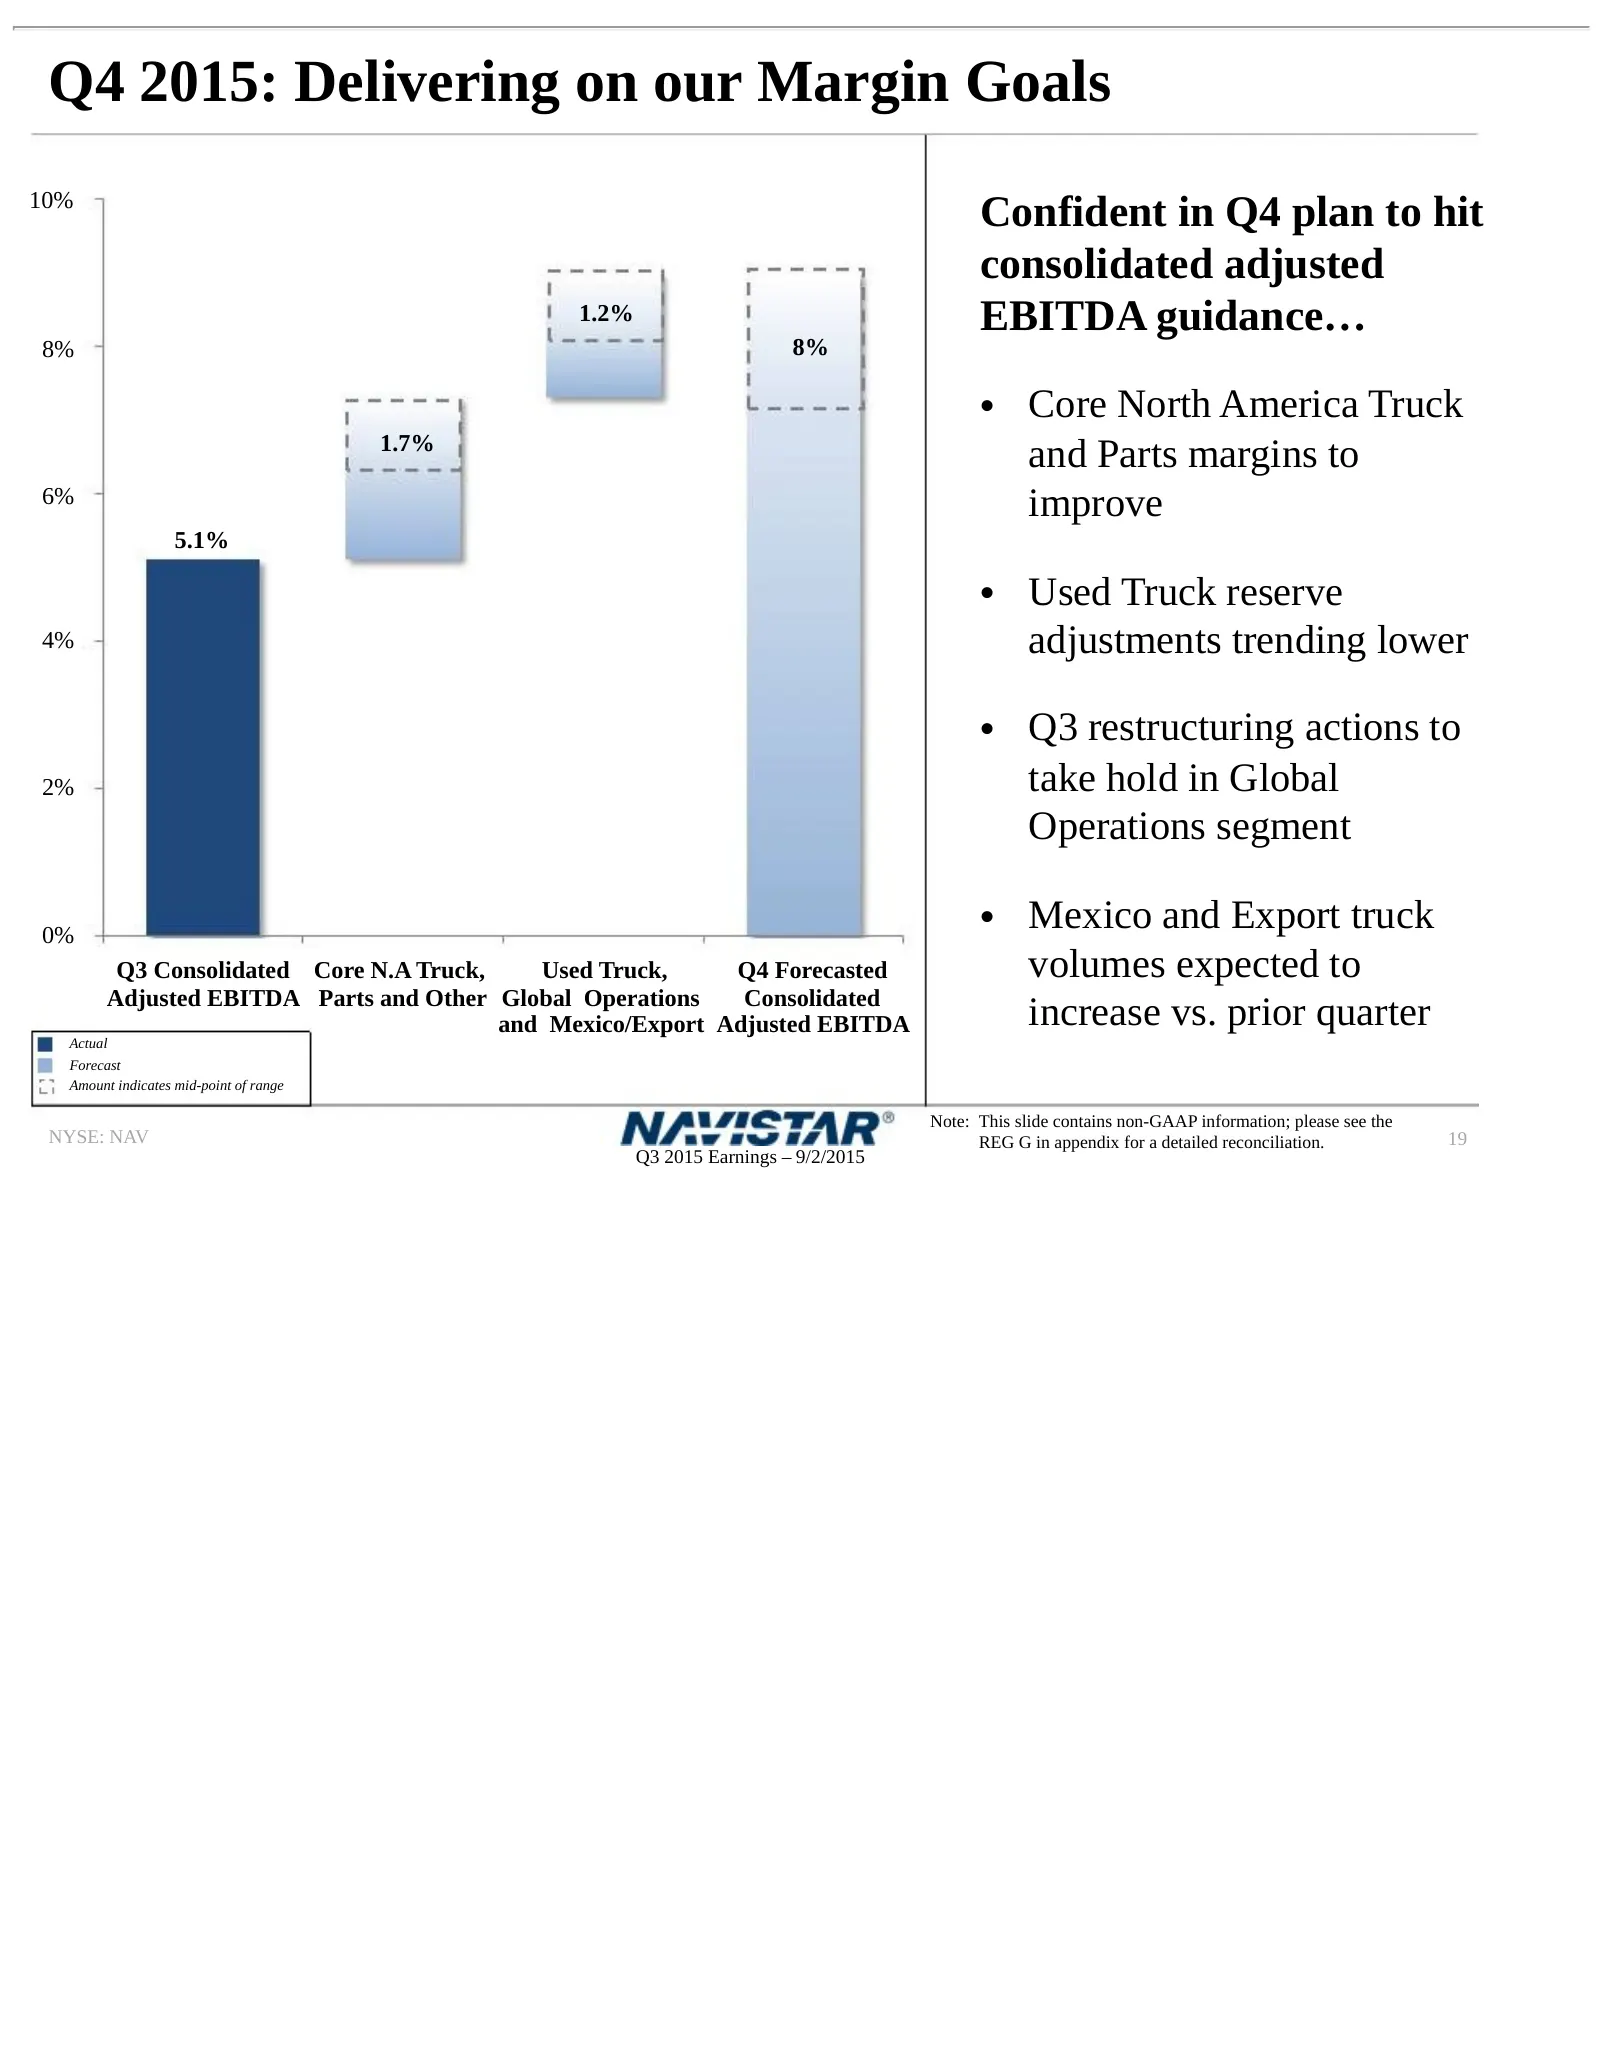
Q4 2015: Delivering on our Margin Goals 10% Confident in Q4 plan to hit consolidated adjusted 1.2% EBITDA guidance… 8% 8% • Core North America Truck 1.7% and Parts margins to 6% improve 5.1% • Used Truck reserve 4% adjustments trending lower • Q3 restructuring actions to 2% take hold in Global Opera
Slide 20: Summing It Up
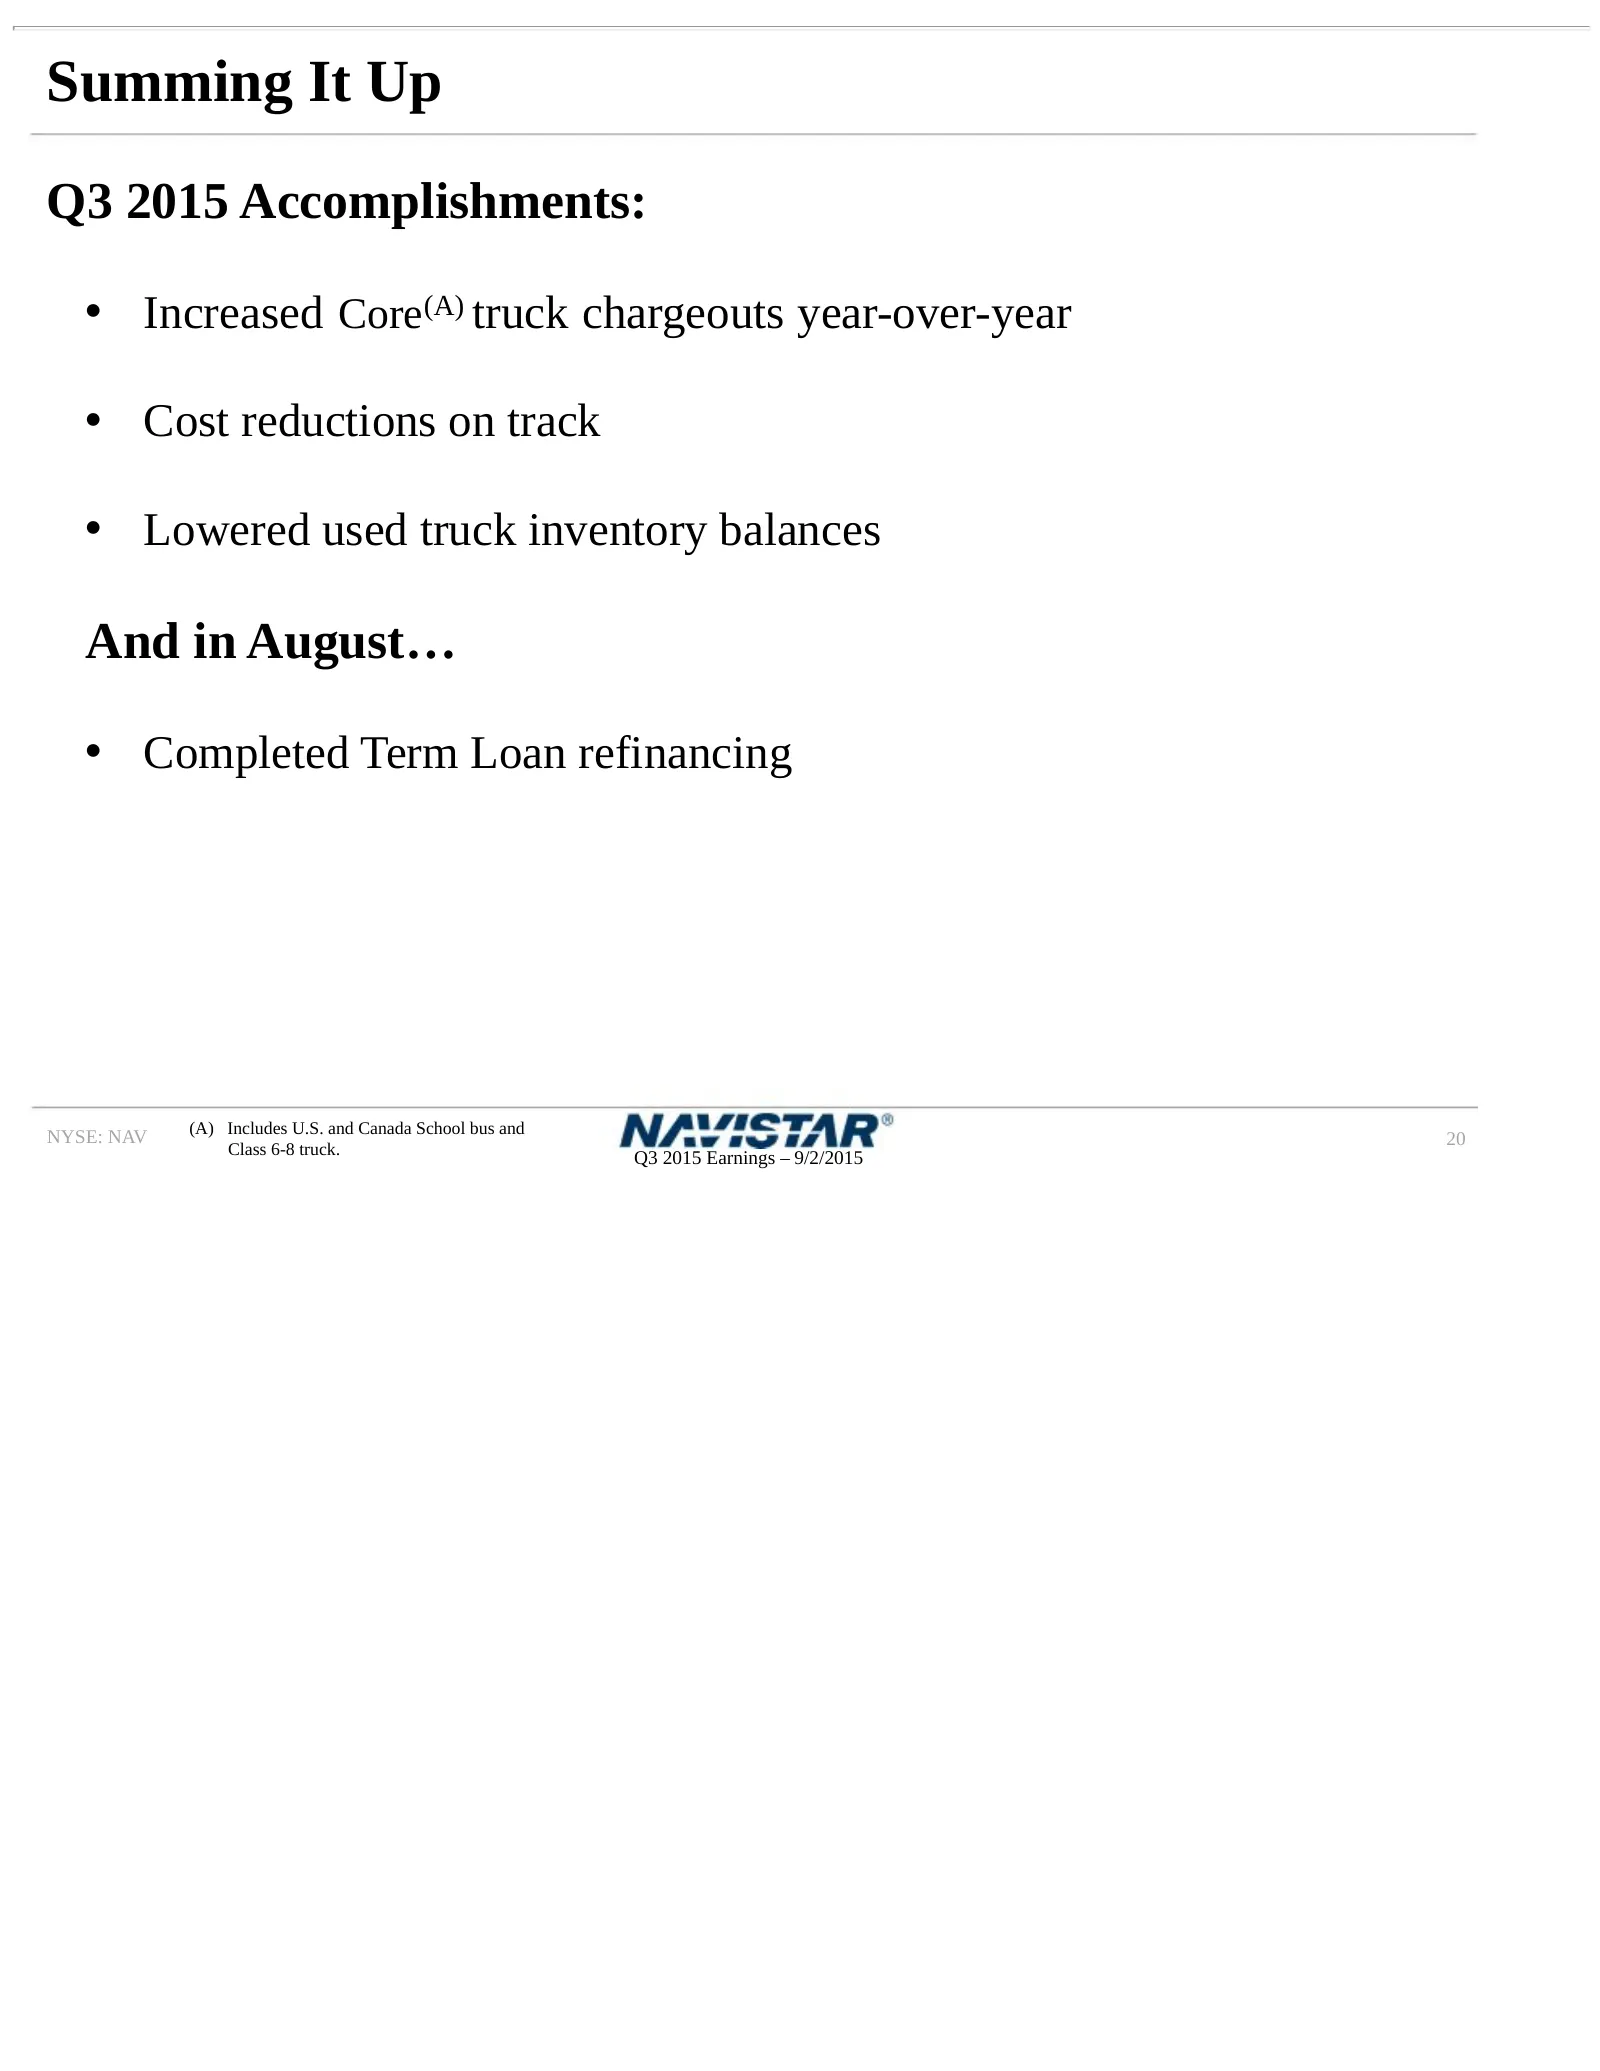
Summing It Up Q3 2015 Accomplishments: • Increased Core(A) truck chargeouts year-over-year • Cost reductions on track • Lowered used truck inventory balances And in August… • Completed Term Loan refinancing (A) Includes U.S. and Canada School bus and NYSE: NAV 20 Class 6-8 truck. Q3 2015 Earnings –
Slide 21: Summary
SUMMARY Troy Clarke, President & CEO NYSE: NAV
Slide 22: Cost Reductions in 2016 and Beyond
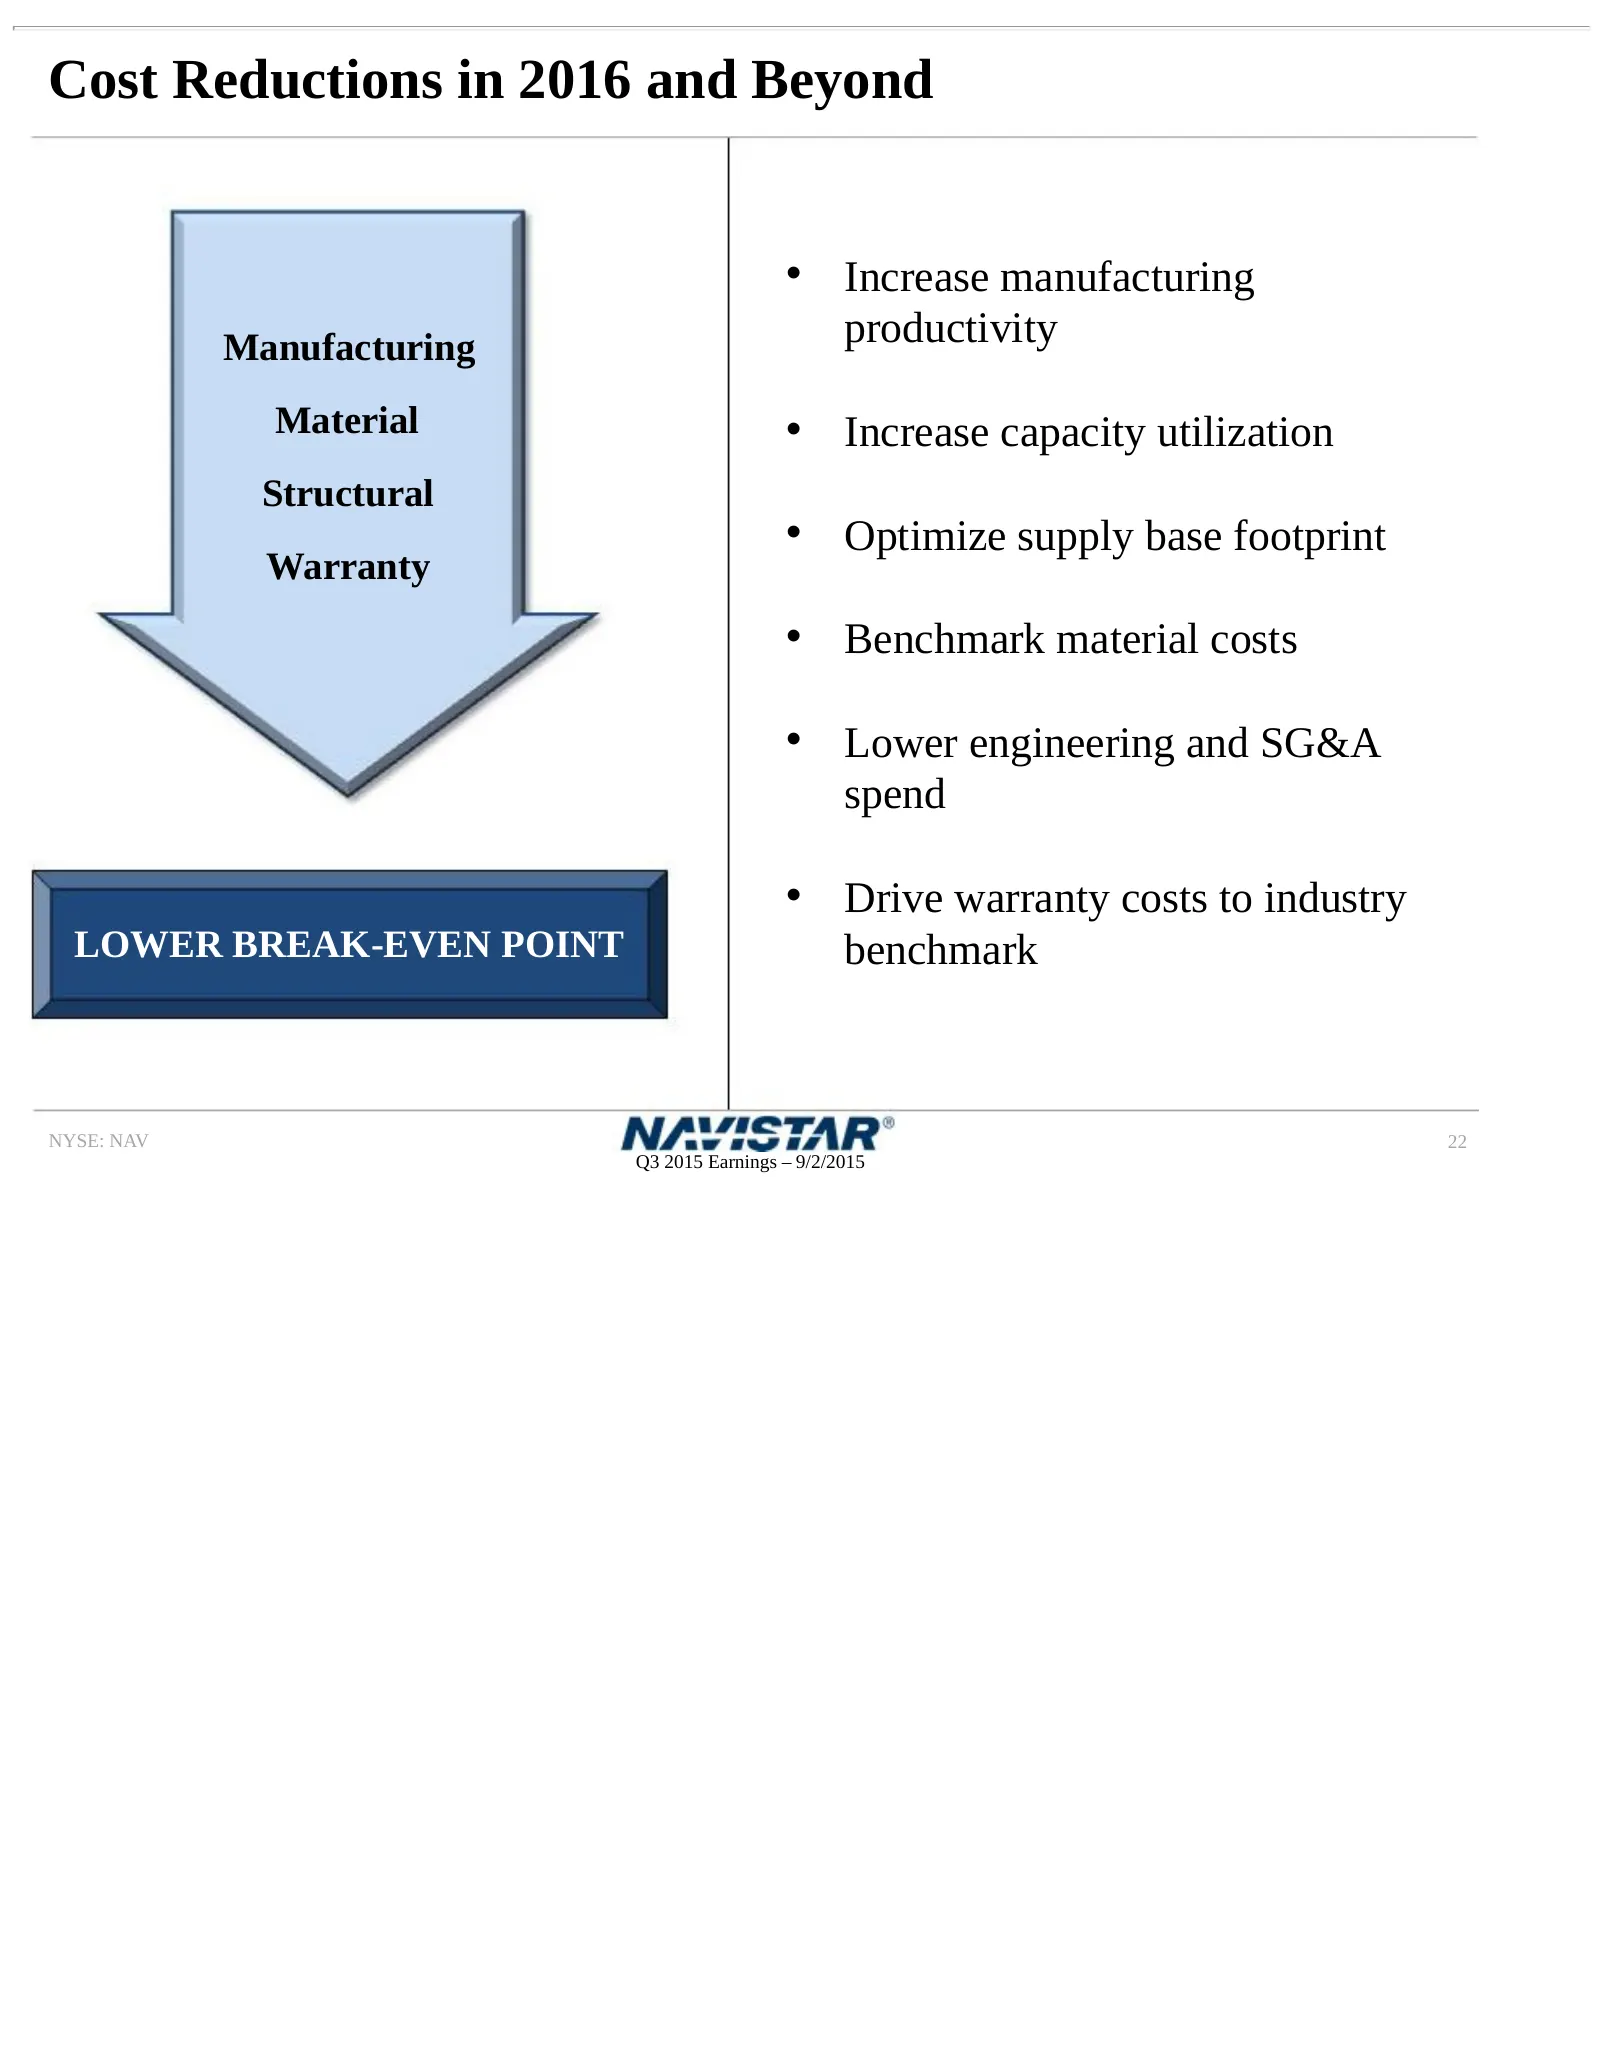
Cost Reductions in 2016 and Beyond • Increase manufacturing Manufacturing productivity Material • Increase capacity utilization Structural • Optimize supply base footprint Warranty • Benchmark material costs • Lower engineering and SG&A spend • Drive warranty costs to industry LOWER BREAK-EVEN POINT
Slide 23: Strongest Product Lineup in Years
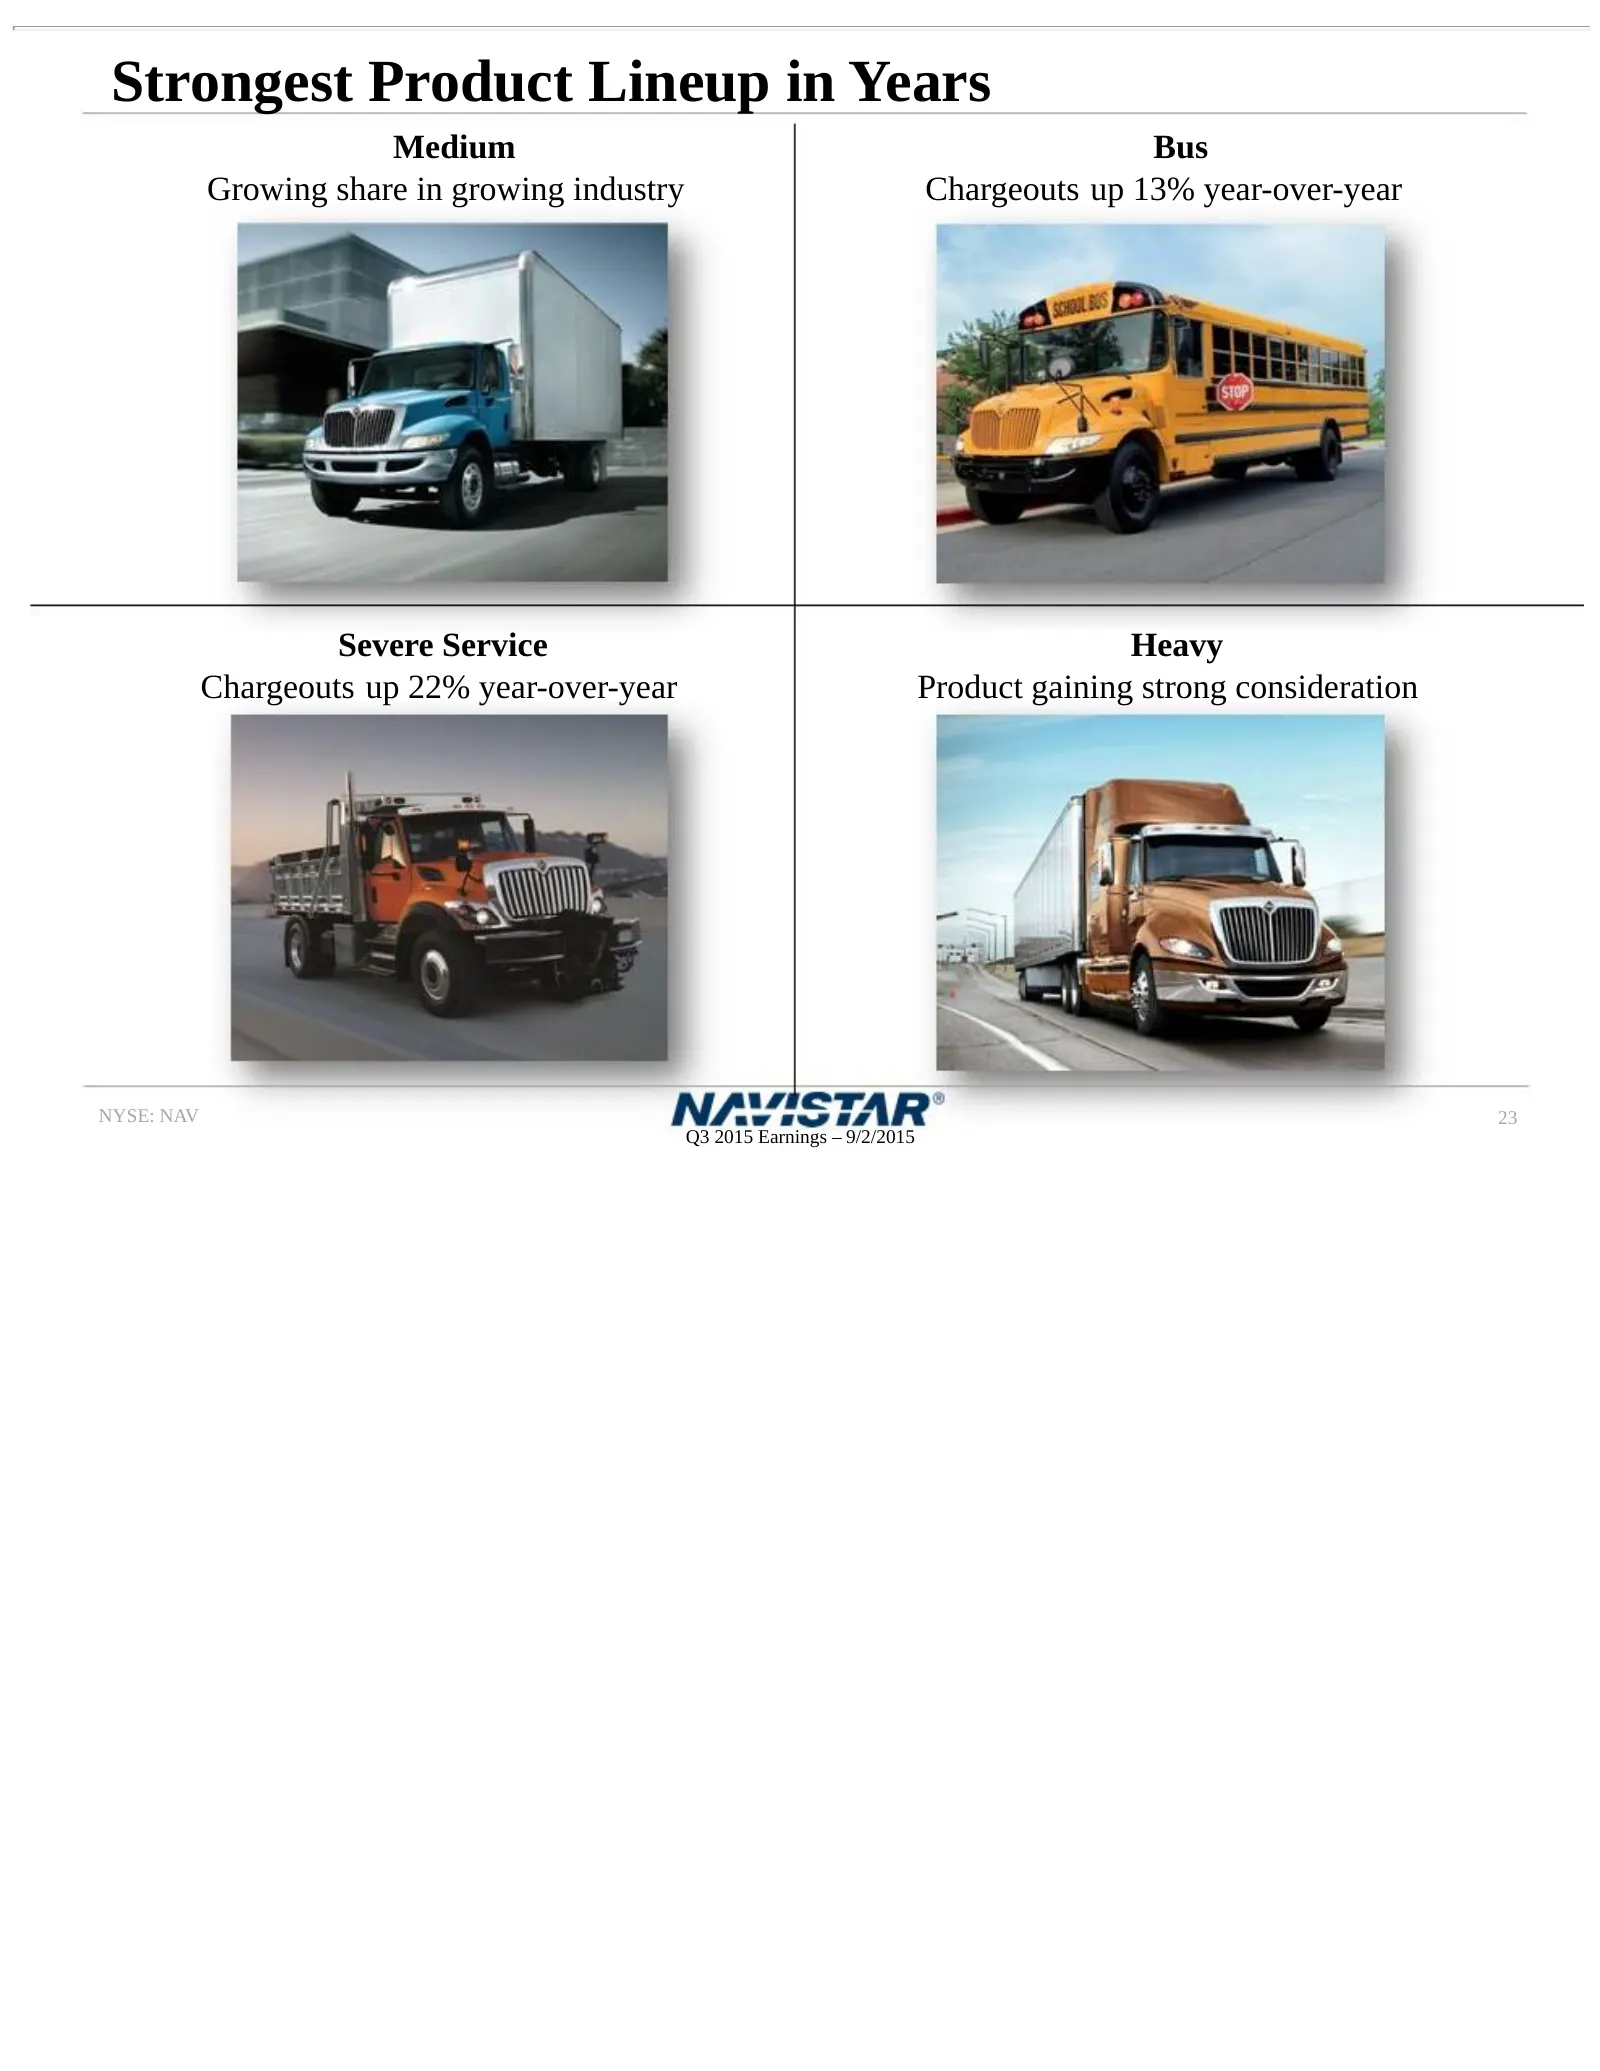
Strongest Product Lineup in Years Medium Bus Growing share in growing industry Chargeouts up 13% year-over-year Severe Service Heavy Chargeouts up 22% year-over-year Product gaining strong consideration NYSE: NAV 23 Q3 2015 Earnings – 9/2/2015
Slide 24: Open Technology Integration
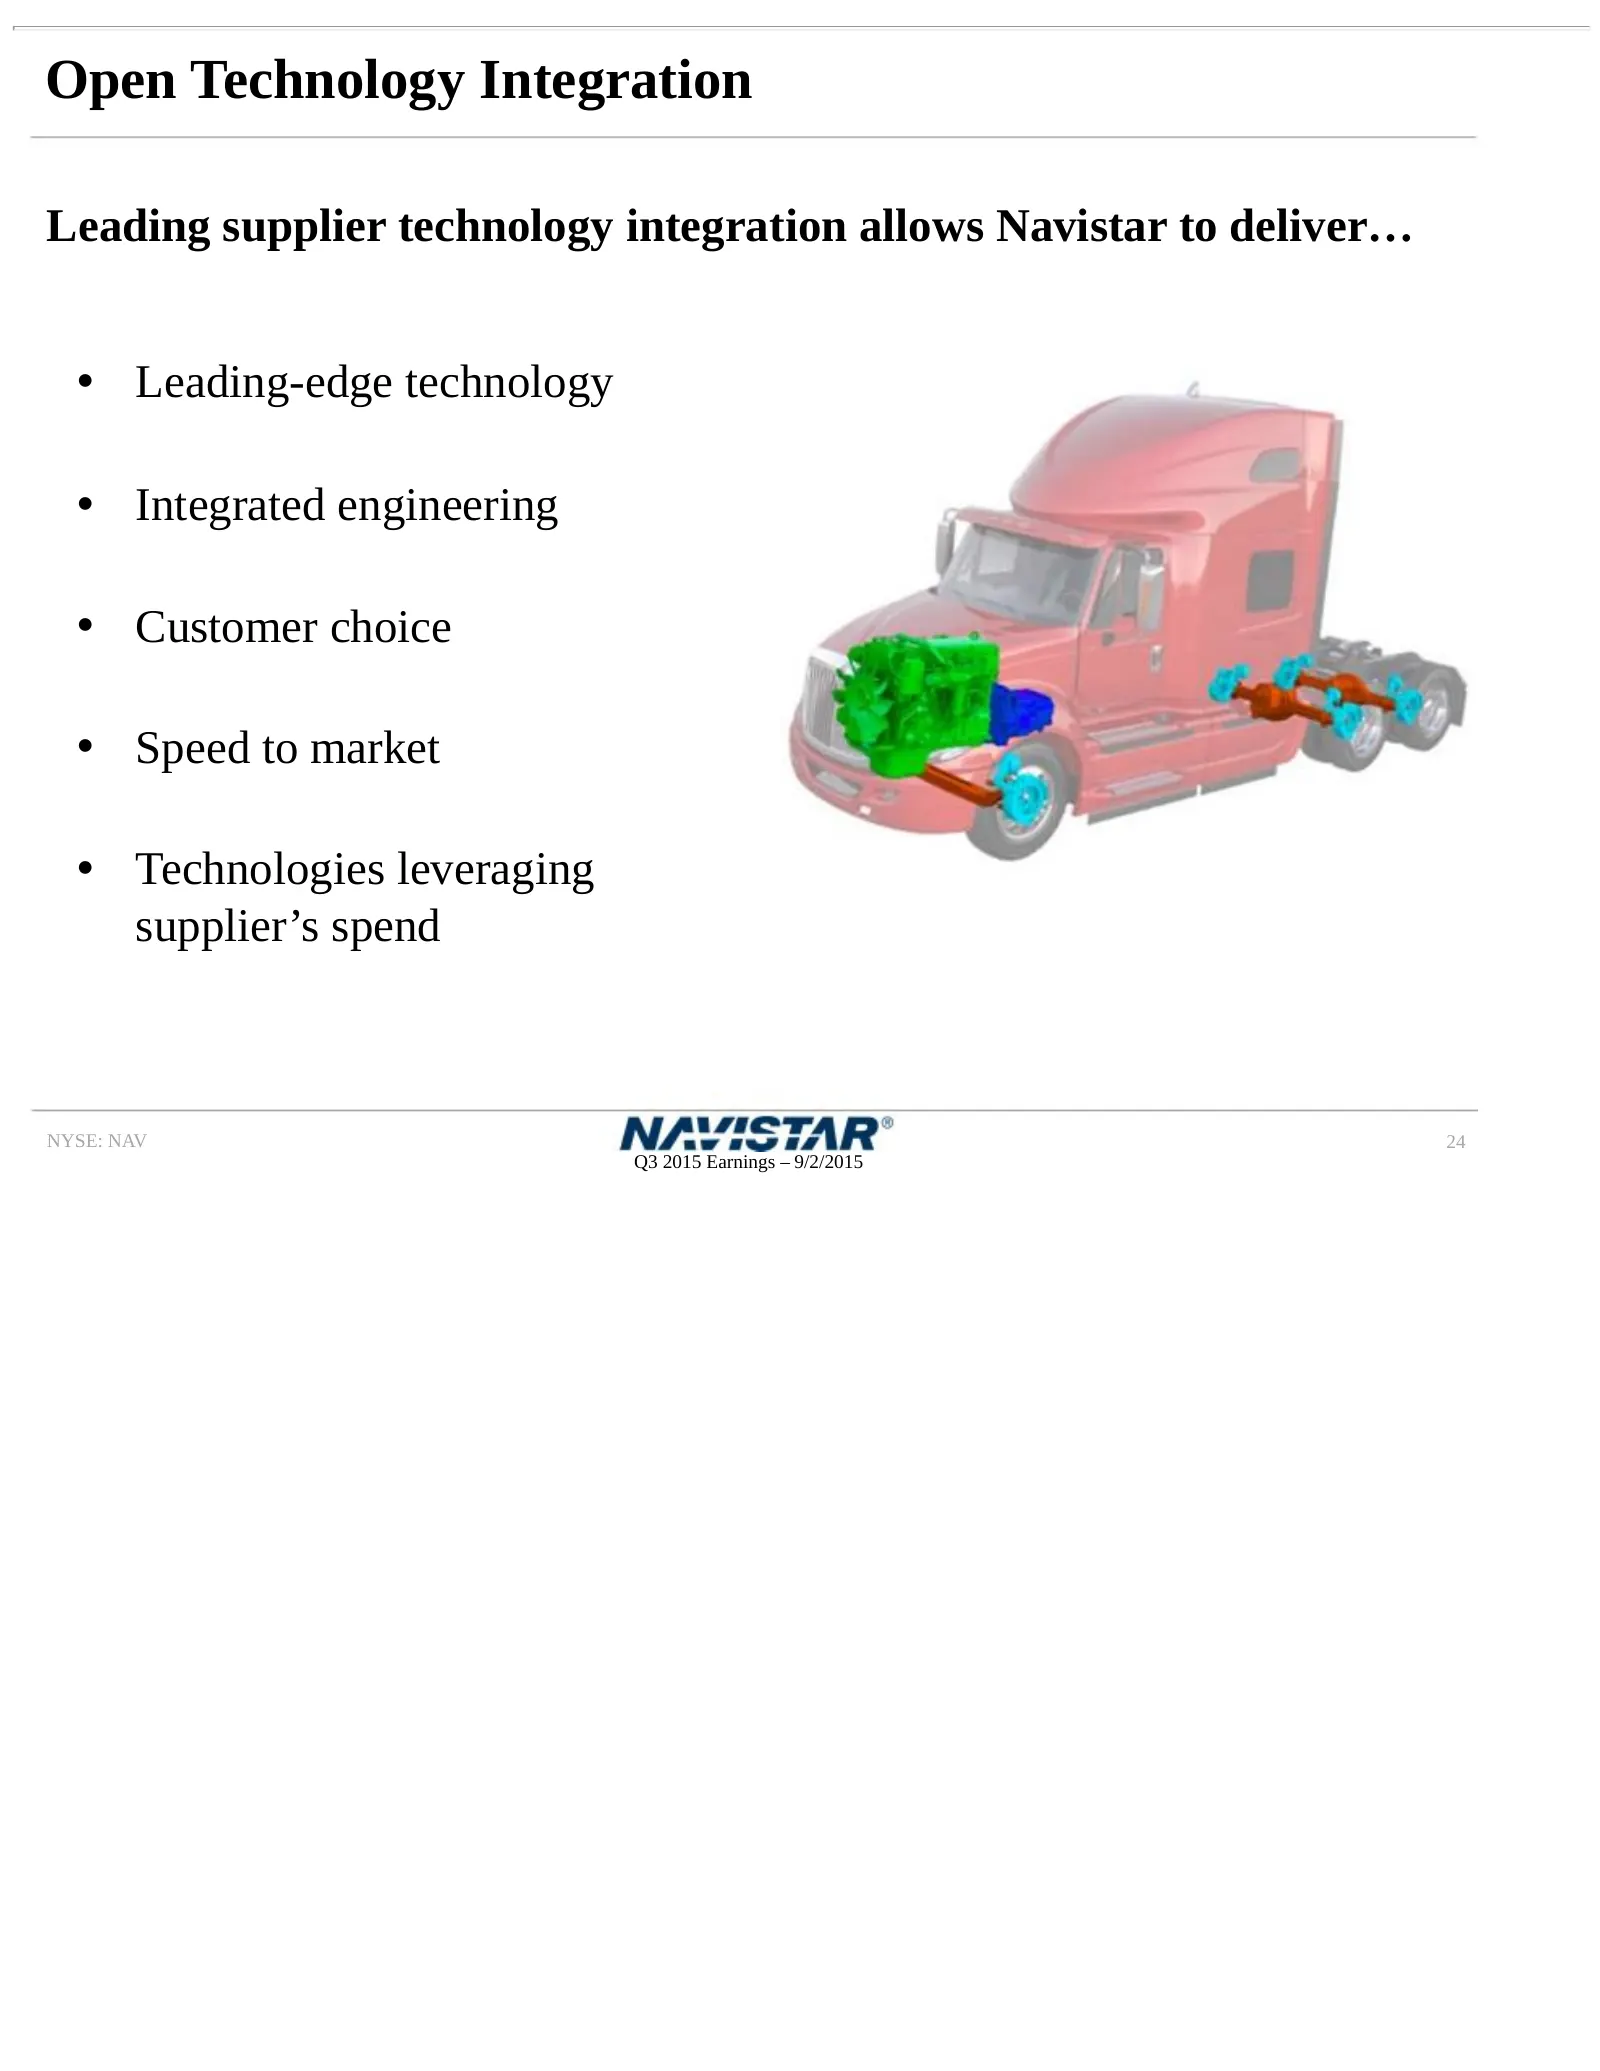
Open Technology Integration Leading supplier technology integration allows Navistar to deliver… • Leading-edge technology • Integrated engineering • Customer choice • Speed to market • Technologies leveraging supplier’s spend NYSE: NAV 24 Q3 2015 Earnings – 9/2/2015
Slide 25: Connected Vehicle – Differentiation that Creates Value
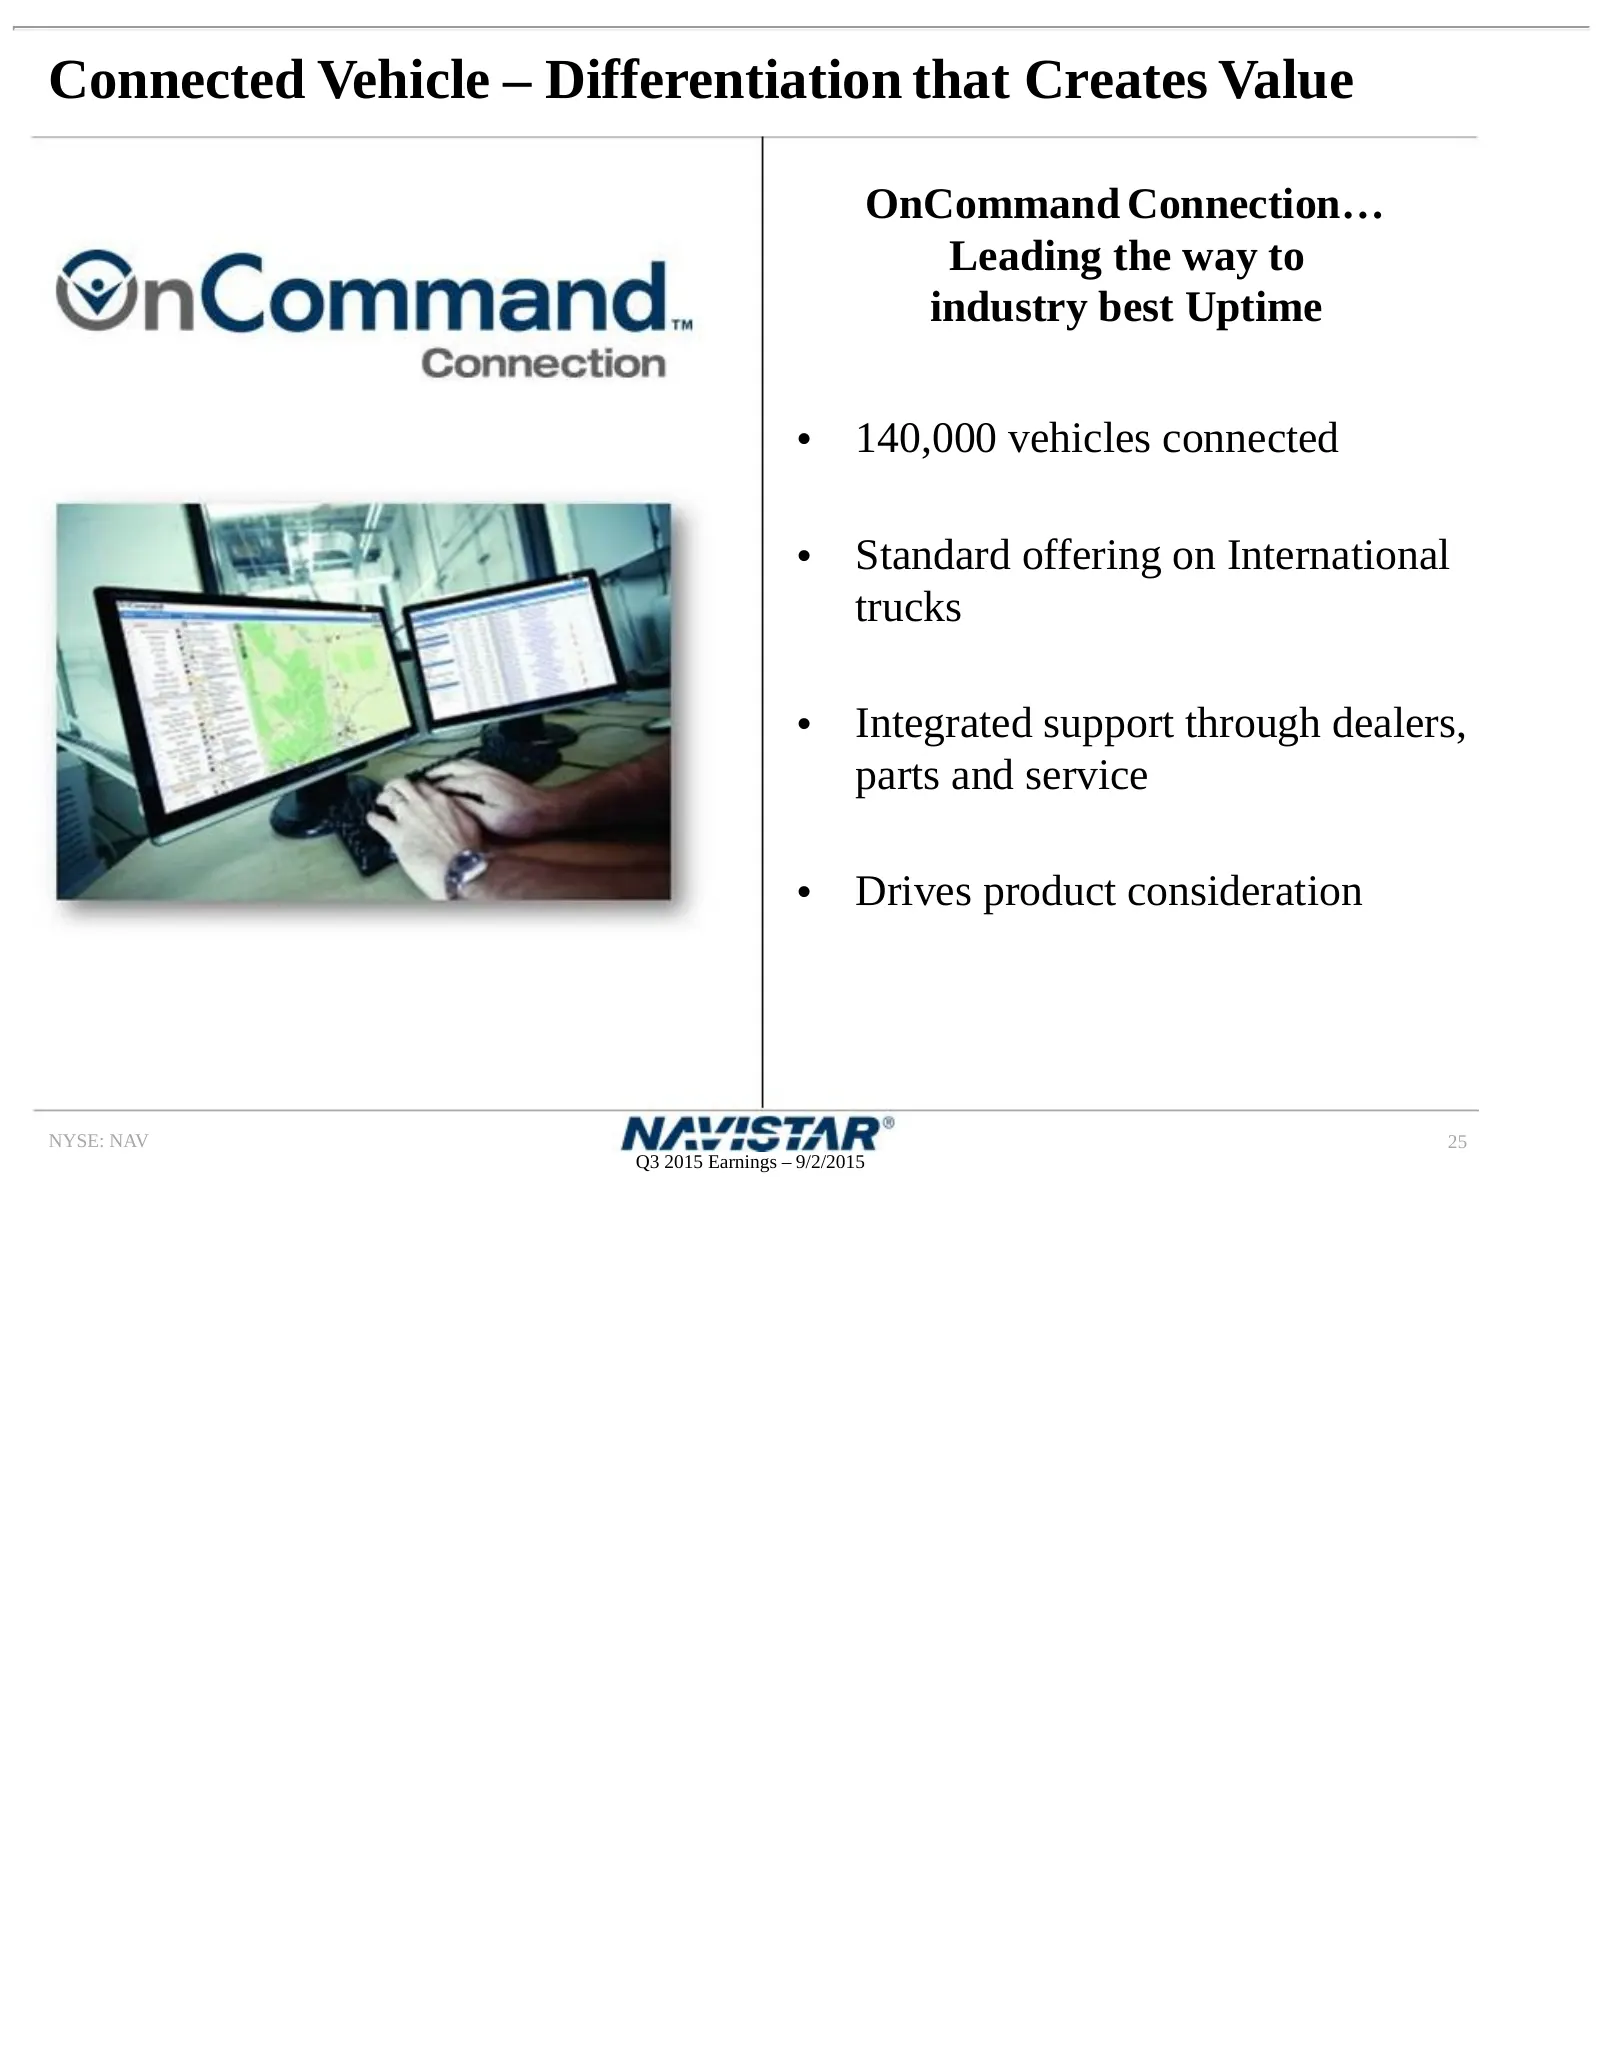
Connected Vehicle – Differentiation that Creates Value OnCommand Connection… Leading the way to industry best Uptime • 140,000 vehicles connected • Standard offering on International trucks • Integrated support through dealers, parts and service • Drives product consideration NYSE: NAV 25 Q3 2015 Ea
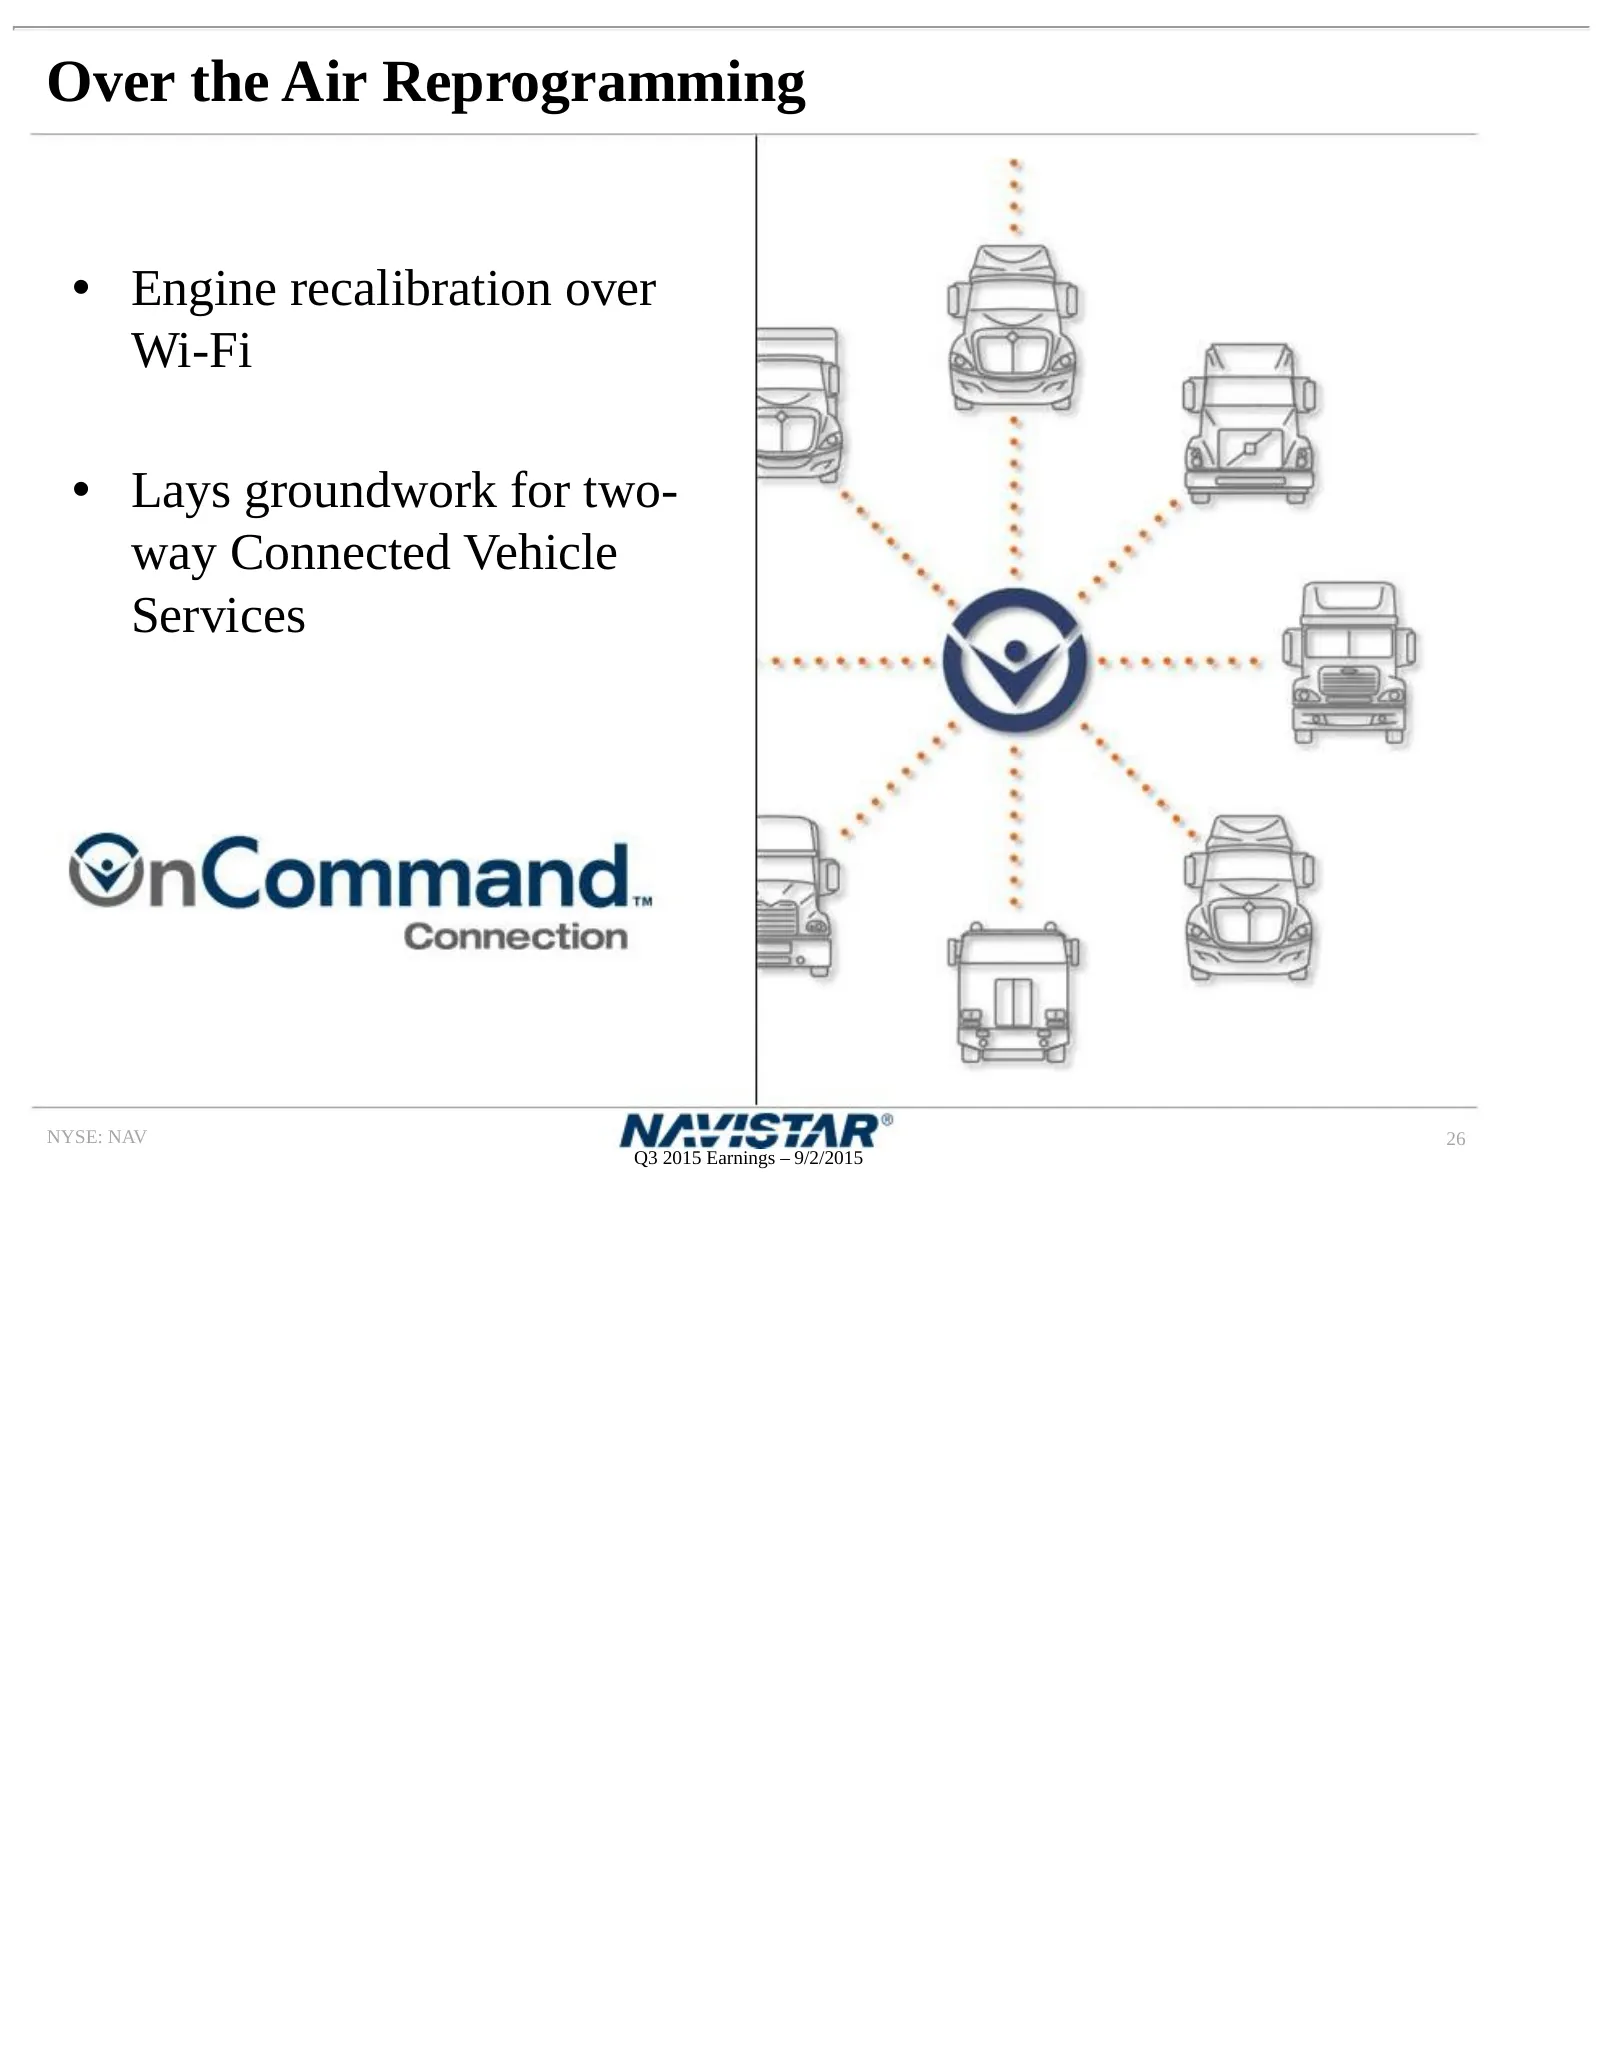
Slide 26: Over the Air Reprogramming
Over the Air Reprogramming • Engine recalibration over Wi-Fi • Lays groundwork for two- way Connected Vehicle Services NYSE: NAV 26 Q3 2015 Earnings – 9/2/2015
Slide 27: Driving Value
Driving Value • Next phase cost improvements • Increase product consideration • Connected vehicle • Open technology integration NYSE: NAV 27 Q3 2015 Earnings – 9/2/2015
Slide 28: Appendix
APPENDIX NAYISTAR’
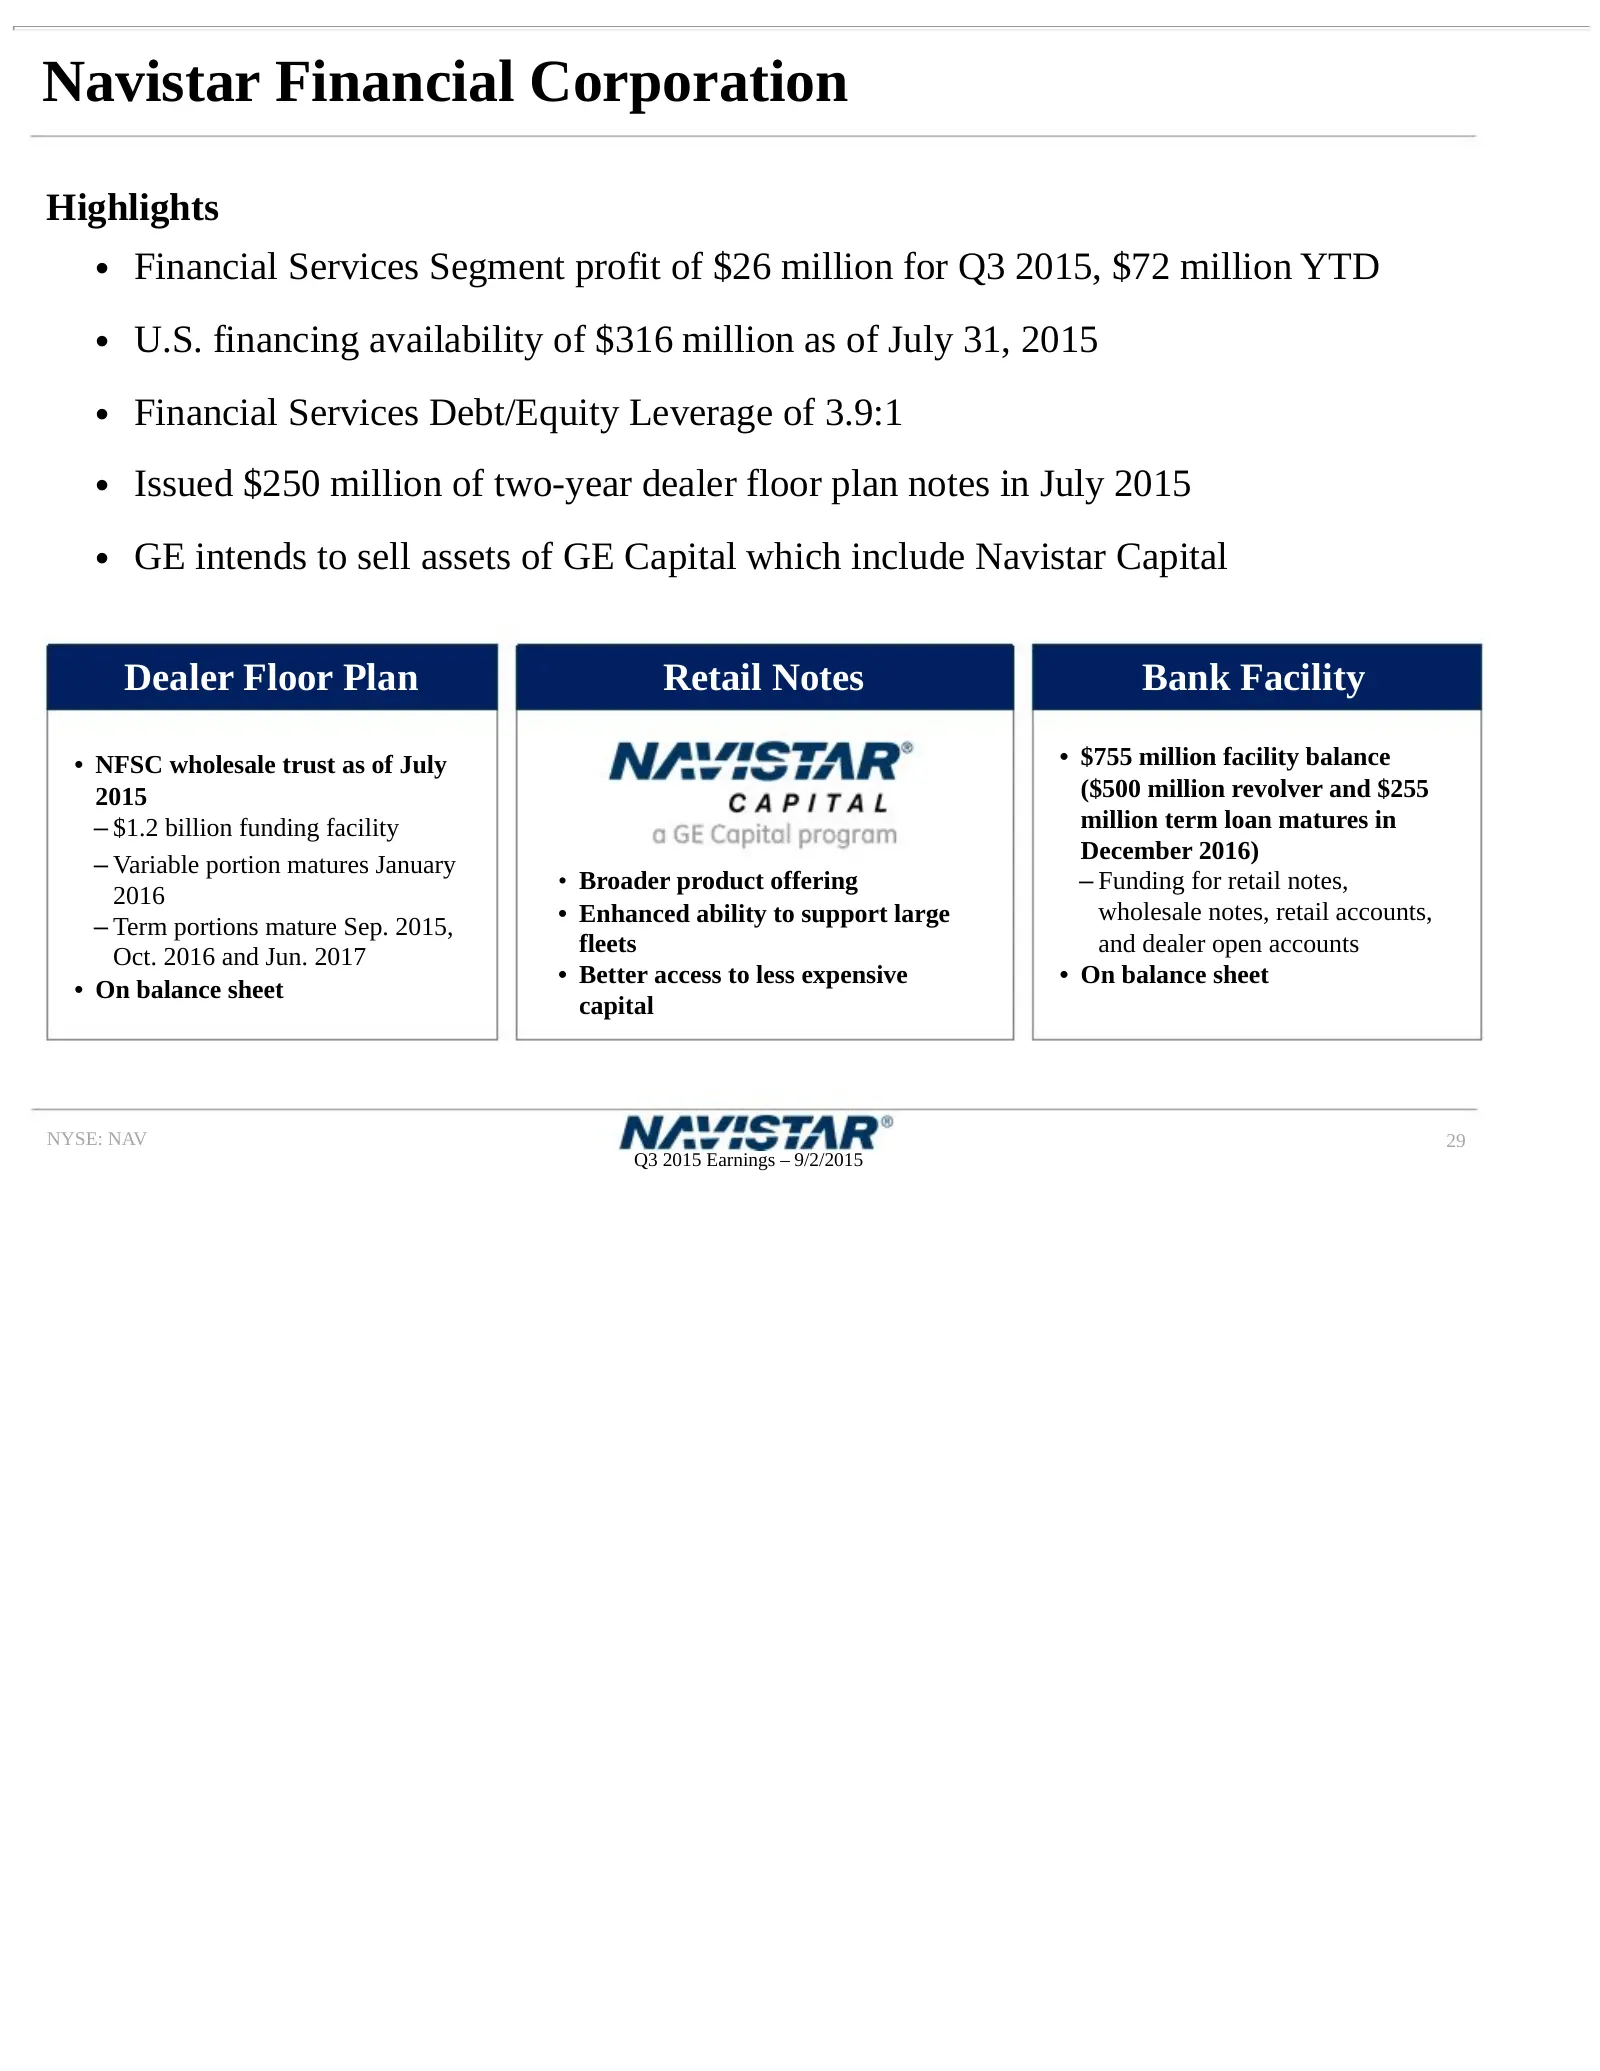
Slide 29: Navistar Financial Corporation
Navistar Financial Corporation Highlights • Financial Services Segment profit of $26 million for Q3 2015, $72 million YTD • U.S. financing availability of $316 million as of July 31, 2015 • Financial Services Debt/Equity Leverage of 3.9:1 • Issued $250 million of two-year dealer floor plan notes in
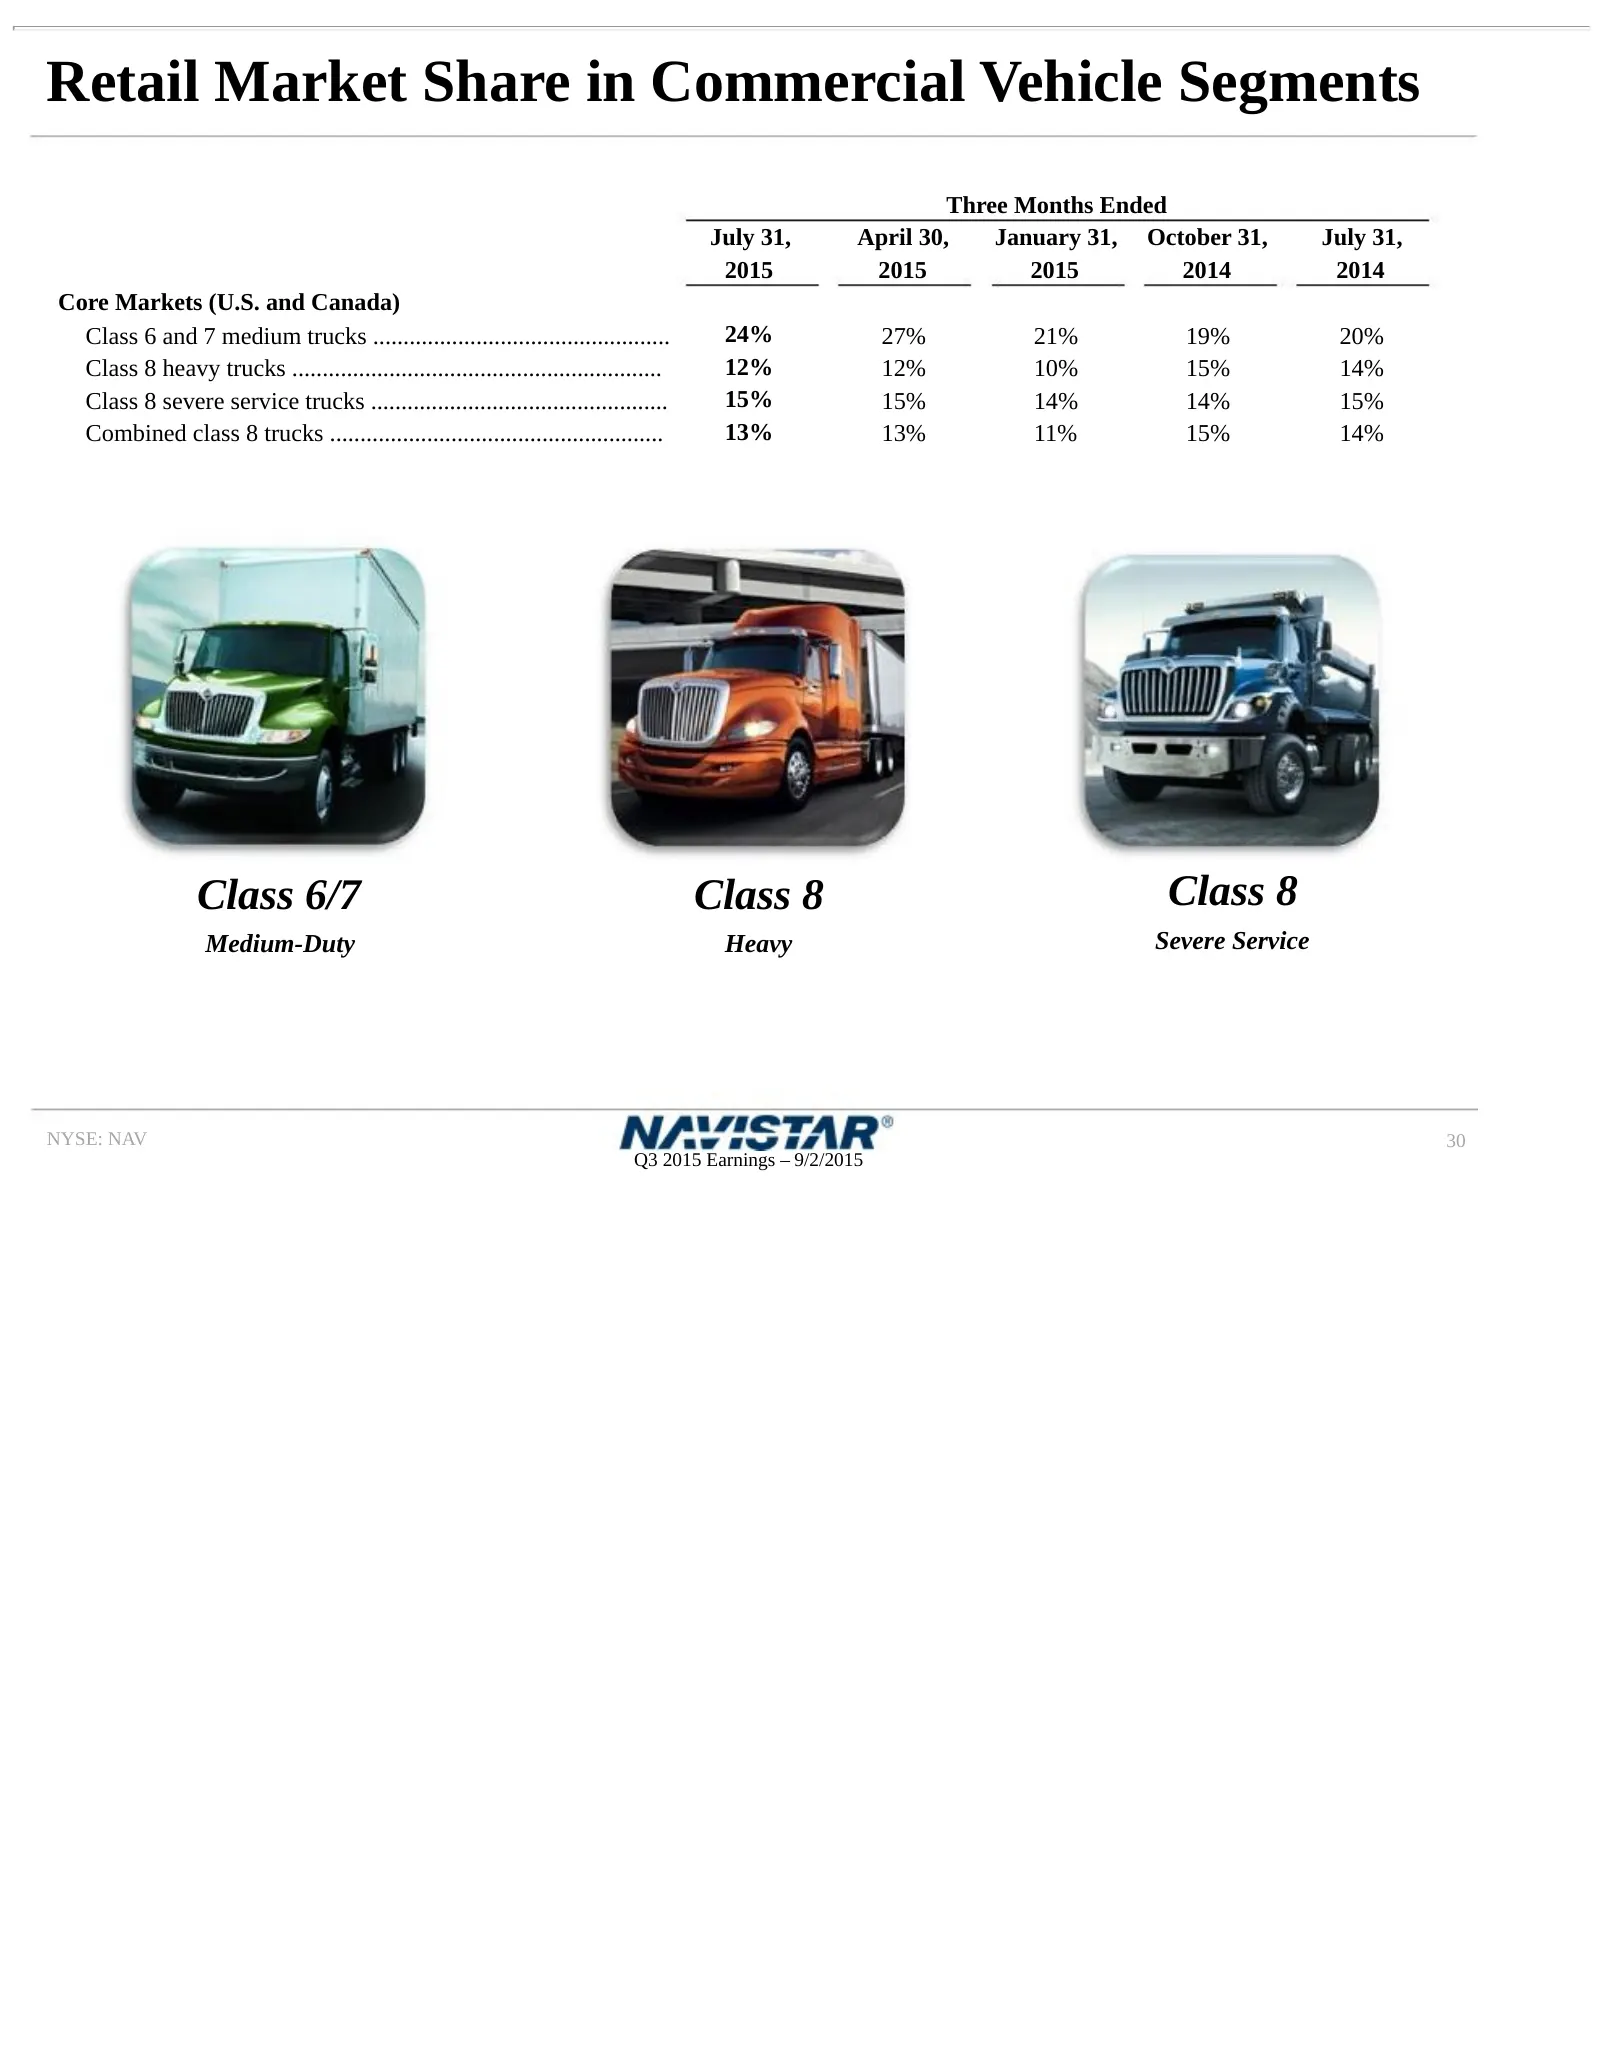
Slide 30: Retail Market Share in Commercial Vehicle Segments
Retail Market Share in Commercial Vehicle Segments Three Months Ended July 31, April 30, January 31, October 31, July 31, 2015 2015 2015 2014 2014 Core Markets (U.S. and Canada) Class 6 and 7 medium trucks ................................................. 24% 27% 21% 19% 20% Class 8 heavy trucks ...
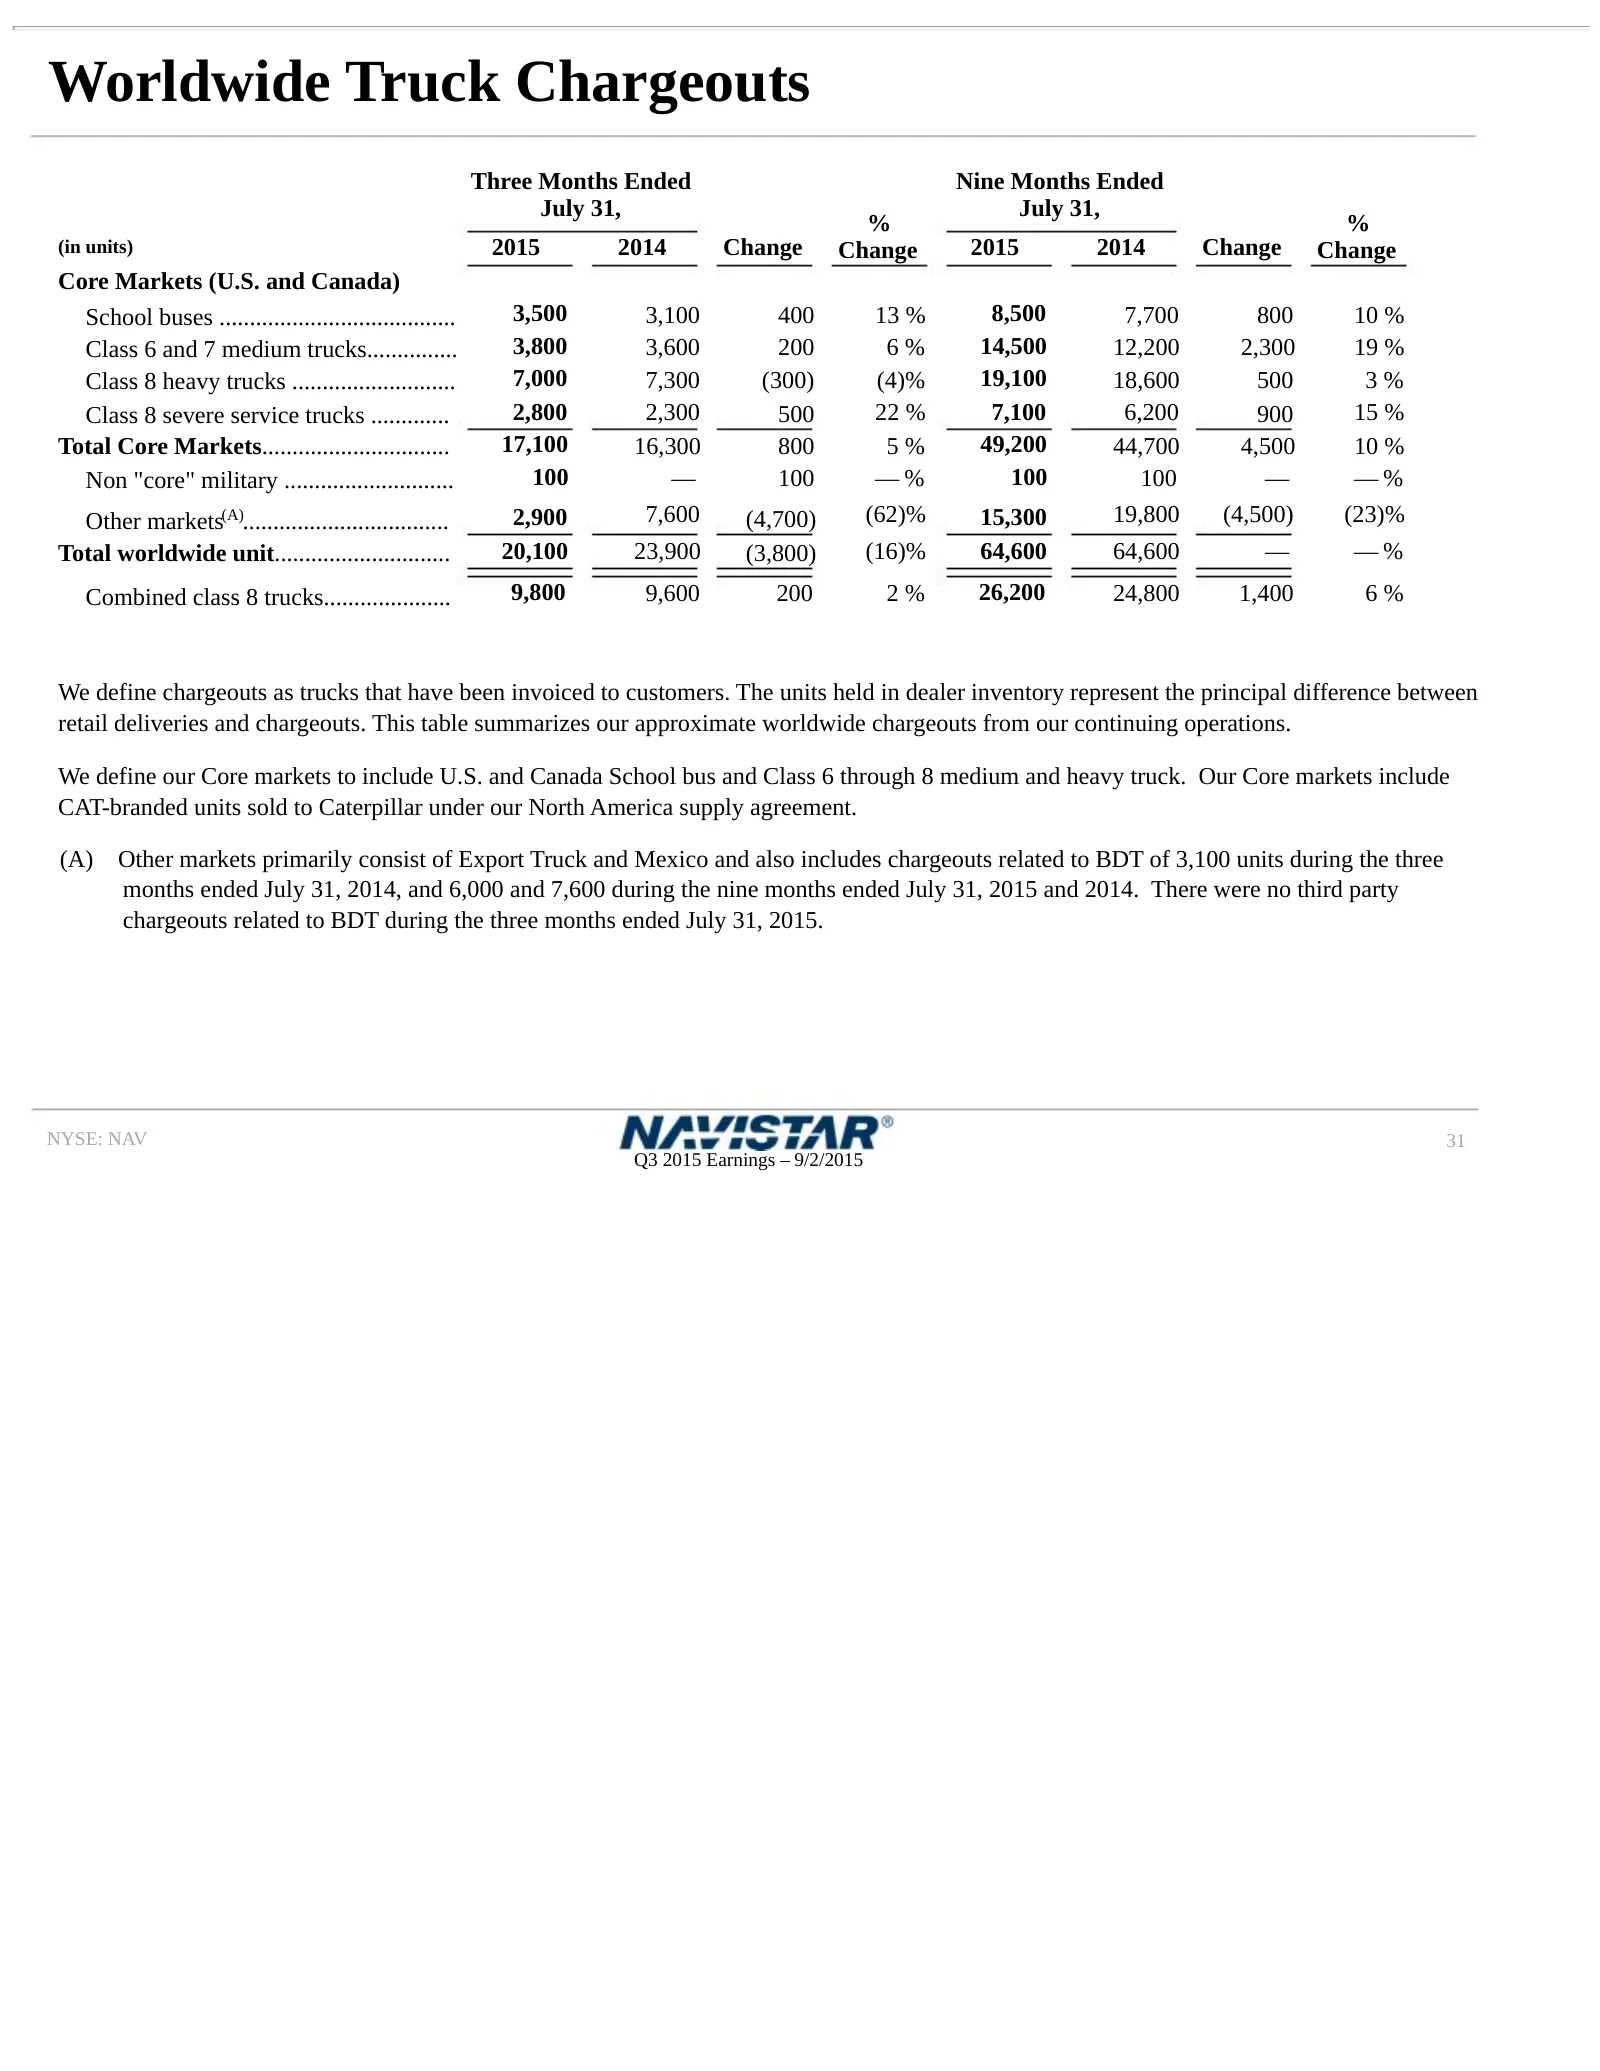
Slide 31: Worldwide Truck Chargeouts
Worldwide Truck Chargeouts Three Months Ended Nine Months Ended July 31, July 31, % % (in units) 2015 2014 Change Change 2015 2014 Change Change Core Markets (U.S. and Canada) School buses ....................................... 3,500 3,100 400 13 % 8,500 7,700 800 10 % Class 6 and 7 medium trucks..
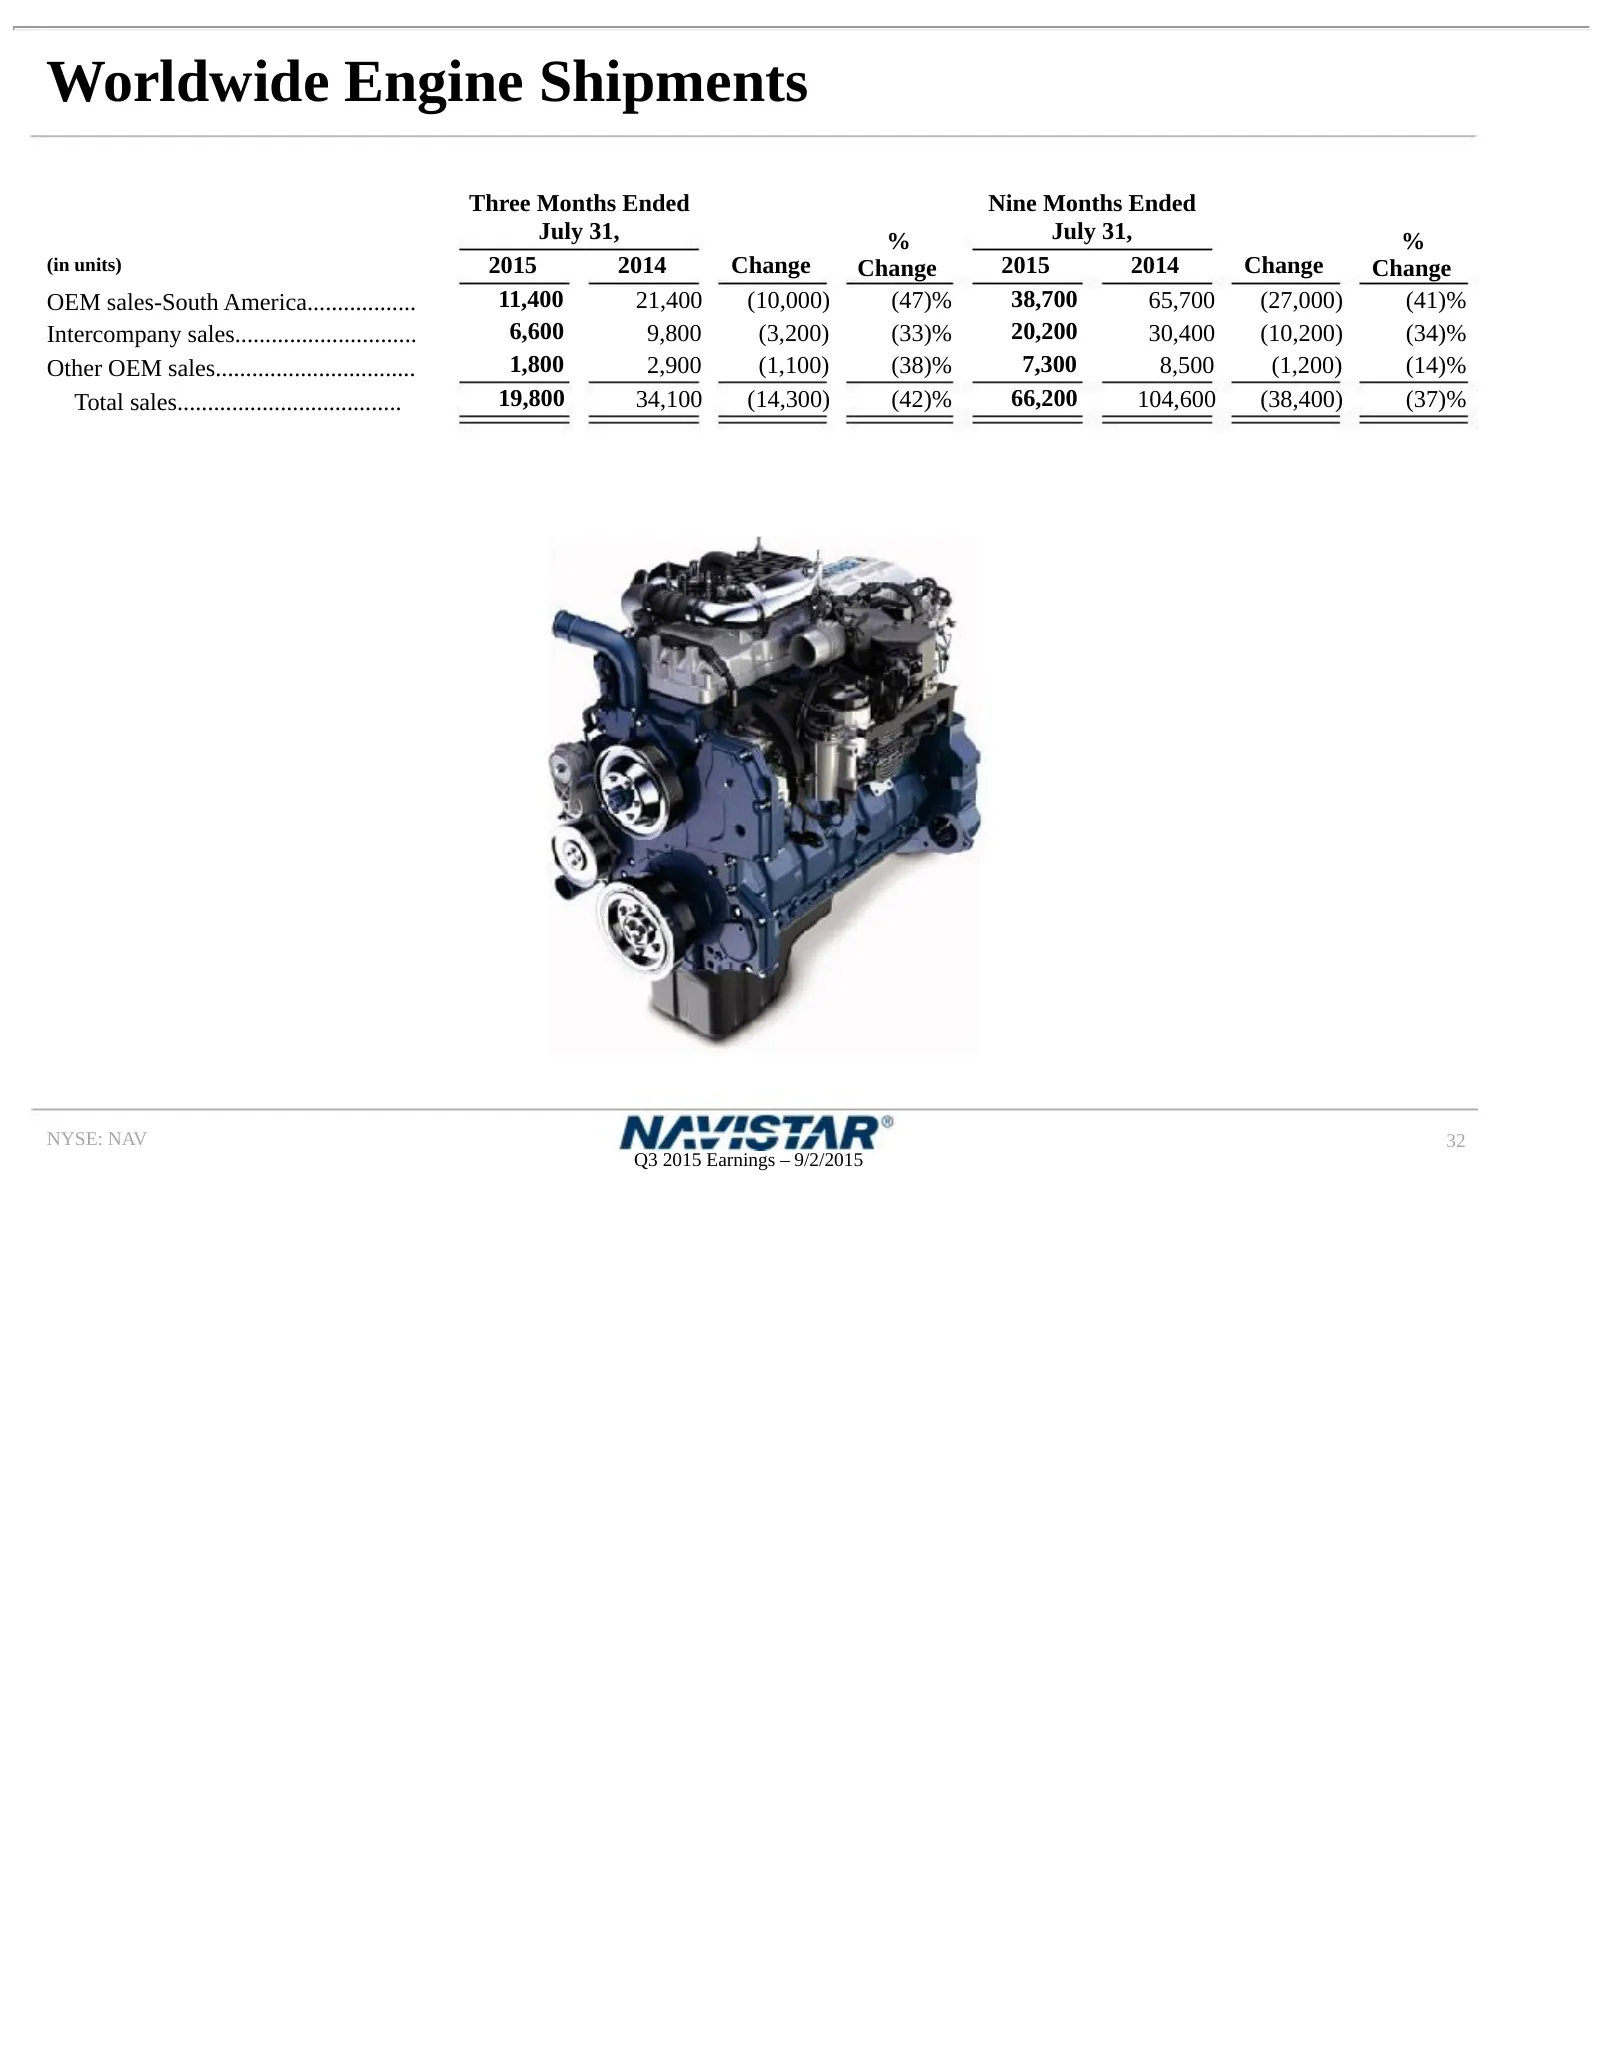
Slide 32: Worldwide Engine Shipments
Worldwide Engine Shipments Three Months Ended Nine Months Ended July 31, % July 31, % (in units) 2015 2014 Change Change 2015 2014 Change Change OEM sales-South America.................. 11,400 21,400 (10,000) (47)% 38,700 65,700 (27,000) (41)% Intercompany sales.............................. 6,600
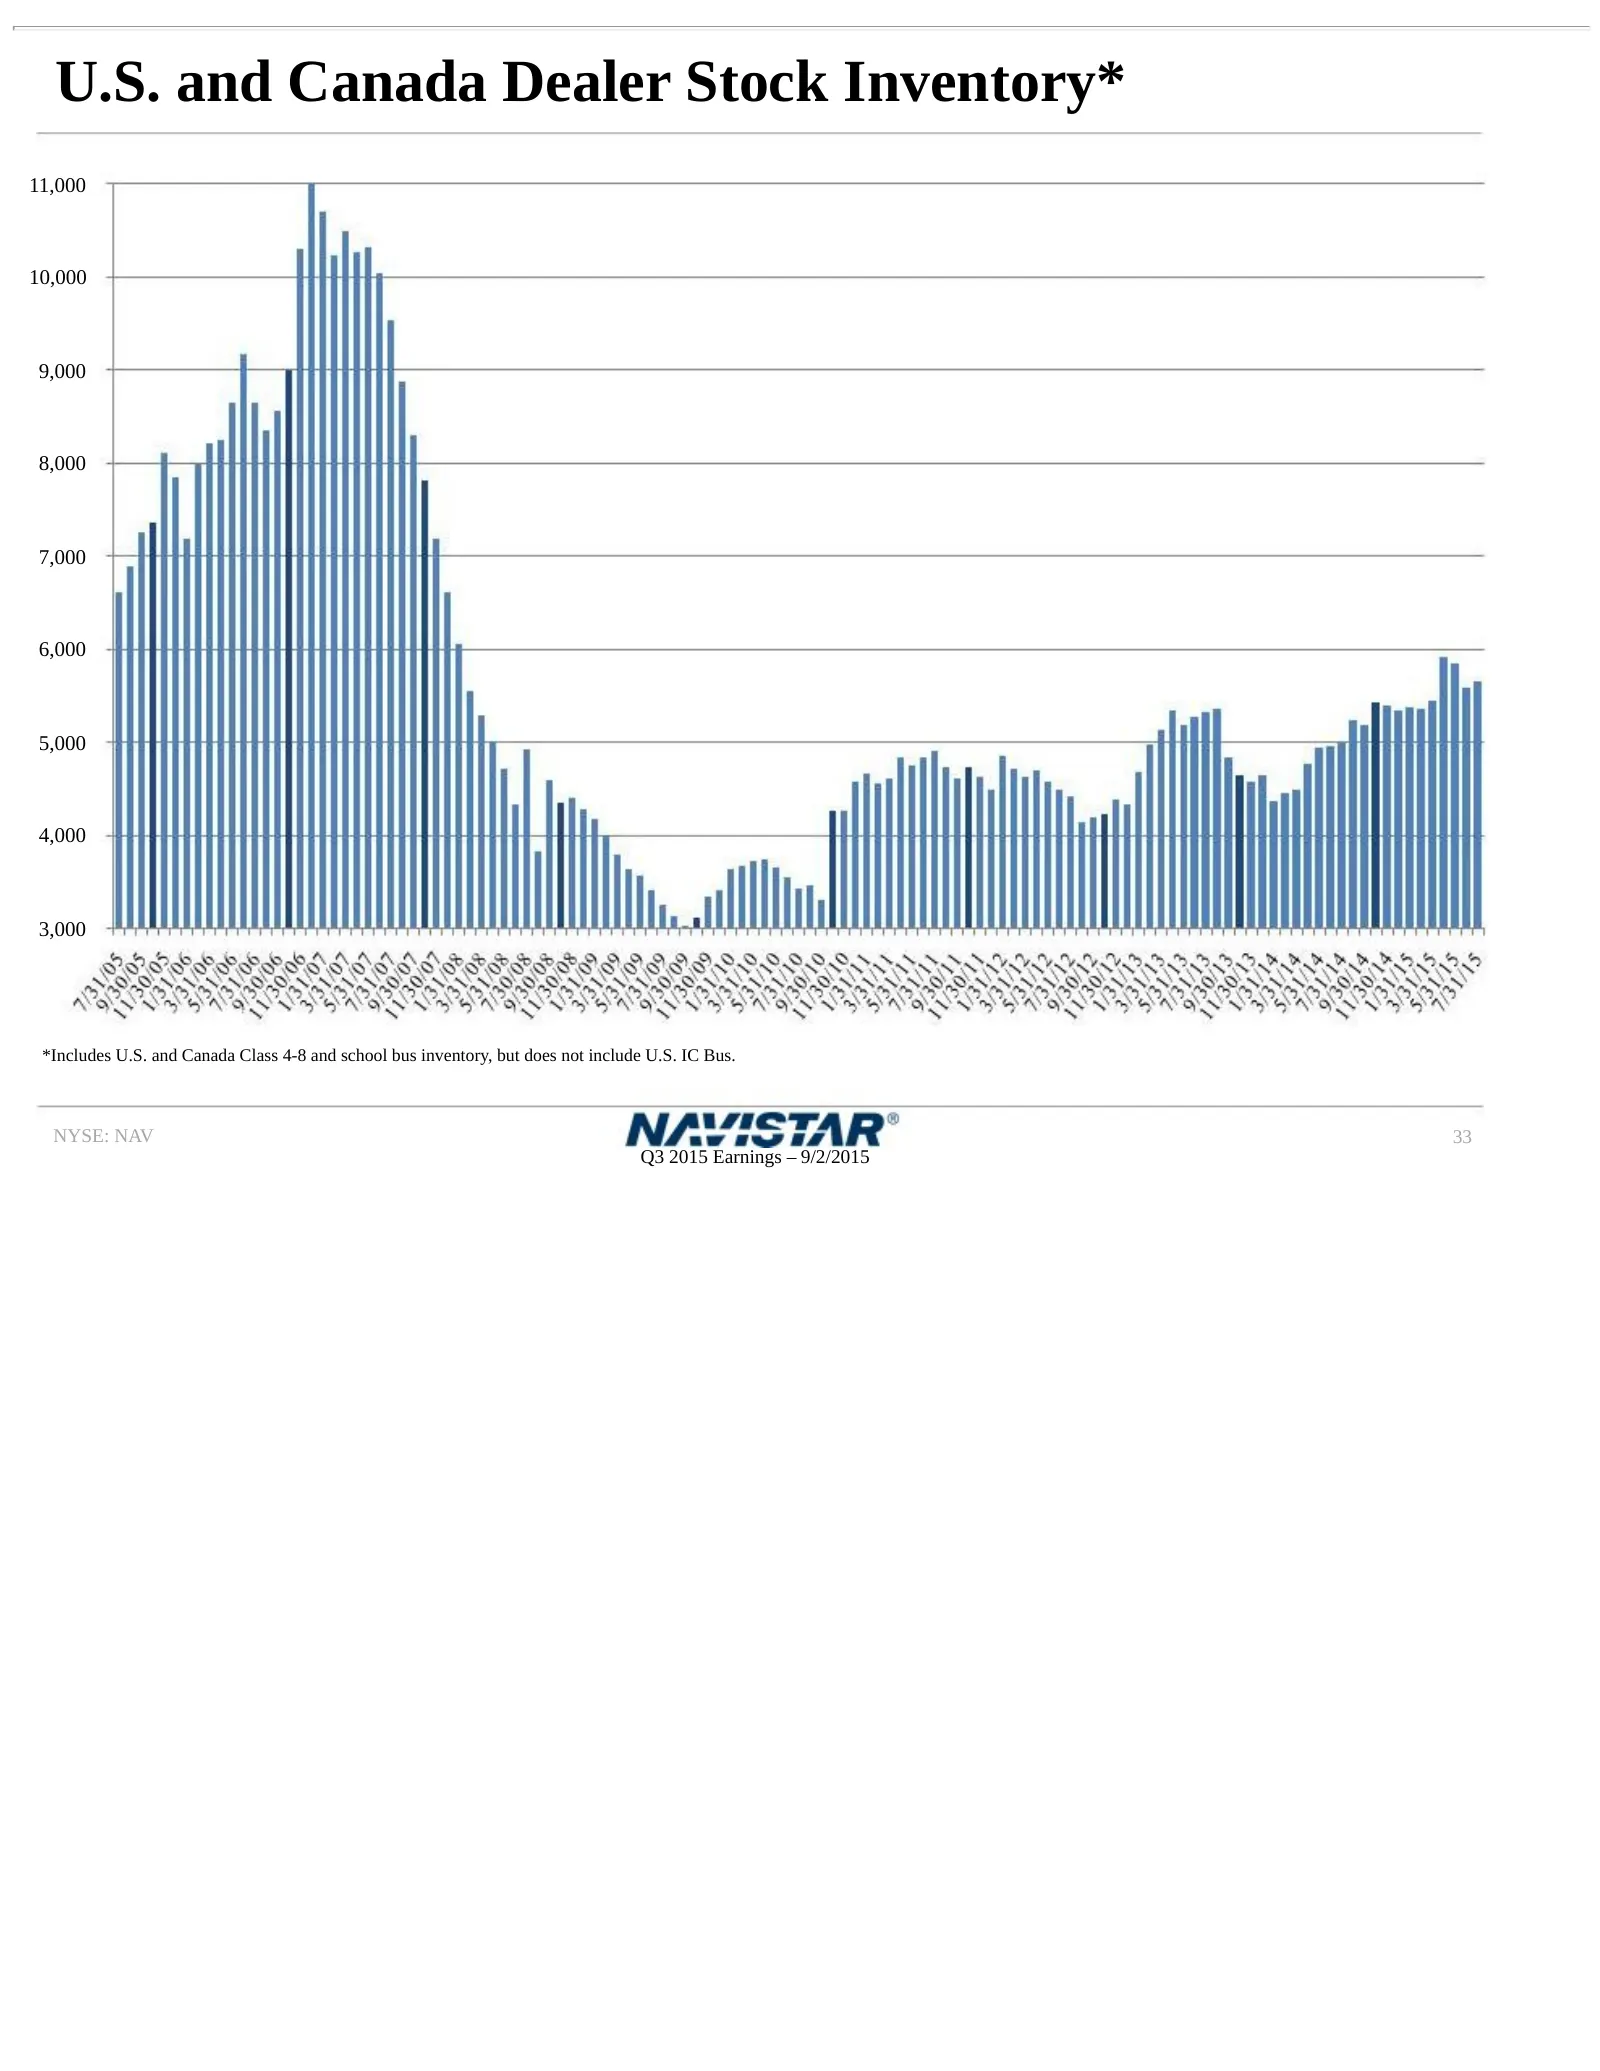
Slide 33: U.S. and Canada Dealer Stock Inventory
U.S. and Canada Dealer Stock Inventory* 11,000 10,000 9,000 8,000 7,000 6,000 5,000 4,000 3,000 *Includes U.S. and Canada Class 4-8 and school bus inventory, but does not include U.S. IC Bus. NYSE: NAV 33 Q3 2015 Earnings – 9/2/2015
Slide 34: Frequently Asked Questions
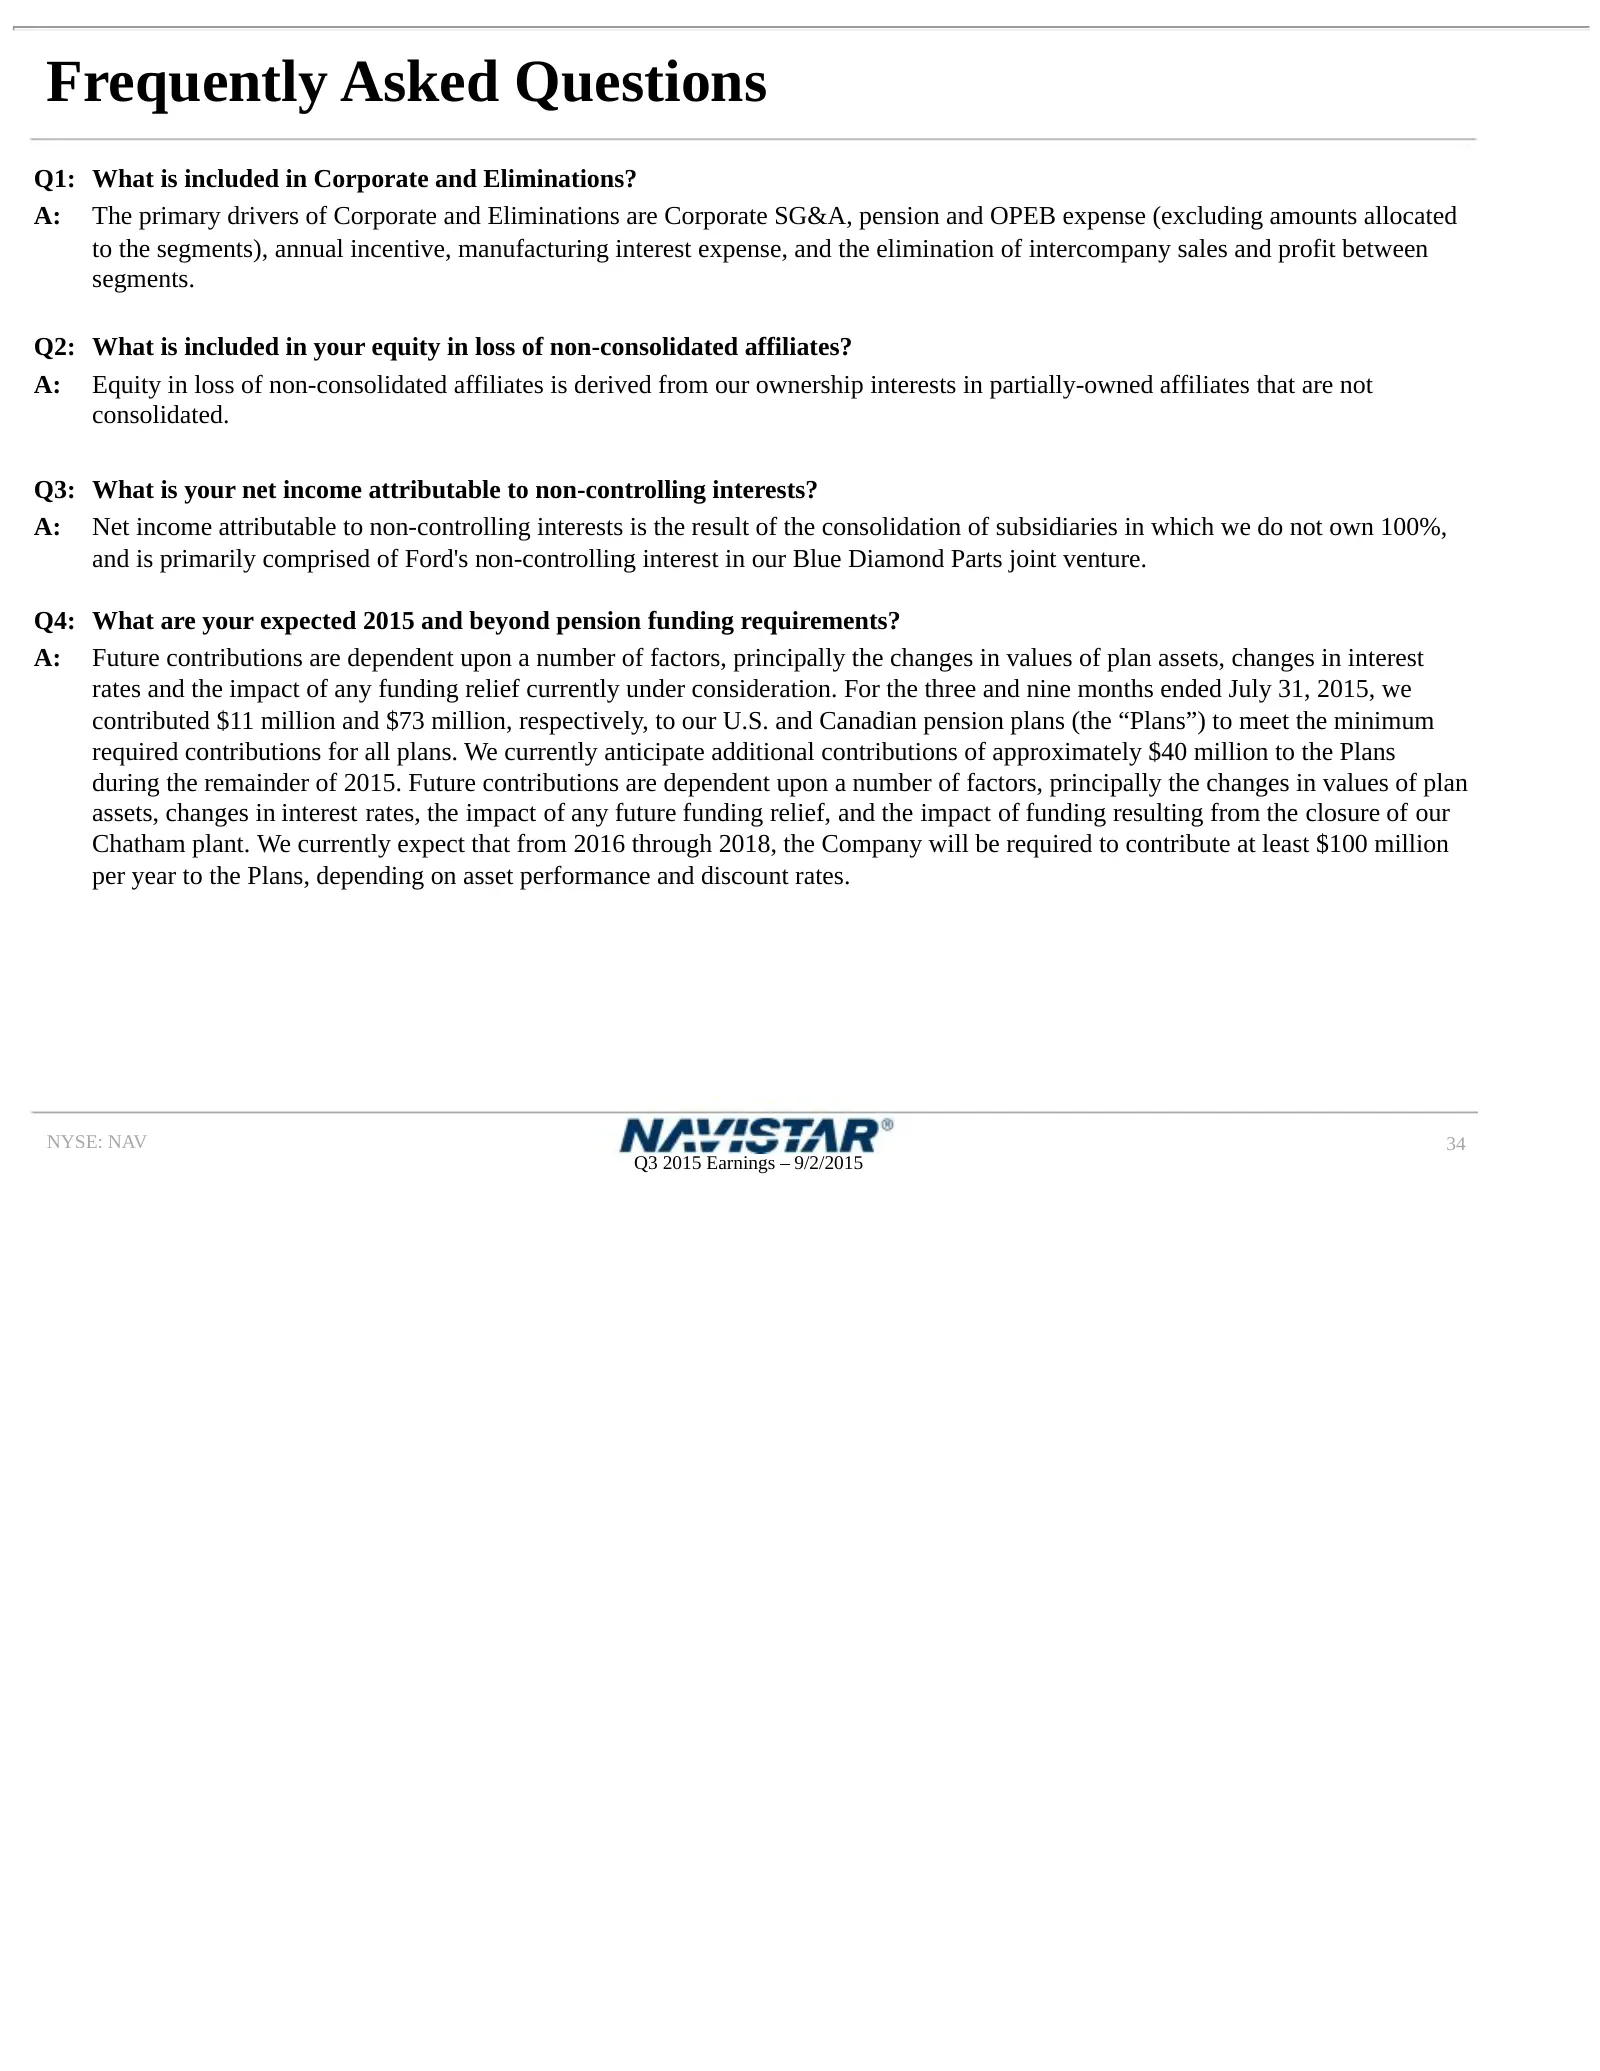
Frequently Asked Questions Q1: What is included in Corporate and Eliminations? A: The primary drivers of Corporate and Eliminations are Corporate SG&A, pension and OPEB expense (excluding amounts allocated to the segments), annual incentive, manufacturing interest expense, and the elimination of int
Slide 35: Frequently Asked Questions
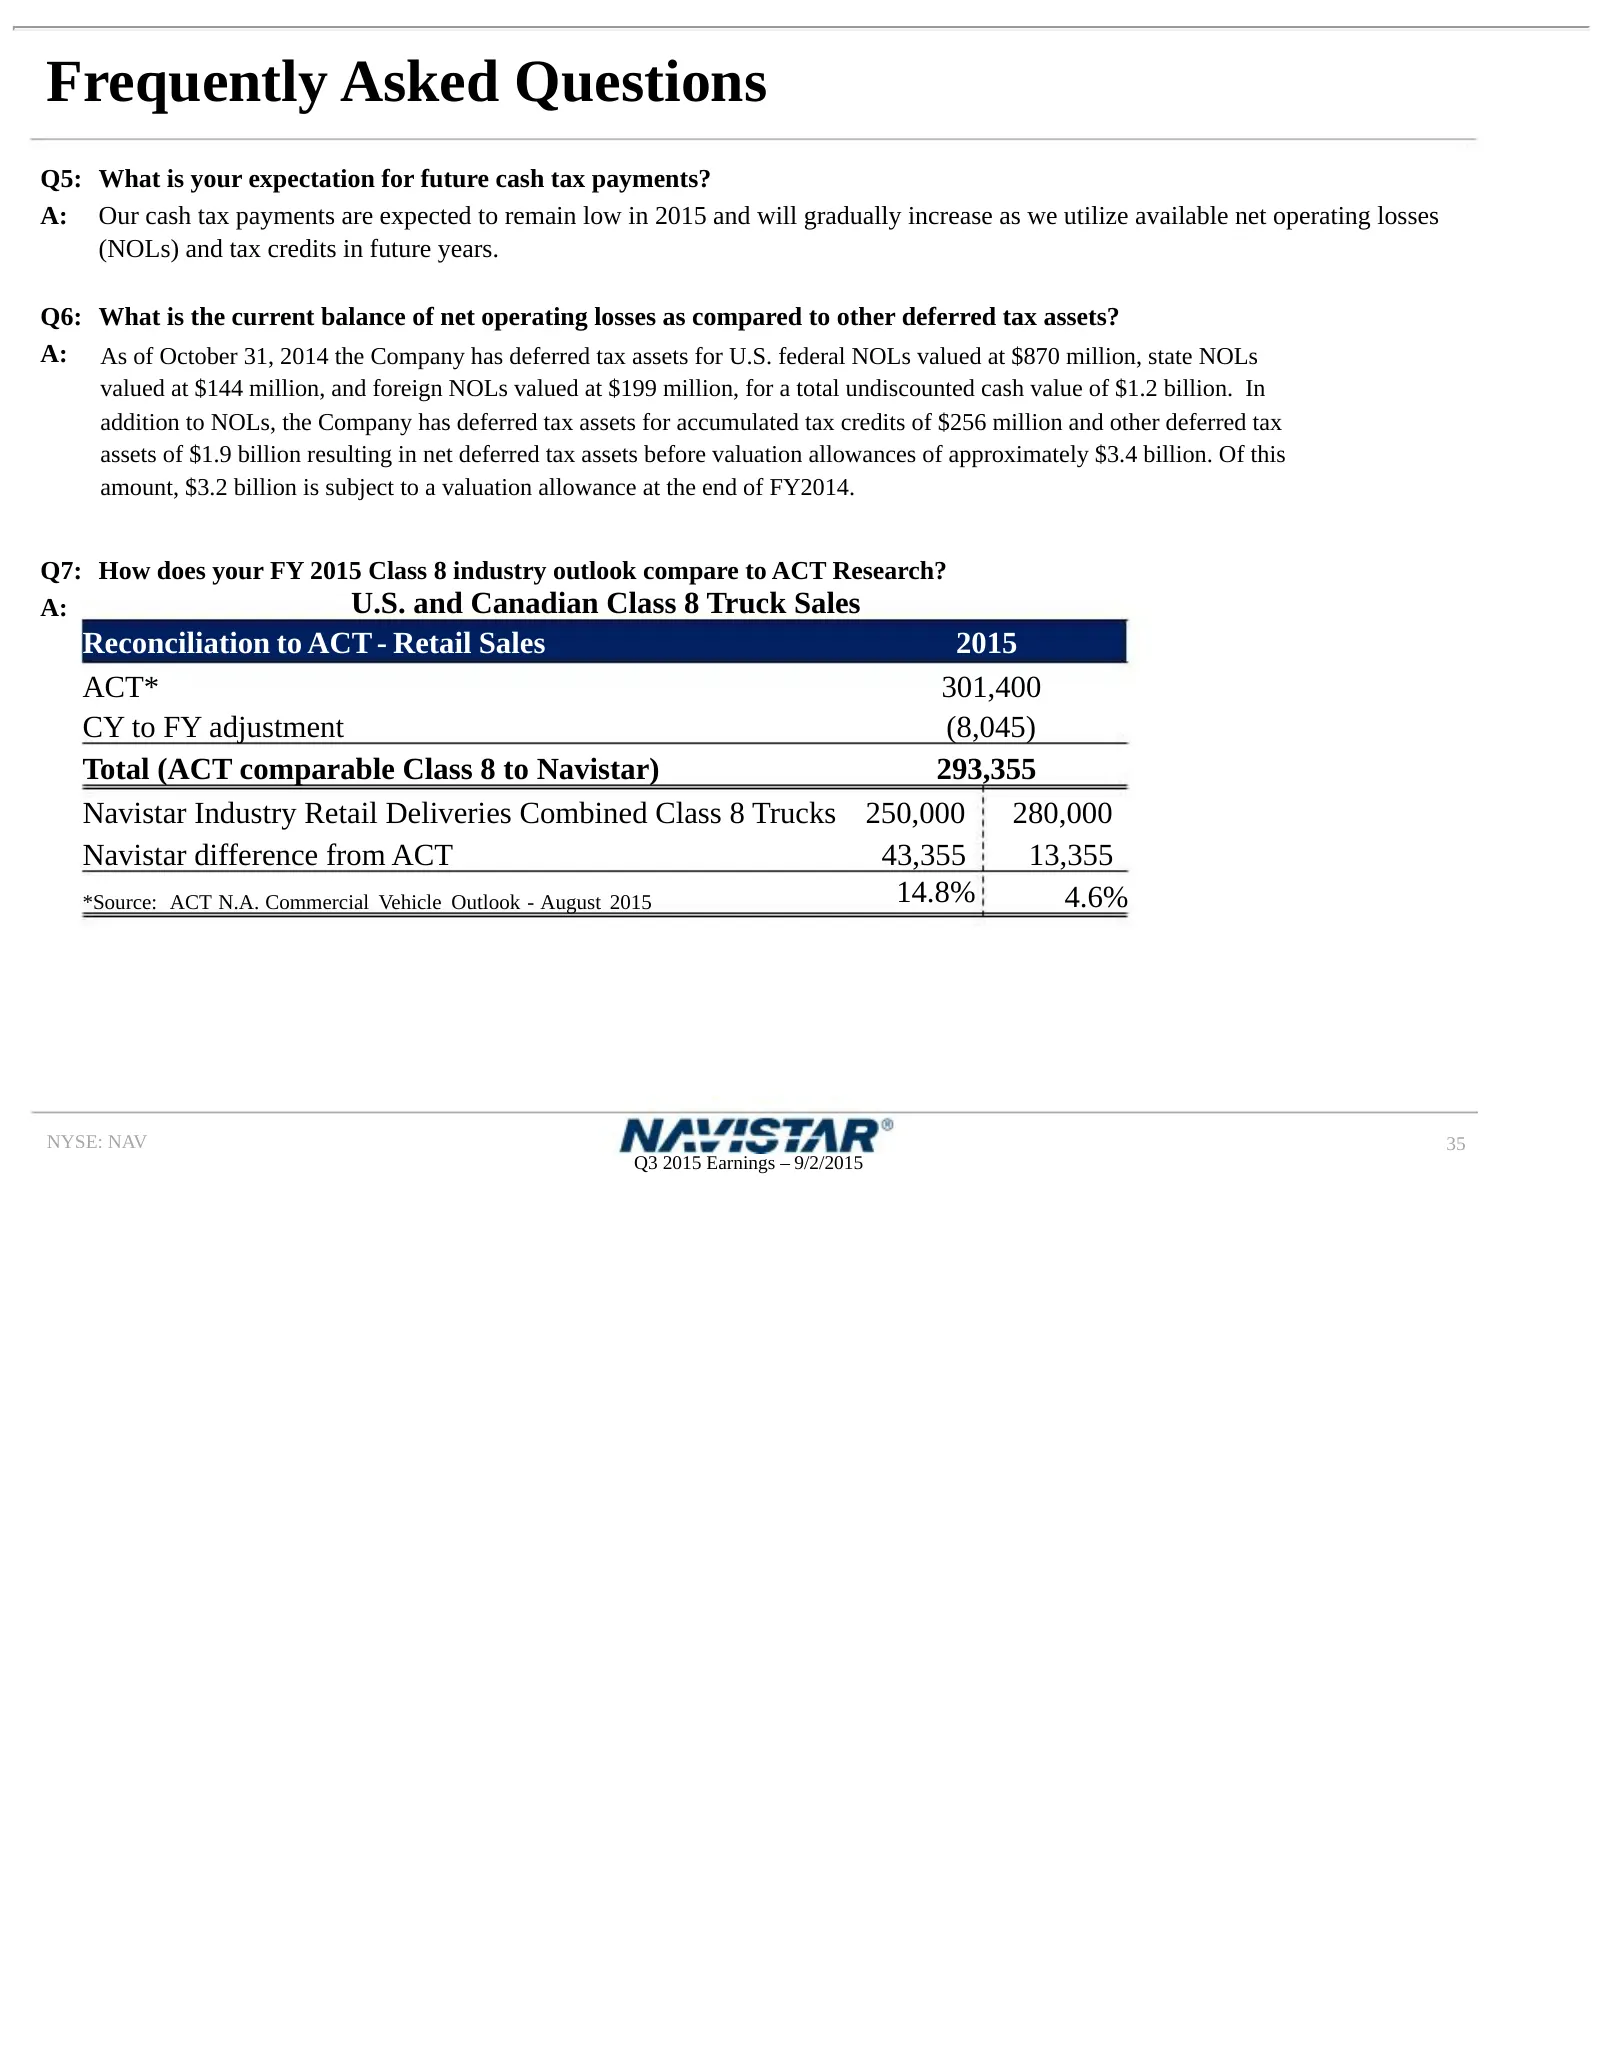
Frequently Asked Questions Q5: What is your expectation for future cash tax payments? A: Our cash tax payments are expected to remain low in 2015 and will gradually increase as we utilize available net operating losses (NOLs) and tax credits in future years. Q6: What is the current balance of net op
Slide 36: Frequently Asked Questions
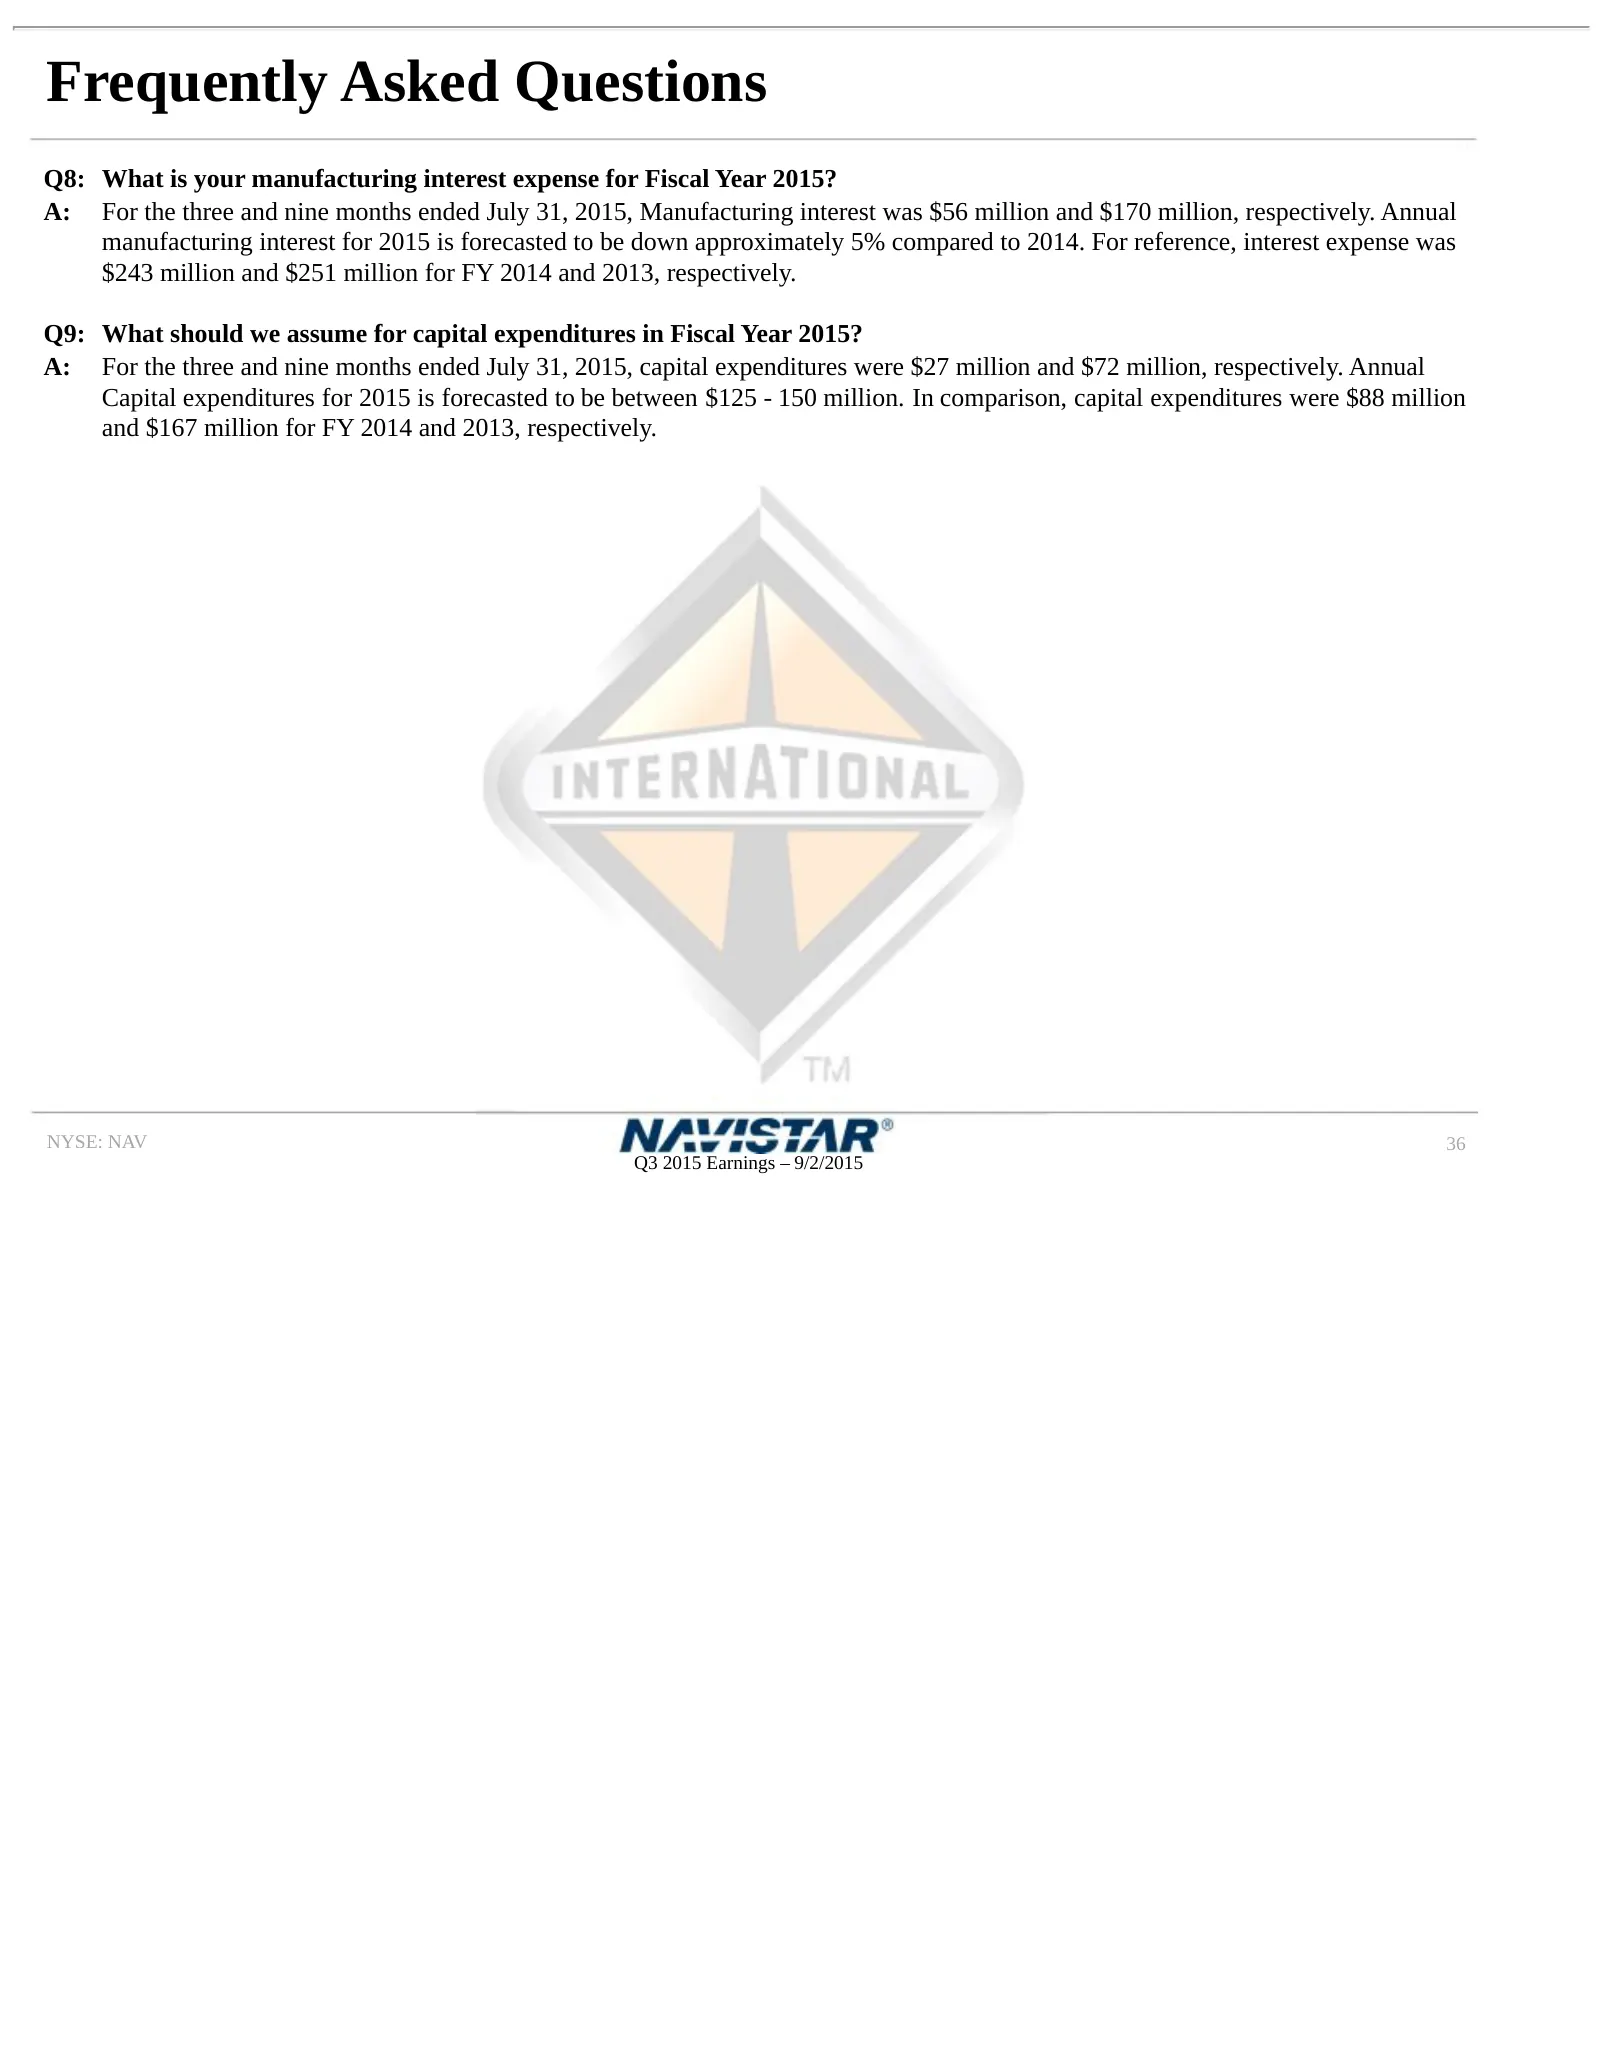
Frequently Asked Questions Q8: What is your manufacturing interest expense for Fiscal Year 2015? A: For the three and nine months ended July 31, 2015, Manufacturing interest was $56 million and $170 million, respectively. Annual manufacturing interest for 2015 is forecasted to be down approximately
Slide 37: Outstanding Debt Balances
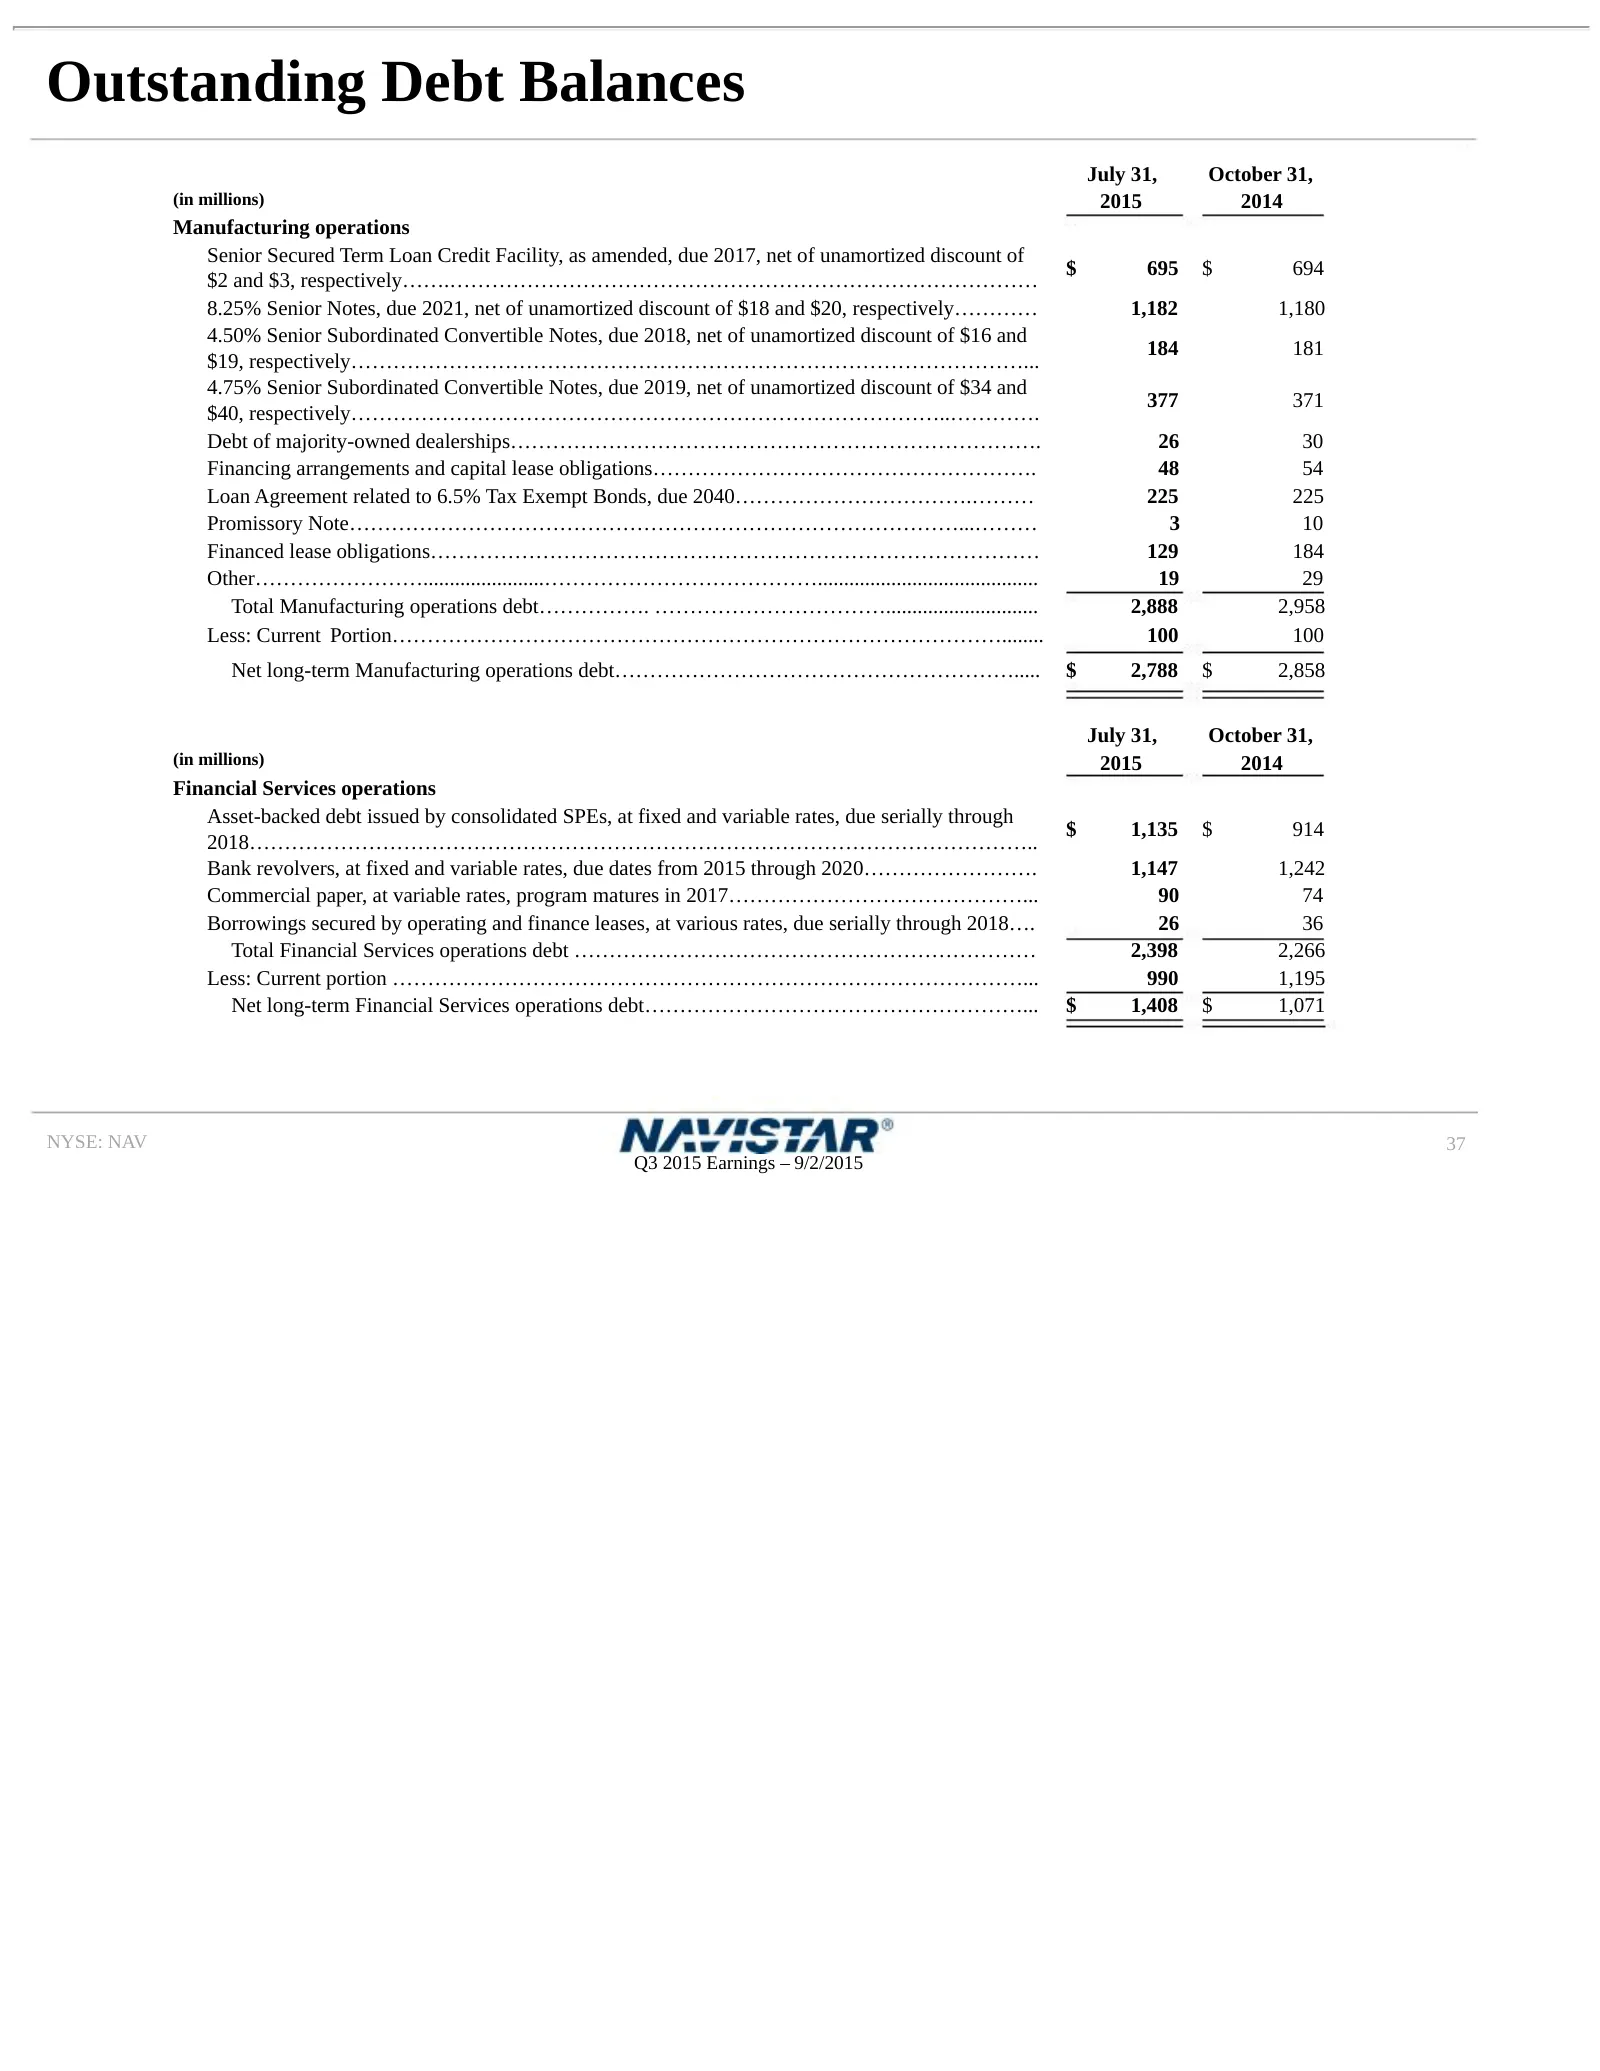
Outstanding Debt Balances July 31, October 31, (in millions) 2015 2014 Manufacturing operations Senior Secured Term Loan Credit Facility, as amended, due 2017, net of unamortized discount of $ 695 $ 694 $2 and $3, respectively…….………………………………………………………………………… 8.25% Senior Notes, due 2021, net of unamo
Slide 38: SEC Regulation G Non-GAAP Reconciliation
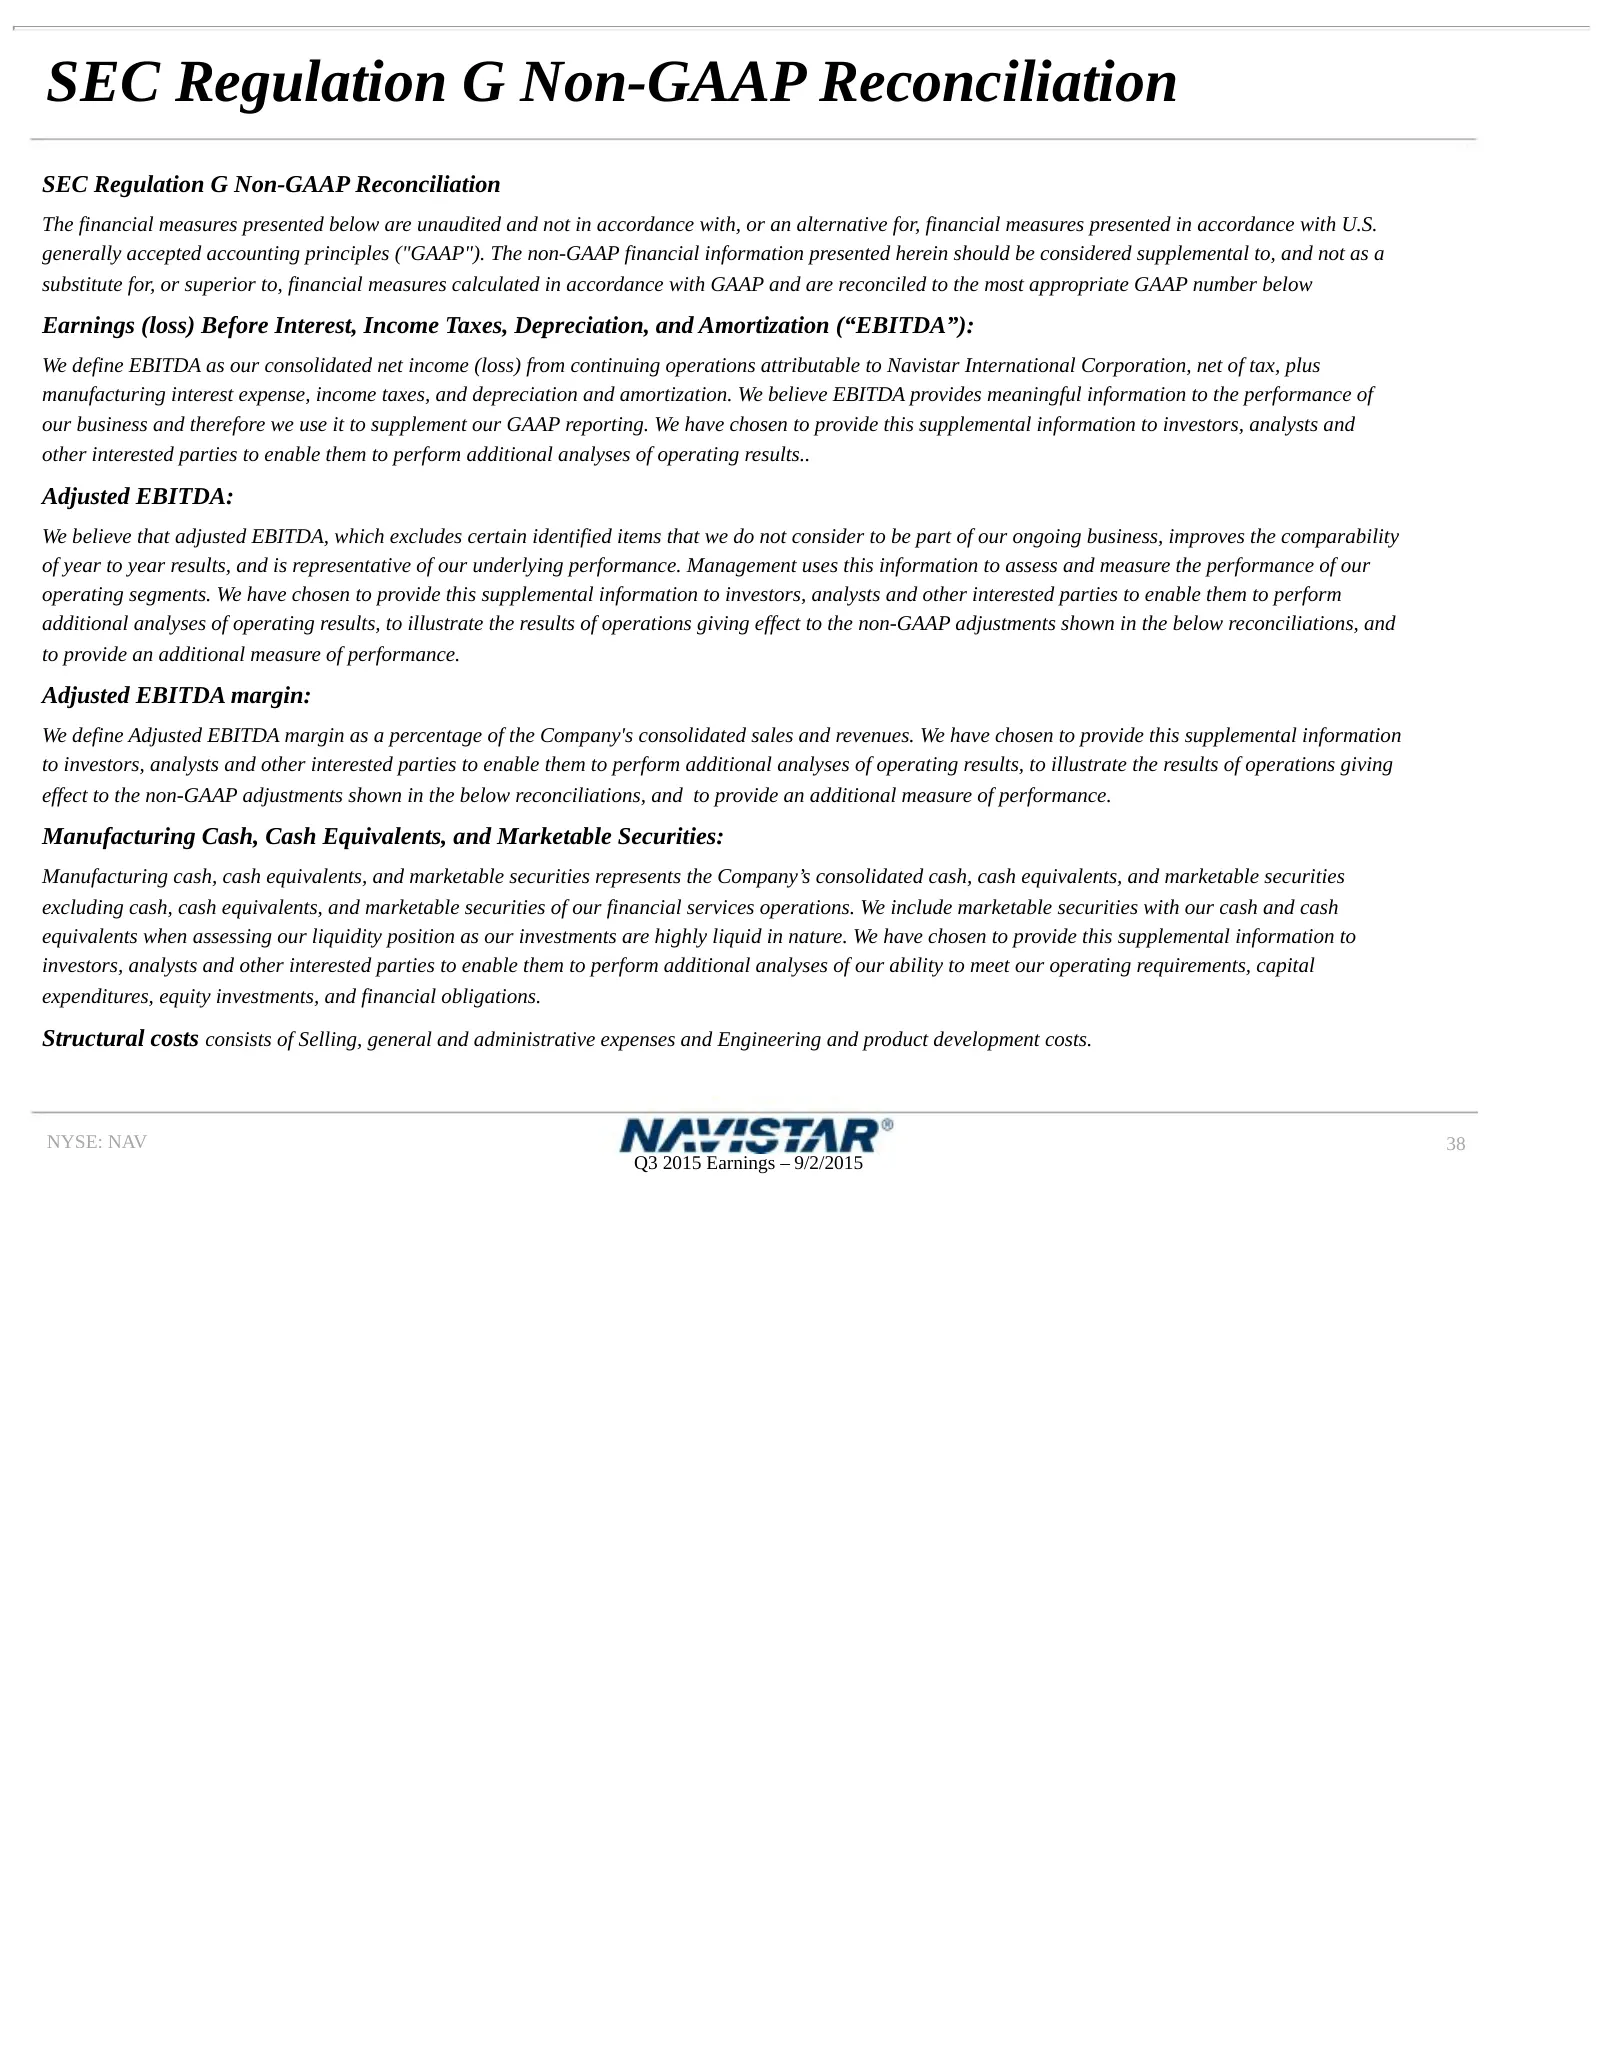
SEC Regulation G Non-GAAP Reconciliation SEC Regulation G Non-GAAP Reconciliation The financial measures presented below are unaudited and not in accordance with, or an alternative for, financial measures presented in accordance with U.S. generally accepted accounting principles ("GAAP"). The non-GA
Slide 39: SEC Regulation G Non-GAAP Reconciliations
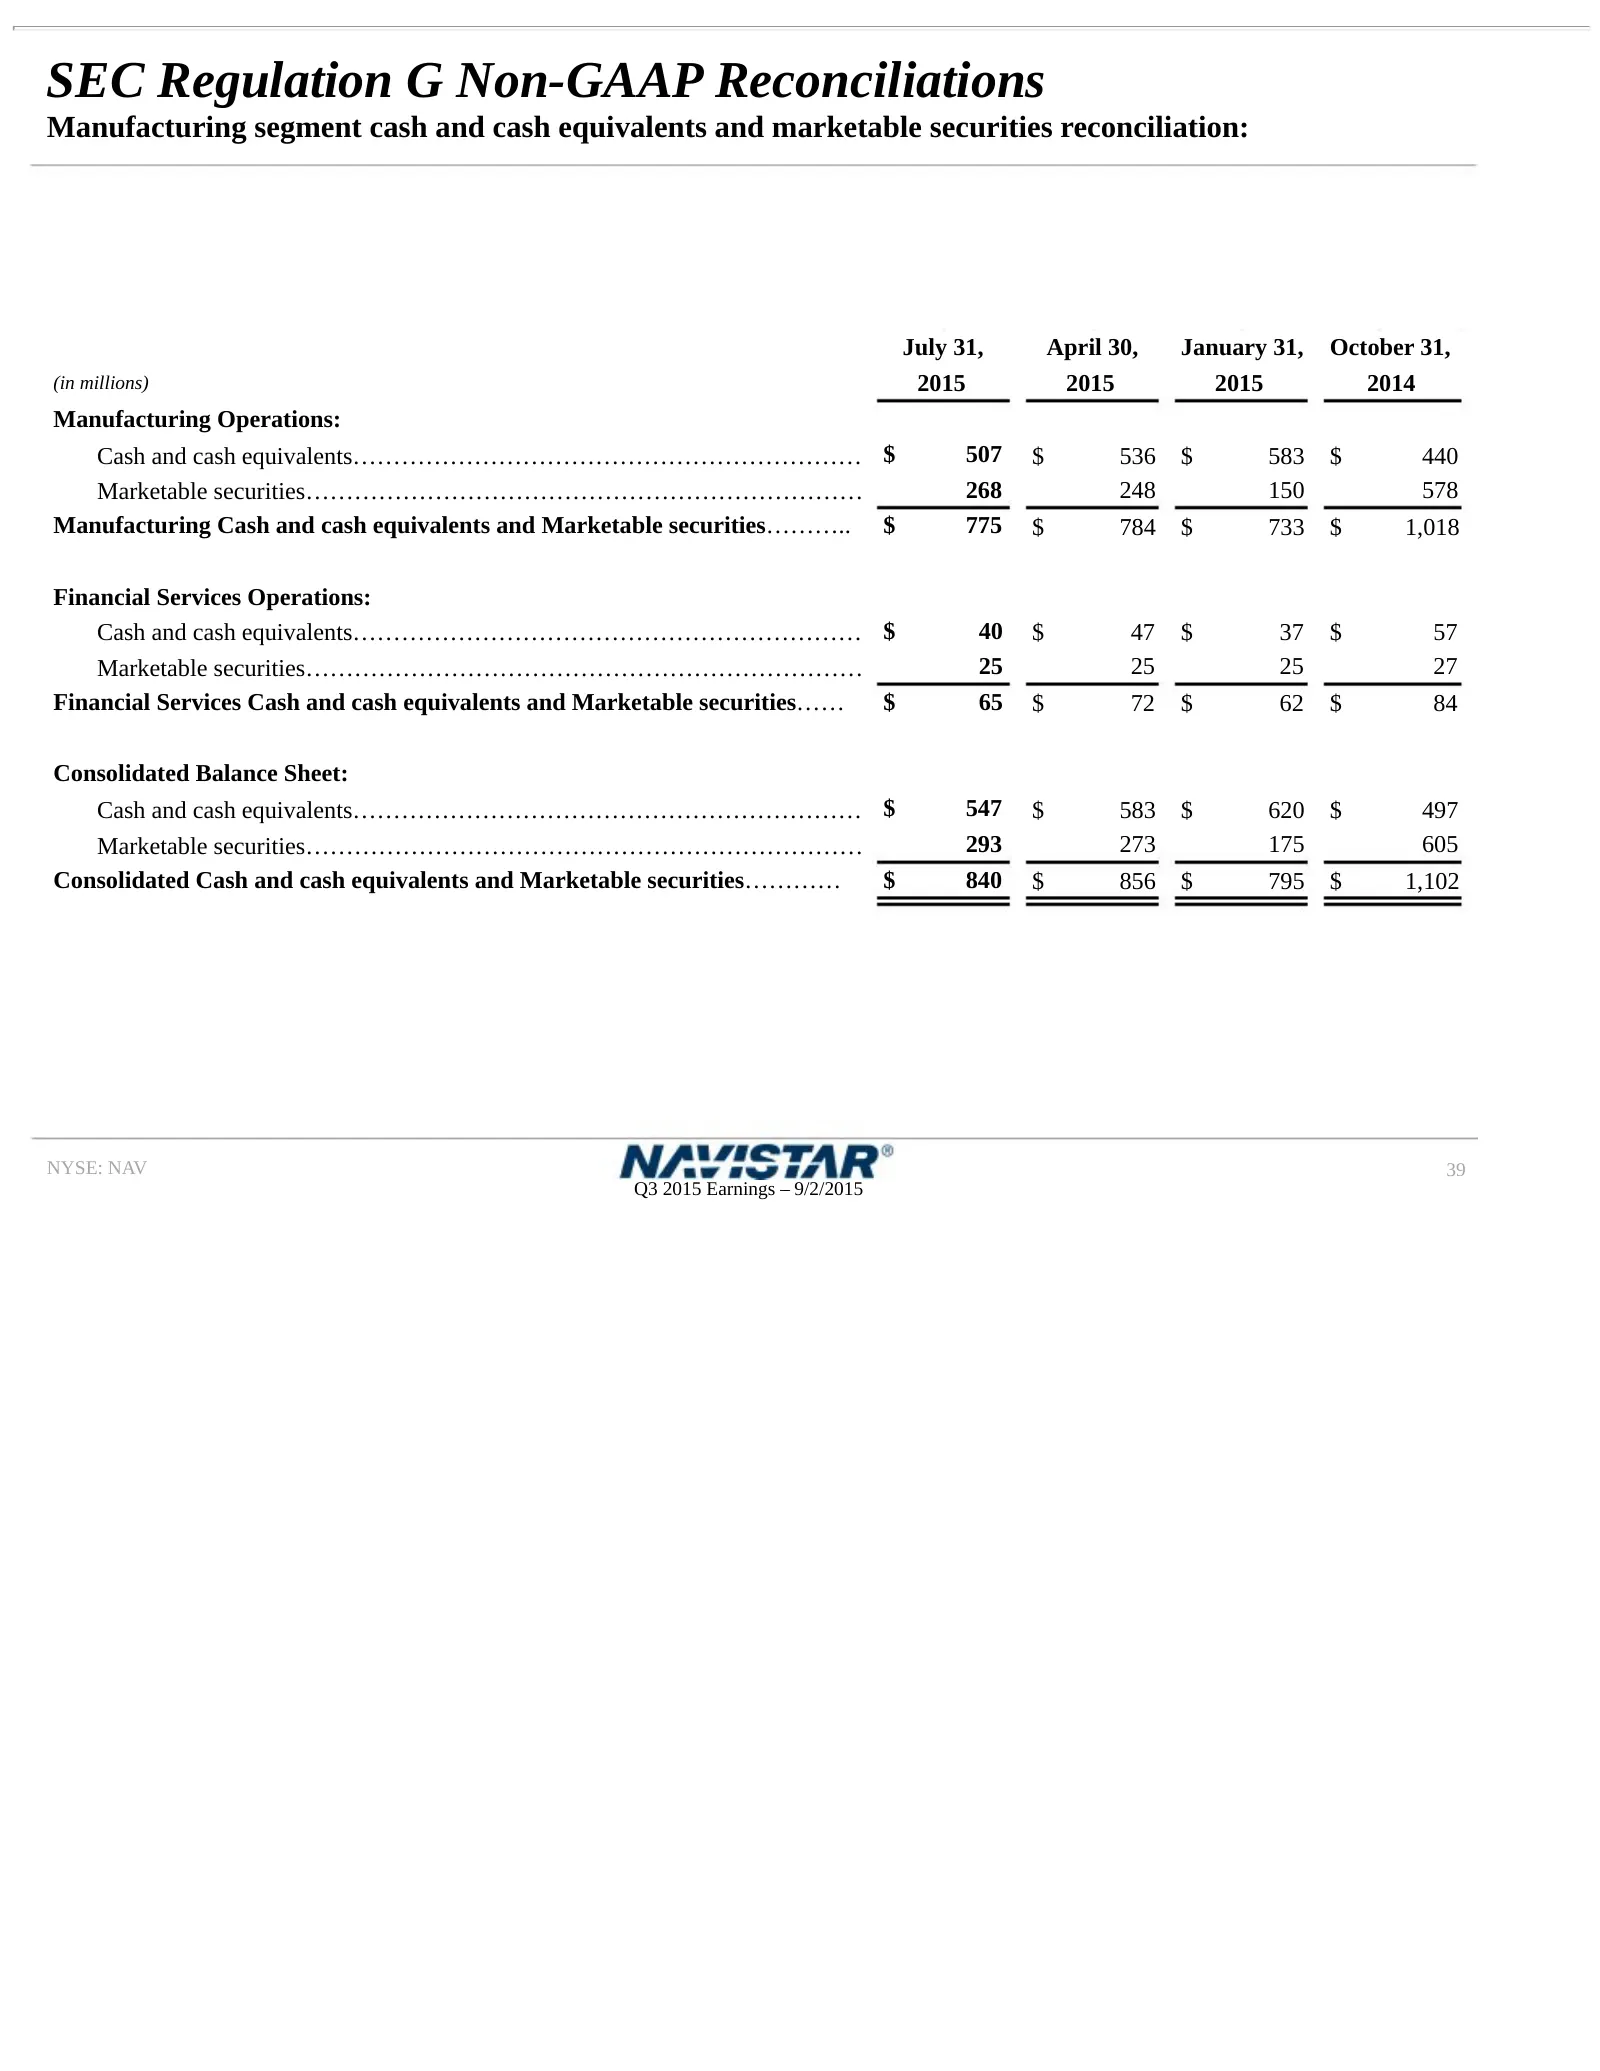
SEC Regulation G Non-GAAP Reconciliations Manufacturing segment cash and cash equivalents and marketable securities reconciliation: July 31, April 30, January 31, October 31, (in millions) 2015 2015 2015 2014 Manufacturing Operations: Cash and cash equivalents……………………………………………………… $ 507 $ 536 $ 583
Slide 40: SEC Regulation G Non-GAAP Reconciliations
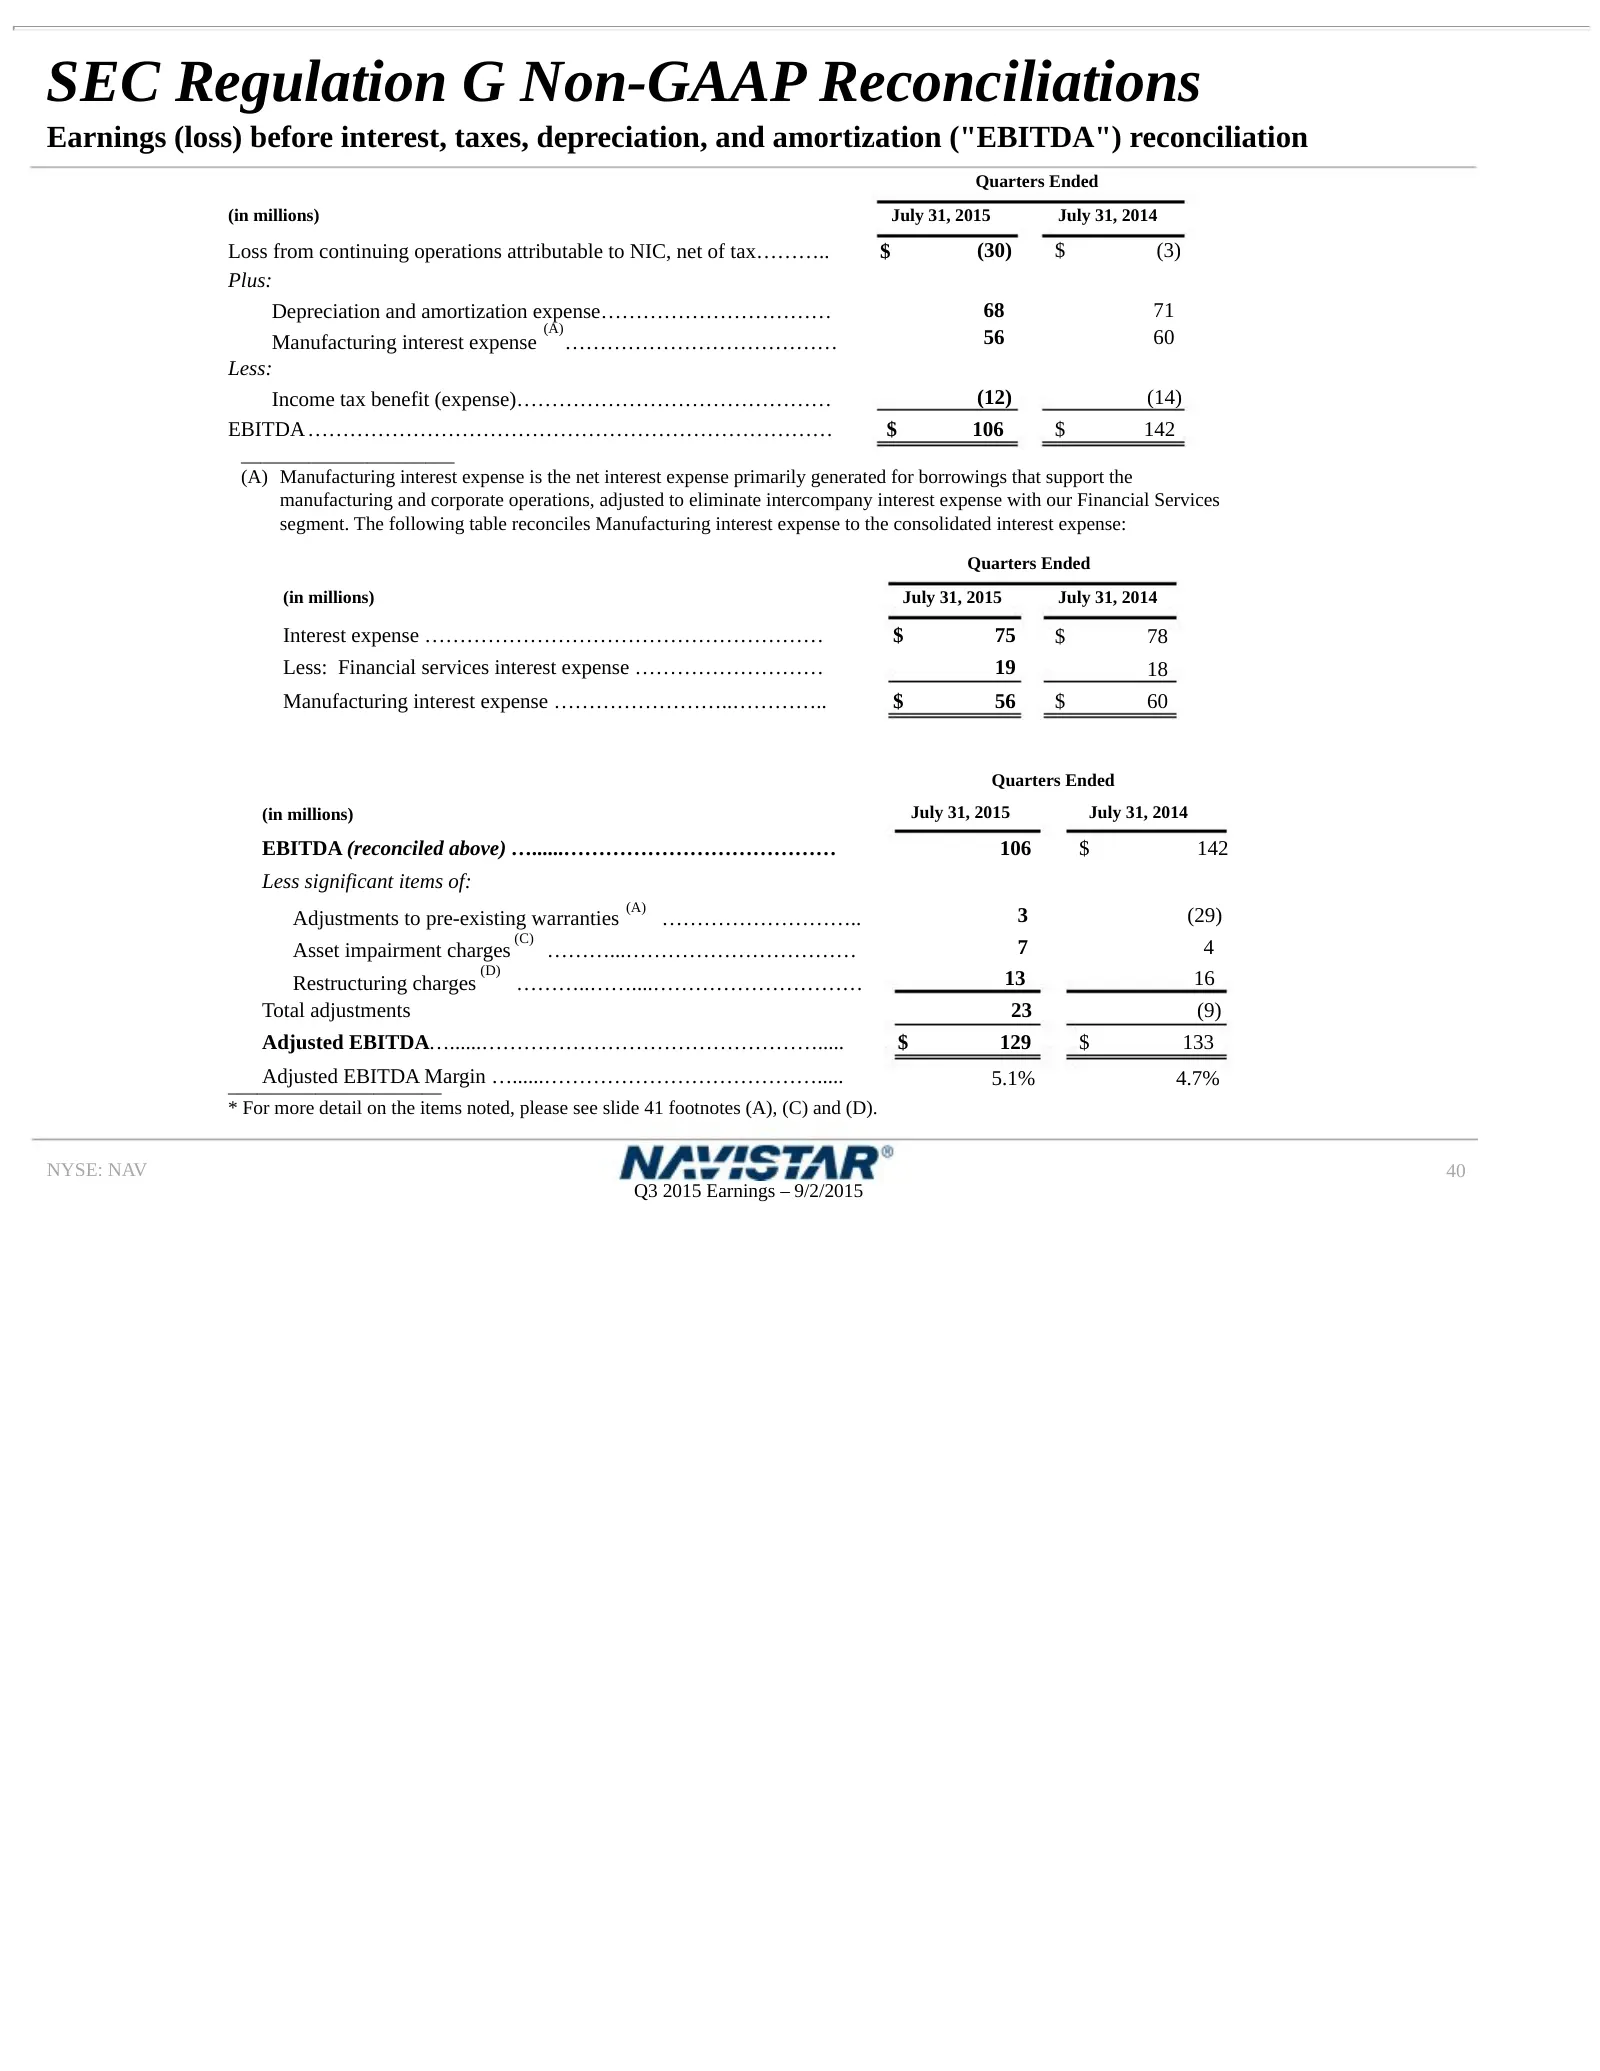
SEC Regulation G Non-GAAP Reconciliations Earnings (loss) before interest, taxes, depreciation, and amortization ("EBITDA") reconciliation Quarters Ended (in millions) July 31, 2015 July 31, 2014 Loss from continuing operations attributable to NIC, net of tax……….. $ (30) $ (3) Plus: Depreciation and
Slide 41: Significant Items Included Within Our Results
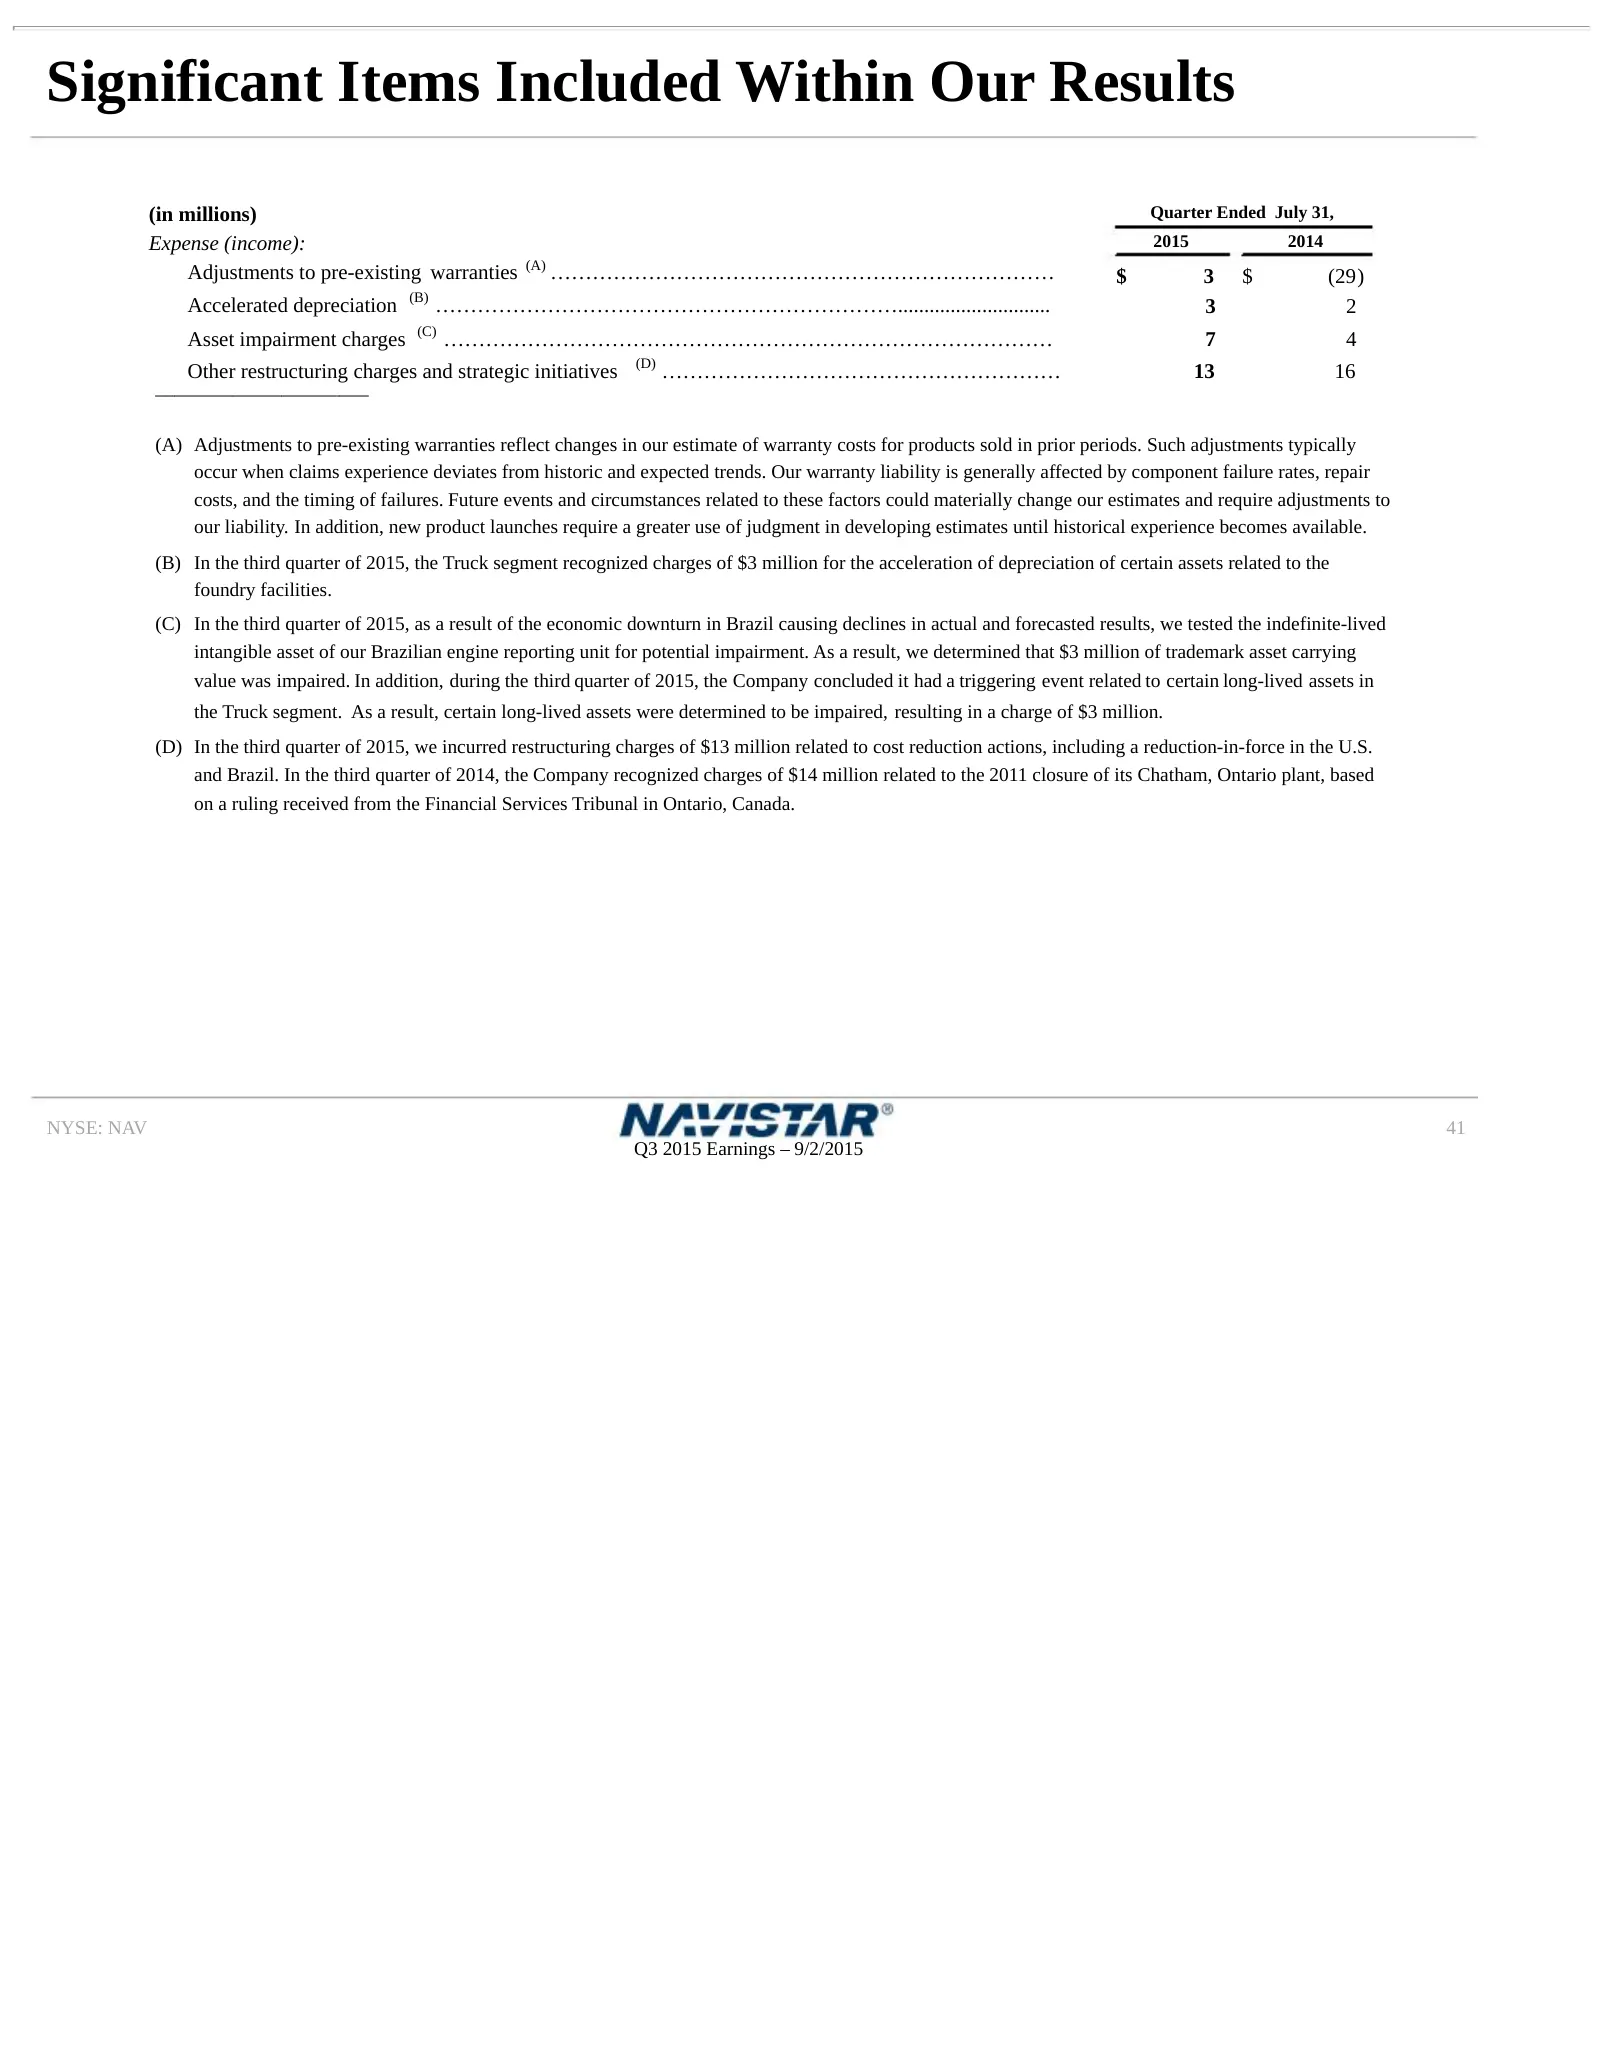
Significant Items Included Within Our Results (in millions) Quarter Ended July 31, Expense (income): 2015 2014 Adjustments to pre-existing warranties (A) ……………………………………………………………… $ 3 $ (29) Accelerated depreciation (B) …………………………………………………………............................. 3 2 Asset impairment charges
Source: SEC EDGAR · 8-K filed Sep 2, 2015
More decks from Navistar International Corporation
 Q2 2021 Earnings Presentation20 slides · Jun 8, 2021
 Q1 2021 Earnings Presentation20 slides · Mar 9, 2021
 Q4 2020 Earnings Presentation22 slides · Dec 17, 2020
 Q3 2020 Earnings Presentation21 slides · Sep 9, 2020
 Q2 2020 Earnings Presentation21 slides · Jun 4, 2020
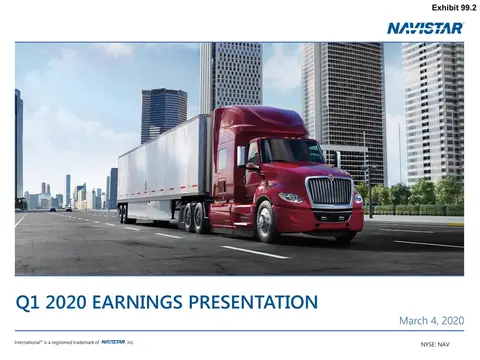 Q1 2020 Earnings Presentation21 slides · Mar 4, 2020