Florida East Coast Industries Inc
Florida East Coast Industries — Investor Presentation (November 2004)
117 slides from Florida East Coast Industries's investor presentation, Nov 5, 2004
Slide 1
Slide 2: Key Investment Points
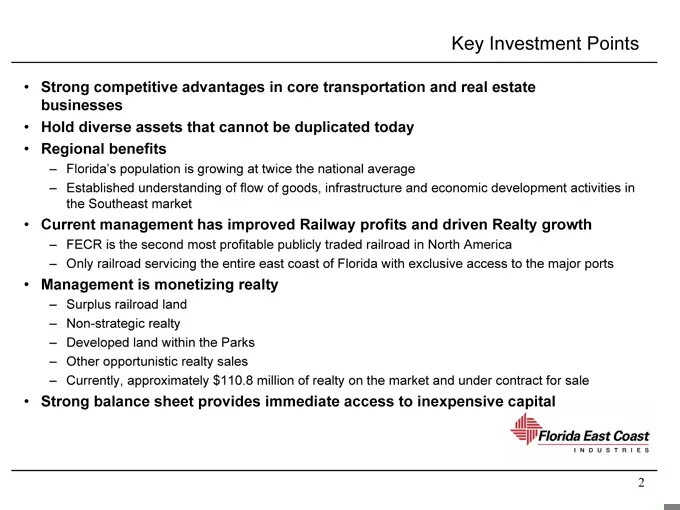
Key Investment Points Strong competitive advantages in core transportation and real estate businesses Hold diverse assets that cannot be duplicated today Regional benefits Florida’s population is growing at twice the national average Established understanding of flow of goods, infrastructure and eco
Slide 3: Florida's Growth Comparisons
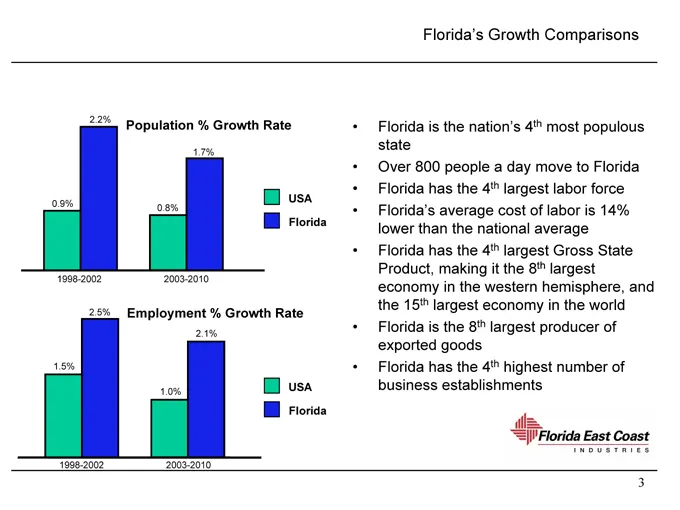
Population % Growth Rate 0.9% 2.2% 0.8% 1.7% USA Florida 1998-2002 2003-2010 Employment % Growth Rate 1.5% 2.5% 1.0% 2.1% USA Florida 1998-2002 2003-2010 Florida’s Growth Comparisons Florida is the nation’s 4th most populous state Over 800 people a day move to Florida Florida has the 4th largest lab
Slide 4: Third Quarter 2004 Highlights
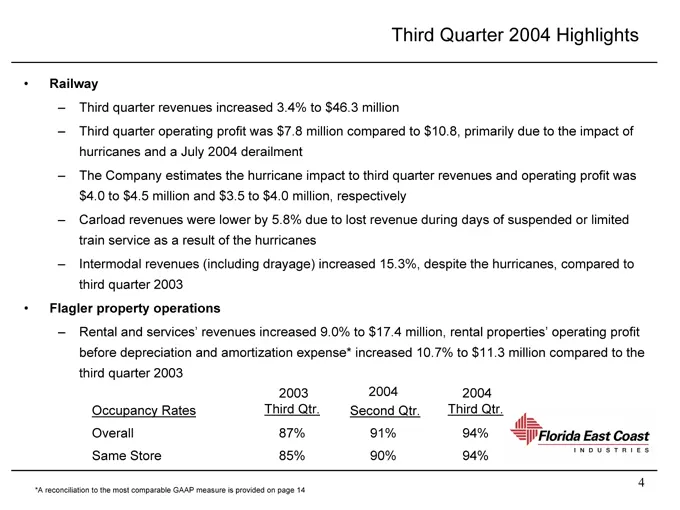
Third Quarter 2004 Highlights Railway Third quarter revenues increased 3.4% to $46.3 million Third quarter operating profit was $7.8 million compared to $10.8, primarily due to the impact of hurricanes and a July 2004 derailment The Company estimates the hurricane impact to third quarter revenues an
Slide 5: Third Quarter 2004 Highlights (continued)
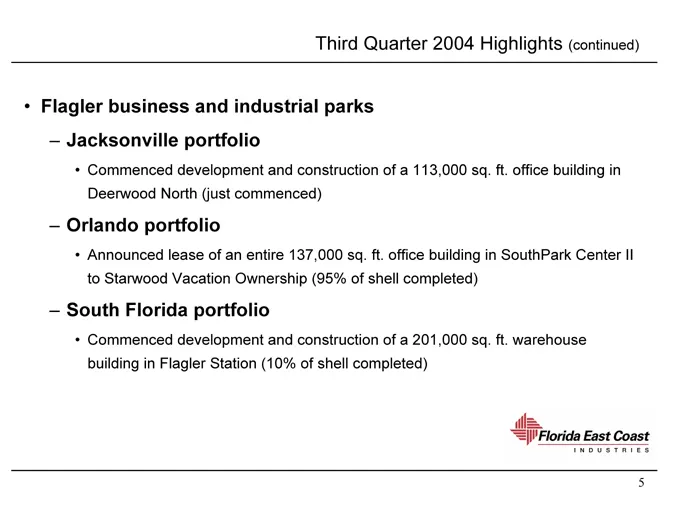
Third Quarter 2004 Highlights (continued) Flagler business and industrial parks Jacksonville portfolio Commenced development and construction of a 113,000 sq. ft. office building in Deerwood North (just commenced) Orlando portfolio Announced lease of an entire 137,000 sq. ft. office building in Sout
Slide 6: Third Quarter 2004 Highlights (continued)
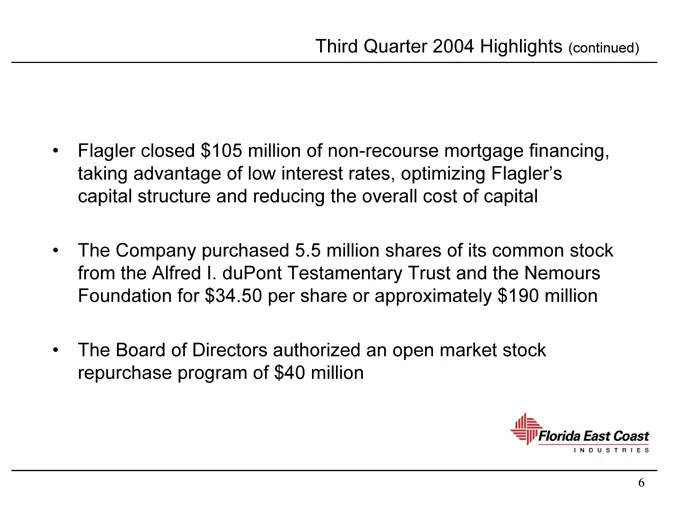
Third Quarter 2004 Highlights (continued) Flagler closed $105 million of non-recourse mortgage financing, taking advantage of low interest rates, optimizing Flagler’s capital structure and reducing the overall cost of capital The Company purchased 5.5 million shares of its common stock from the Alfr
Slide 7: Right-of-Way Income
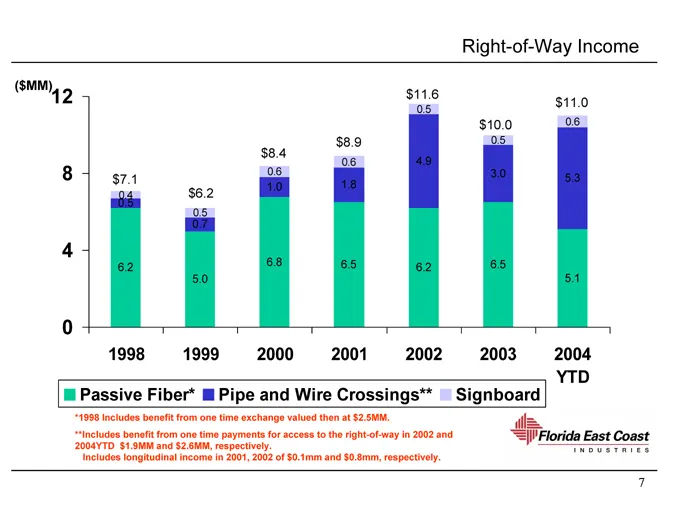
Right-of-Way Income ($ MM) 12 8 4 0 $7.1 0.5 0.4 6.2 $6.2 0.5 0.7 5.0 $8.4 0.6 1.0 6.8 $8.9 0.6 1.8 6.5 $11.6 0.5 4.9 6.2 $10.0 0.5 3.0 6.5 $11.0 0.6 5.3 5.1 1998 1999 2000 2001 2002 2003 2004 YTD Passive Fiber* Pipe and Wire Crossings** Signboard *1998 Includes benefit from one time exchange valued
Slide 8: FECR Legal Entity EBITDA
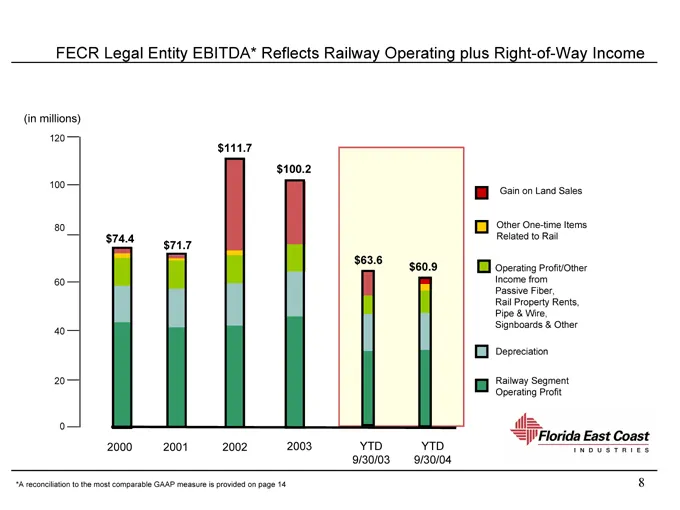
FECR Legal Entity EBITDA* Reflects Railway Operating plus Right-of-Way Income (in millions) 120 100 80 60 40 20 0 $111.7 $100.2 $74.4 $71.7 $63.6 $60.9 2000 2001 2002 2003 YTD YTD 9/30/03 9/30/04 Gain on Land Sales Other One-time Items Related to Rail Operating Profit/Other Income from Passive Fiber
Slide 9: Rail Corridor Opportunity
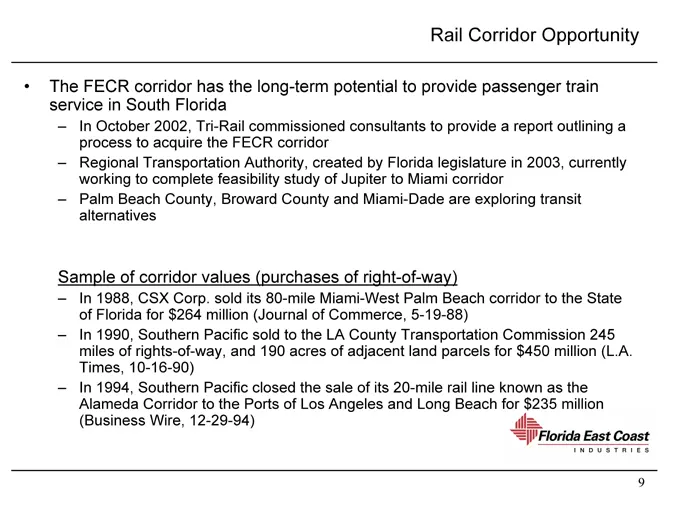
Rail Corridor Opportunity The FECR corridor has the long-term potential to provide passenger train service in South Florida In October 2002, Tri-Rail commissioned consultants to provide a report outlining a process to acquire the FECR corridor Regional Transportation Authority, created by Florida le
Slide 10: Realty Disposition Strategy
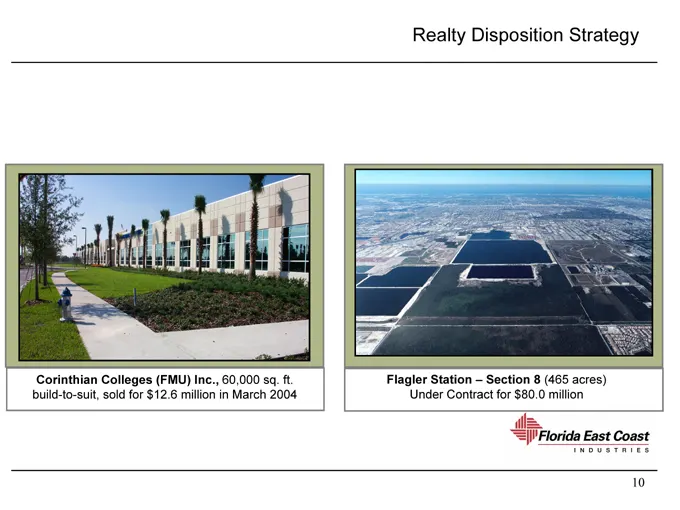
Realty Disposition Strategy Corinthian Colleges (FMU) Inc., 60,000 sq. ft. build-to-suit, sold for $12.6 million in March 2004 Flagler Station – Section 8 (465 acres) Under Contract for $80.0 million
Slide 11: Realty and Land Disposition Strategy
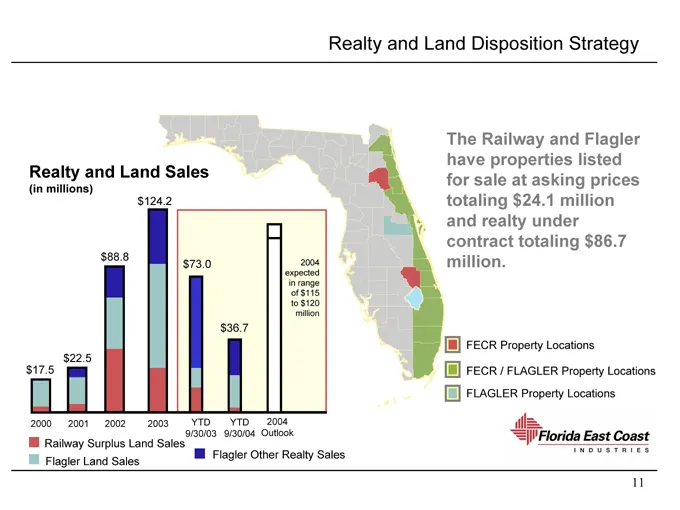
Realty and Land Disposition Strategy Flagler Other Realty Sales Realty and Land Sales (in millions) $124.2 $88.8 $73.0 $36.7 $22.5 $17.5 2004 expected in range of $115 to $120 million 2000 2001 2002 2003 YTD YTD 2004 9/30/03 9/30/04 Outlook Railway Surplus Land Sales Flagler Land Sales The Railway a
Slide 12: Florida East Coast Industries Has a Strong Balance Sheet
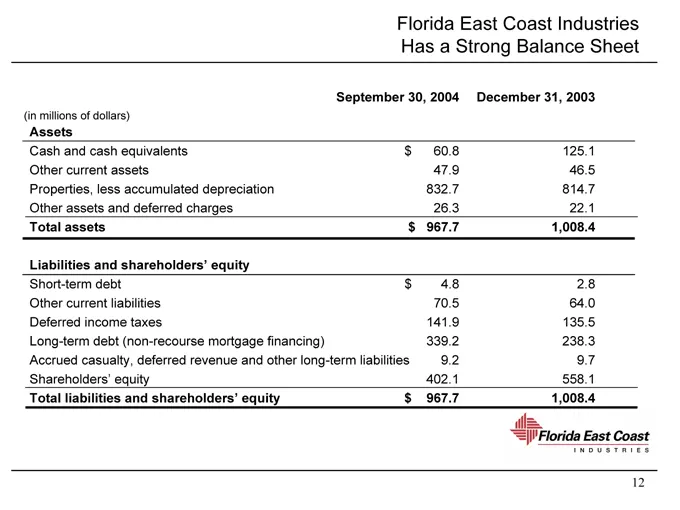
Florida East Coast Industries Has a Strong Balance Sheet September 30, 2004 December 31, 2003 Assets Cash and cash equivalents $ 60.8 125.1 Other current assets 47.9 46.5 Properties, less accumulated depreciation 832.7 814.7 Other assets and deferred charges 26.3 22.1 Total assets $ 967.7 1,008.4 Li
Slide 13: Florida East Coast Industries Unlocking the Value
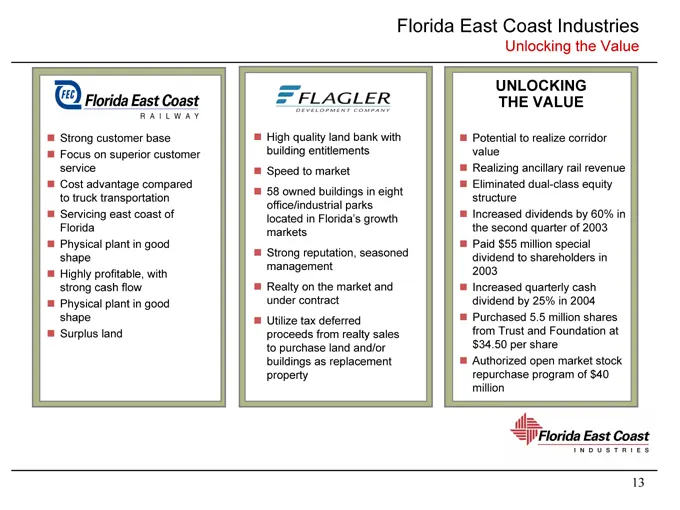
Florida East Coast Industries Unlocking the Value Potential to realize corridor value Realizing ancillary rail revenue Eliminated dual-class equity structure Increased dividends by 60% in the second quarter of 2003 Paid $55 million special dividend to shareholders in 2003 Increased quarterly cash di
Slide 14: Reconciliation of Non-GAAP to GAAP Measures
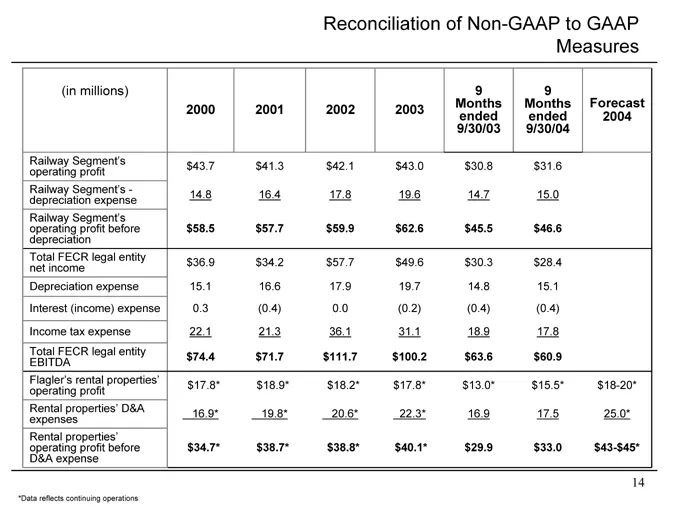
Reconciliation of Non-GAAP to GAAP Measures (in millions) 2000 2001 2002 2003 9 Months ended 9/30/03 9 Months ended 9/30/04 Forecast 2004 Railway Segment’s operating profit $43.7 $41.3 $42.1 $43.0 $30.8 $31.6 Railway Segment’s—depreciation expense 14.8 16.4 17.8 19.6 14.7 15.0 Railway Segment’s oper
Slide 15: Flagler
FLAGLER’
Slide 16: Flagler Value Proposition
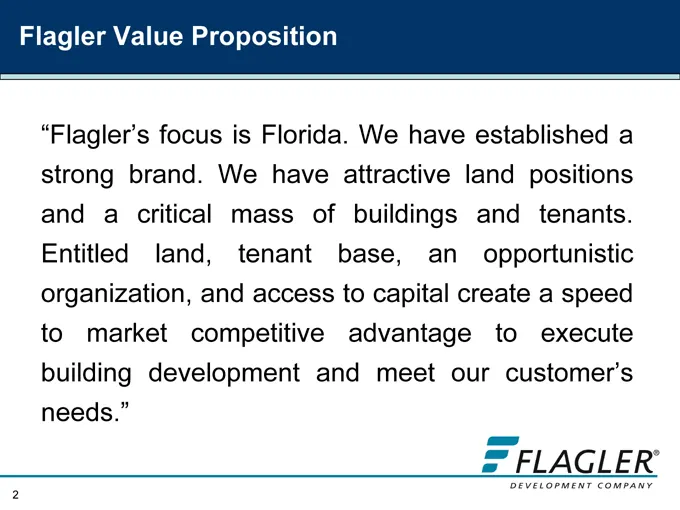
Flagler Value Proposition “Flagler’s focus is Florida. We have established a strong brand. We have attractive land positions and a critical mass of buildings and tenants. Entitled land, tenant base, an opportunistic organization, and access to capital create a speed to market competitive advantage t
Slide 17: Flagler Strategy
Flagler Strategy Core strength is entitled land positions in major Florida markets Build-to-suit projects, market driven spec development & land sales to quality users provide optimum land absorption velocity Vertical building development generates attractive returns and drives land absorption Build
Slide 18: Flagler Strategy
Flagler Strategy Quality land acquisitions will provide future growth Flagler will leverage brand & organization into joint venture, fee development & asset management opportunities
Slide 19: Flagler Organization
Flagler Organization Development – Flagler can execute a full range of development including: Major infrastructure Suburban office & call center Warehouse, distribution & flex Leasing – Flagler performs leasing in North and Central Florida through in-house marketing teams, and through Codina Realty
Slide 20: Land Entitlement
Land Entitlement Florida has a lengthy and expensive entitlement process; local, regional and state agencies participate in the approval process Flagler has obtained and must protect annually, development rights for future projects Development rights add significant value to land holdings and provid
Slide 21: Current Assets: Land, Buildings
Current Assets Land Buildings
Slide 22: Entitled Land
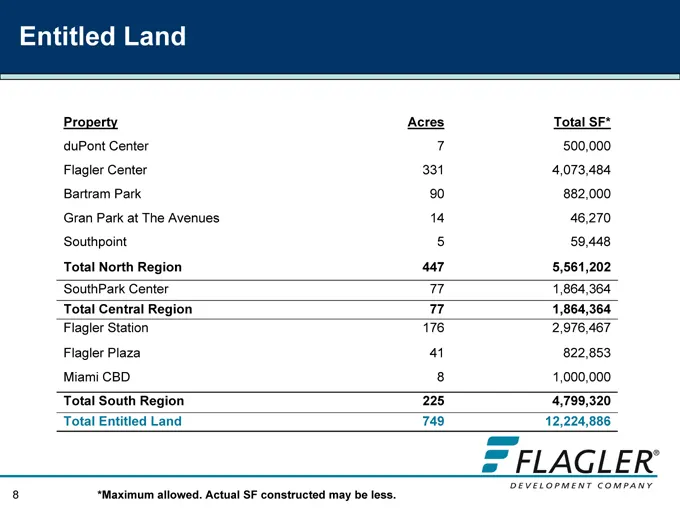
Entitled Land Property Acres Total SF* duPont Center 7 500,000 Flagler Center 331 4,073,484 Bartram Park 90 882,000 Gran Park at The Avenues 14 46,270 Southpoint 5 59,448 Total North Region 447 5,561,202 SouthPark Center 77 1,864,364 Total Central Region 77 1,864,364 Flagler Station 176 2,976,467 Fl
Slide 23: Unentitled Land
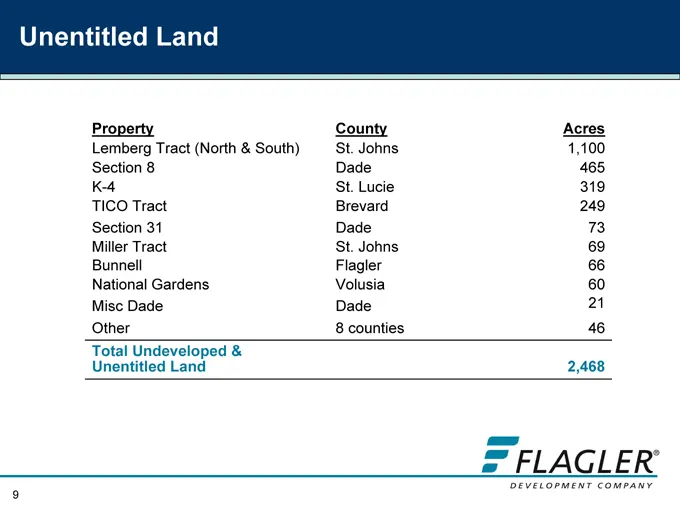
Unentitled Land Property County Acres Lemberg Tract (North & South) St. Johns 1,100 Section 8 Dade 465 K-4 St. Lucie 319 TICO Tract Brevard 249 Section 31 Dade 73 Miller Tract St. Johns 69 Bunnell Flagler 66 National Gardens Volusia 60 Misc Dade Dade 21 Other 8 counties 46 Total Undeveloped & Unenti
Slide 24: Flagler Has Exceptional Assets in Florida's Strongest Markets
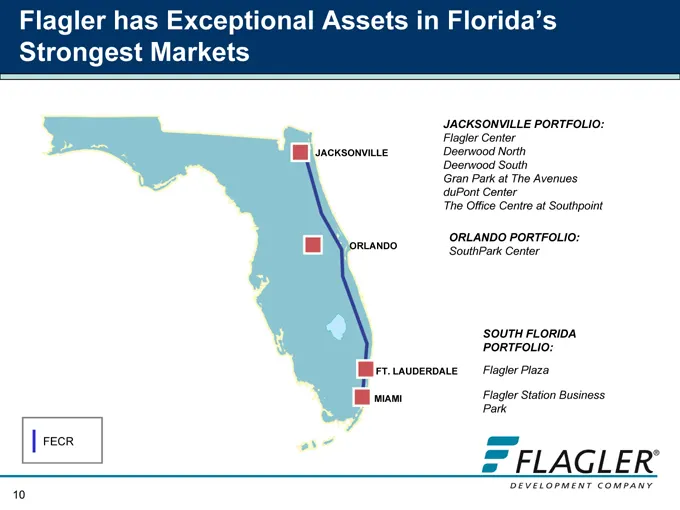
Flagler has Exceptional Assets in Florida’s Strongest Markets JACKSONVILLE ORLANDO FT. LAUDERDALE MIAMI FECR JACKSONVILLE PORTFOLIO: Flagler Center Deerwood North Deerwood South Gran Park at The Avenues duPont Center The Office Centre at Southpoint ORLANDO PORTFOLIO: SouthPark Center SOUTH FLORIDA P
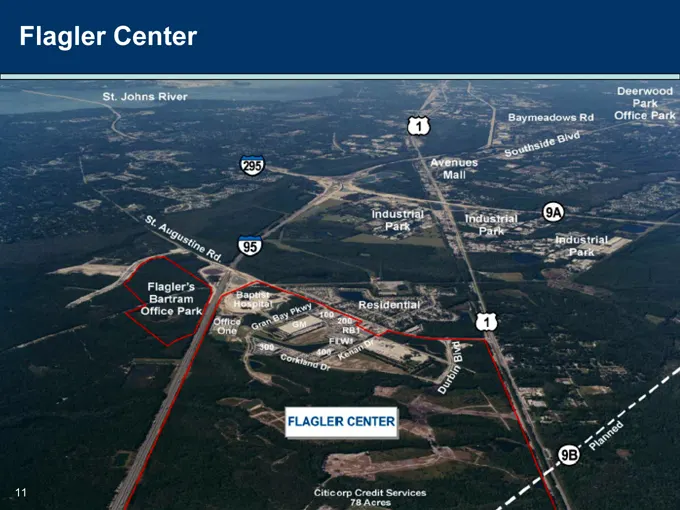
Slide 25: Flagler Center
Flagler Center Civcorp Credit Services TB Acres. a
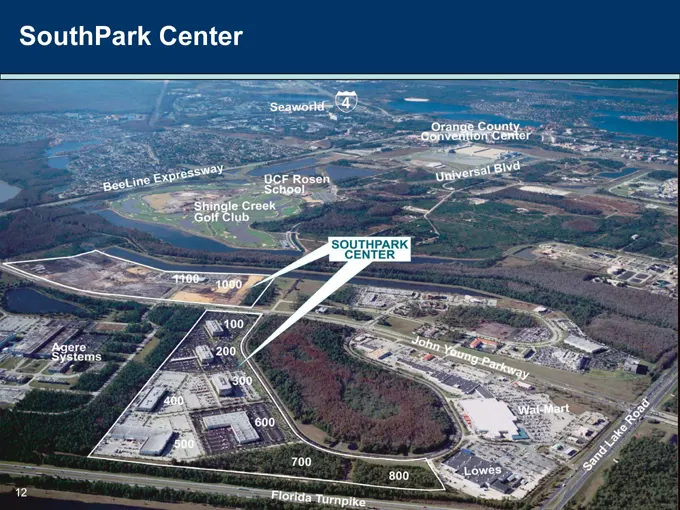
Slide 26: SouthPark Center
SouthPark Center
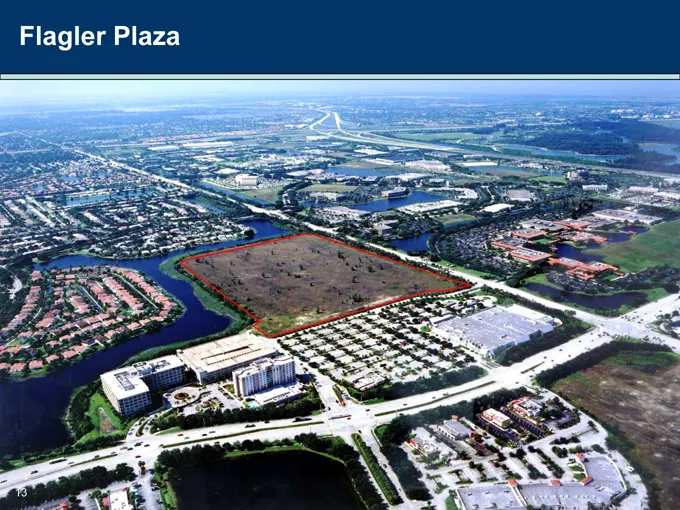
Slide 27: Flagler Plaza
Flagler Plaza
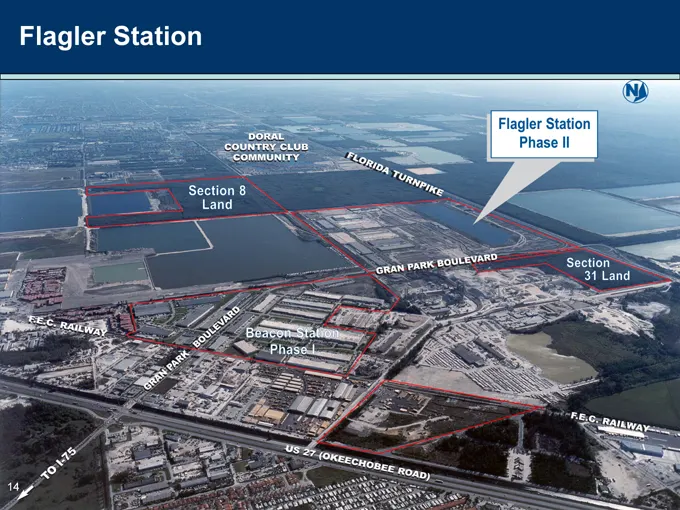
Slide 28: Flagler Station
Flagler Station Flagler Station | Phase Il
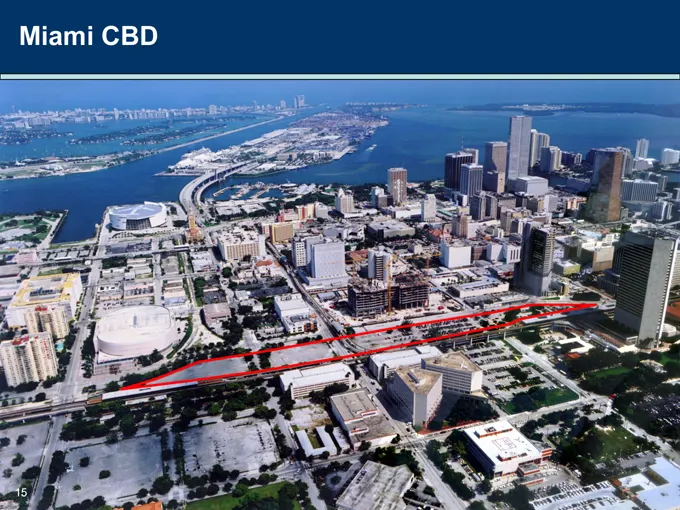
Slide 29: Miami CBD
Miami CBD
Slide 30: Building Summary
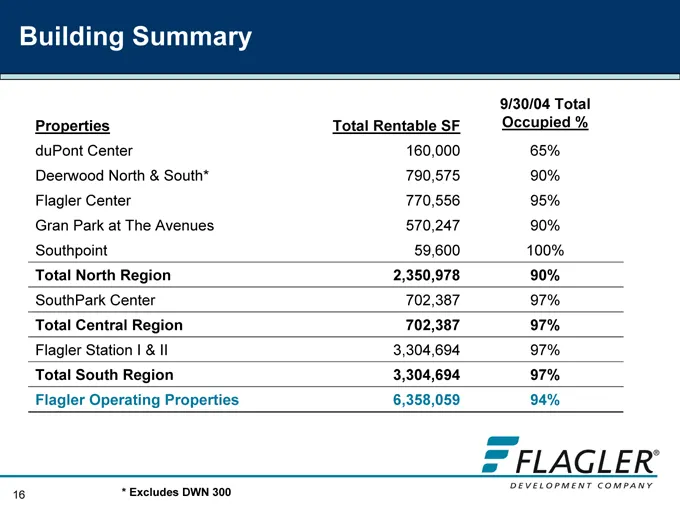
Building Summary 9/30/04 Total Properties Total Rentable SF Occupied % duPont Center 160,000 65% Deerwood North & South* 790,575 90% Flagler Center 770,556 95% Gran Park at The Avenues 570,247 90% Southpoint 59,600 100% Total North Region 2,350,978 90% SouthPark Center 702,387 97% Total Central Regi
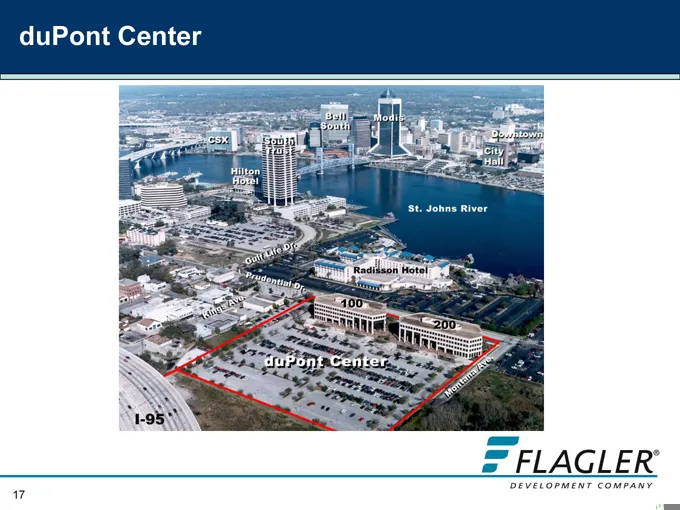
Slide 31: duPont Center
duPont Center
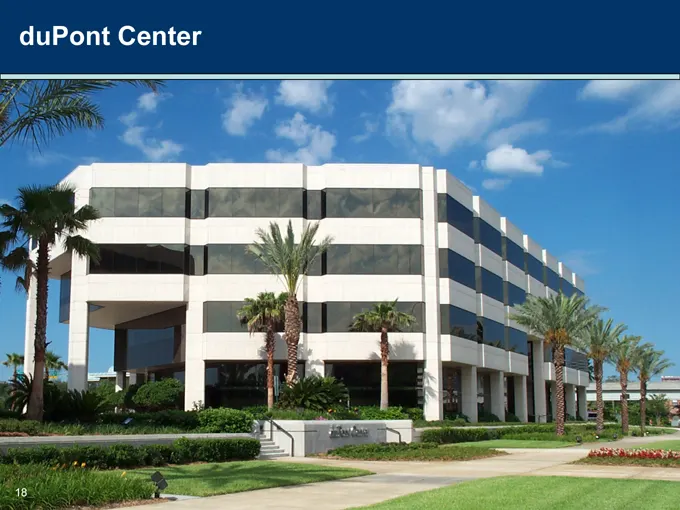
Slide 32: duPont Center
duPont Center
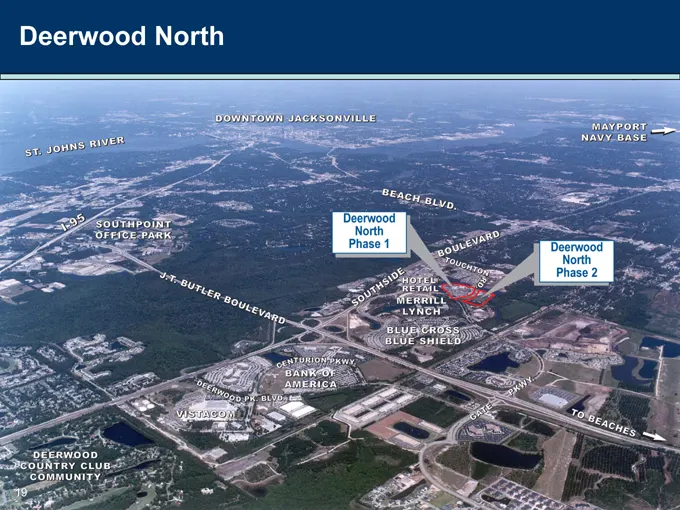
Slide 33: Deerwood North
Deerwood North DovnTOWN|
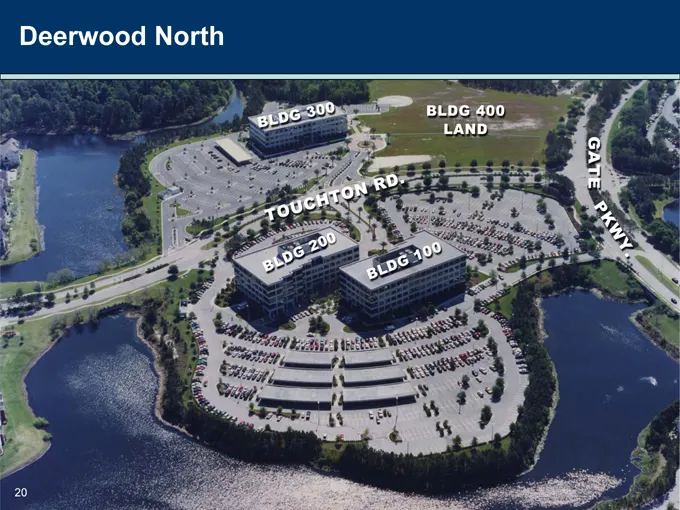
Slide 34: Deerwood North
Deerwood North BLDG 400
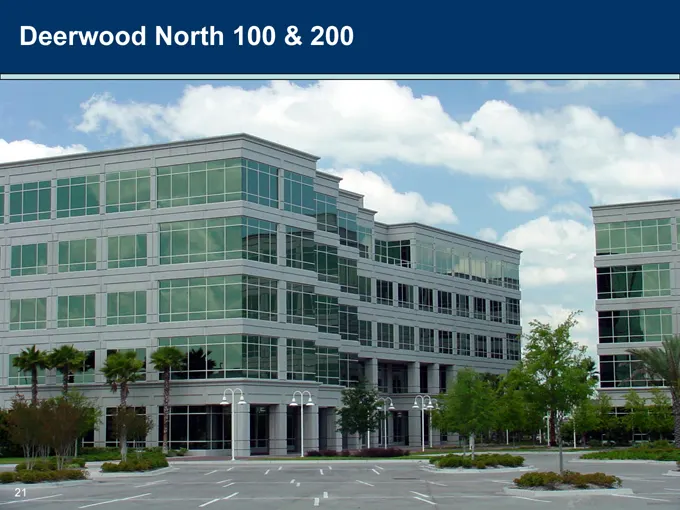
Slide 35: Deerwood North
Deerwood North 100 & 200
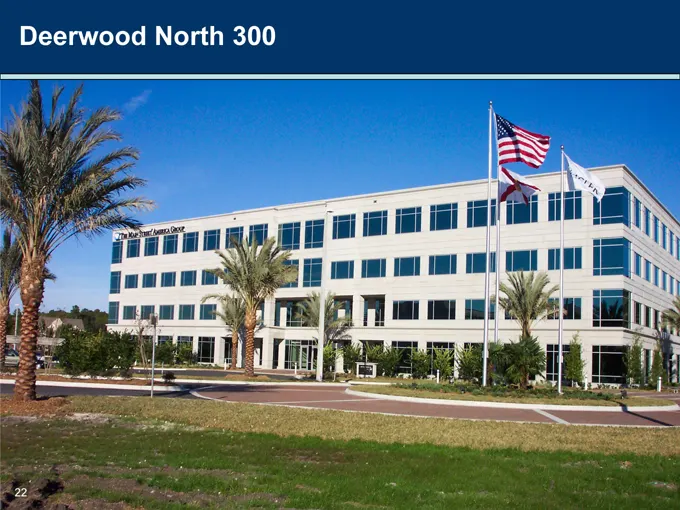
Slide 36: Deerwood North
Deerwood North 300 i TTLLLL im M My 2
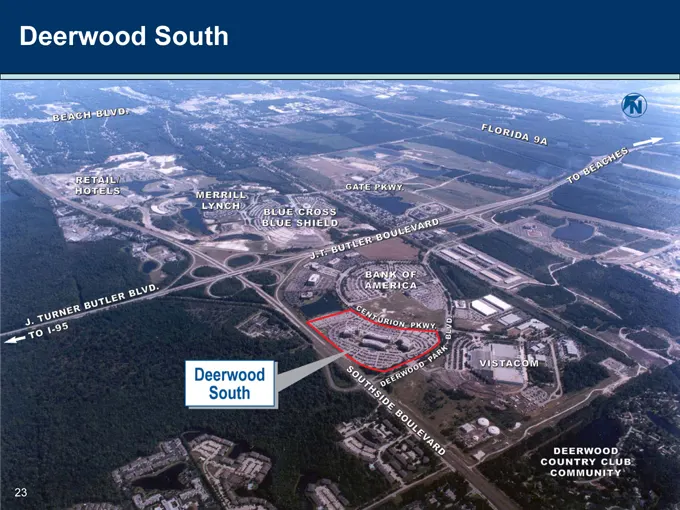
Slide 37: Deerwood South
Deerwood South ‘COMMUNITY
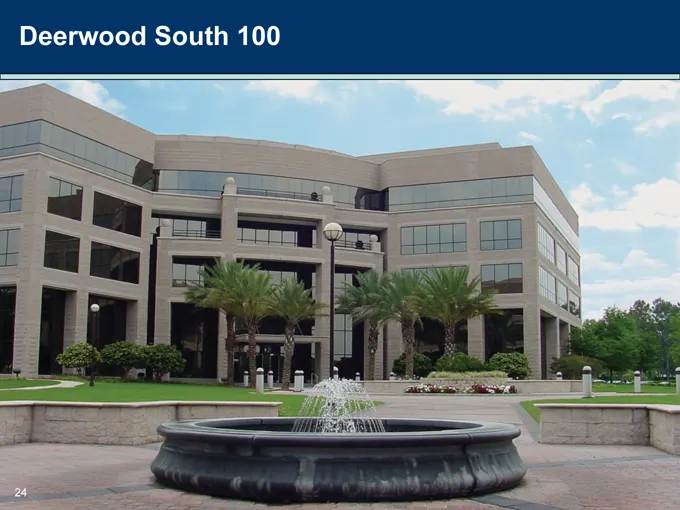
Slide 38: Deerwood South
Deerwood South 100
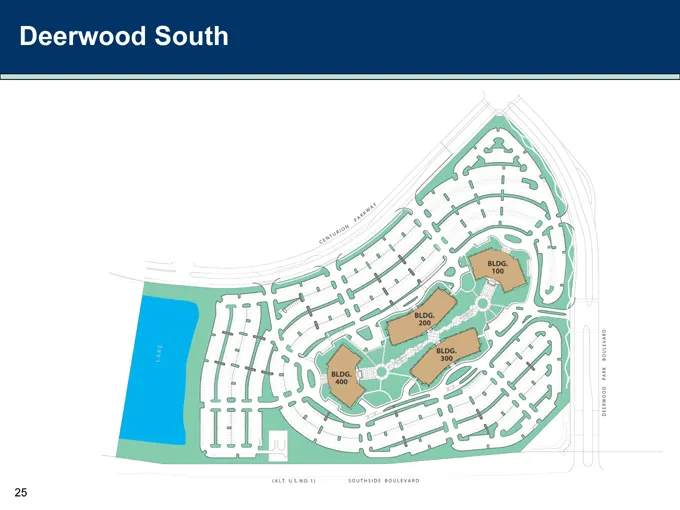
Slide 39: fo) on Ss ° ° é o o a
fo) on Ss ° ° é o o a 25
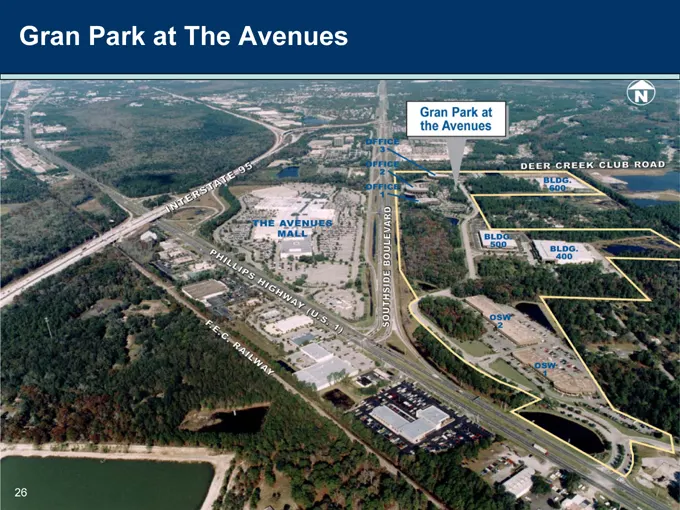
Slide 40: Gran Park at The Avenues
Gran Park at The Avenues
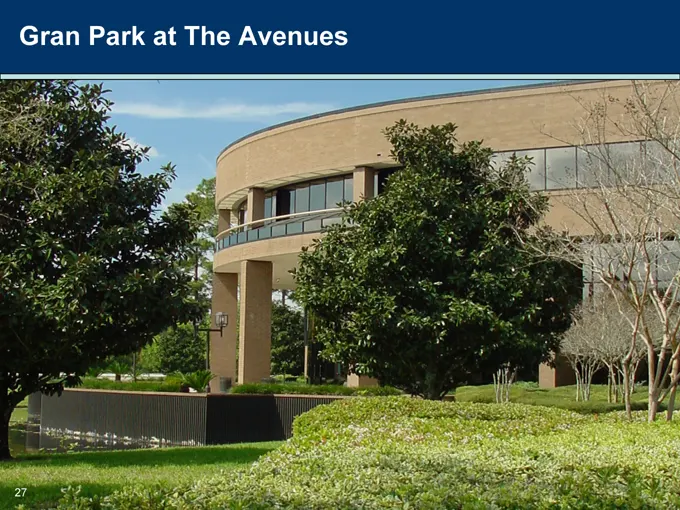
Slide 41: Gran Park at The Avenues
Gran Park at The Avenues
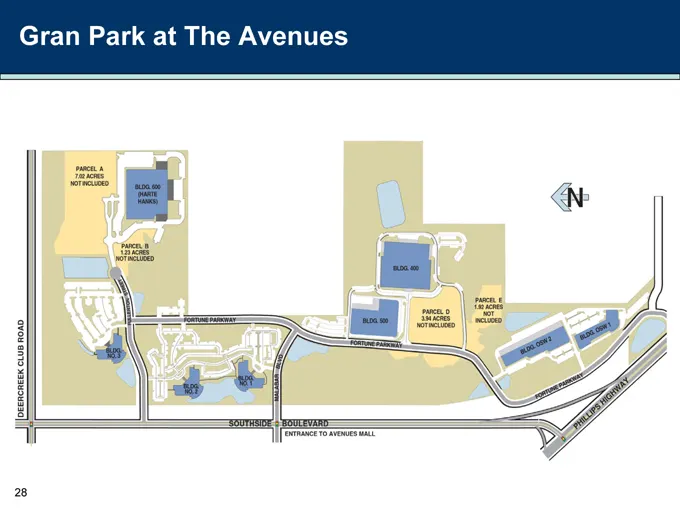
Slide 42: Gran Park at The Avenues
Gran Park at The Avenues
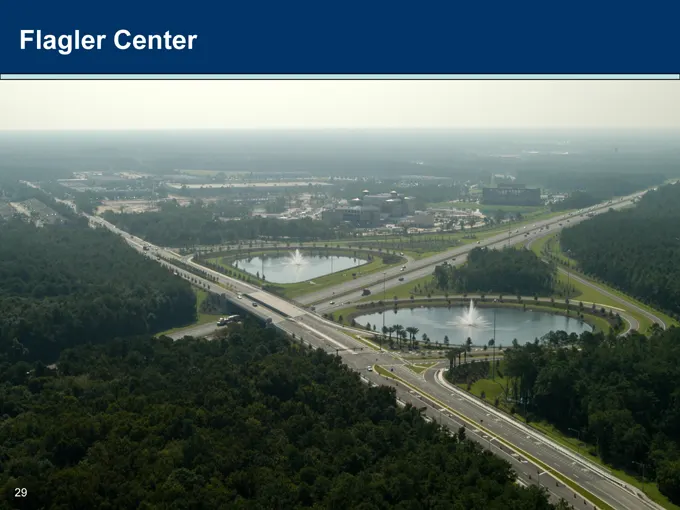
Slide 43: Flagler Center
Flagler Center
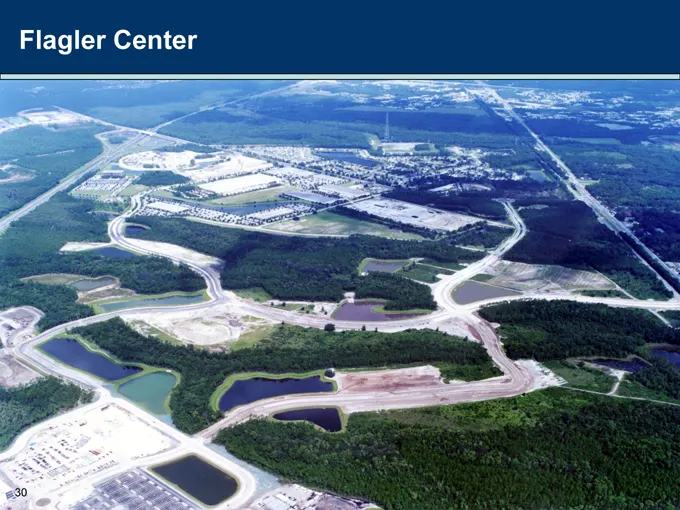
Slide 44: Flagler Center
Flagler Center
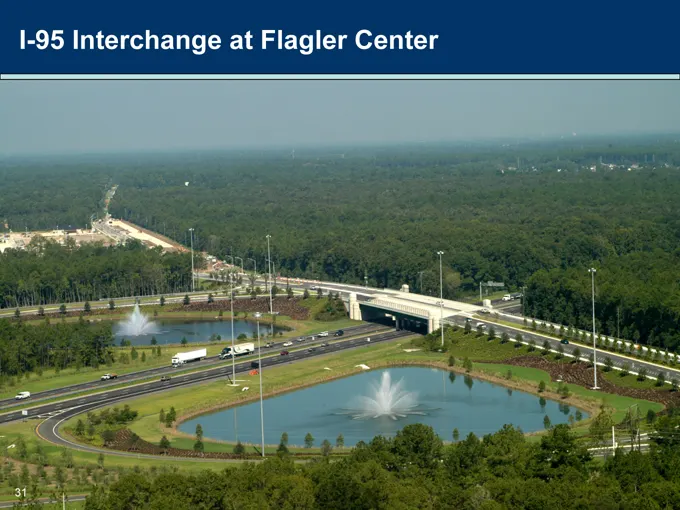
Slide 45: Interchange at Flagler Center
I-95 Interchange at Flagler Center
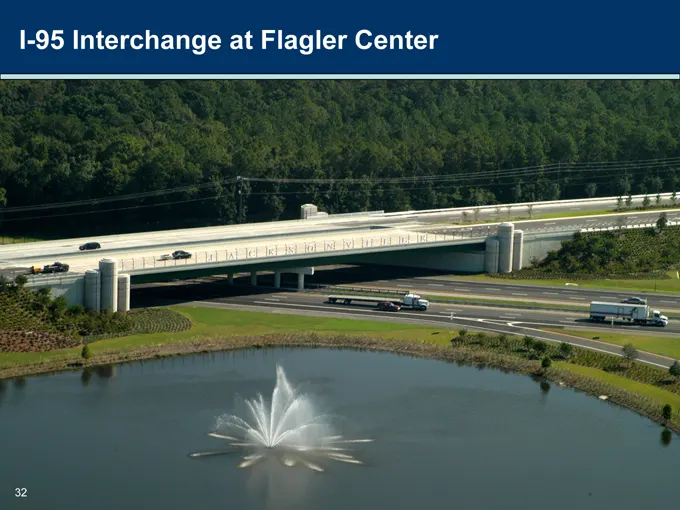
Slide 46: Interchange at Flagler Center
I-95 Interchange at Flagler Center
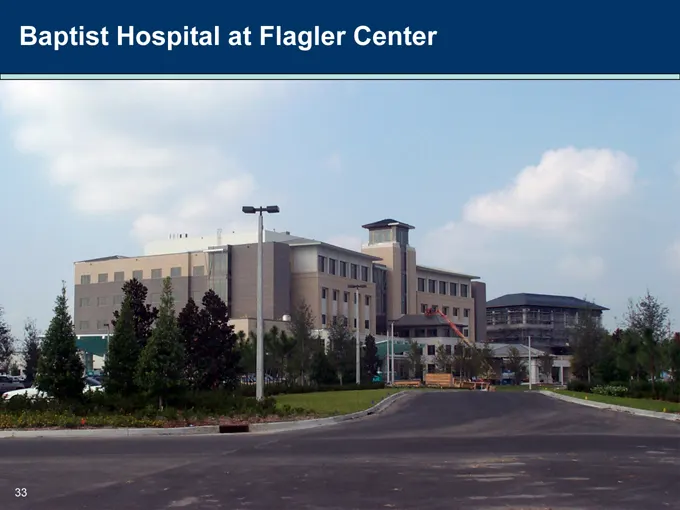
Slide 47: Baptist Hospital at Flagler Center
Baptist Hospital at Flagler Center
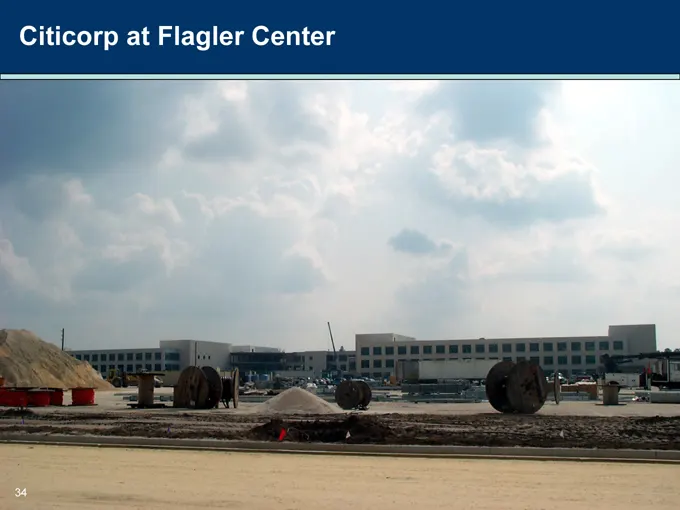
Slide 48: Citicorp at Flagler Center
Citicorp at Flagler Center
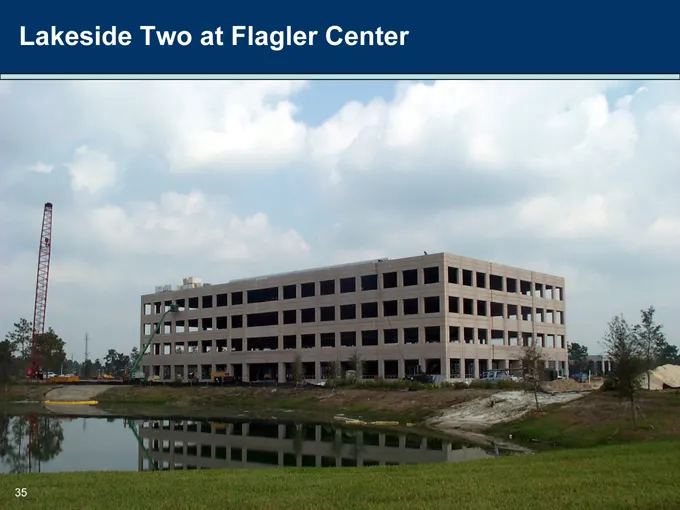
Slide 49: Lakeside Two at Flagler Center
Lakeside Two at Flagler Center
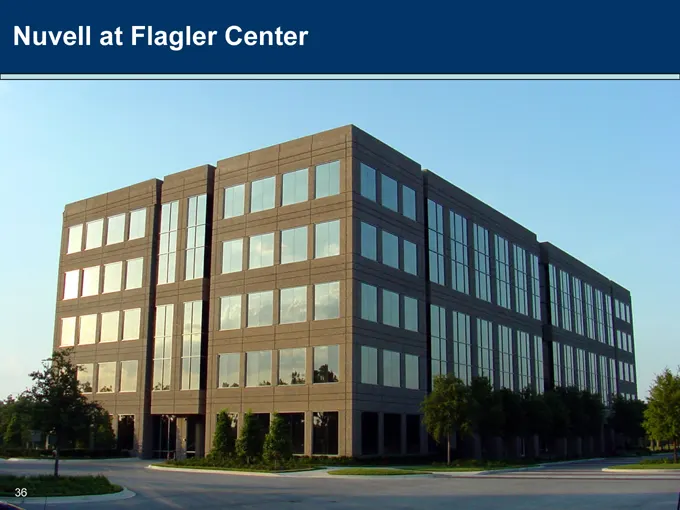
Slide 50: Nuvell at Flagler Center
Nuvell at Flagler Center
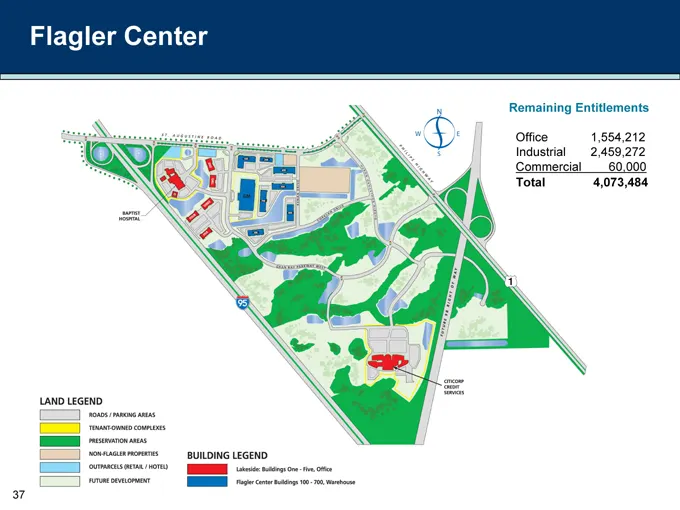
Slide 51: Flagler Center Remaining Entitlements
Flagler Center Remaining Entitlements Office 1,554,212 Industrial 2,459,272 Commercial 60,000 Total 4,073,484
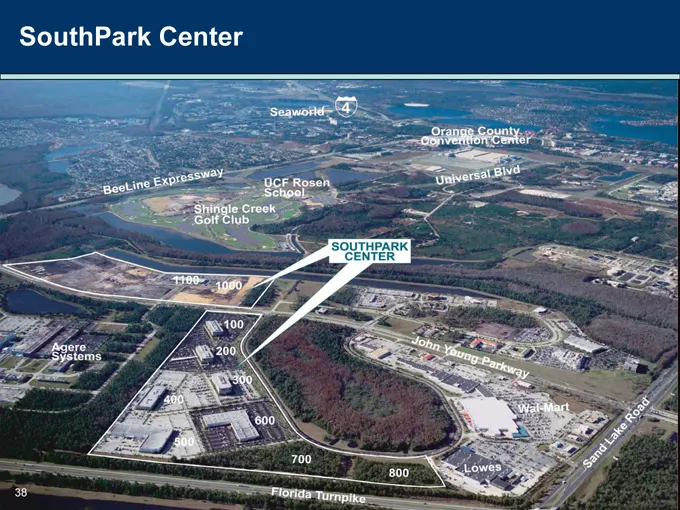
Slide 52: SouthPark Center
SouthPark Center
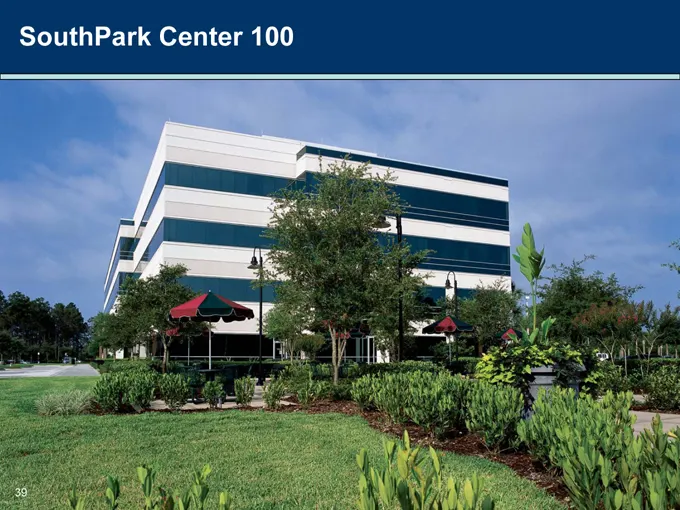
Slide 53: SouthPark Center
SouthPark Center 100 = b i’ 36
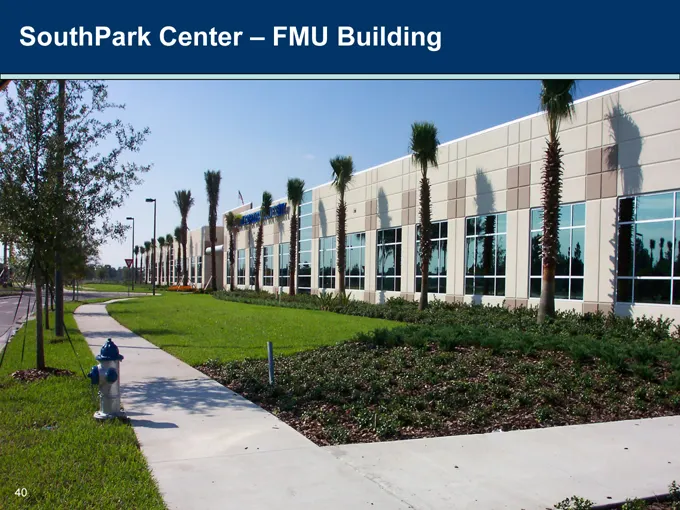
Slide 54: SouthPark Center – FMU Building
SouthPark Center – FMU Building
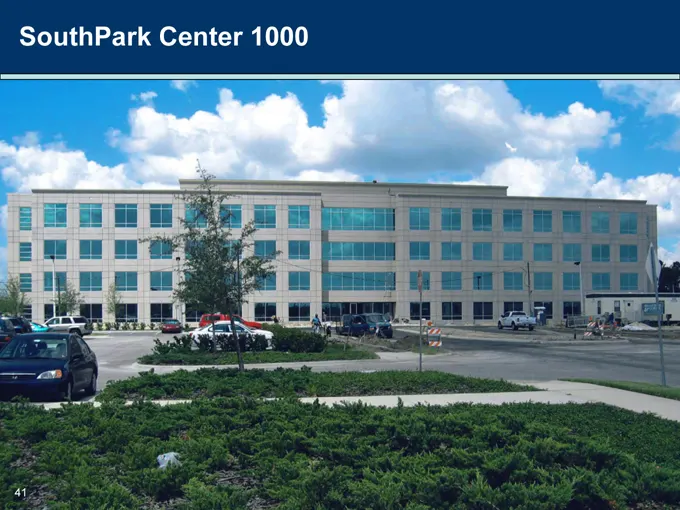
Slide 55: SouthPark Center 1000
SouthPark Center 1000 Hes.
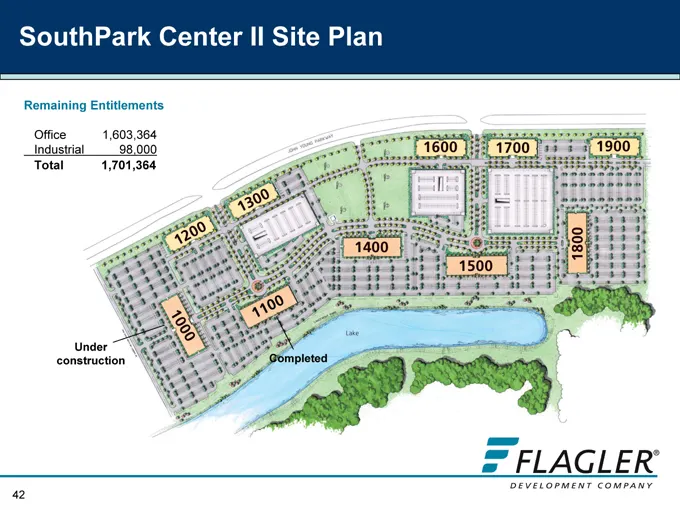
Slide 56: SouthPark Center II Site Plan
SouthPark Center II Site Plan Remaining Entitlements Office 1,603,364 Industrial 98,000 Total 1,701,364 Under construction Completed
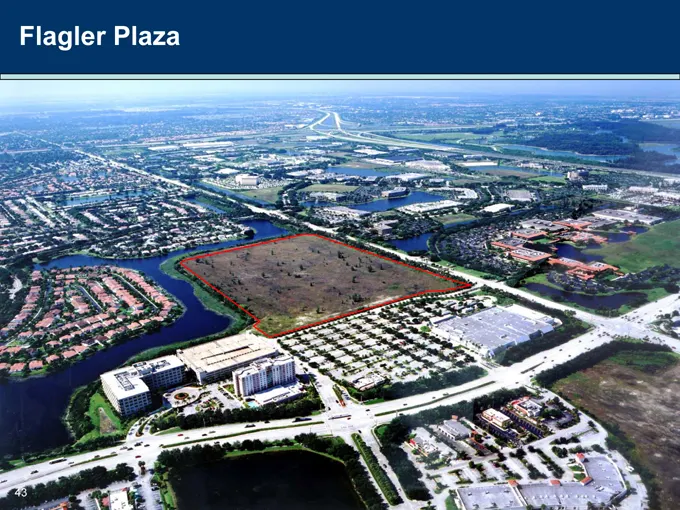
Slide 57: Flagler Plaza
Flagler Plaza
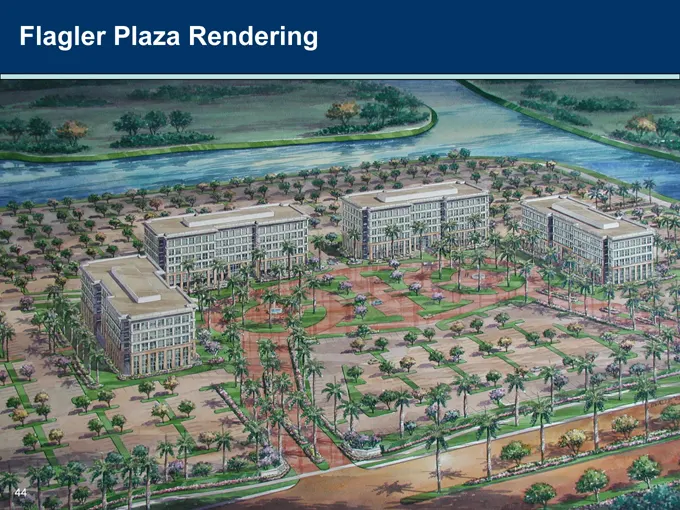
Slide 58: Flagler Plaza Rendering
Flagler Plaza Rendering
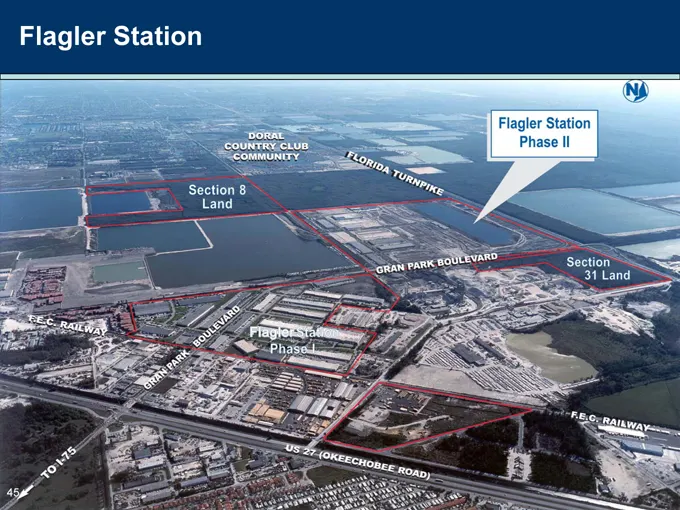
Slide 59: Flagler Station
Flagler Station Flagler Station Phase Il - Se 31 Land
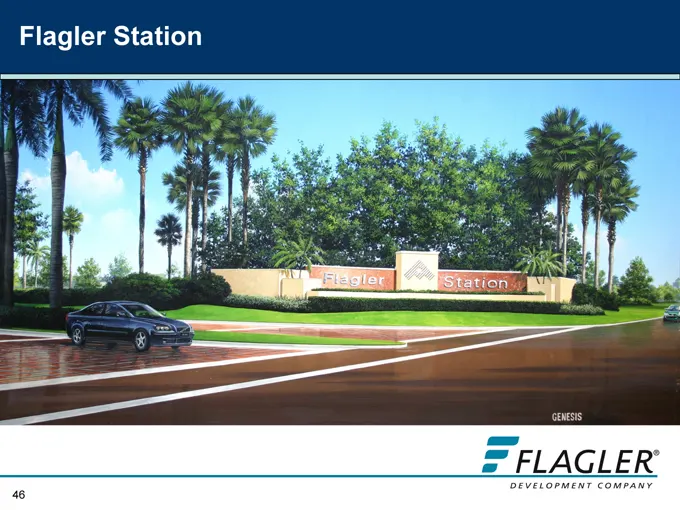
Slide 60: Flagler Station
Flagler Station S18 = FLAGLER’
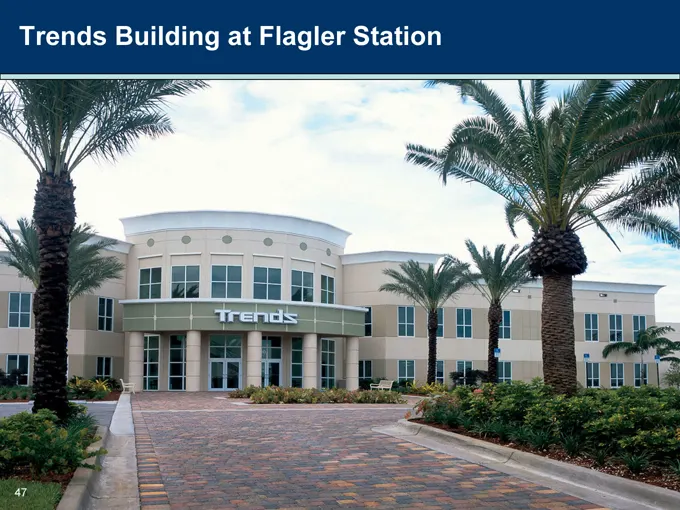
Slide 61: Building at Flagler Station
Trends Building at Flagler Station
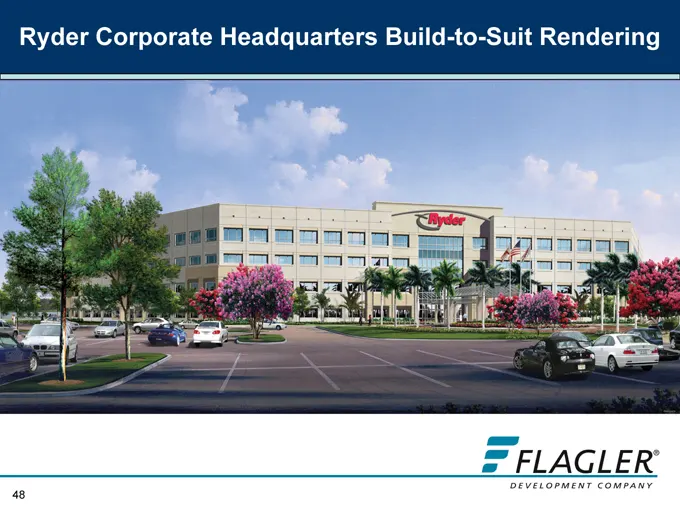
Slide 62: Ryder Corporate Headquarters Build-to-Suit Rendering
Ryder Corporate Headquarters Build-to-Suit Rendering
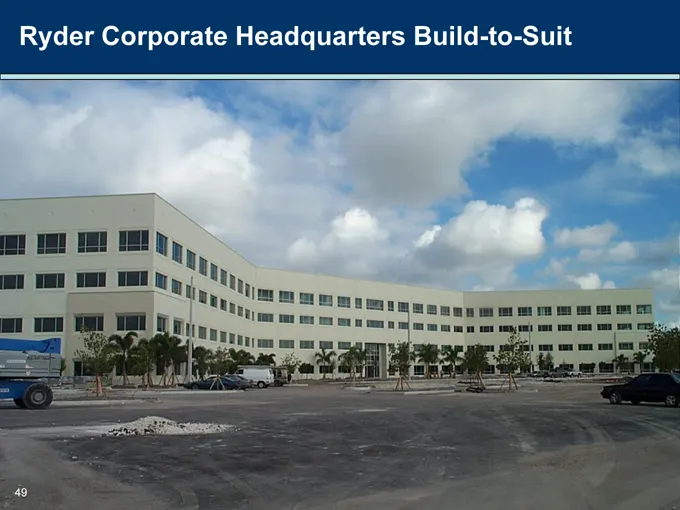
Slide 63: Ryder Corporate Headquarters Build-to-Suit
Ryder Corporate Headquarters Build-to-Suit
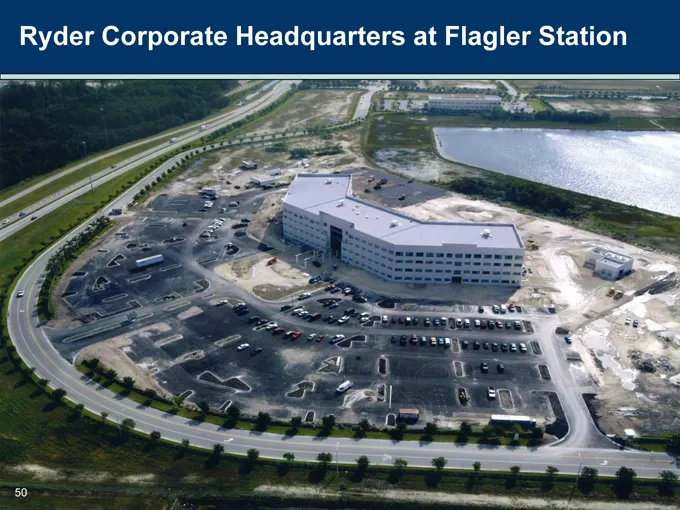
Slide 64: Ryder Corporate Headquarters at Flagler Station
Ryder Corporate Headquarters at Flagler Station
Slide 65: Flagler Station
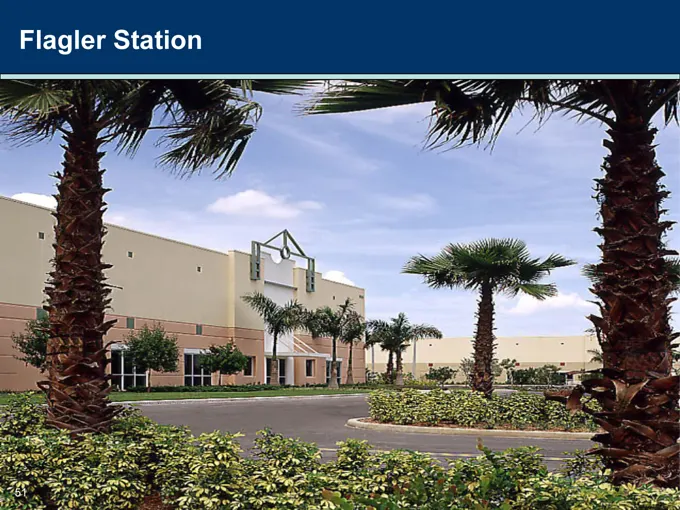
Flagler Station
Slide 66: Remaining Entitlements
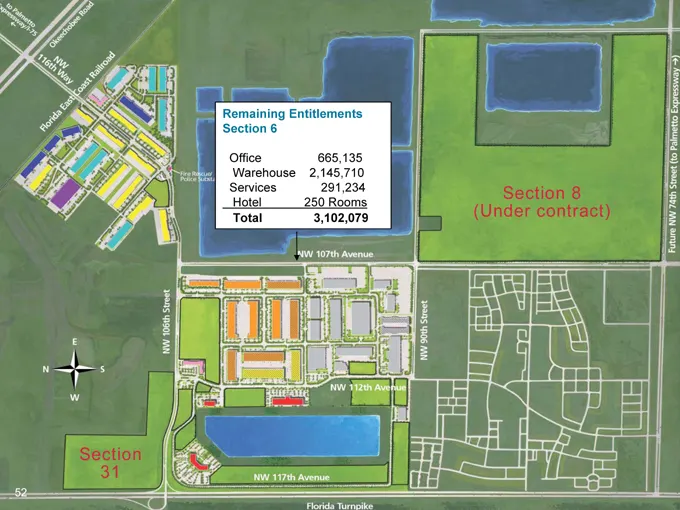
Remaining Entitlements Section 6 Office 665,135 Warehouse 2,145,710 Services 291,234 Hotel 250 Rooms Total 3,102,079
Slide 67: Flagler Has a Diversified Tenant Base
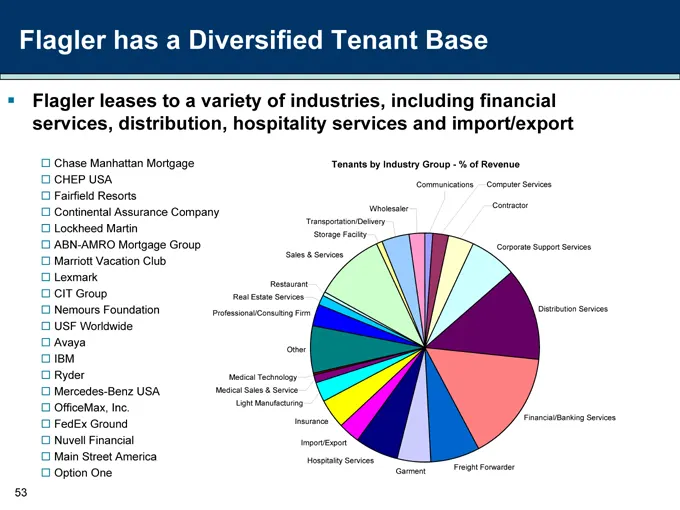
Flagler has a Diversified Tenant Base Flagler leases to a variety of industries, including financial services, distribution, hospitality services and import/export Chase Manhattan Mortgage CHEP USA Fairfield Resorts Continental Assurance Company Lockheed Martin ABN-AMRO Mortgage Group Marriott Vacat
Slide 68: Flagler Recent Land Sales
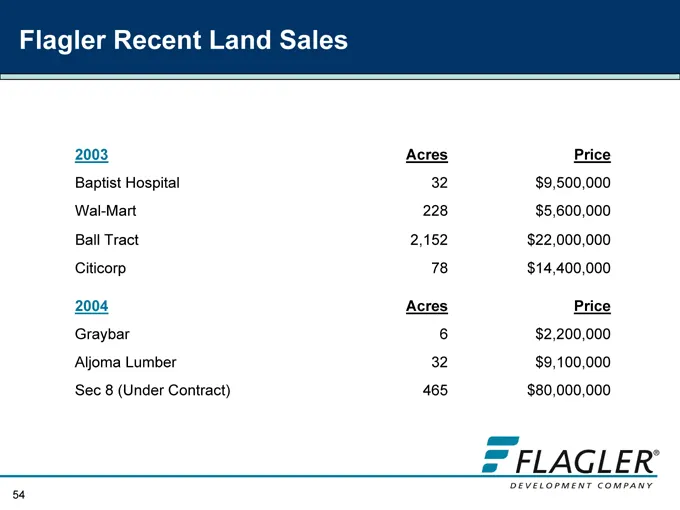
Flagler Recent Land Sales 2003 Acres Price Baptist Hospital 32 $ 9,500,000 Wal-Mart 228 $ 5,600,000 Ball Tract 2,152 $ 22,000,000 Citicorp 78 $ 14,400,000 2004 Acres Price Graybar 6 $ 2,200,000 Aljoma Lumber 32 $ 9,100,000 Sec 8 (Under Contract) 465 $ 80,000,000
Slide 69: Flagler Recent Building Sales
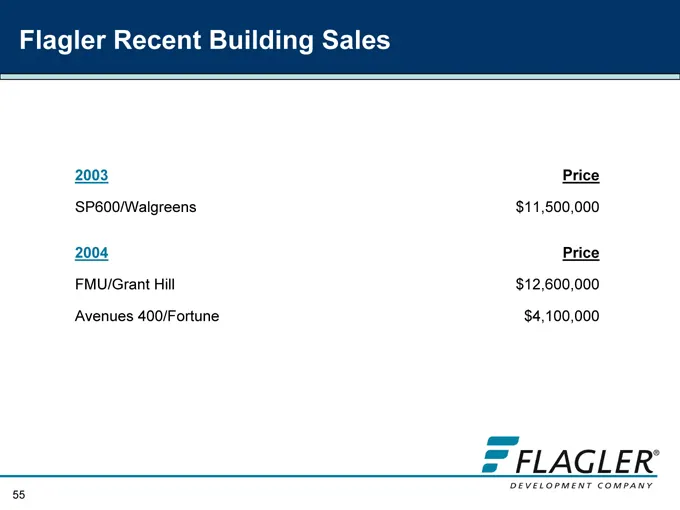
Flagler Recent Building Sales 2003 Price SP600/Walgreens $ 11,500,000 2004 Price FMU/Grant Hill $ 12,600,000 Avenues 400/Fortune $ 4,100,000
Slide 70: Key Financial Metrics for Flagler
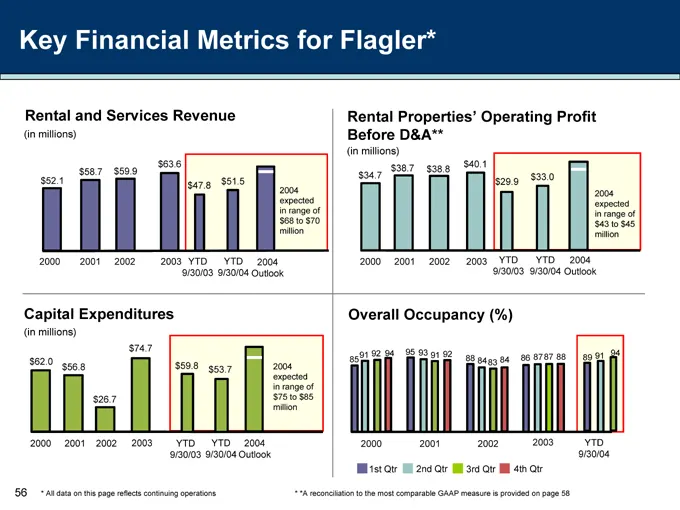
Key Financial Metrics for Flagler* Rental and Services Revenue (in millions) $63.6 $58.7 $59.9 $52.1 $51.5 $47.8 2004 expected in range of $68 to $70 million 2000 2001 2002 2003 YTD YTD 9/30/03 9/30/04 Outlook Rental Properties’ Operating Profit Before D&A** (in millions) $38.7 $40.1 $38.8 $34.7 $33
Slide 71: Flagler's 2004 Capital Expenditure $75–85M
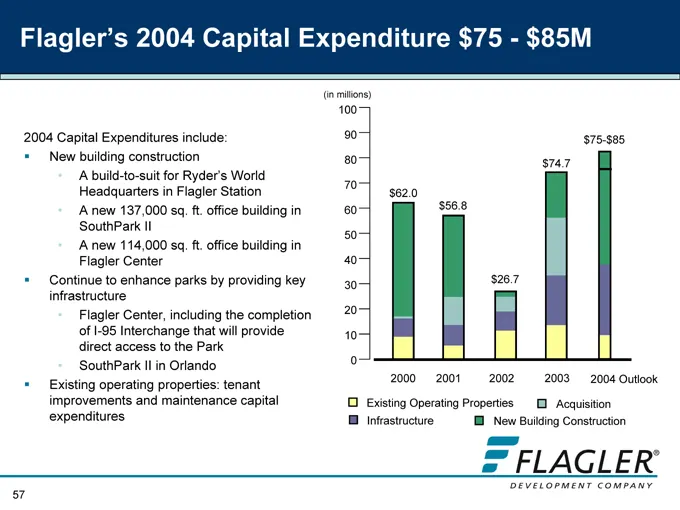
Flagler’s 2004 Capital Expenditure $75—$85M 2004 Capital Expenditures include: New building construction A build-to-suit for Ryder’s World Headquarters in Flagler Station A new 137,000 sq. ft. office building in SouthPark II A new 114,000 sq. ft. office building in Flagler Center Continue to enhance
Slide 72: Reconciliation of Non-GAAP to GAAP Measures
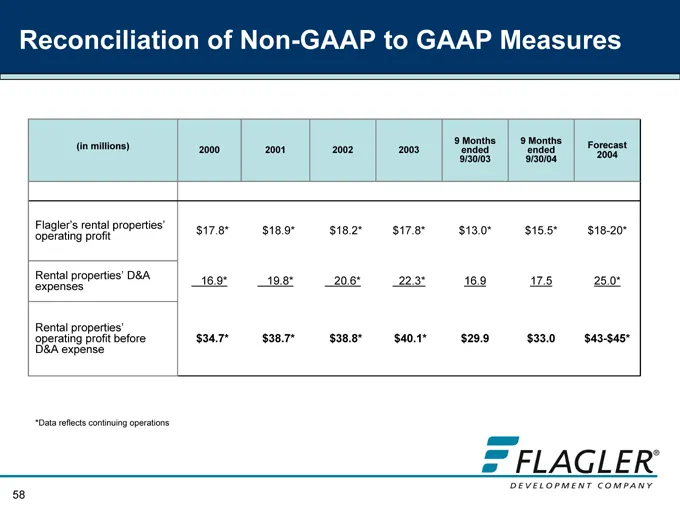
Reconciliation of Non-GAAP to GAAP Measures 9 Months 9 Months Forecast (in millions) 2000 2001 2002 2003 ended ended 9/30/03 9/30/04 2004 Flagler’s rental properties’ $17.8* $18.9* $18.2* $17.8* $ 13.0* $ 15.5* $18-20* operating profit Rental properties’ D&A 16.9* 19.8* 20.6* 22.3* 16.9 17.5 25.0* e
Slide 73
Slide 74: FECR Mission
FECR Mission FEC Railway is committed to be the premier transportation service solution for Florida and Beyond
Slide 75: FECR Vision
FECR Vision Providing dependable transportation services to our customers Increasing shareholder value by seeking consistent growth with existing and new customers at satisfactory returns Conducting our business safely, with honesty and integrity, rewarding good performance and providing employees w
Slide 76: FECR's Five Driving Principles
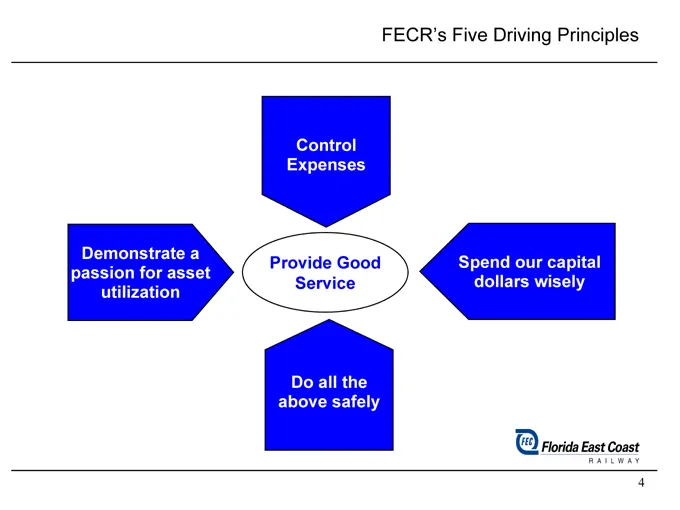
FECR’s Five Driving Principles Control Expenses Demonstrate a passion for asset utilization Provide Good Service Spend our capital dollars wisely Do all the above safely
Slide 77: A Brief History of FECR
A Brief History of FECR In 1883 Henry Flagler began assembling a railroad starting in Jacksonville and going down Florida’s east coast. Flagler bought or acquired, through government land grants, large tracts of land in close proximity to the railroad and over time, built a sizable real estate portf
Slide 78: FECR Physical Plant
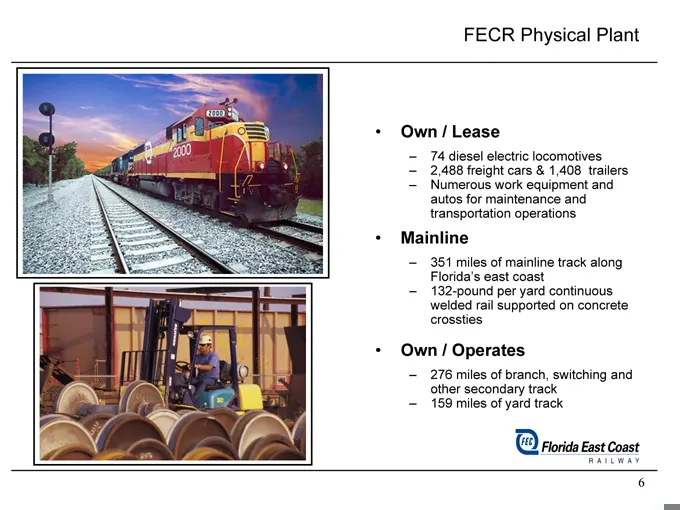
FECR Physical Plant Own / Lease 74 diesel electric locomotives 2,488 freight cars & 1,408 trailers Numerous work equipment and autos for maintenance and transportation operations Mainline miles of mainline track along Florida’s east coast 132-pound per yard continuous welded rail supported on concre
Slide 79: FECR Facilities
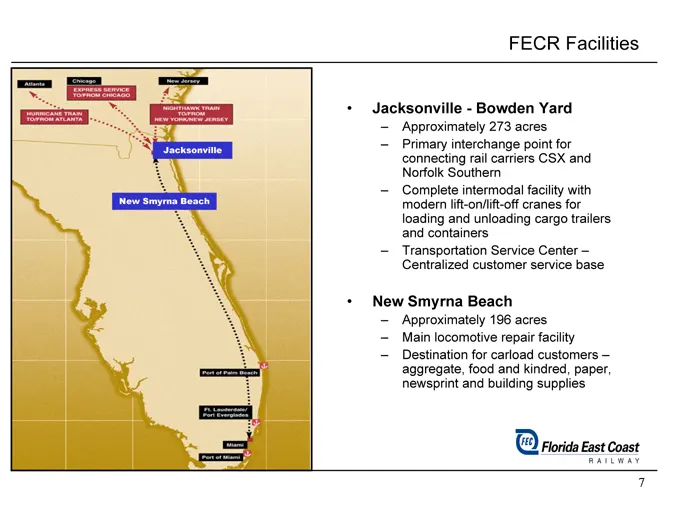
FECR Facilities Jacksonville—Bowden Yard Approximately 273 acres Primary interchange point for connecting rail carriers CSX and Norfolk Southern Complete intermodal facility with modern lift-on/lift-off cranes for loading and unloading cargo trailers and containers Transportation Service Center –Cen
Slide 80: FECR Facilities
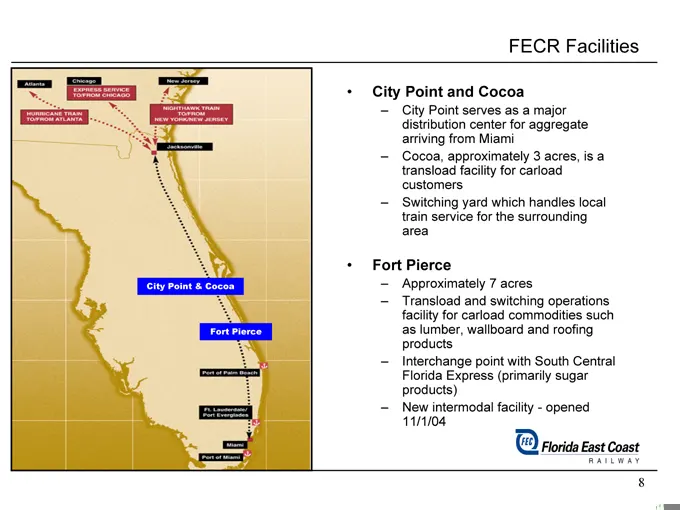
FECR Facilities City Point and Cocoa City Point serves as a major distribution center for aggregate arriving from Miami Cocoa, approximately 3 acres, is a transload facility for carload customers Switching yard which handles local train service for the surrounding area Fort Pierce Approximately 7 ac
Slide 81: FECR Facilities
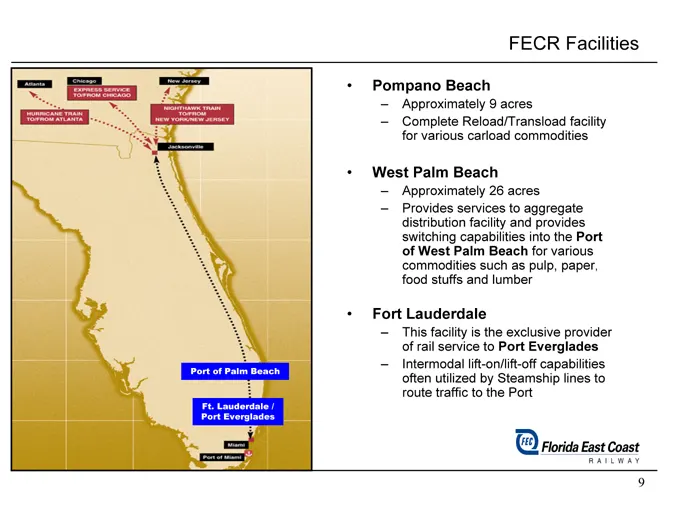
FECR Facilities Port of Palm Beach Ft. Lauderdale / Port Everglades Pompano Beach Approximately 9 acres Complete Reload/Transload facility for various carload commodities West Palm Beach Approximately 26 acres Provides services to aggregate distribution facility and provides switching capabilities i
Slide 82: FECR Facilities
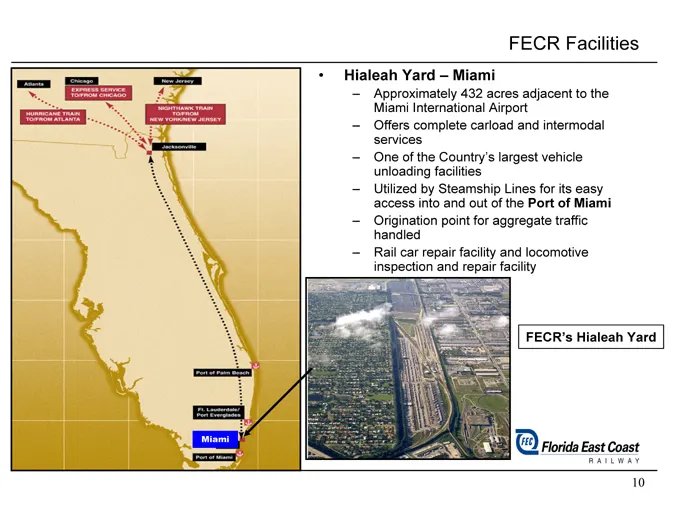
FECR Facilities Miami Hialeah Yard – Miami Approximately 432 acres adjacent to the Miami International Airport Offers complete carload and intermodal services One of the Country’s largest vehicle unloading facilities Utilized by Steamship Lines for its easy access into and out of the Port of Miami O
Slide 83: FECR Competitive Advantages
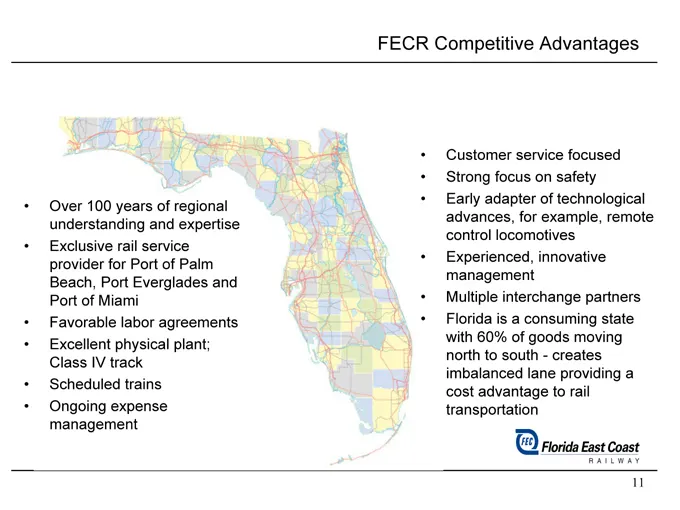
FECR Competitive Advantages Over 100 years of regional understanding and expertise Exclusive rail service provider for Port of Palm Beach, Port Everglades and Port of Miami Favorable labor agreements Excellent physical plant; Class IV track Scheduled trains Ongoing expense management Customer servic
Slide 84: 2003 Flow of Goods
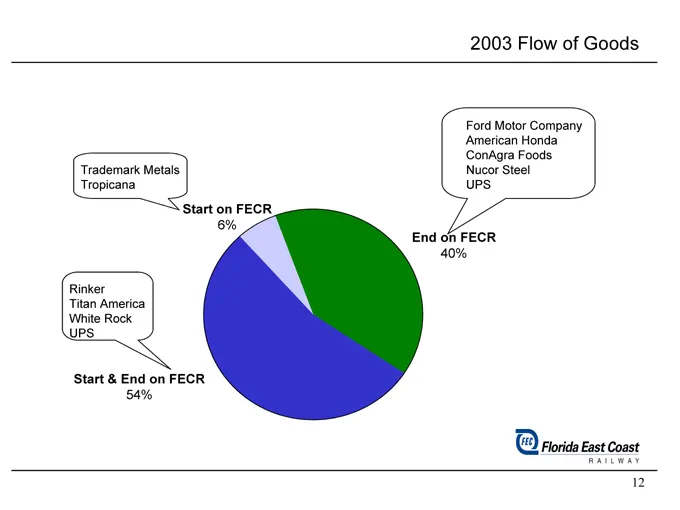
2003 Flow of Goods Trademark Metals Tropicana Ford Motor Company American Honda ConAgra Foods Nucor Steel UPS Start on FECR 6% End on FECR 40% Rinker Titan America White Rock UPS Start & End on FECR 54%
Slide 85: Major Commodity Detail
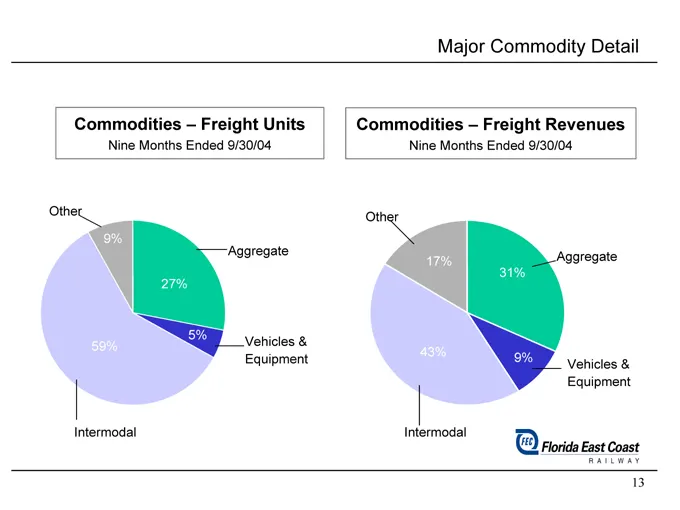
Major Commodity Detail Commodities – Freight Units Nine Months Ended 9/30/04 Commodities – Freight Revenues Nine Months Ended 9/30/04 Other 9% Aggregate 27% 59% 5% Intermodal Vehicles & Equipment Other 17% 31% Aggregate 43% Intermodal 9% Vehicles & Equipment
Slide 86: Carload Customers and Strategy
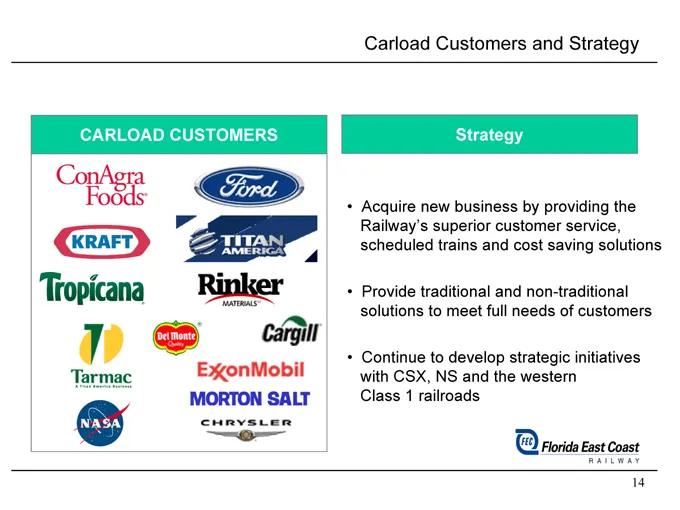
Carload Customers and Strategy CARLOAD CUSTOMERS Strategy Acquire new business by providing the Railway’s superior customer service, scheduled trains and cost saving solutions Provide traditional and non-traditional solutions to meet full needs of customers Continue to develop strategic initiatives
Slide 87: Carload Customers
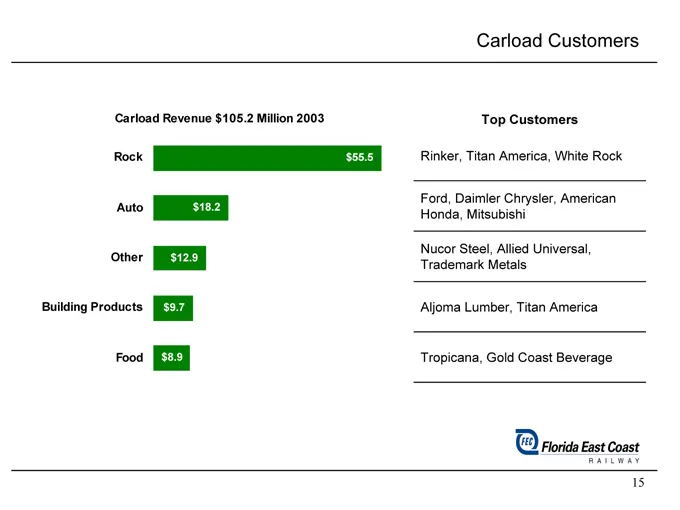
Carload Customers Carload Revenue $105.2 Million 2003 Rock Auto Other Building Products Food $55.5 $18.2 $12.9 $9.7 $8.9 Top Customers Rinker, Titan America, White Rock Ford, Daimler Chrysler, American Honda, Mitsubishi Nucor Steel, Allied Universal, Trademark Metals Aljoma Lumber, Titan America Tro
Slide 88: Aggregate Business Drivers
Aggregate Business Drivers Demand Demand for aggregate is driven by road construction & infrastructure upgrades, housing starts, and commercial construction Florida is the 3rd largest consumer of aggregate products – 92 million tons per year Florida’s population is expected to grow 1.7% per year thr
Slide 89: Aggregate Demand Drivers
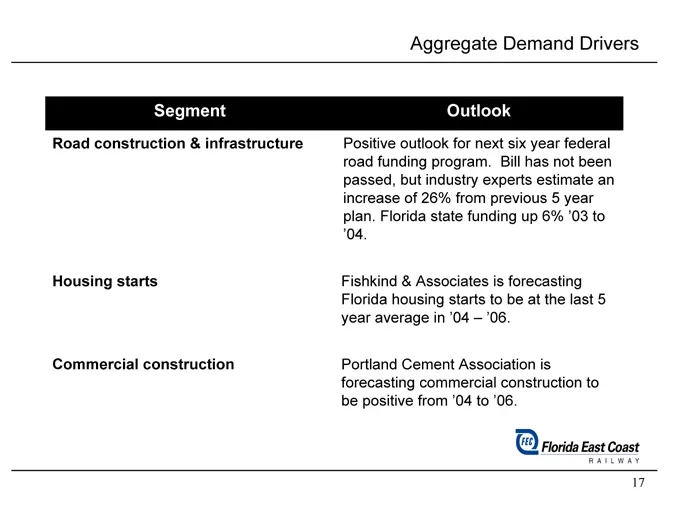
Aggregate Demand Drivers Segment Outlook Road construction & infrastructure Positive outlook for next six year federal road funding program. Bill has not been passed, but industry experts estimate an increase of 26% from previous 5 year plan. Florida state funding up 6% ‘03 to ‘04. Housing starts Fi
Slide 90: Aggregate Supply
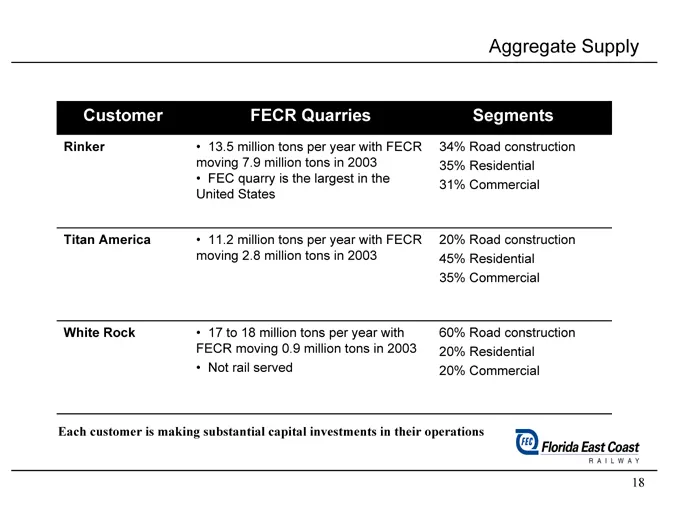
Aggregate Supply Customer FECR Quarries Segments Rinker 13.5 million tons per year with FECR 34% Road construction moving 7.9 million tons in 2003 35% Residential FEC quarry is the largest in the 31% Commercial United States Titan America 11.2 million tons per year with FECR 20% Road construction mo
Slide 91: Aggregate Revenue 1999–2003
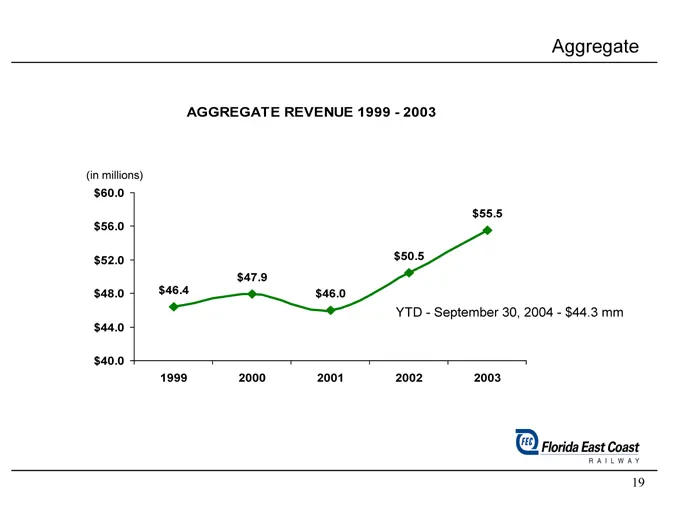
Aggregate AGGREGATE REVENUE 1999—2003 (in millions) $60.0 $56.0 $52.0 $48.0 $44.0 $40.0 $46.4 $47.9 $46.0 $50.5 $55.5 YTD—September 30, 2004—$44.3 mm 1999 2000 2001 2002 2003
Slide 92: Automotive Revenue 1999–2003
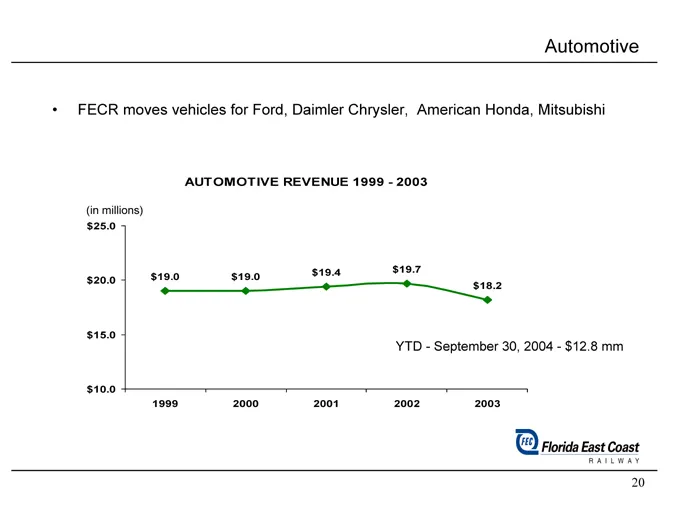
Automotive FECR moves vehicles for Ford, Daimler Chrysler, American Honda, Mitsubishi AUTOMOTIVE REVENUE 1999—2003 (in millions) $25.0 $20.0 $15.0 $10.0 $19.4 $19.7 $19.0 $19.0 $18.2 YTD—September 30, 2004—$12.8 mm 1999 2000 2001 2002 2003
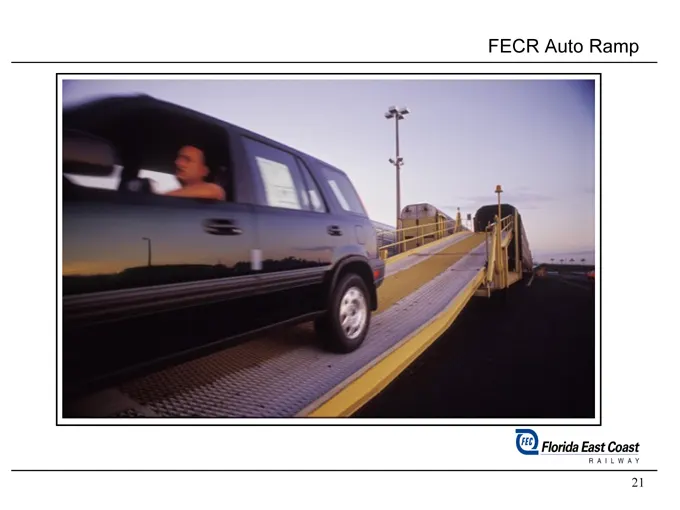
Slide 93: FECR Auto Ramp
FECR Auto Ramp
Slide 94: Food & Kindred
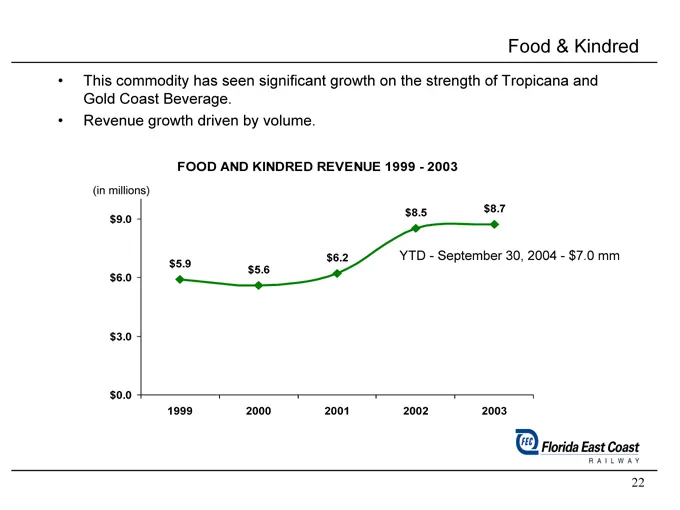
Food & Kindred This commodity has seen significant growth on the strength of Tropicana and Gold Coast Beverage. Revenue growth driven by volume. FOOD AND KINDRED REVENUE 1999—2003 (in millions) $9.0 $6.0 $3.0 $0.0 $5.9 $5.6 $6.2 $8.5 $8.7 YTD—September 30, 2004—$7.0 mm 1999 2000 2001 2002 2003
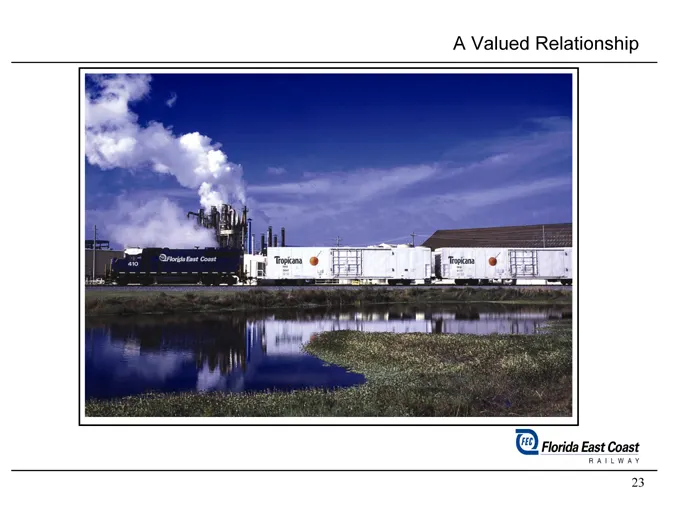
Slide 95: A Valued Relationship
A Valued Relationship
Slide 96: Intermodal Customers and Strategy
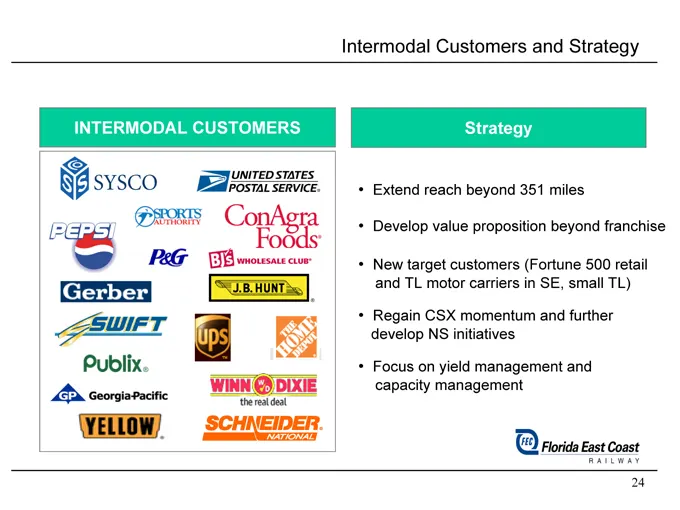
Intermodal Customers and Strategy INTERMODAL CUSTOMERS Strategy Extend reach beyond 351 miles Develop value proposition beyond franchise New target customers (Fortune 500 retail and TL motor carriers in SE, small TL) Regain CSX momentum and further develop NS initiatives Focus on yield management an
Slide 97: Valued Relationships
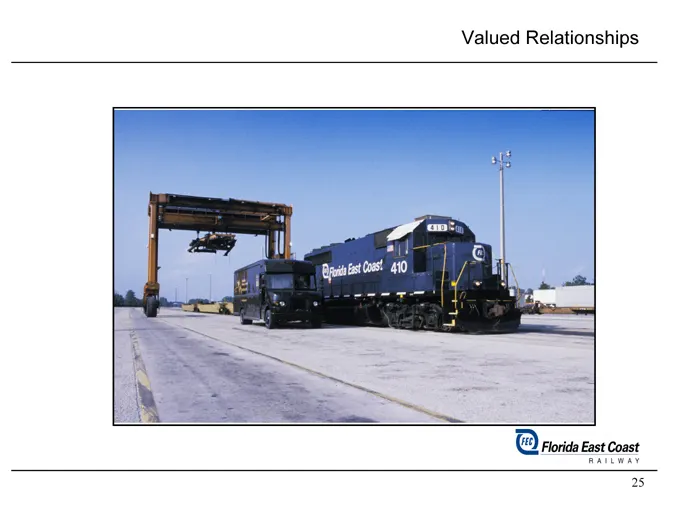
Valued Relationships
Slide 98: Intermodal Results
Intermodal Results 5 consecutive quarters of improving results Intermodal revenue driven by: Service reputation Focus on local brand strength Capacity management Door–to–door capability Enhanced marketing New management
Slide 99: Intermodal Customers
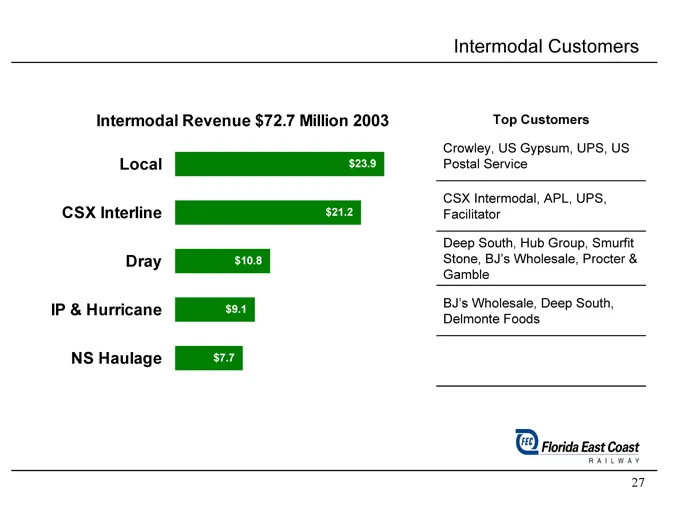
Intermodal Customers Intermodal Revenue $72.7 Million 2003 Local CSX Interline Dray IP & Hurricane NS Haulage $23.9 $21.2 $10.8 $9.1 $7.7 Top Customers Crowley, US Gypsum, UPS, US Postal Service CSX Intermodal, APL, UPS, Facilitator Deep South, Hub Group, Smurfit Stone, BJ’s Wholesale, Procter & Gam
Slide 100: Valued Intermodal Relationship
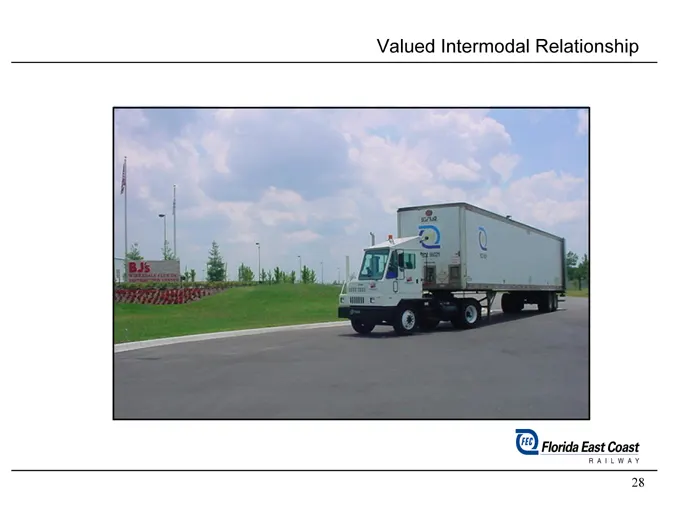
Valued Intermodal Relationship
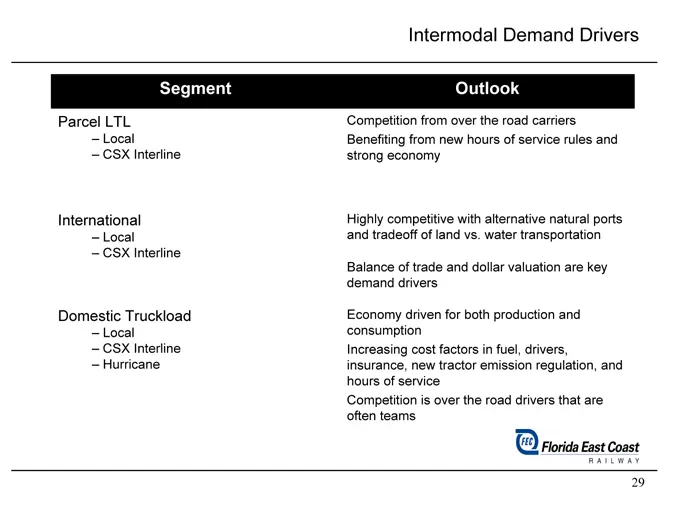
Slide 101: Intermodal Demand Drivers
Intermodal Demand Drivers Segment Outlook Parcel LTL Competition from over the road carriers Local Benefiting from new hours of service rules and CSX Interline strong economy International Highly competitive with alternative natural ports Local and tradeoff of land vs. water transportation CSX Inter
Slide 102: Intermodal Traffic in Transit
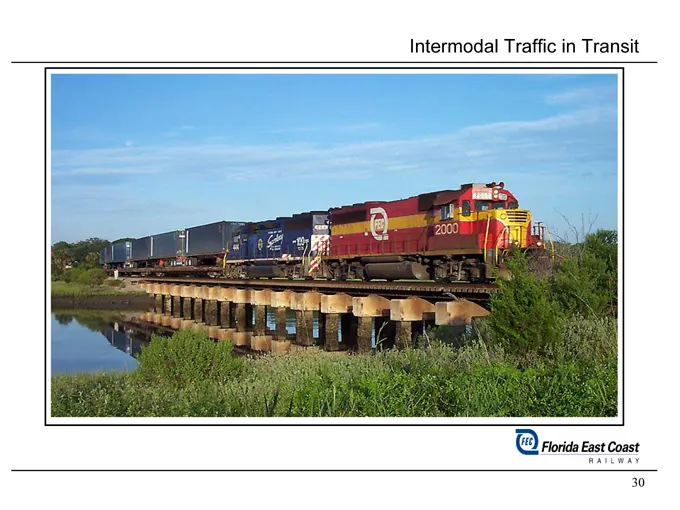
Intermodal Traffic in Transit
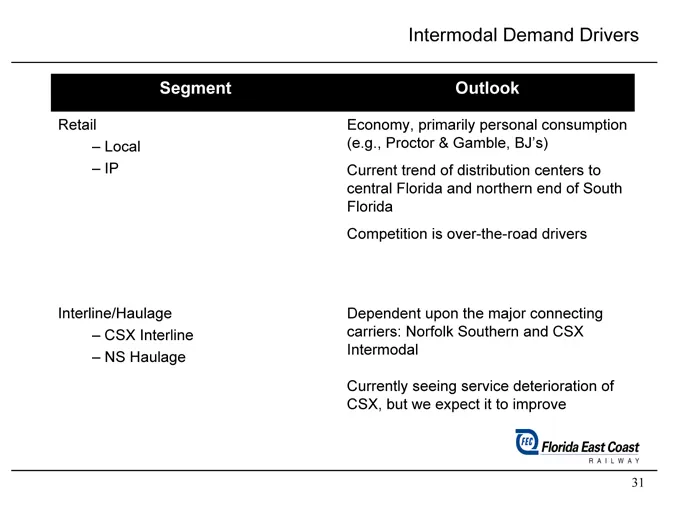
Slide 103: Intermodal Demand Drivers
Intermodal Demand Drivers Segment Outlook Retail Economy, primarily personal consumption Local (e.g., Proctor & Gamble, BJ’s) IP Current trend of distribution centers to central Florida and northern end of South Florida Competition is over-the-road drivers Interline/Haulage Dependent upon the major
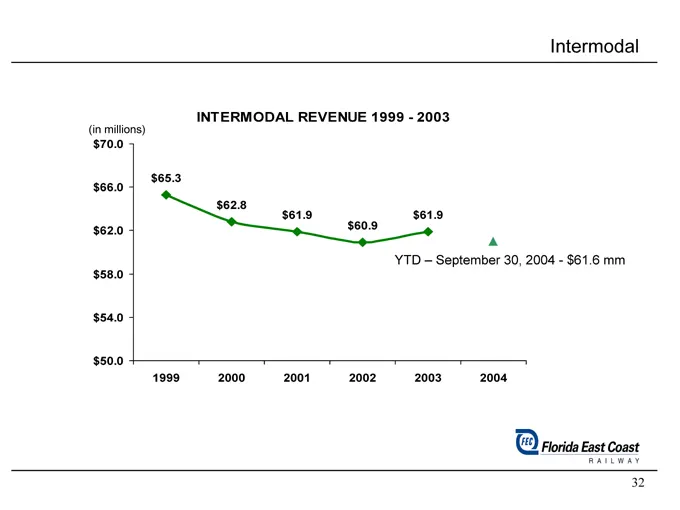
Slide 104: Intermodal Revenue 1999–2003
Intermodal INTERMODAL REVENUE 1999—2003 (in millions) $70.0 $66.0 $62.0 $58.0 $54.0 $50.0 $65.3 $62.8 $61.9 $61.9 $60.9 YTD – September 30, 2004—$61.6 mm 1999 2000 2001 2002 2003 2004
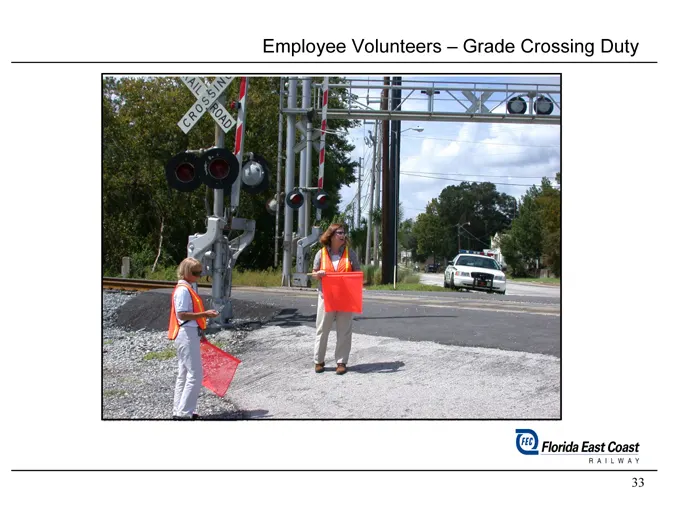
Slide 105: Employee Volunteers – Grade Crossing Duty
Employee Volunteers – Grade Crossing Duty
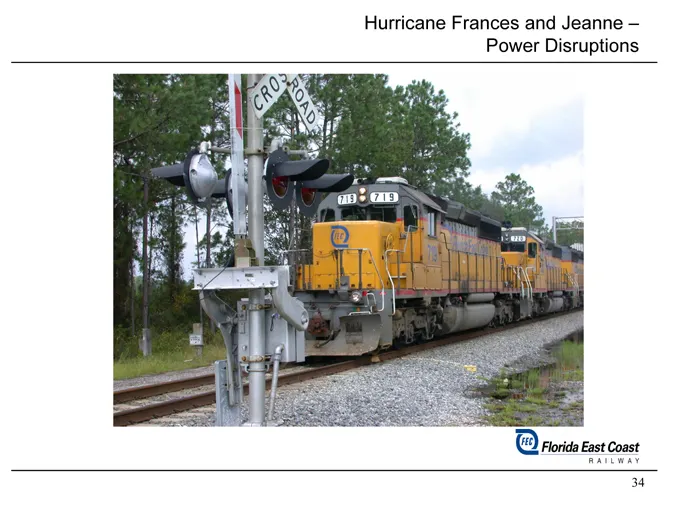
Slide 106: Hurricane Frances and Jeanne – Power Disruptions
Hurricane Frances and Jeanne –Power Disruptions
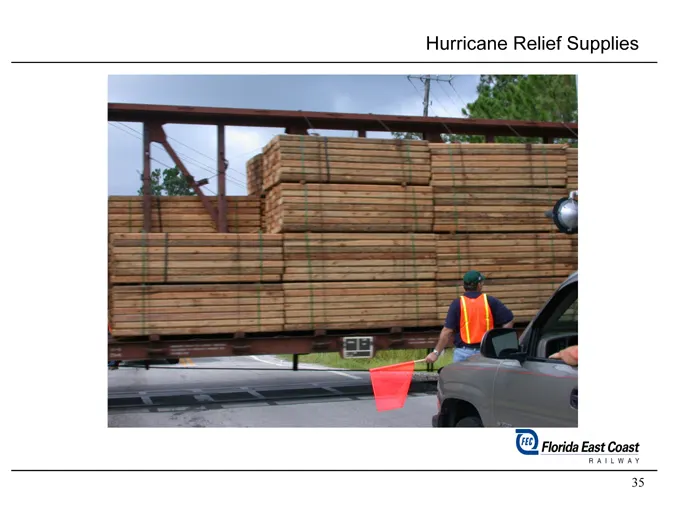
Slide 107: Hurricane Relief Supplies
Hurricane Relief Supplies
Slide 108: Operating Results
OPERATING RESULTS OQ horde test coast 36
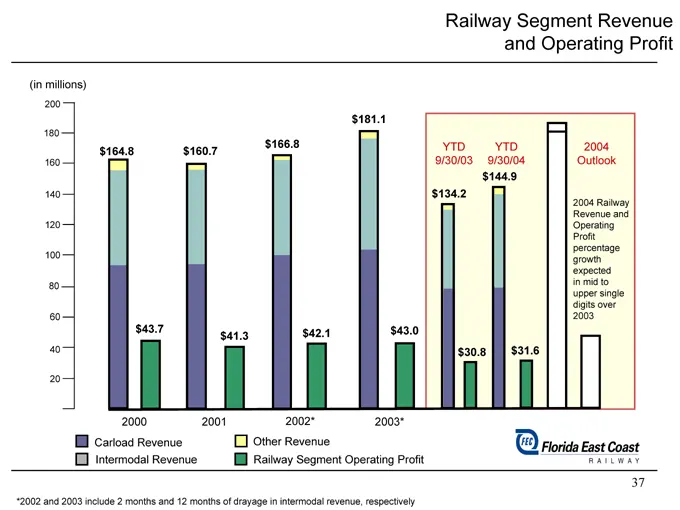
Slide 109: Railway Segment Revenue and Operating Profit
Railway Segment Revenue and Operating Profit (in millions) 200 180 160 140 120 100 80 60 40 20 $164.8 $43.7 $160.7 $41.3 $166.8 $42.1 $181.1 $43.0 YTD 9/30/03 $134.2 $30.8 YTD 9/30/04 $144.9 $31.6 2004 Outlook 2004 Railway Revenue and Operating Profit percentage growth expected in mid to upper singl
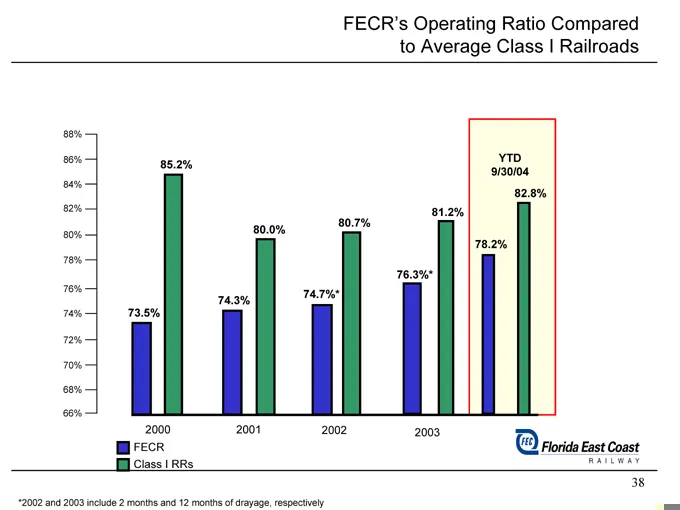
Slide 110: FECR's Operating Ratio Compared to Average Class I Railroads
FECR’s Operating Ratio Compared to Average Class I Railroads 88% 86% 84% 82% 80% 78% 76% 74% 72% 70% 68% 66% 73.5% 85.2% 74.3% 80.0% 74.7%* 80.7% 76.3%* 81.2% 78.2% YTD 9/30/04 82.8% 2000 2001 2002 2003 FECR Class I RRs *2002 and 2003 include 2 months and 12 months of drayage, respectively
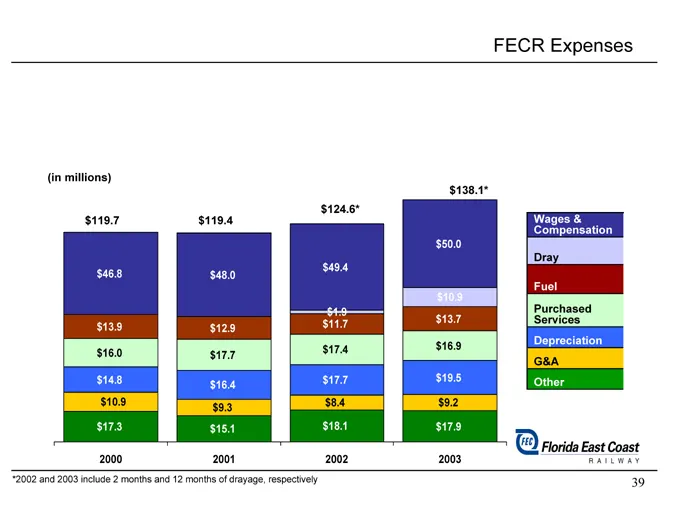
Slide 111: FECR Expenses
FECR Expenses (in millions) $138.1* $124.6* $119.7 $119.4 Wages & Compensation $50.0 Dray $49.4 $46.8 $48.0 Fuel $10.9 $1.9 Purchased $11.7 $13.7 Services $13.9 $12.9 Depreciation $17.4 $16.9 $16.0 $17.7 G&A $14.8 $17.7 $19.5 Other $16.4 $10.9 $8.4 $9.2 $9.3 $17.3 $15.1 $18.1 $17.9 2000 2001 2002 20
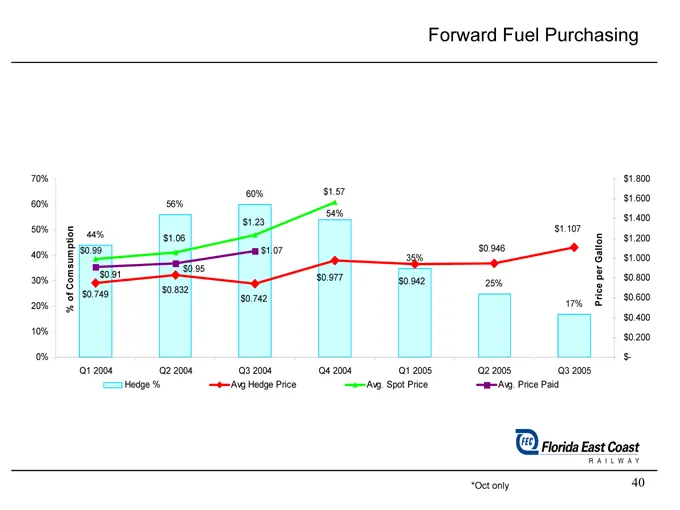
Slide 112: Forward Fuel Purchasing
Forward Fuel Purchasing 70% 60% 50% 40% 30% 20% 10% 0% % of Comsumption 44% $0.99 $0.91 $0.749 56% $1.06 $0.95 $0.832 60% $1.23 $1.07 $0.742 $1.57 54% $0.977 35% $0.942 $0.946 25% $1.107 17% Price per Gallon $1.800 $1.600 $1.400 $1.200 $1.000 $0.800 $0.600 $0.400 $0.200 $- Q1 2004 Q2 2004 Q3 2004 Q4
Slide 113: Capital Expenditures
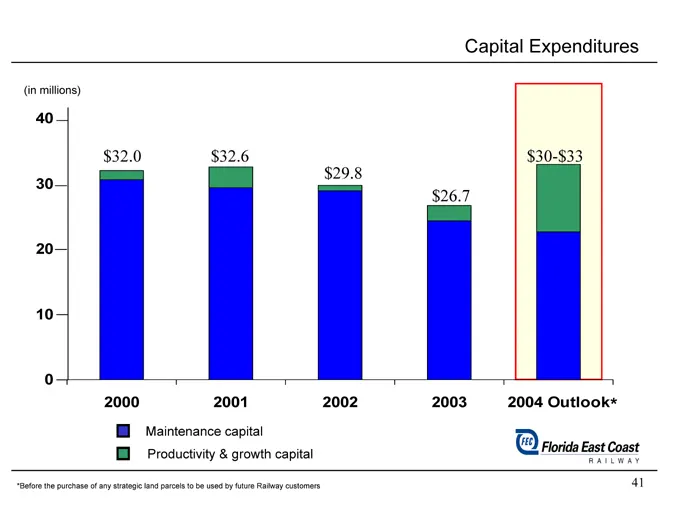
Capital Expenditures (in millions) 40 30 20 10 0 $32.0 $32.6 $30-$33 $29.8 $26.7 2000 2001 2002 2003 2004 Outlook* Maintenance capital Productivity & growth capital *Before the purchase of any strategic land parcels to be used by future Railway customers
Slide 114: WYE Bridge—Hialeah
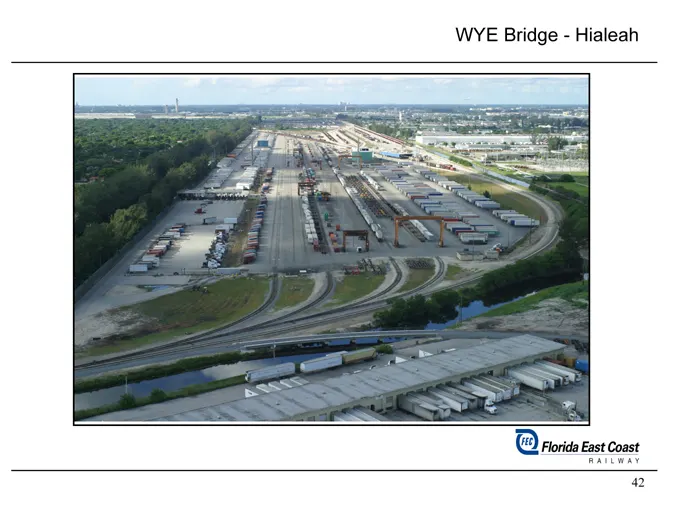
WYE Bridge—Hialeah
Slide 115: Productivity Enhancements
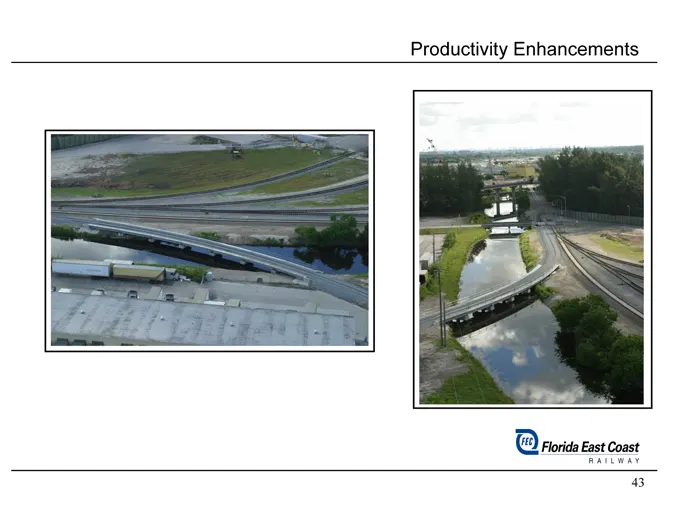
Productivity Enhancements
Slide 116: Productivity
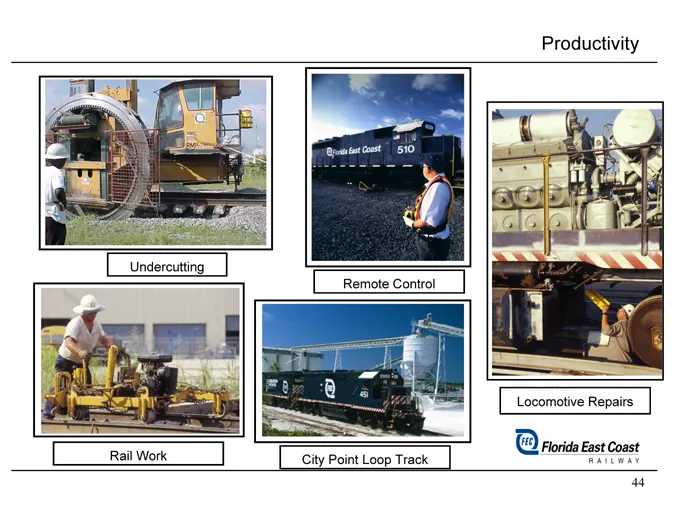
Productivity Undercutting Remote Control Rail Work City Point Loop Track Locomotive Repairs
Slide 117: Summary—FECR
Summary—FECR Well-run railroad generating consistent cash flow Advantage is location, which cannot be duplicated today Focus to grow core carload and intermodal business Potential opportunities with connecting carriers Capital investments that enhance productivity
Source: SEC EDGAR · 8-K filed Nov 5, 2004
More decks from Florida East Coast Industries Inc
 Merger or Acquisition (May 2007)15 slides · May 31, 2007
 Q1 2007 Earnings Presentation26 slides · May 9, 2007
 Q4 2006 Earnings Presentation39 slides · Feb 15, 2007
 Q3 2006 Earnings Presentation36 slides · Nov 2, 2006
 Ryan Beck Investor Event (September 2006)80 slides · Sep 13, 2006
 Morgan Keegan 2006 Equity Conference30 slides · Sep 7, 2006