The Dow Chemical — Q4 2014 Earnings Presentation
47 slides from The Dow Chemical's earnings presentation, Jan 29, 2015
Slide 1: 4Q 2014 Earnings Conference Call
The Dow Chemical Company 4Q 2014 Earnings Conference Call January 29, 2015 The Dow Chemical Company
Slide 2: SEC Disclosure Rules
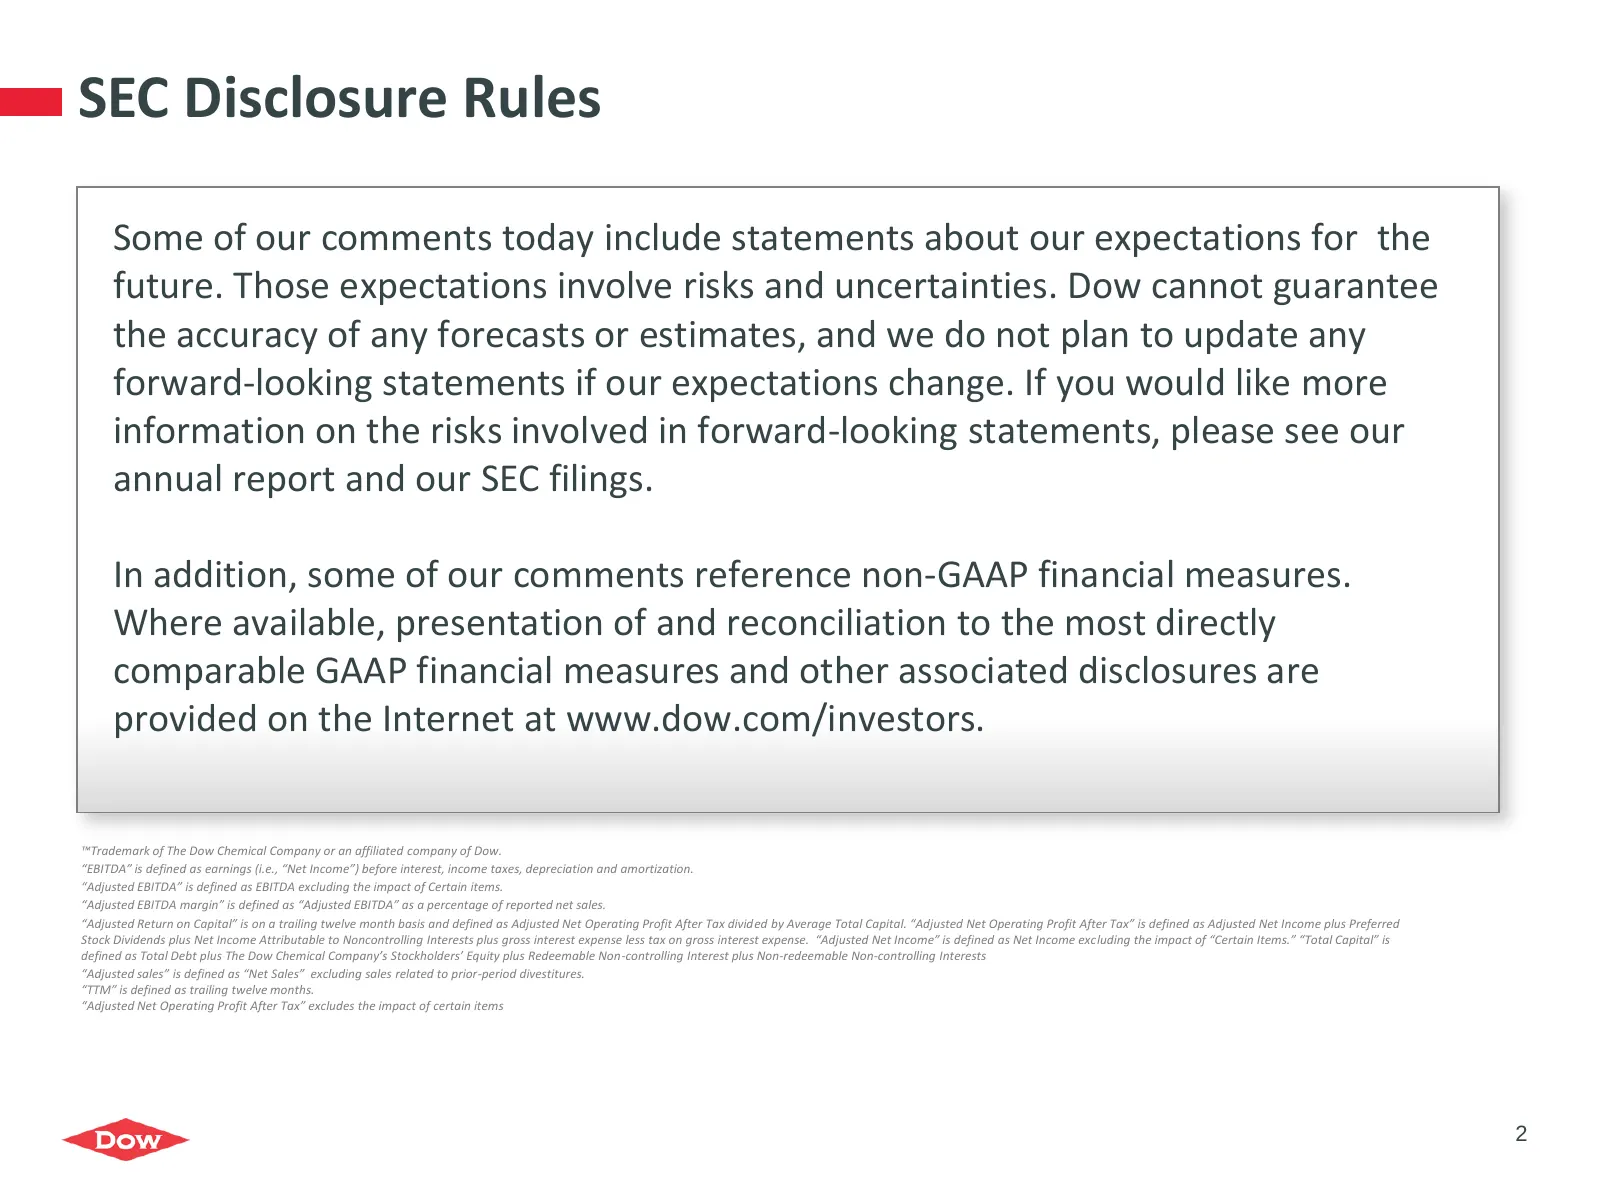
SEC Disclosure Rules Some of our comments today include statements about our expectations for the future. Those expectations involve risks and uncertainties. Dow cannot guarantee the accuracy of any forecasts or estimates, and we do not plan to update any forward-looking statements if our expectatio
Slide 3: Agenda
Agenda 4Q and FY 2014 Overview Segment Highlights Strategic Actions 2015 Priorities 3
Slide 4: Dow Achieves Record 4Q, Full Year 2014 Results
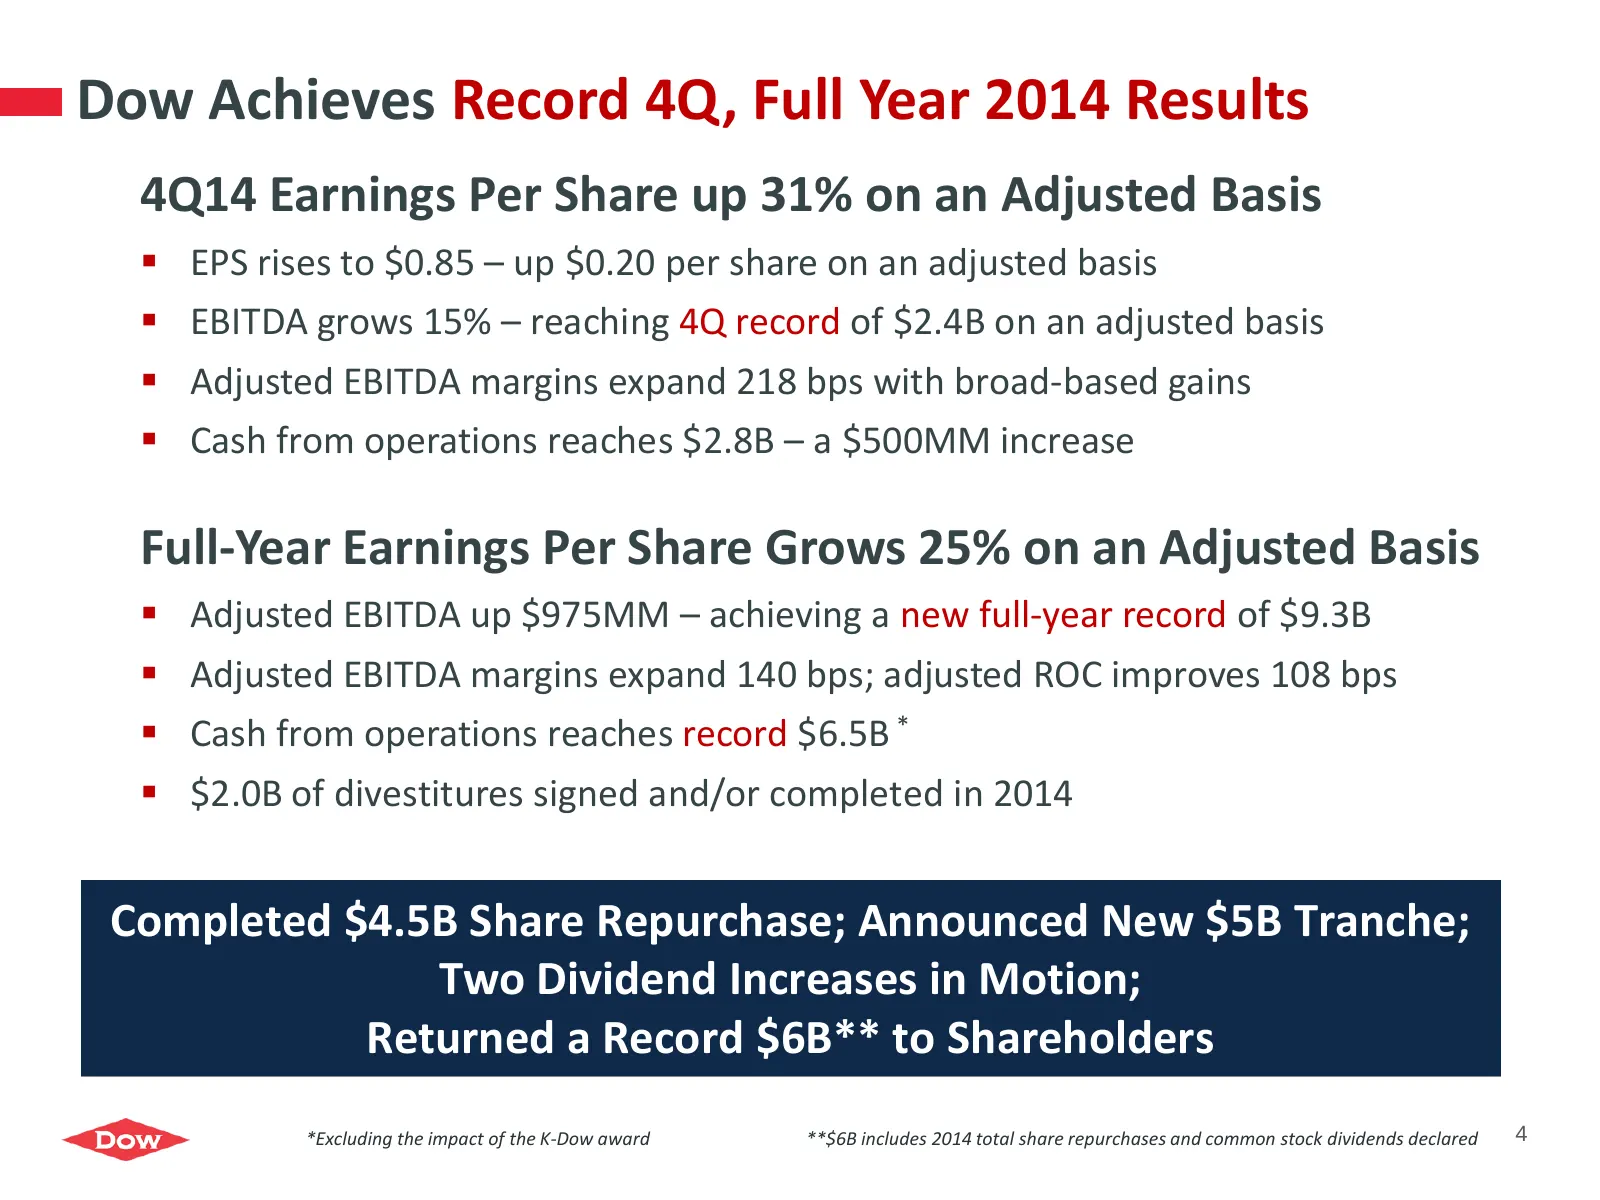
Dow Achieves Record 4Q, Full Year 2014 Results 4Q14 Earnings Per Share up 31% on an Adjusted Basis EPS rises to $0.85 – up $0.20 per share on an adjusted basis EBITDA grows 15% – reaching 4Q record of $2.4B on an adjusted basis Adjusted EBITDA margins expand 218 bps with broad-based gains Ca
Slide 5: 4Q14 Financial Performance
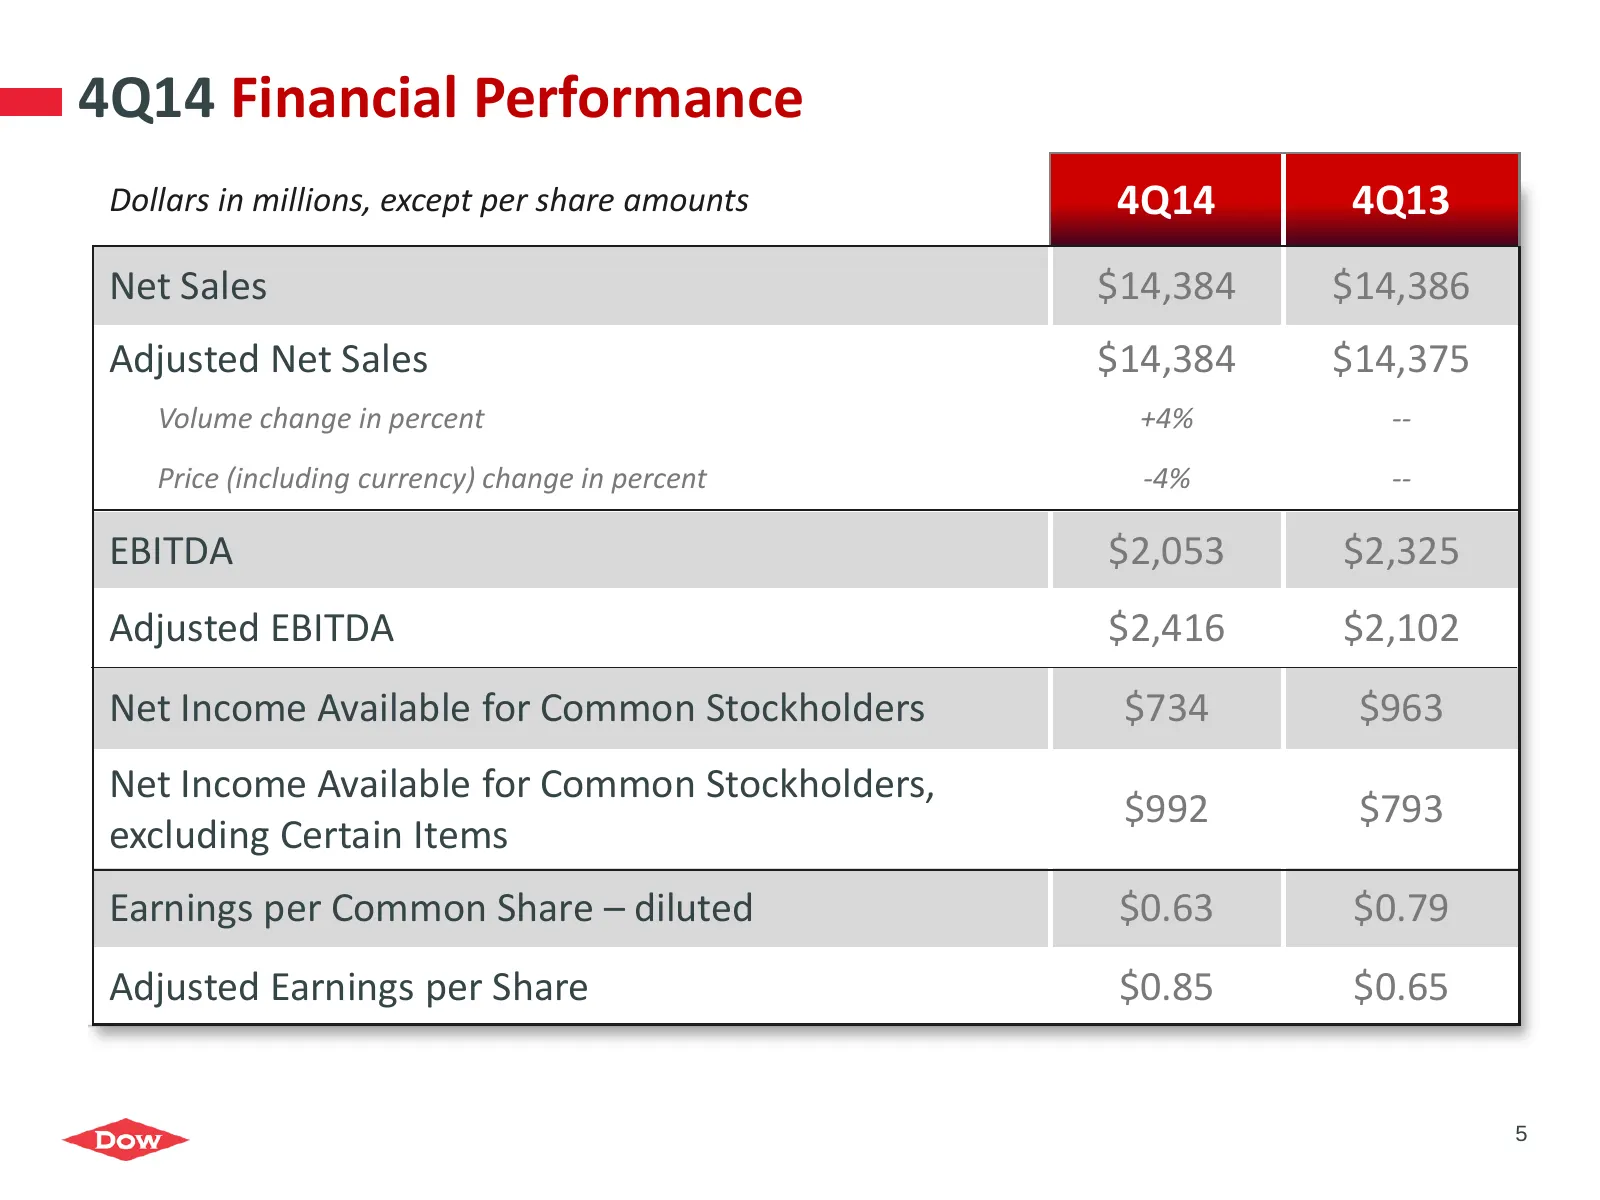
4Q14 Financial Performance Dollars in millions, except per share amounts 4Q14 4Q13 Net Sales $14,384 $14,386 Adjusted Net Sales $14,384 $14,375 Volume change in percent +4% -- Price (including currency) change in percent -4% -- EBITDA $2,053 $2,325 Adjusted EBITDA $2,416 $2,102 Net Income Available
Slide 6: Agenda
Agenda 4Q and FY 2014 Overview Segment Highlights Strategic Actions 2015 Priorities 6
Slide 7: Agricultural Sciences Market Trends and Near-Term Outlook
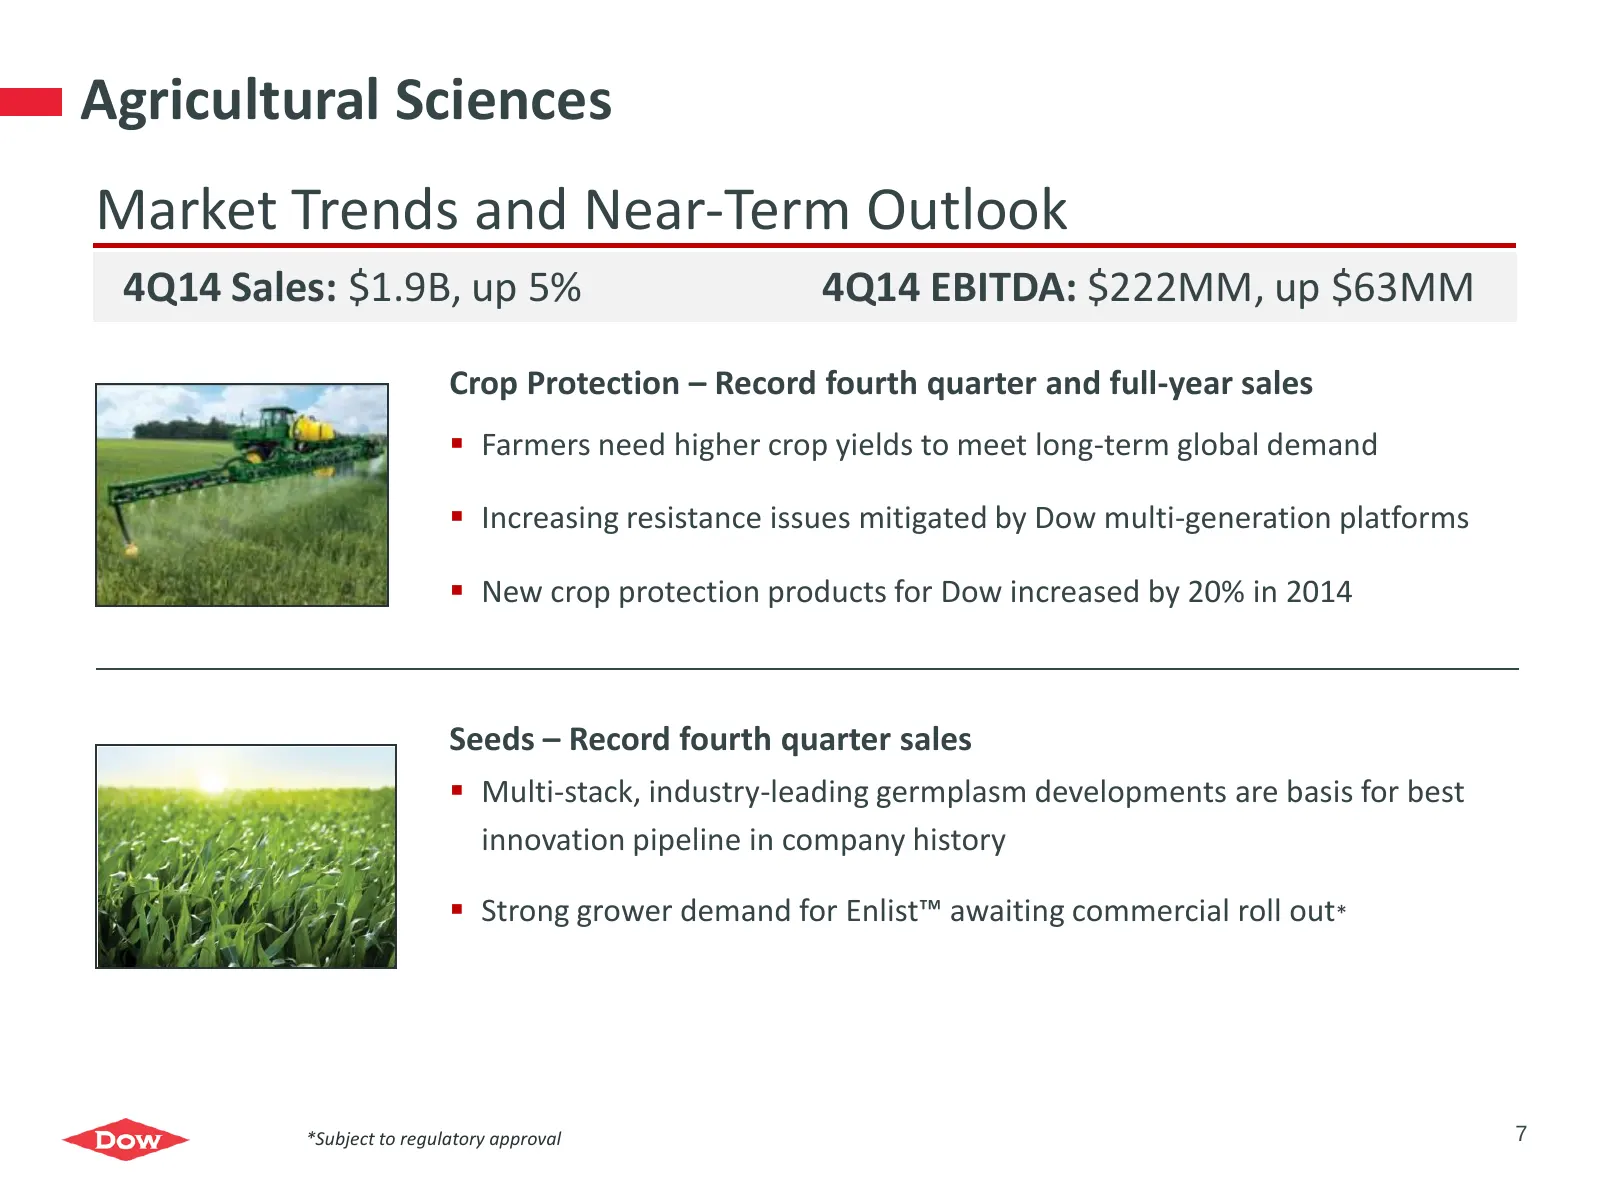
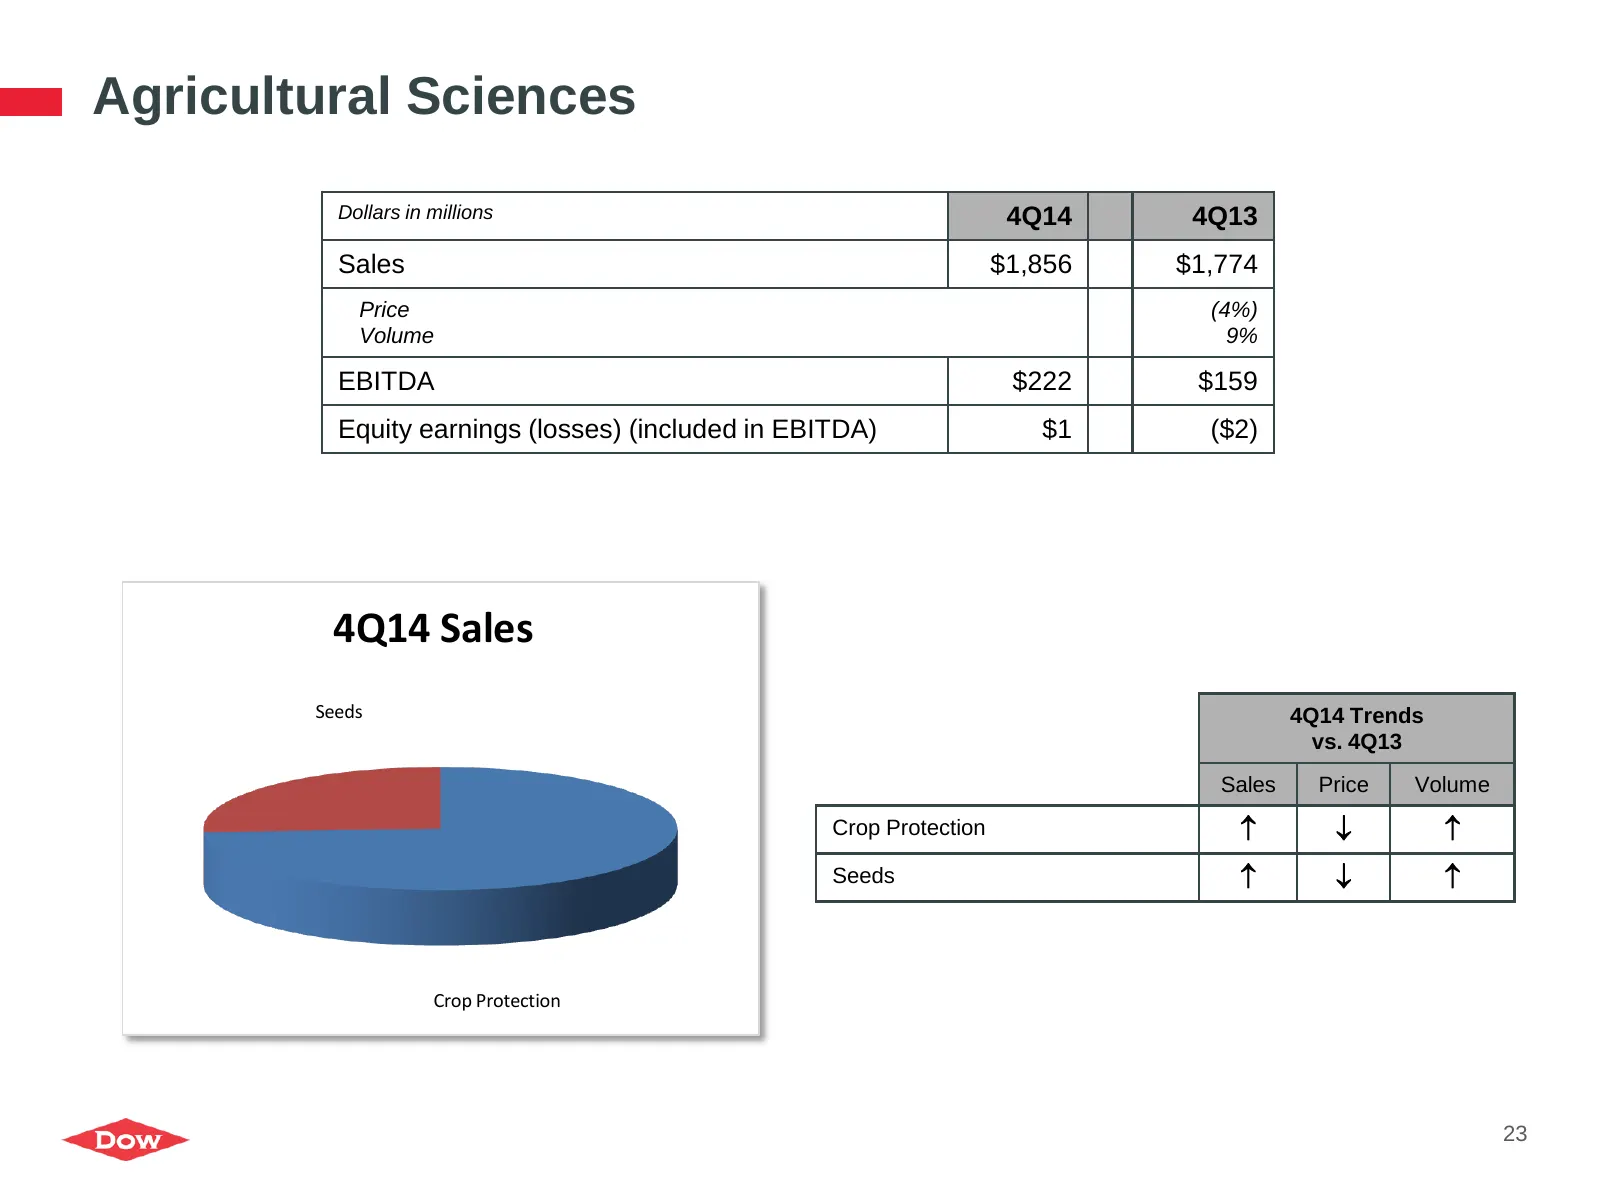
Agricultural Sciences Market Trends and Near-Term Outlook 4Q14 Sales: $1.9B, up 5% 4Q14 EBITDA: $222MM, up $63MM Crop Protection – Record fourth quarter and full-year sales Farmers need higher crop yields to meet long-term global demand Increasing resistance issues mitigated by Dow multi-generat
Slide 8: Consumer Solutions Market Trends and Near-Term Outlook
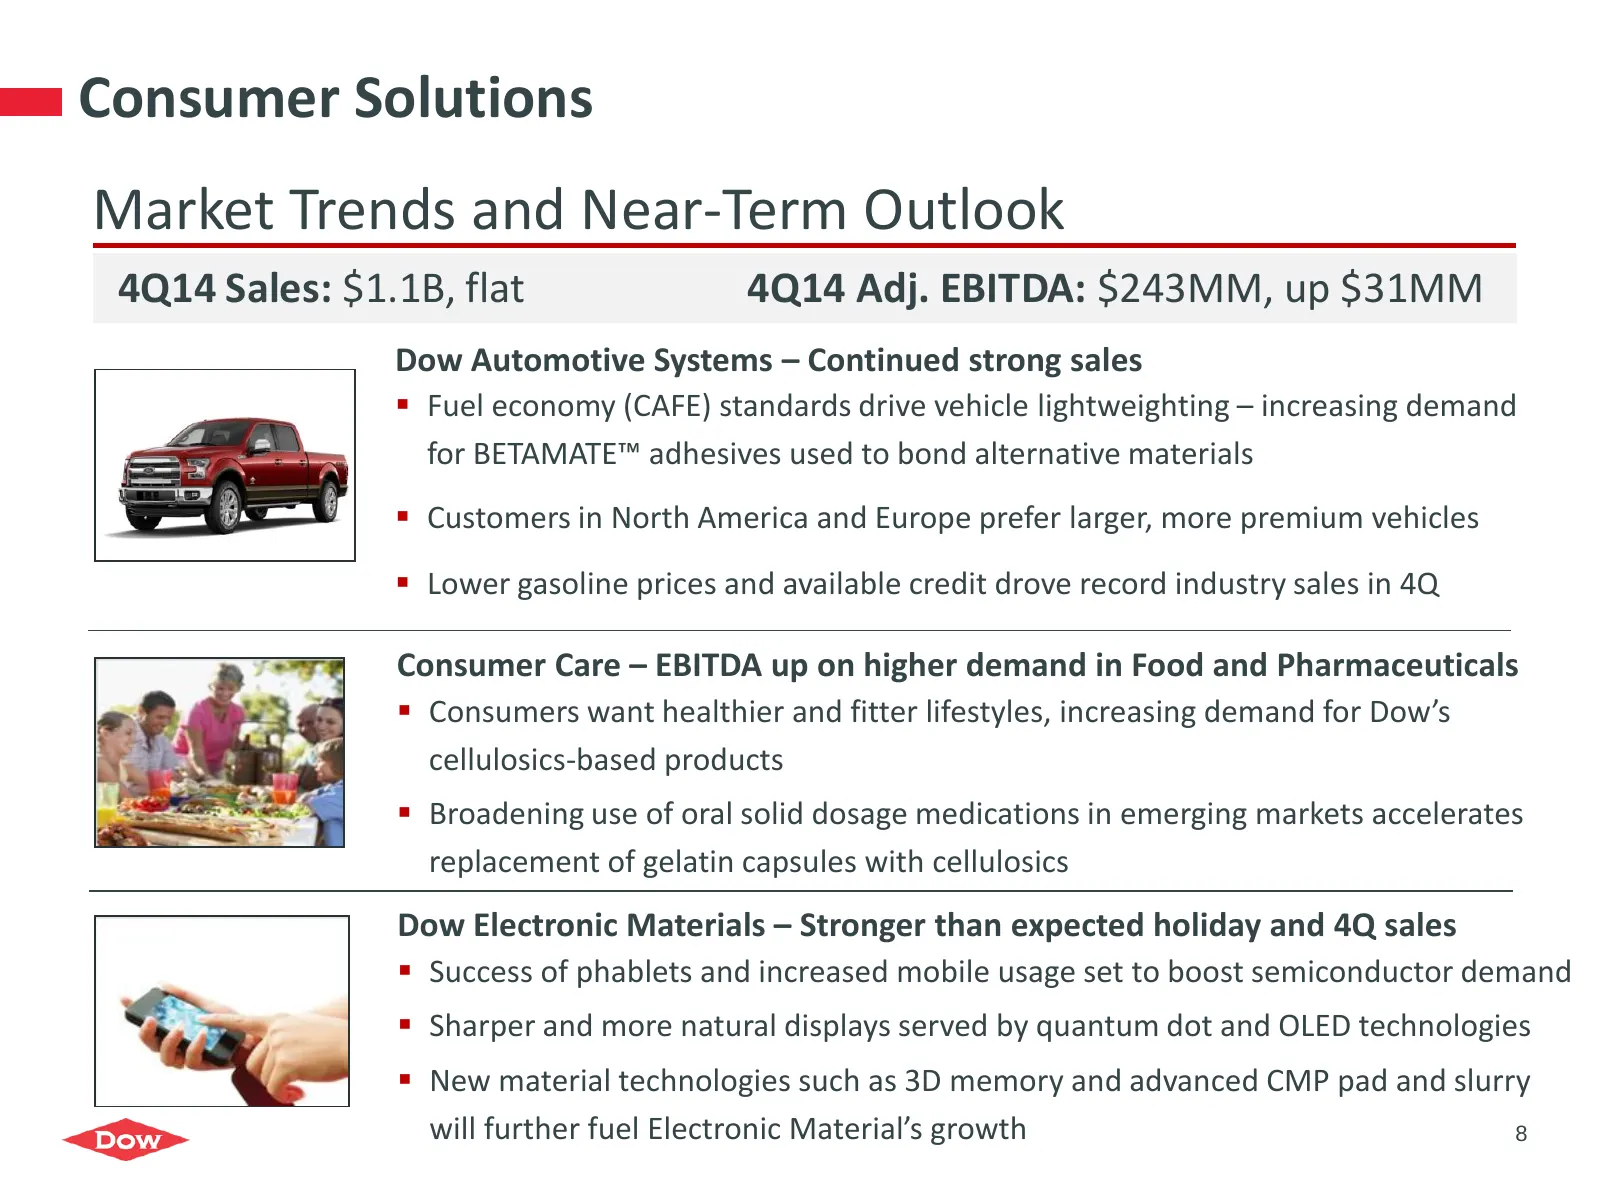
Consumer Solutions Market Trends and Near-Term Outlook 4Q14 Sales: $1.1B, flat 4Q14 Adj. EBITDA: $243MM, up $31MM Dow Automotive Systems – Continued strong sales Fuel economy (CAFE) standards drive vehicle lightweighting – increasing demand for BETAMATE™ adhesives used to bond alternative material
Slide 9: Infrastructure Solutions Market Trends and Near-Term Outlook
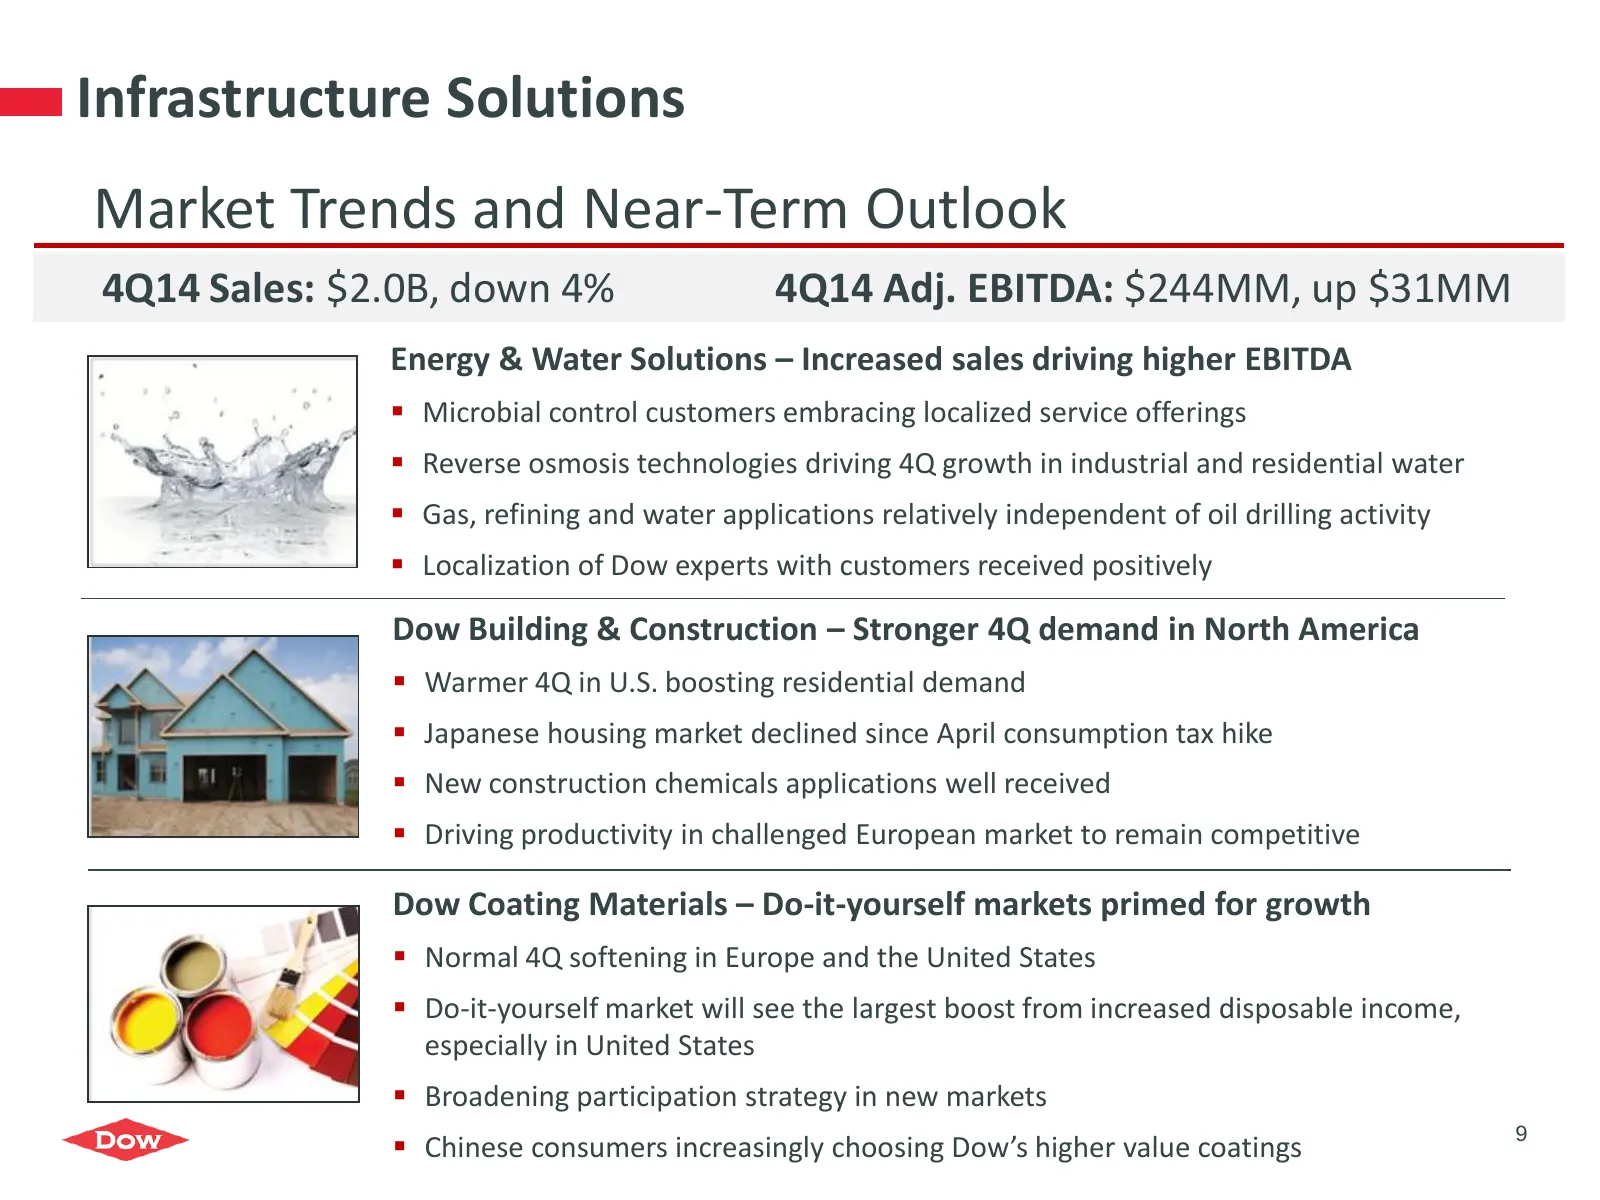
Infrastructure Solutions Market Trends and Near-Term Outlook 4Q14 Sales: $2.0B, down 4% 4Q14 Adj. EBITDA: $244MM, up $31MM Energy & Water Solutions – Increased sales driving higher EBITDA Microbial control customers embracing localized service offerings Reverse osmosis technologies driving 4Q gr
Slide 10: Performance Materials & Chemicals Market Trends and Near-Term Outlook
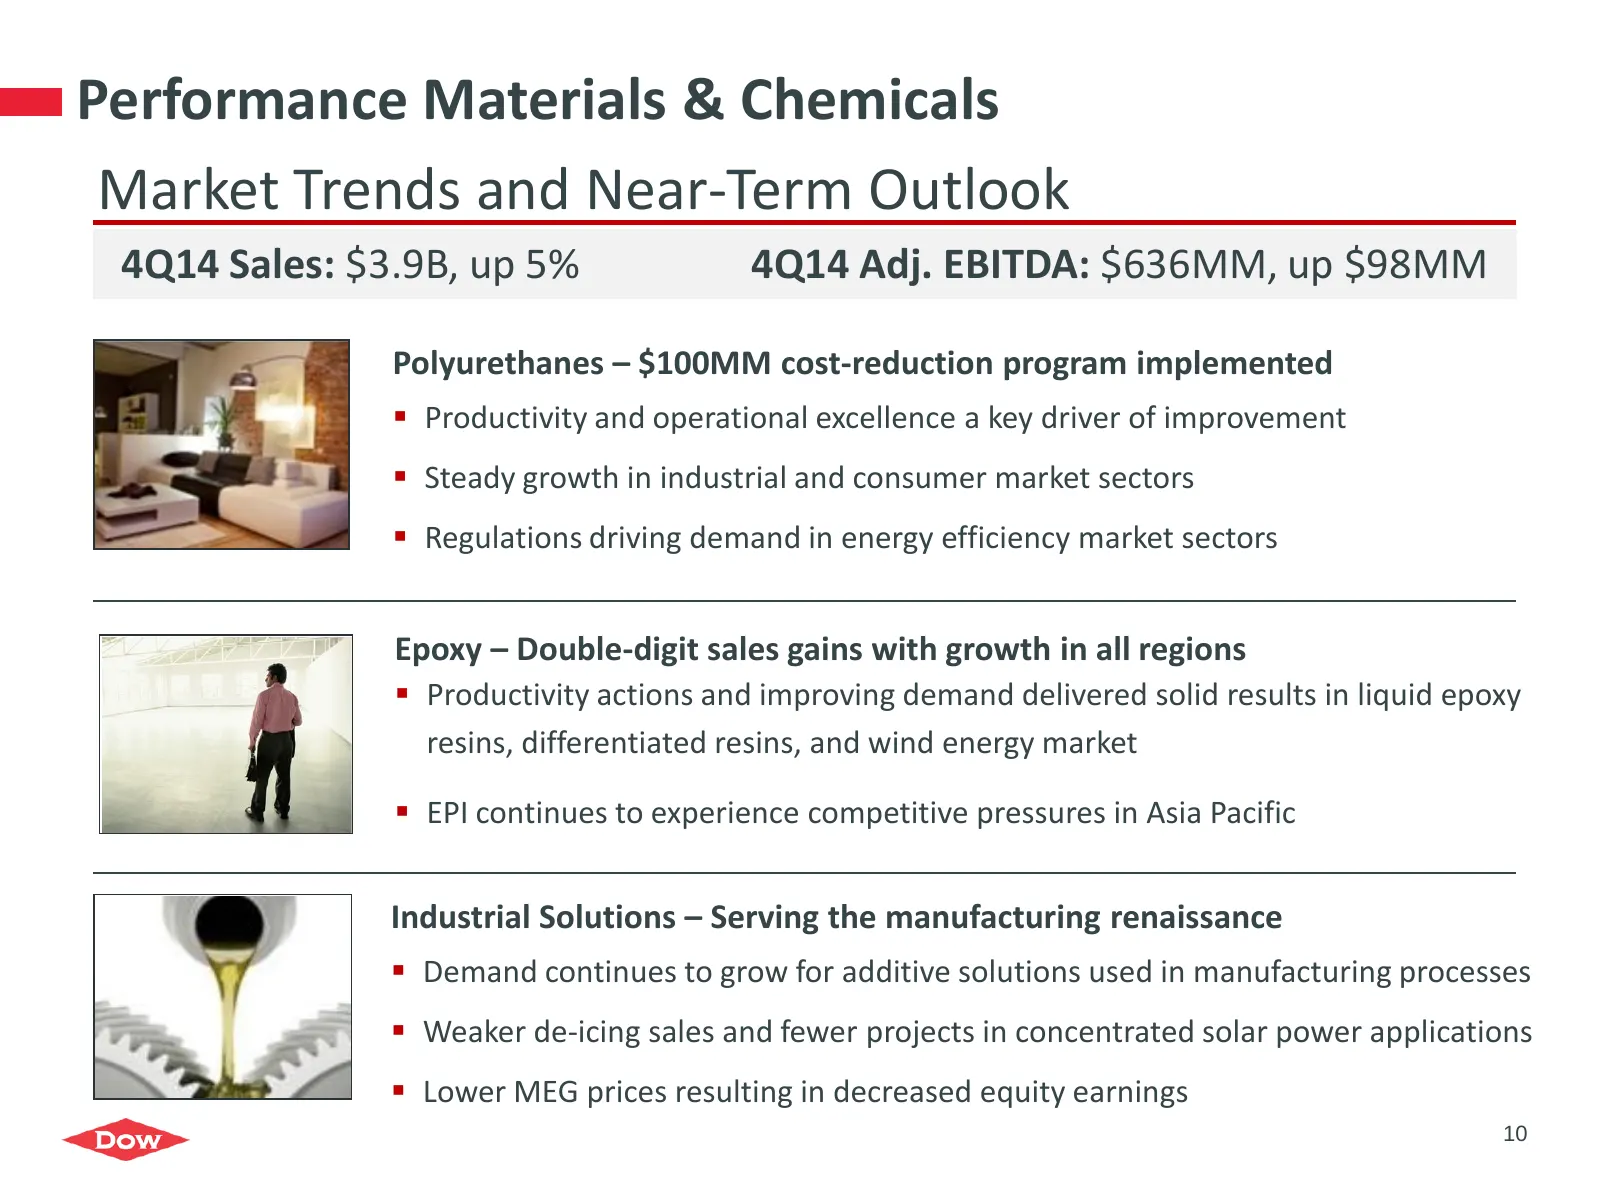
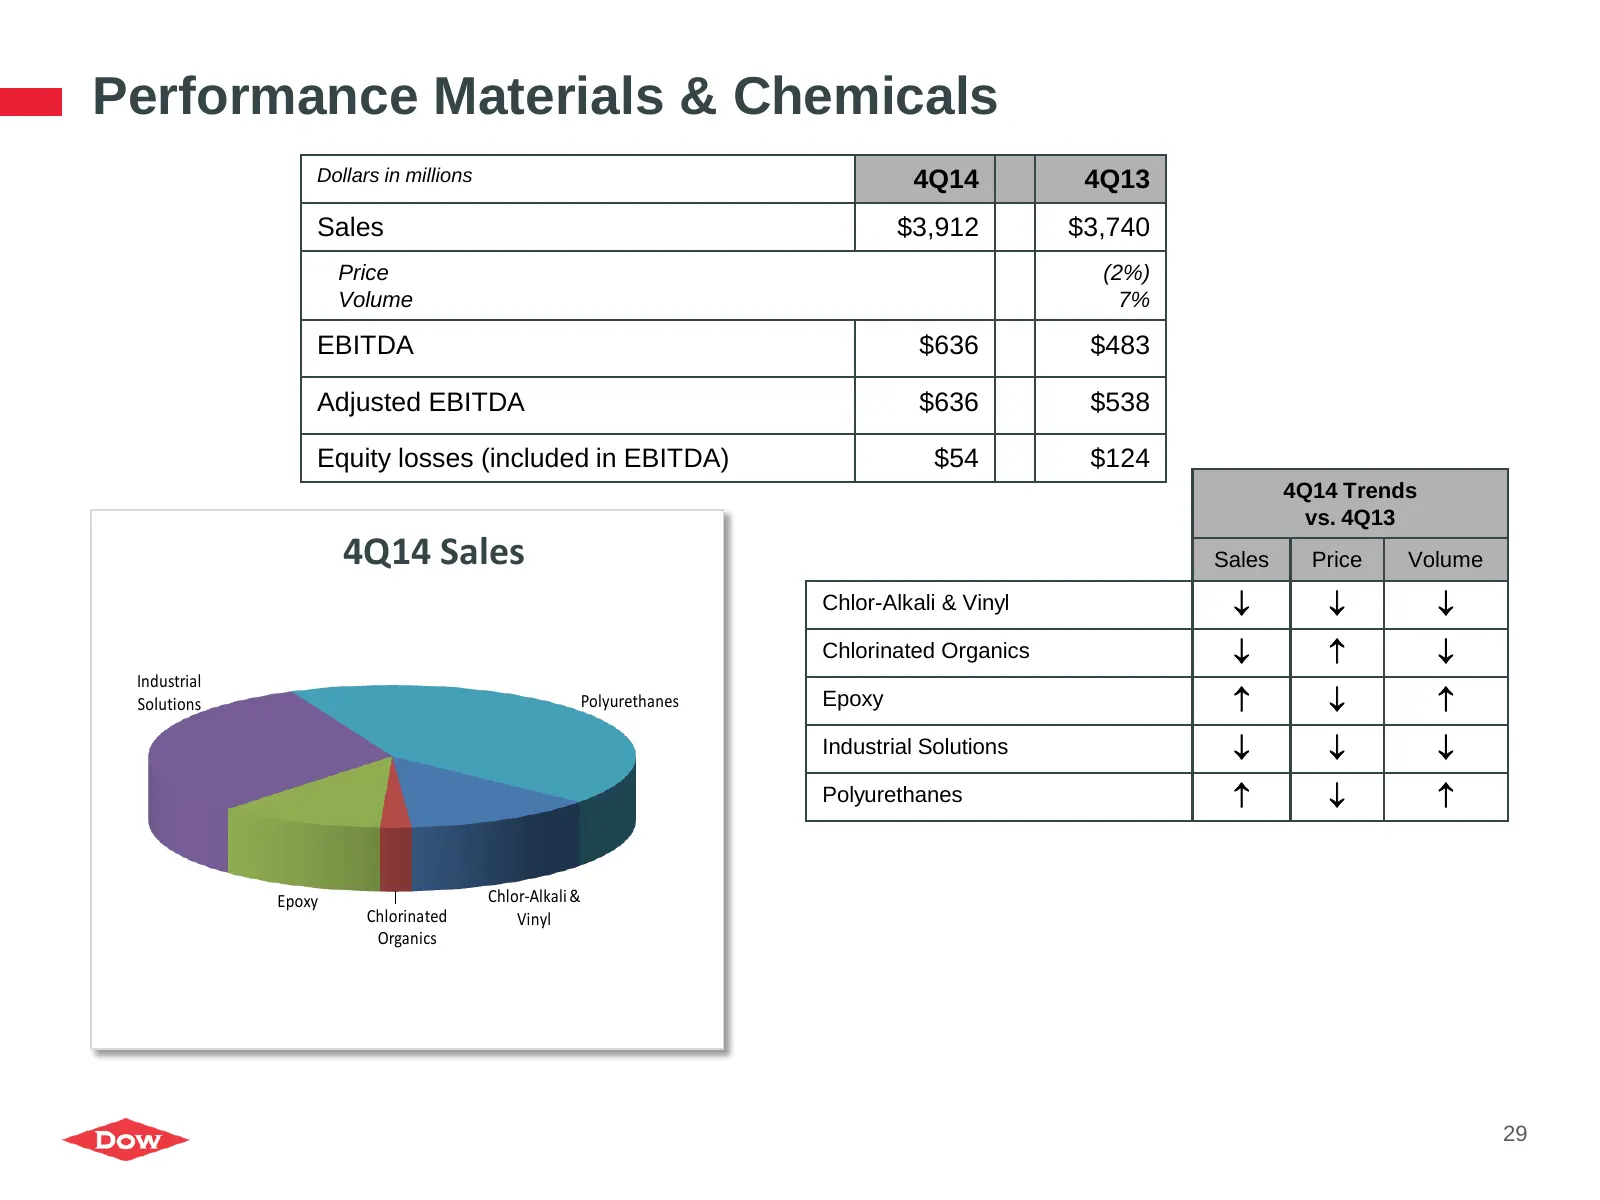
Performance Materials & Chemicals Market Trends and Near-Term Outlook 4Q14 Sales: $3.9B, up 5% 4Q14 Adj. EBITDA: $636MM, up $98MM Polyurethanes – $100MM cost-reduction program implemented Productivity and operational excellence a key driver of improvement Steady growth in industrial and consumer
Slide 11: Performance Plastics Market Trends and Near-Term Outlook
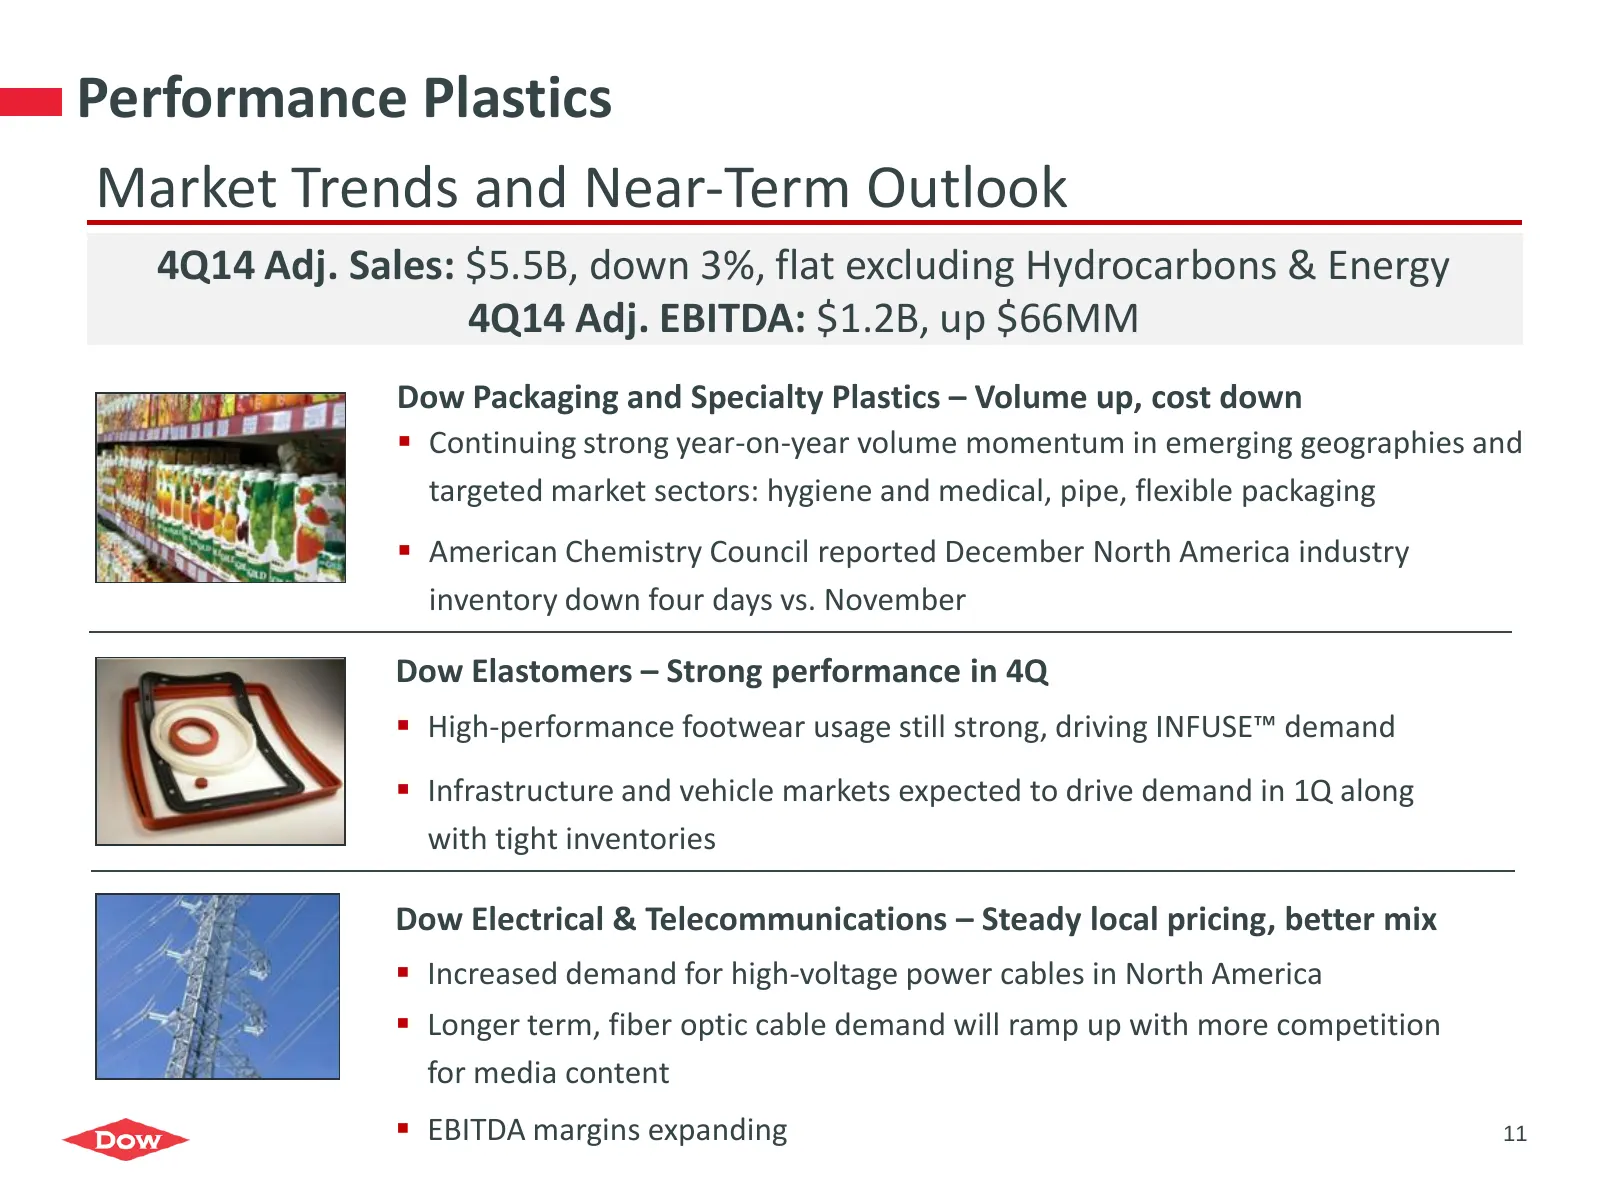
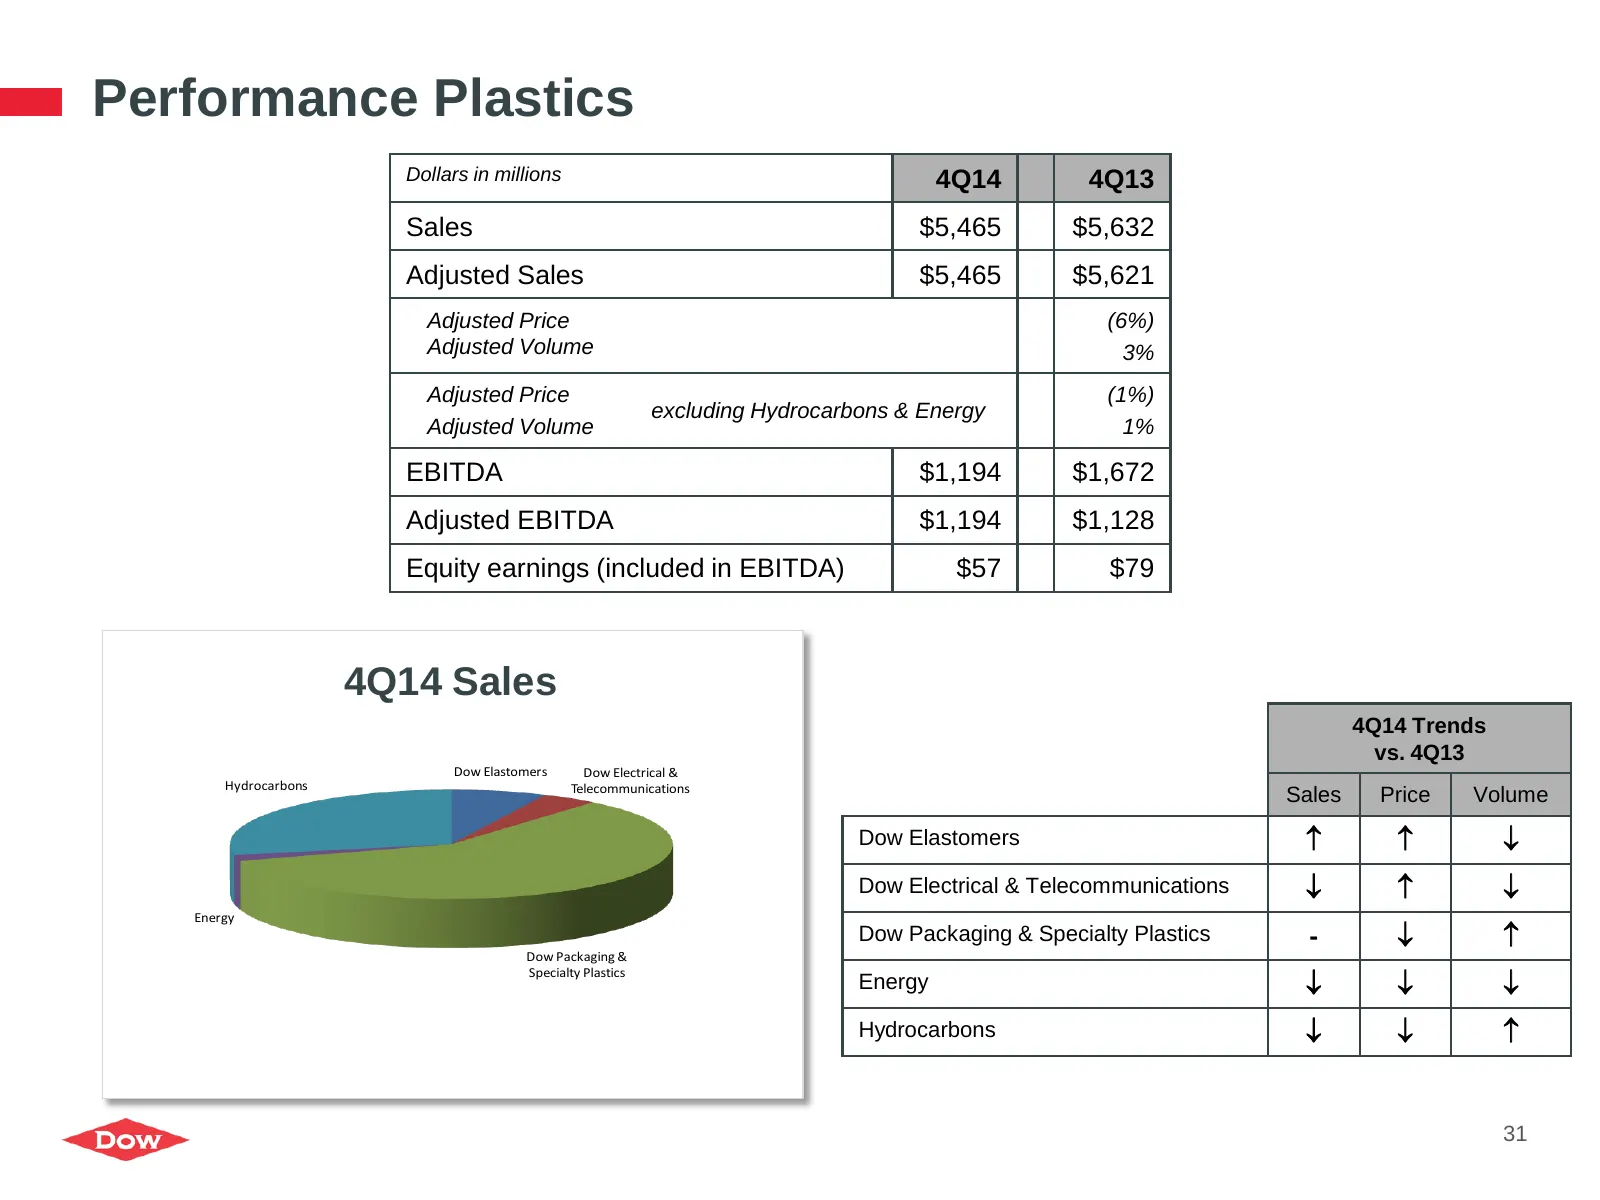
Performance Plastics Market Trends and Near-Term Outlook 4Q14 Adj. Sales: $5.5B, down 3%, flat excluding Hydrocarbons & Energy 4Q14 Adj. EBITDA: $1.2B, up $66MM Dow Packaging and Specialty Plastics – Volume up, cost down Continuing strong year-on-year volume momentum in emerging geographies and ta
Slide 12: Agenda
Agenda 4Q and FY 2014 Overview Segment Highlights Strategic Actions 2015 Priorities 12
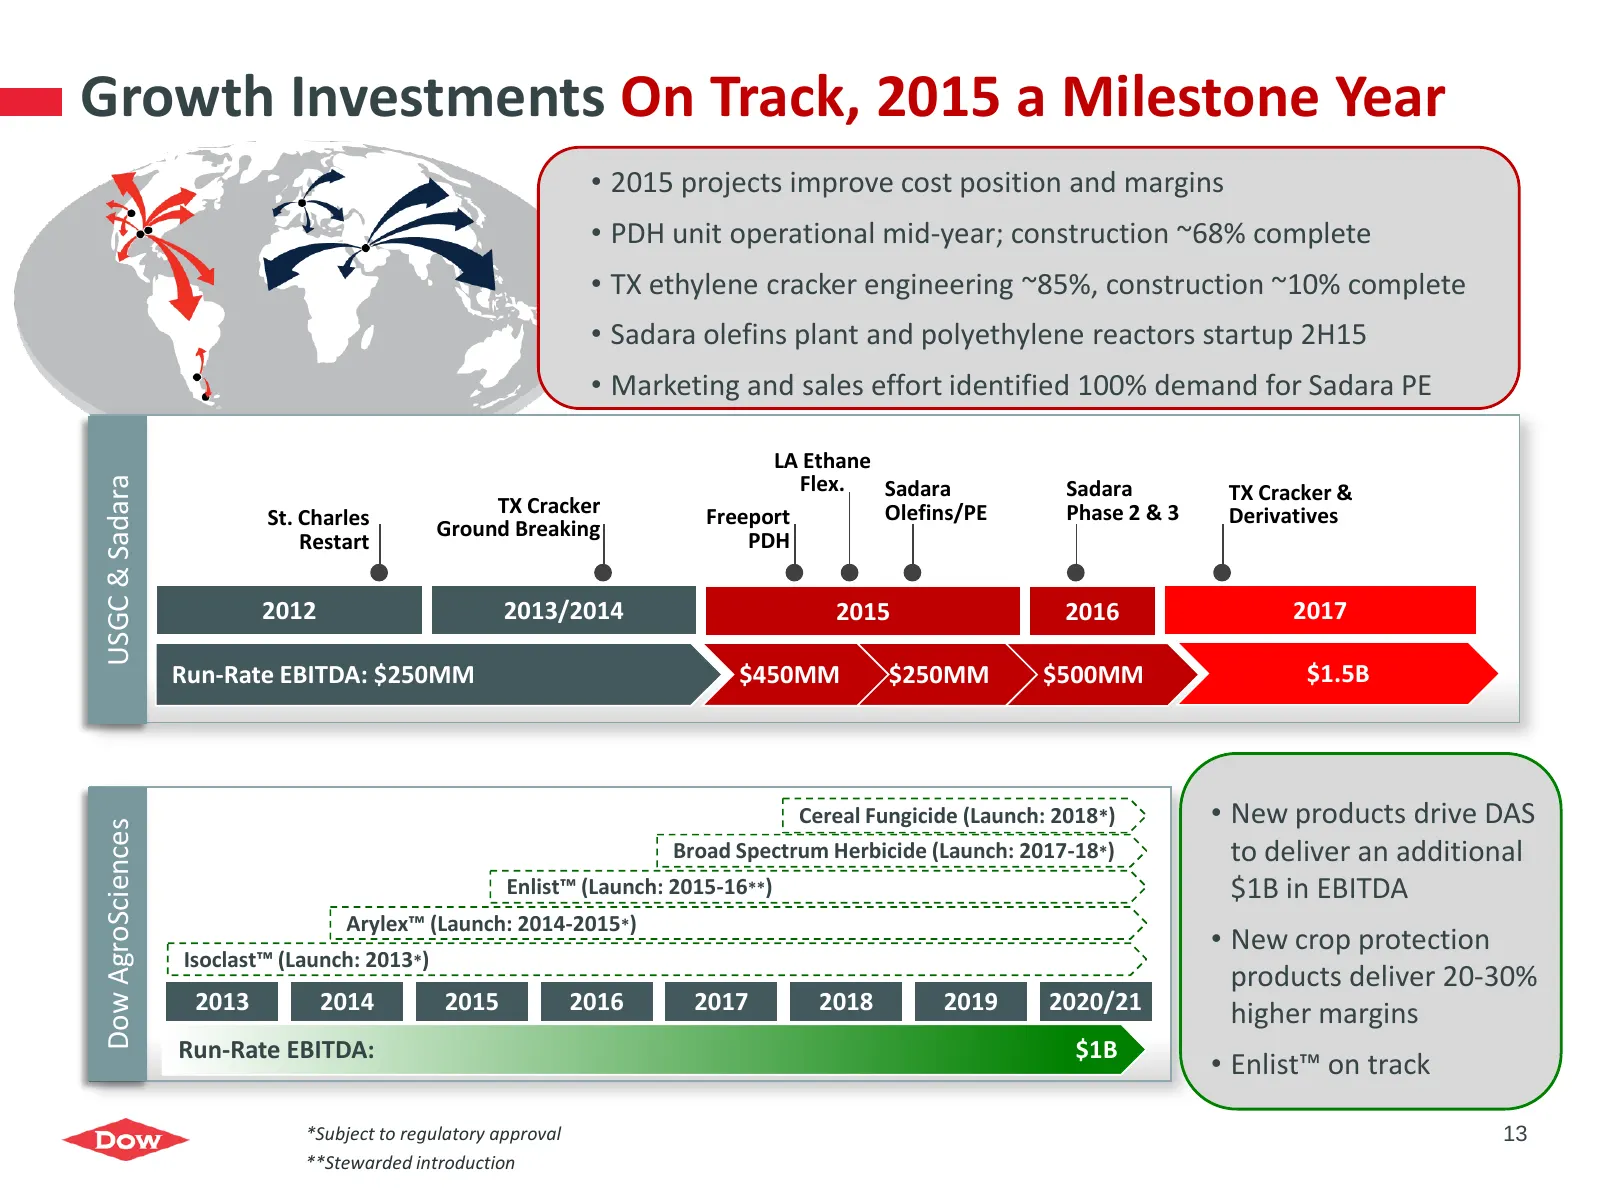
Slide 13: Growth Investments On Track, 2015 a Milestone Year
Growth Investments On Track, 2015 a Milestone Year • 2015 projects improve cost position and margins • PDH unit operational mid-year; construction ~68% complete • TX ethylene cracker engineering ~85%, construction ~10% complete • Sadara olefins plant and polyethylene reactors startup 2H15 • Marketin
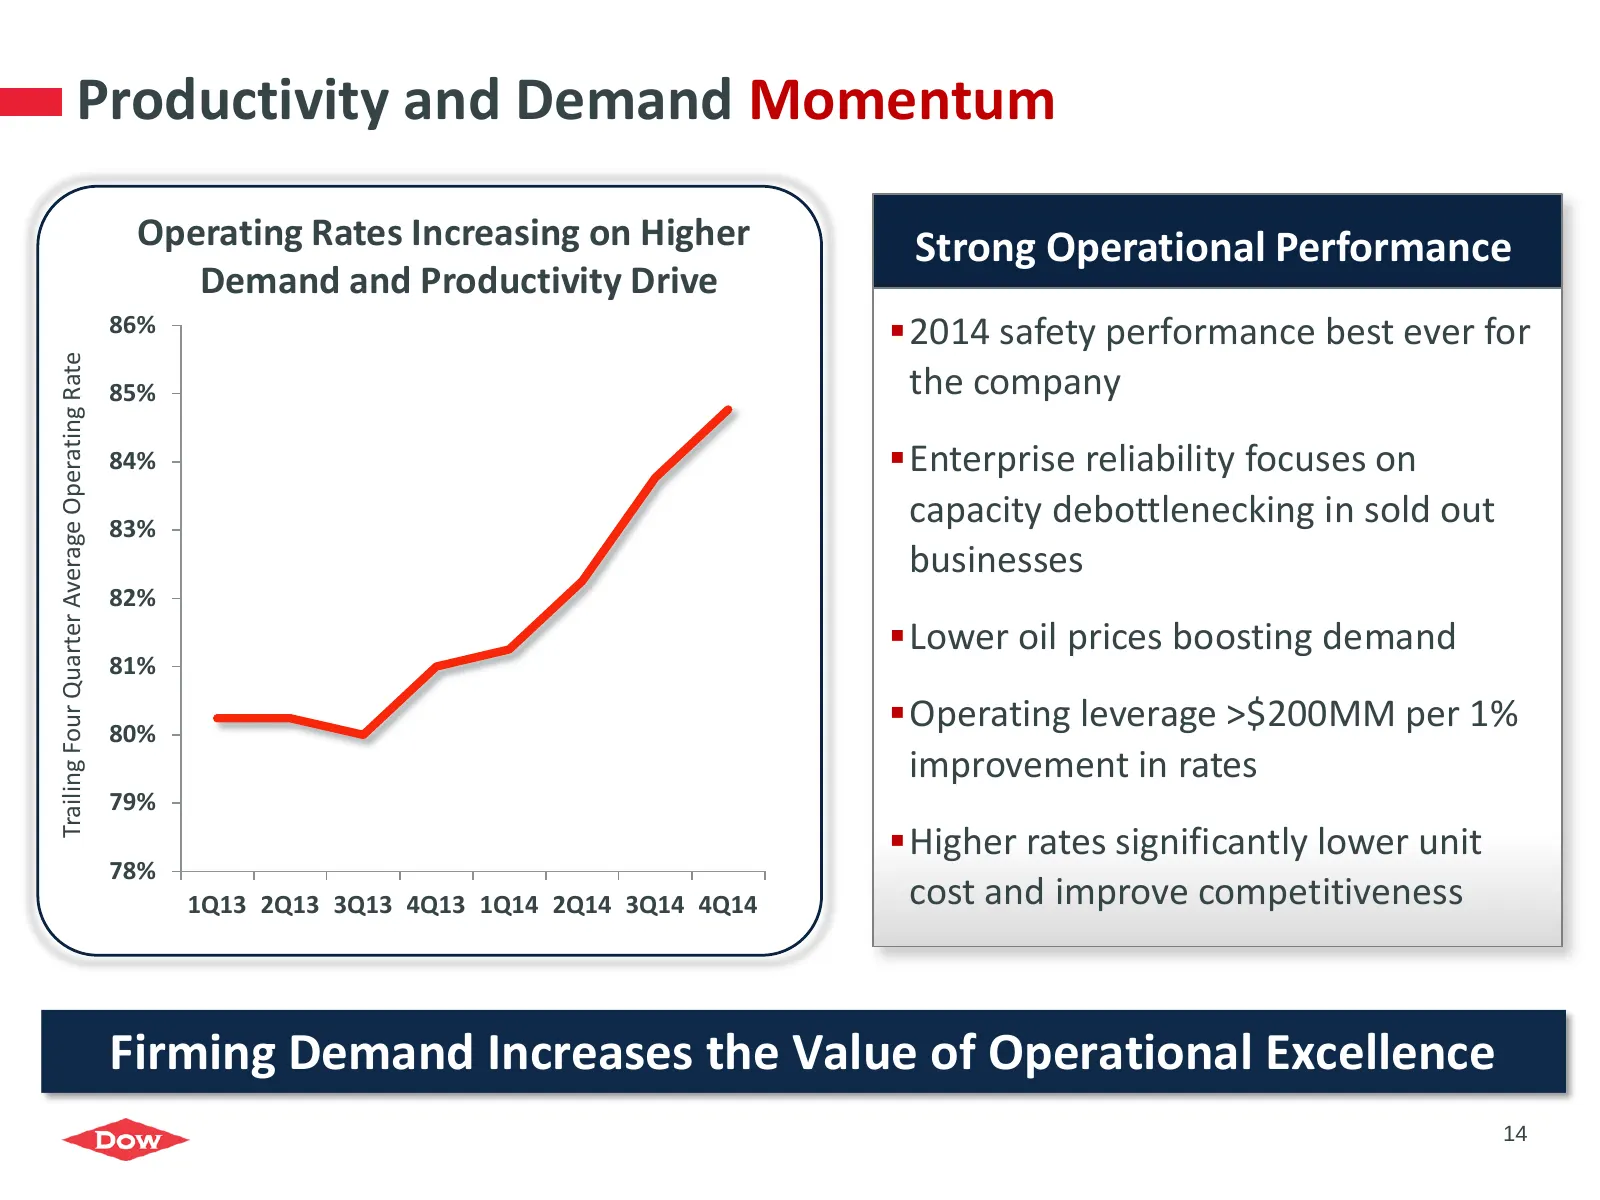
Slide 14: Productivity and Demand Momentum
Productivity and Demand Momentum Operating Rates Increasing on Higher Strong Operational Performance Demand and Productivity Drive 86% 2014 safety performance best ever for Trailing Four Quarter Average Operating Rate 85% the company 84% Enterprise reliability focuses on 83% capacity debottlenec
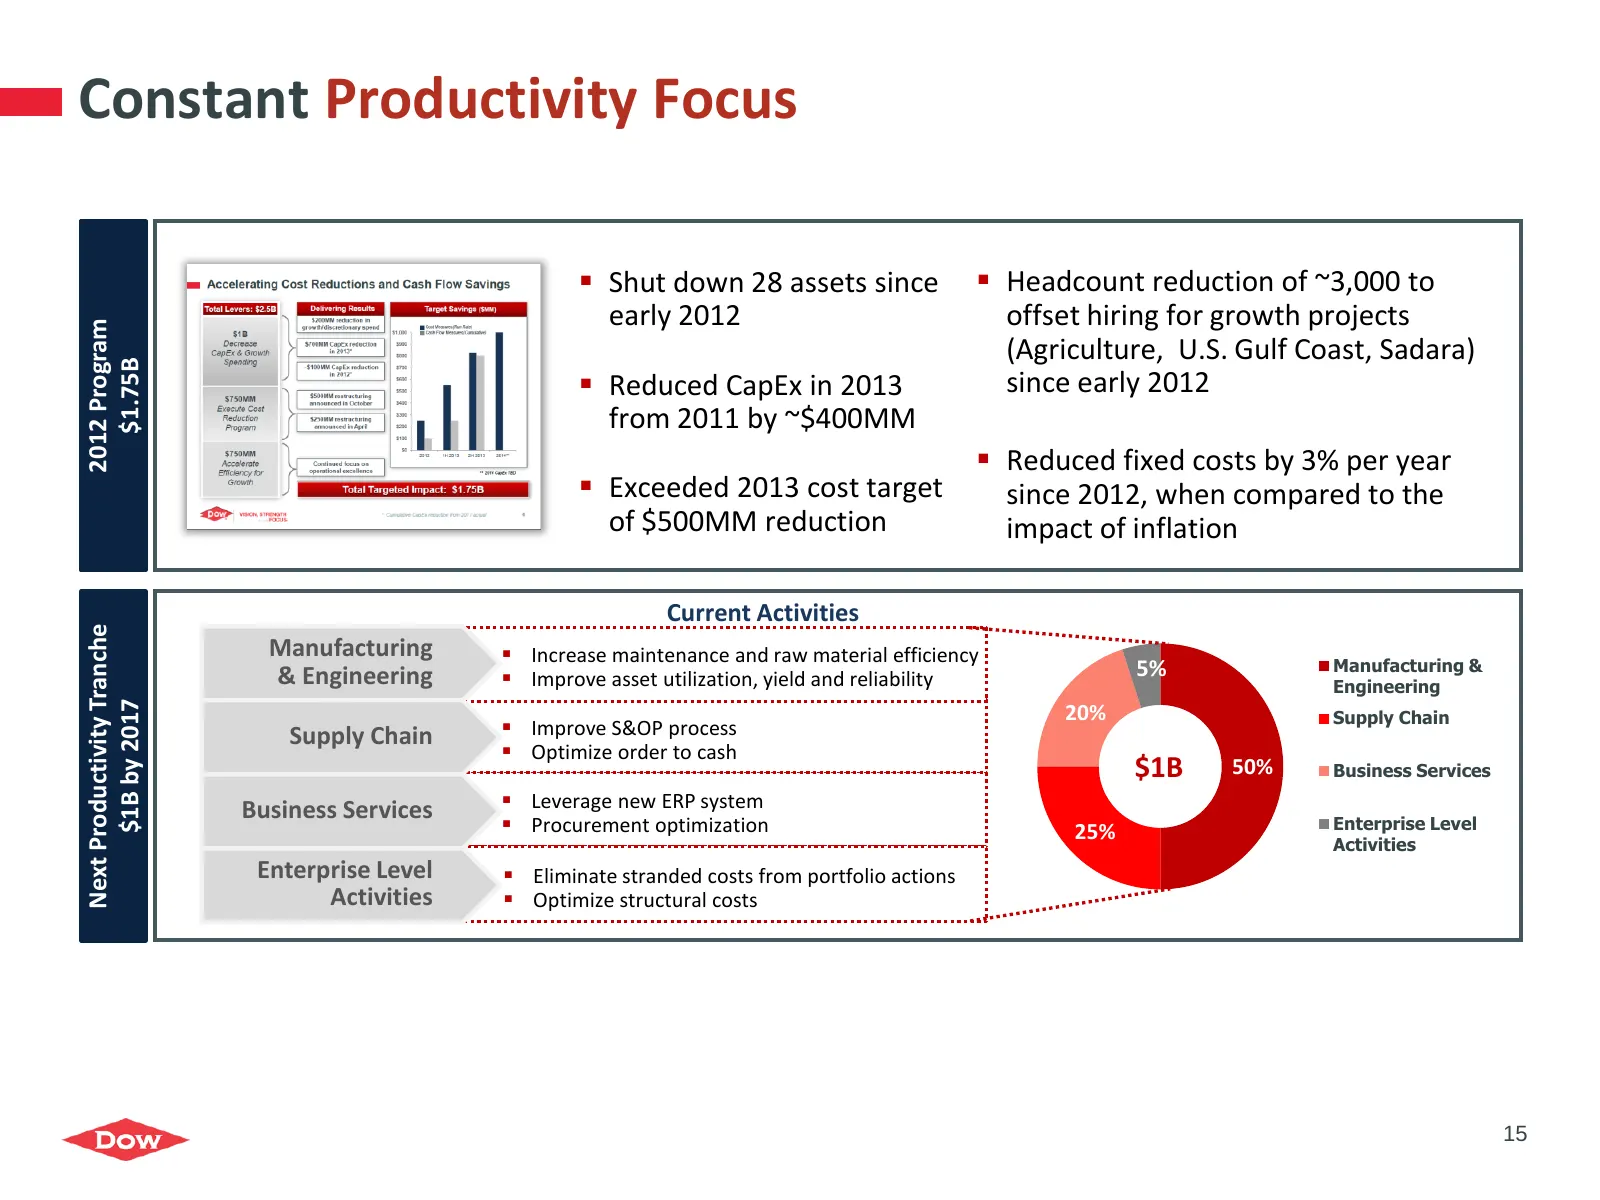
Slide 15: Constant Productivity Focus
Constant Productivity Focus Shut down 28 assets since Headcount reduction of ~3,000 to early 2012 offset hiring for growth projects 2012 Program (Agriculture, U.S. Gulf Coast, Sadara) $1.75B Reduced CapEx in 2013 since early 2012 from 2011 by ~$400MM Reduced fixed costs by 3% per year Exce
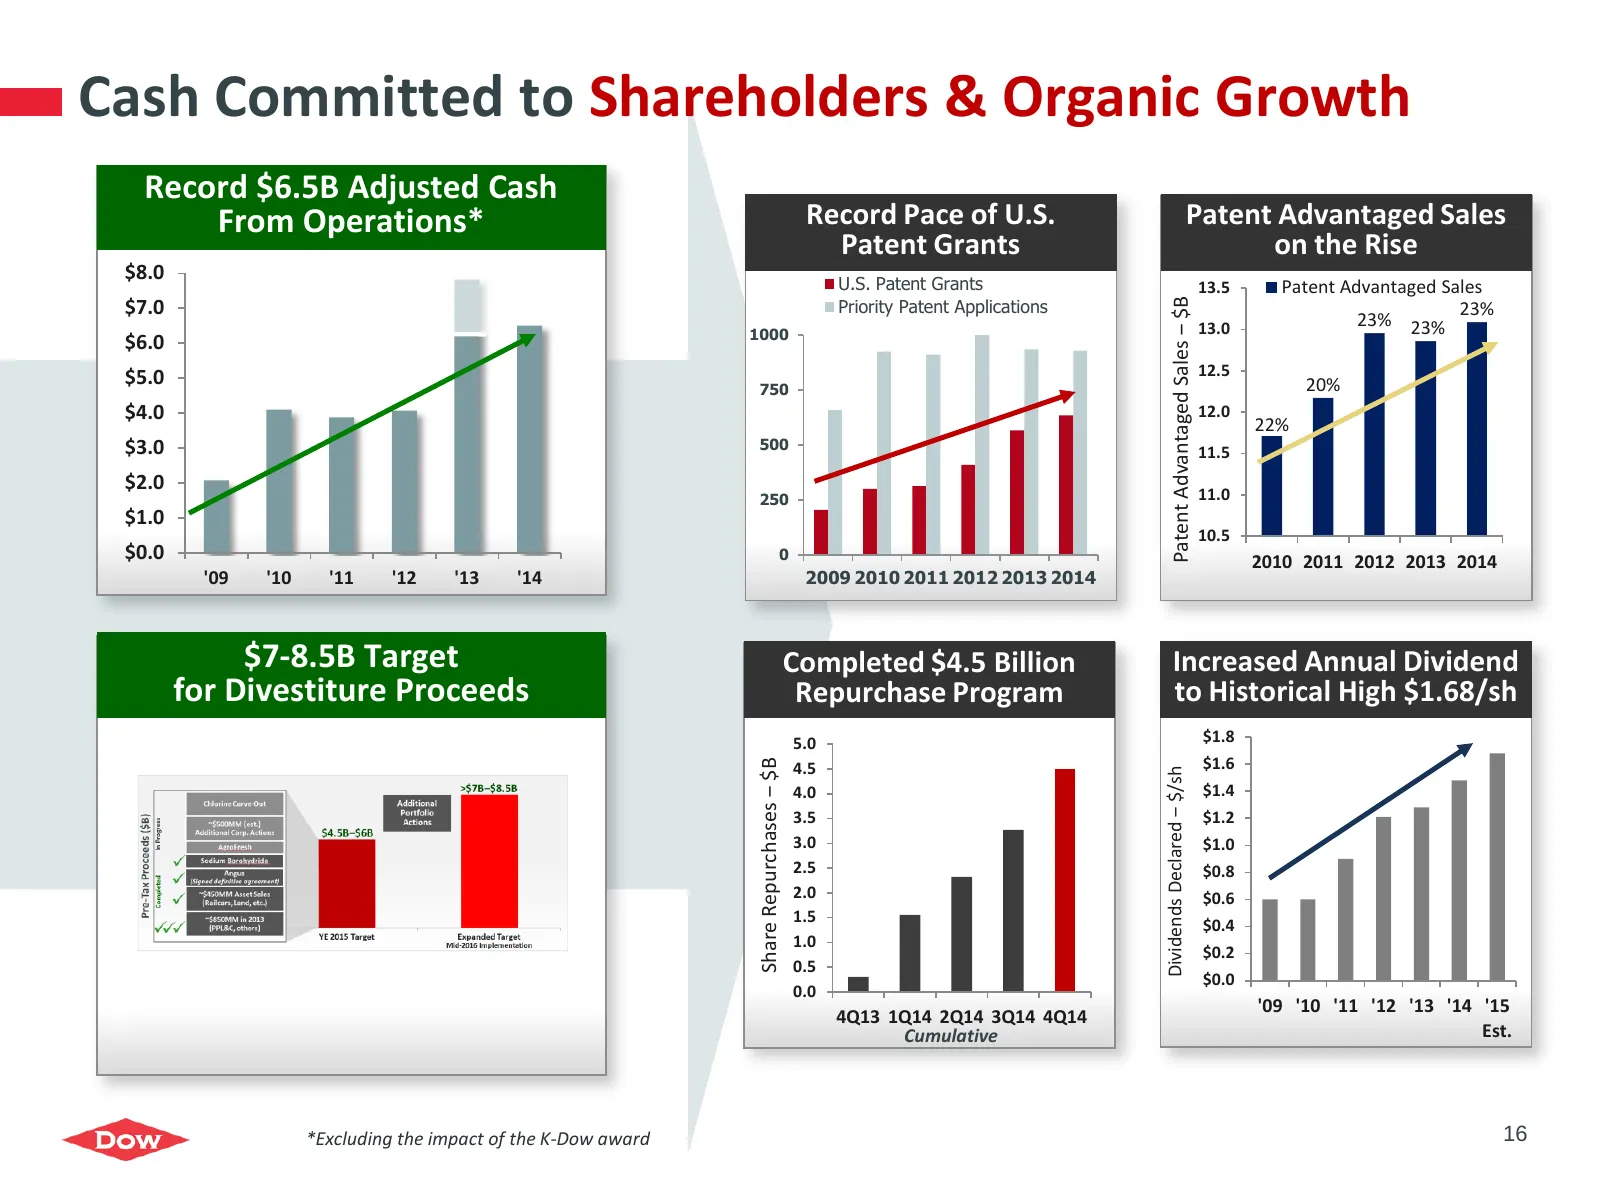
Slide 16: Cash Committed to Shareholders & Organic Growth
Cash Committed to Shareholders & Organic Growth Record $6.5B Adjusted Cash From Operations* Record Pace of U.S. Patent Advantaged Sales Patent Grants on the Rise $8.0 U.S. Patent Grants 13.5 Patent Advantaged Sales Priority Patent Applications Patent Advantaged Sales ‒ $B $7.0 23% 13.0 23% 23% 1000
Slide 17: Modeling Guidance – 1Q15
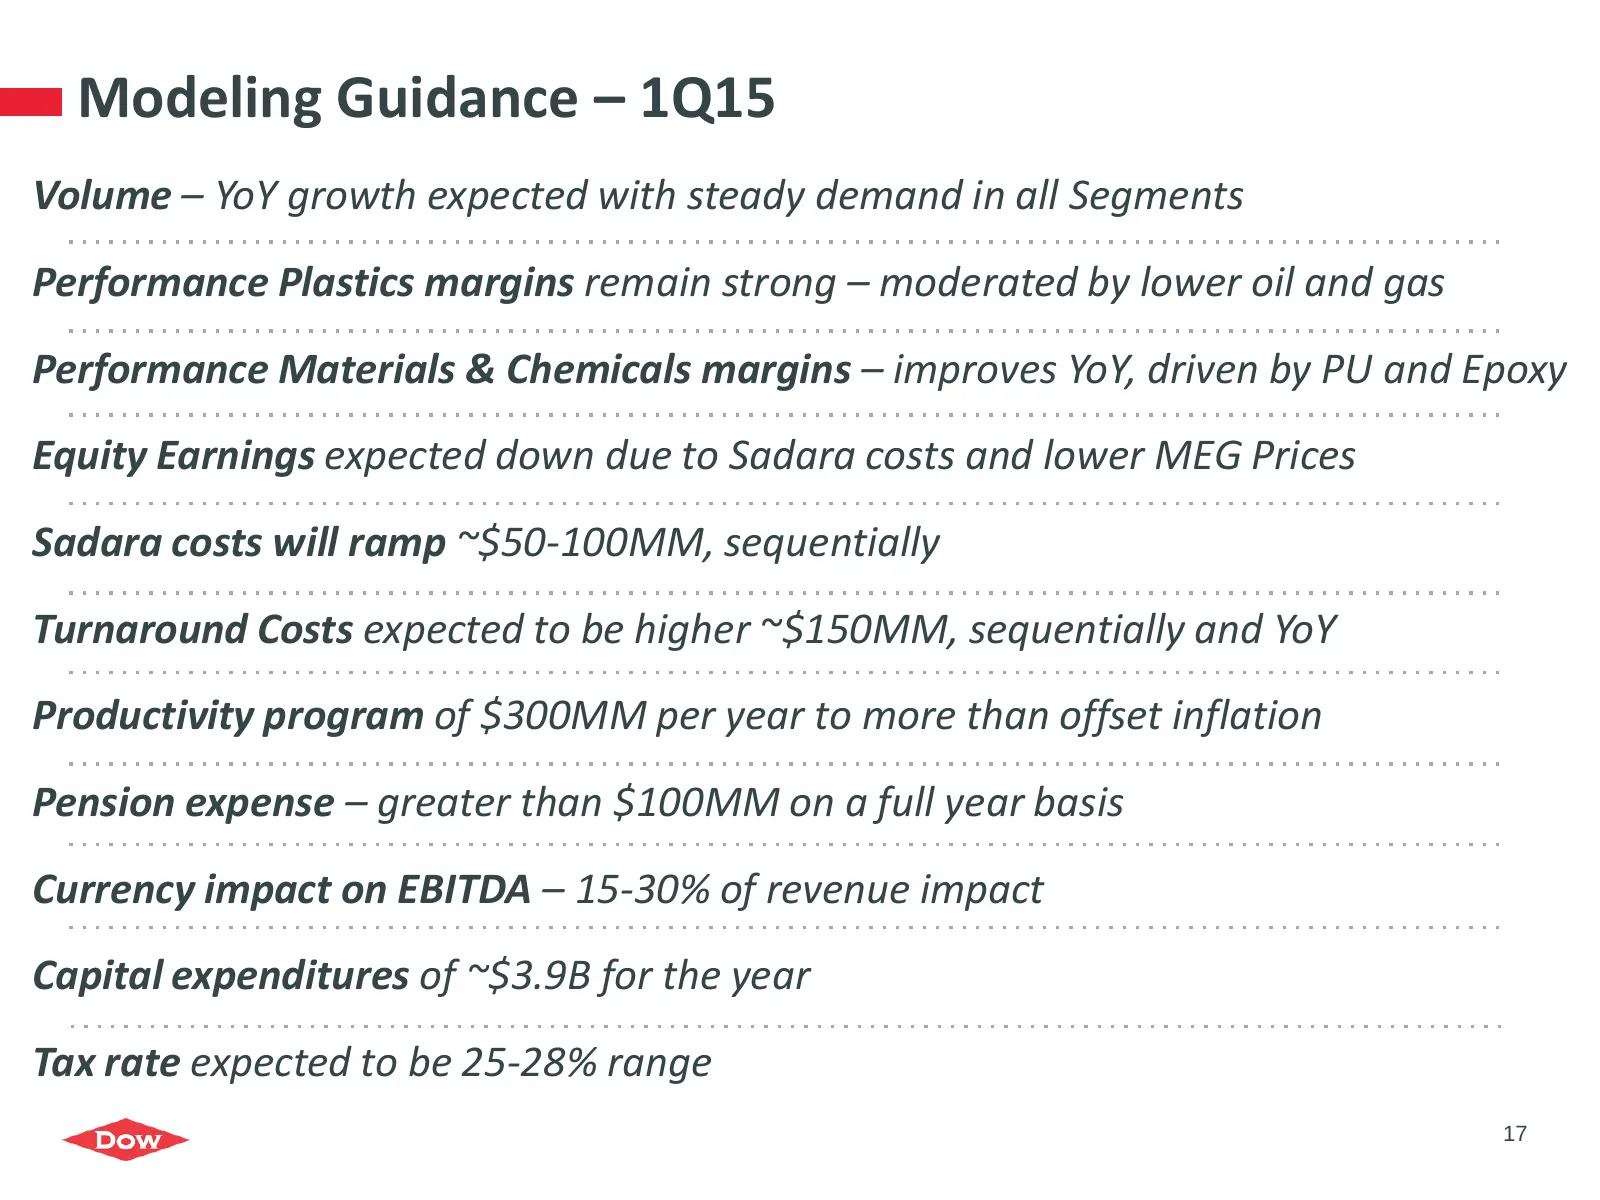
Modeling Guidance – 1Q15 Volume – YoY growth expected with steady demand in all Segments Performance Plastics margins remain strong – moderated by lower oil and gas Performance Materials & Chemicals margins – improves YoY, driven by PU and Epoxy Equity Earnings expected down due to Sadara costs and
Slide 18: Agenda
Agenda 4Q and FY 2014 Overview Segment Highlights Strategic Actions 2015 Priorities 18
Slide 19: Dow Vision 2020
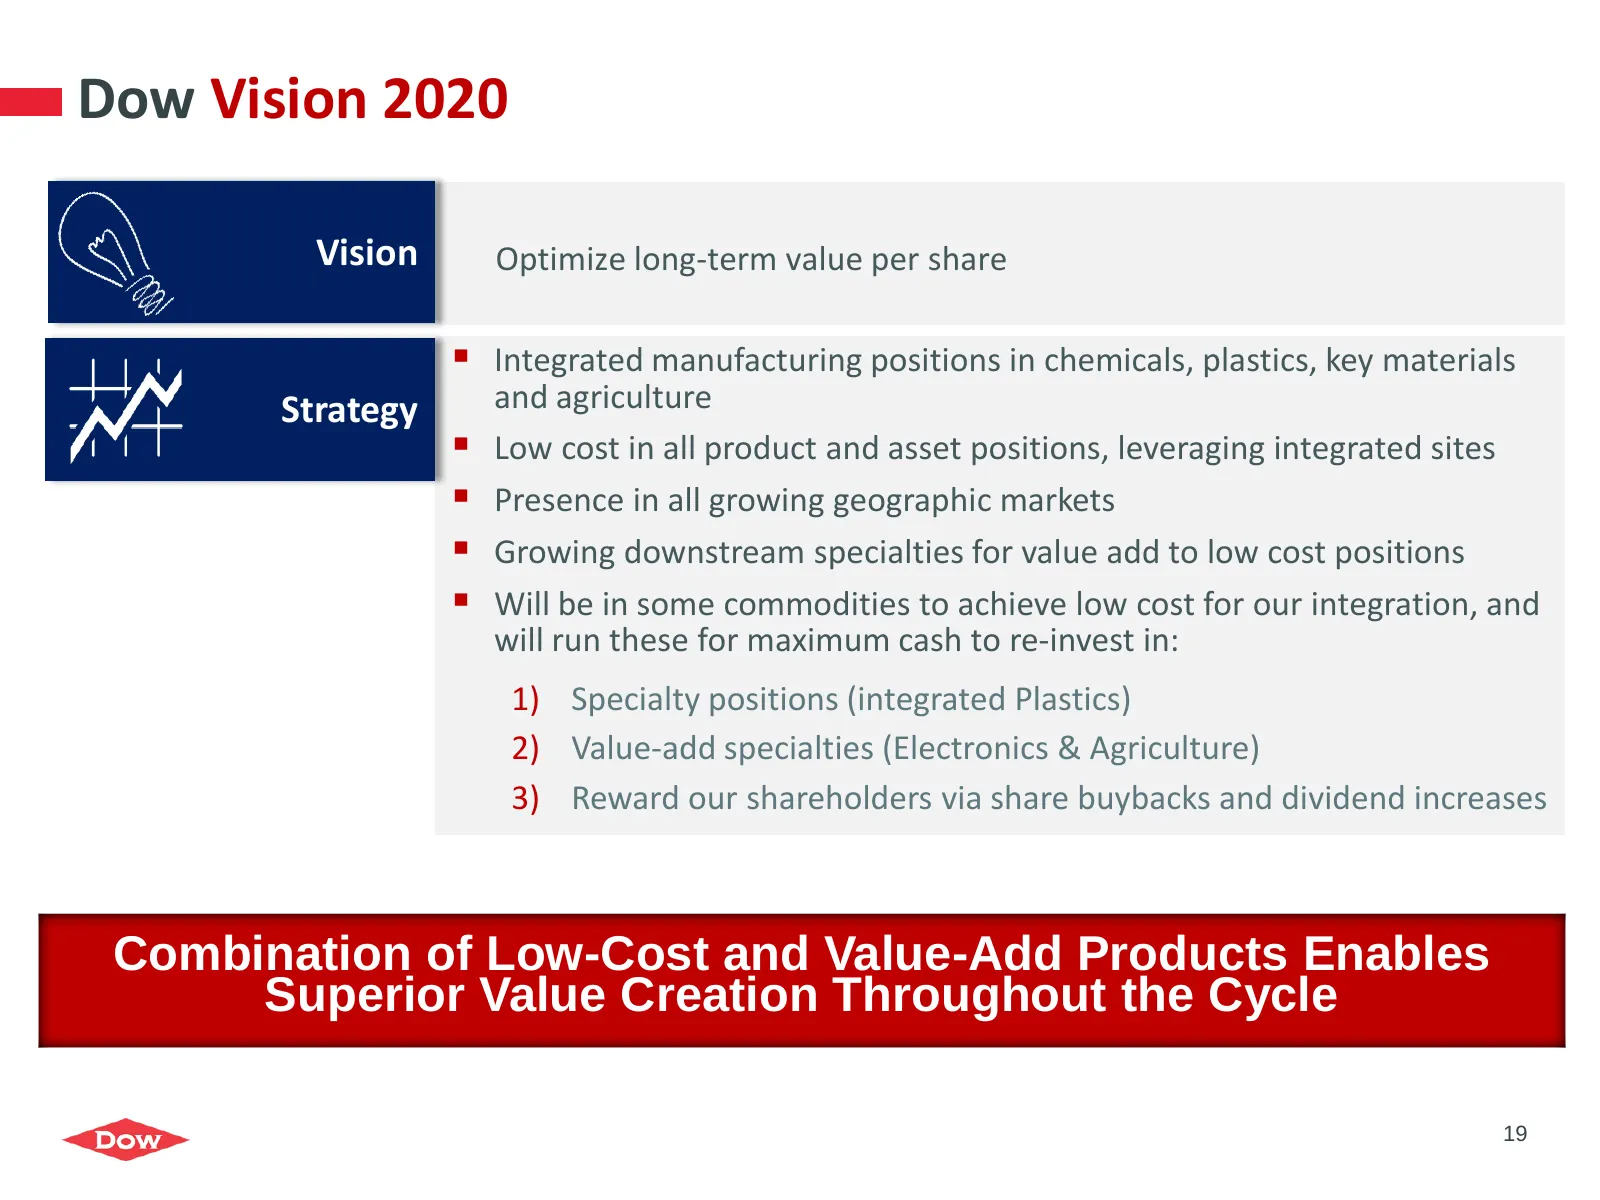
Dow Vision 2020 Vision Optimize long-term value per share Integrated manufacturing positions in chemicals, plastics, key materials Strategy and agriculture Low cost in all product and asset positions, leveraging integrated sites Presence in all growing geographic markets Growing downstream s
Slide 20: 2014 Achievement Highlights
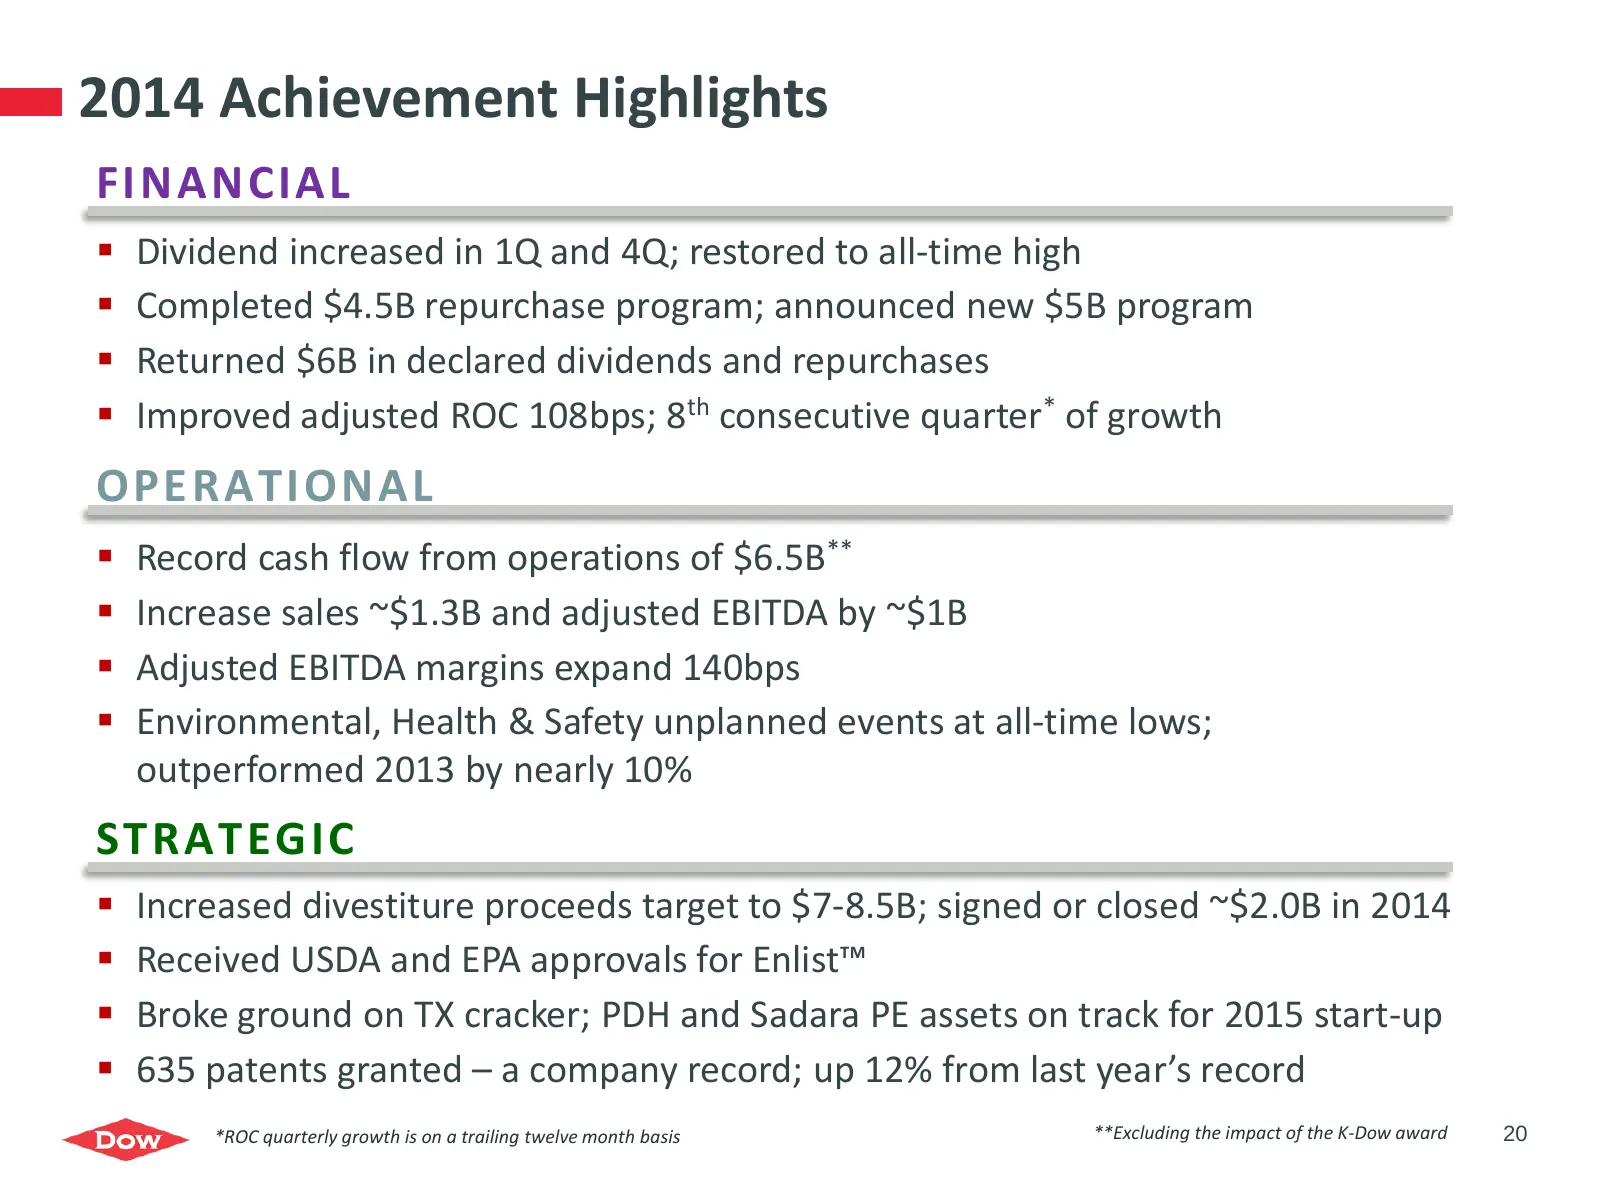
2014 Achievement Highlights FINANCIAL Dividend increased in 1Q and 4Q; restored to all-time high Completed $4.5B repurchase program; announced new $5B program Returned $6B in declared dividends and repurchases Improved adjusted ROC 108bps; 8th consecutive quarter* of growth OPERATIONAL Rec
Slide 21: Dow Priorities for 2015
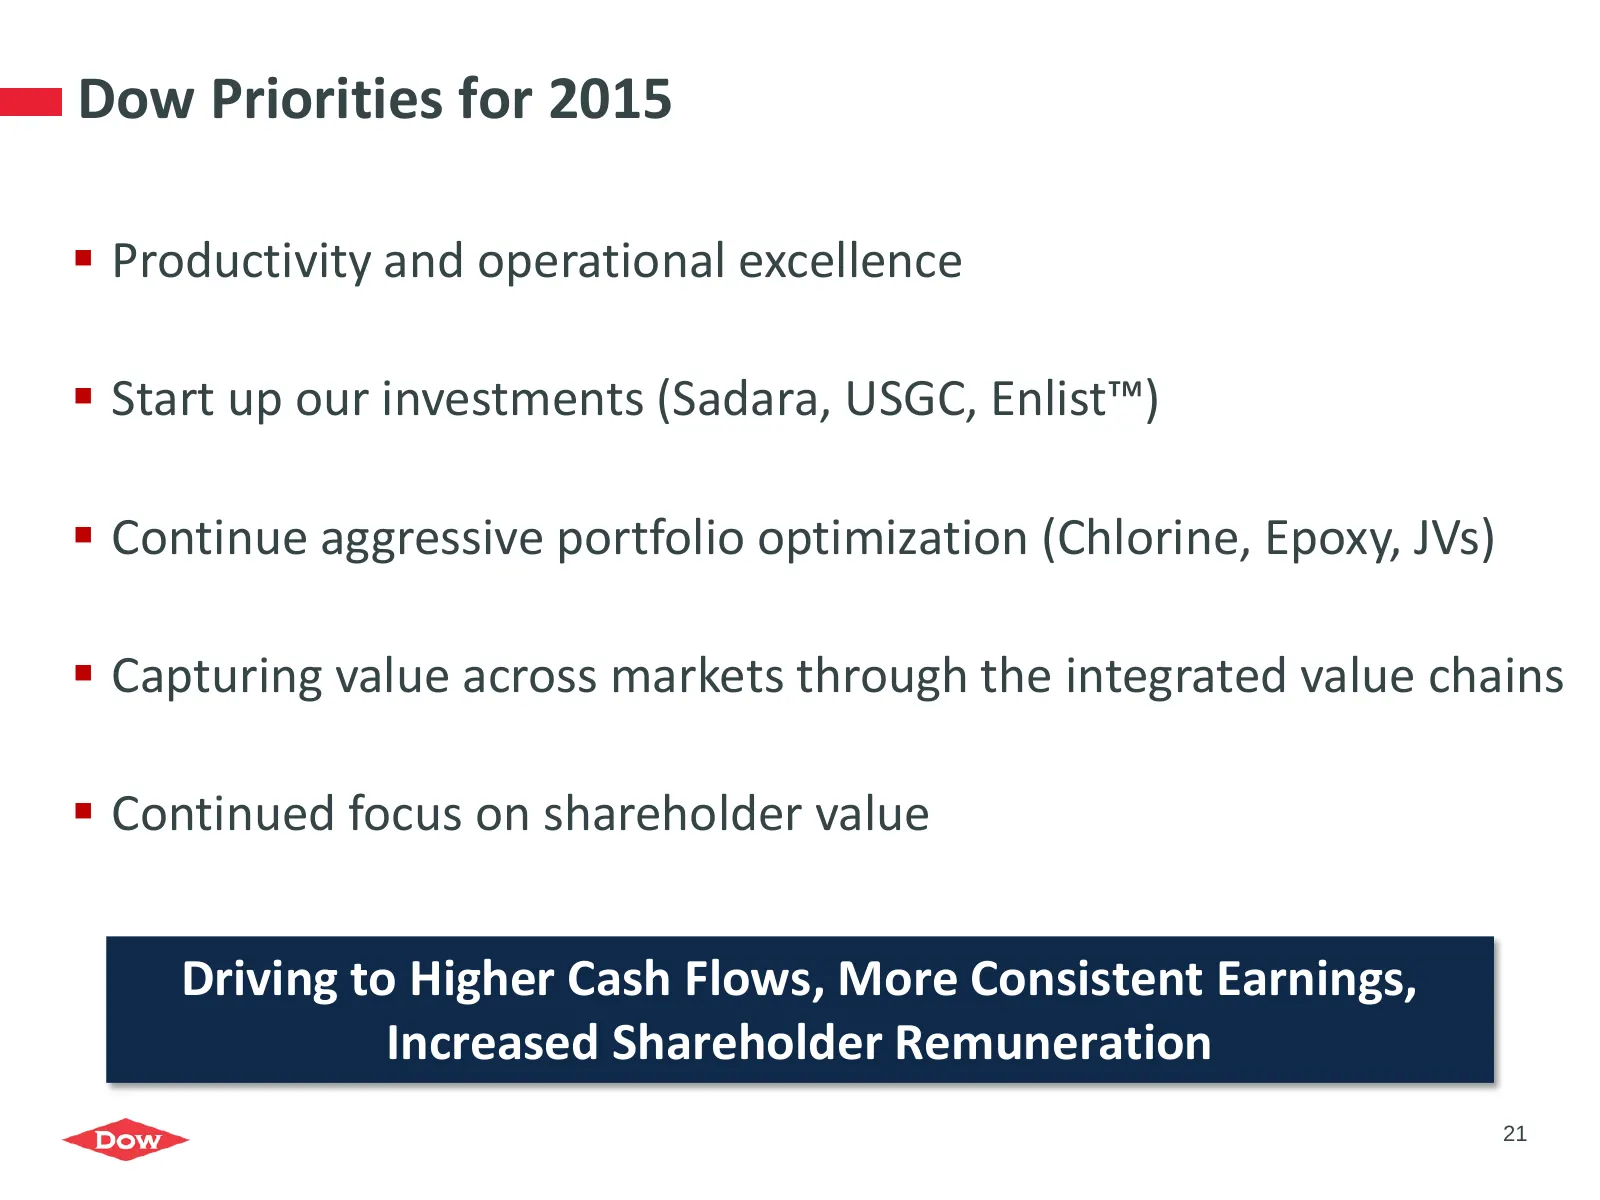
Dow Priorities for 2015 Productivity and operational excellence Start up our investments (Sadara, USGC, Enlist™) Continue aggressive portfolio optimization (Chlorine, Epoxy, JVs) Capturing value across markets through the integrated value chains Continued focus on shareholder value Driving
Slide 22
Slide 23: Agricultural Sciences 4Q14 Sales
Agricultural Sciences Dollars in millions 4Q14 4Q13 Sales $1,856 $1,774 Price (4%) Volume 9% EBITDA $222 $159 Equity earnings (losses) (included in EBITDA) $1 ($2) 4Q14 Sales Seeds 4Q14 Trends vs. 4Q13 Sales Price Volume Crop Protection Seeds Crop Protection 23
Slide 24: Agricultural Sciences 2014 Sales
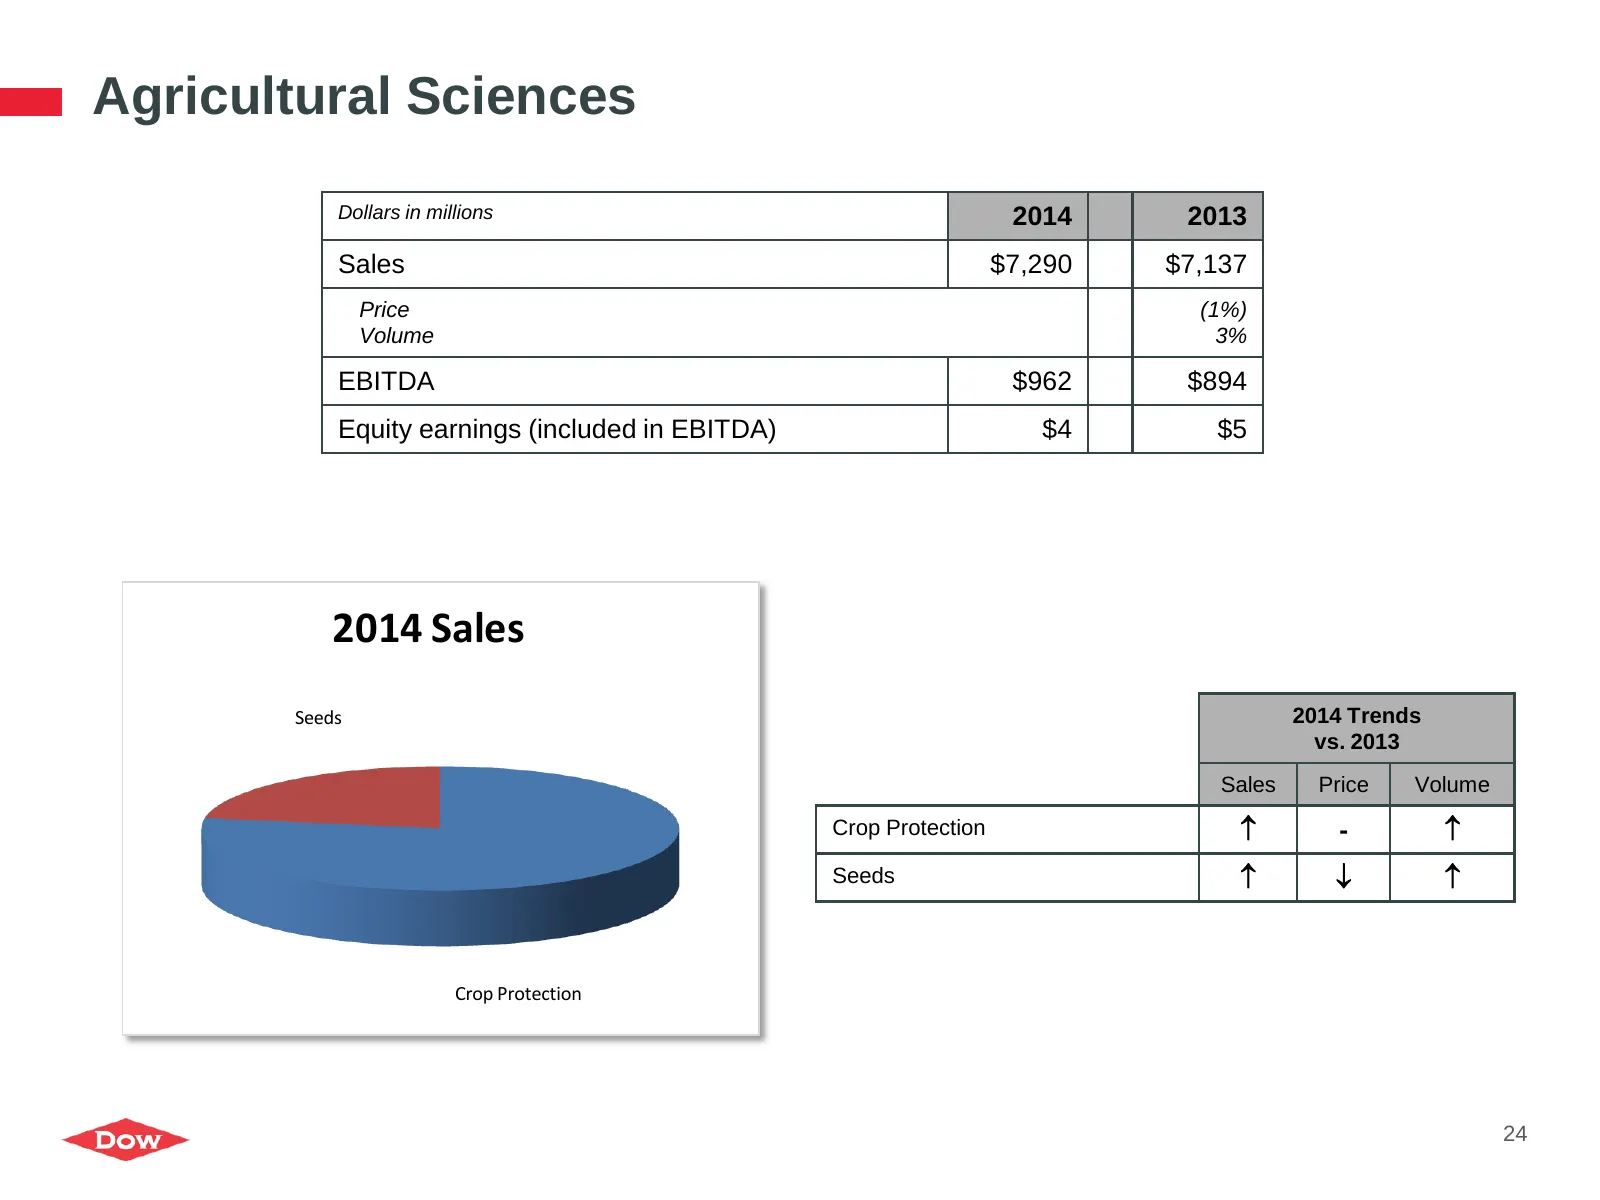
Agricultural Sciences Dollars in millions 2014 2013 Sales $7,290 $7,137 Price (1%) Volume 3% EBITDA $962 $894 Equity earnings (included in EBITDA) $4 $5 2014 Sales Seeds 2014 Trends vs. 2013 Sales Price Volume Crop Protection - Seeds Crop Protection 24
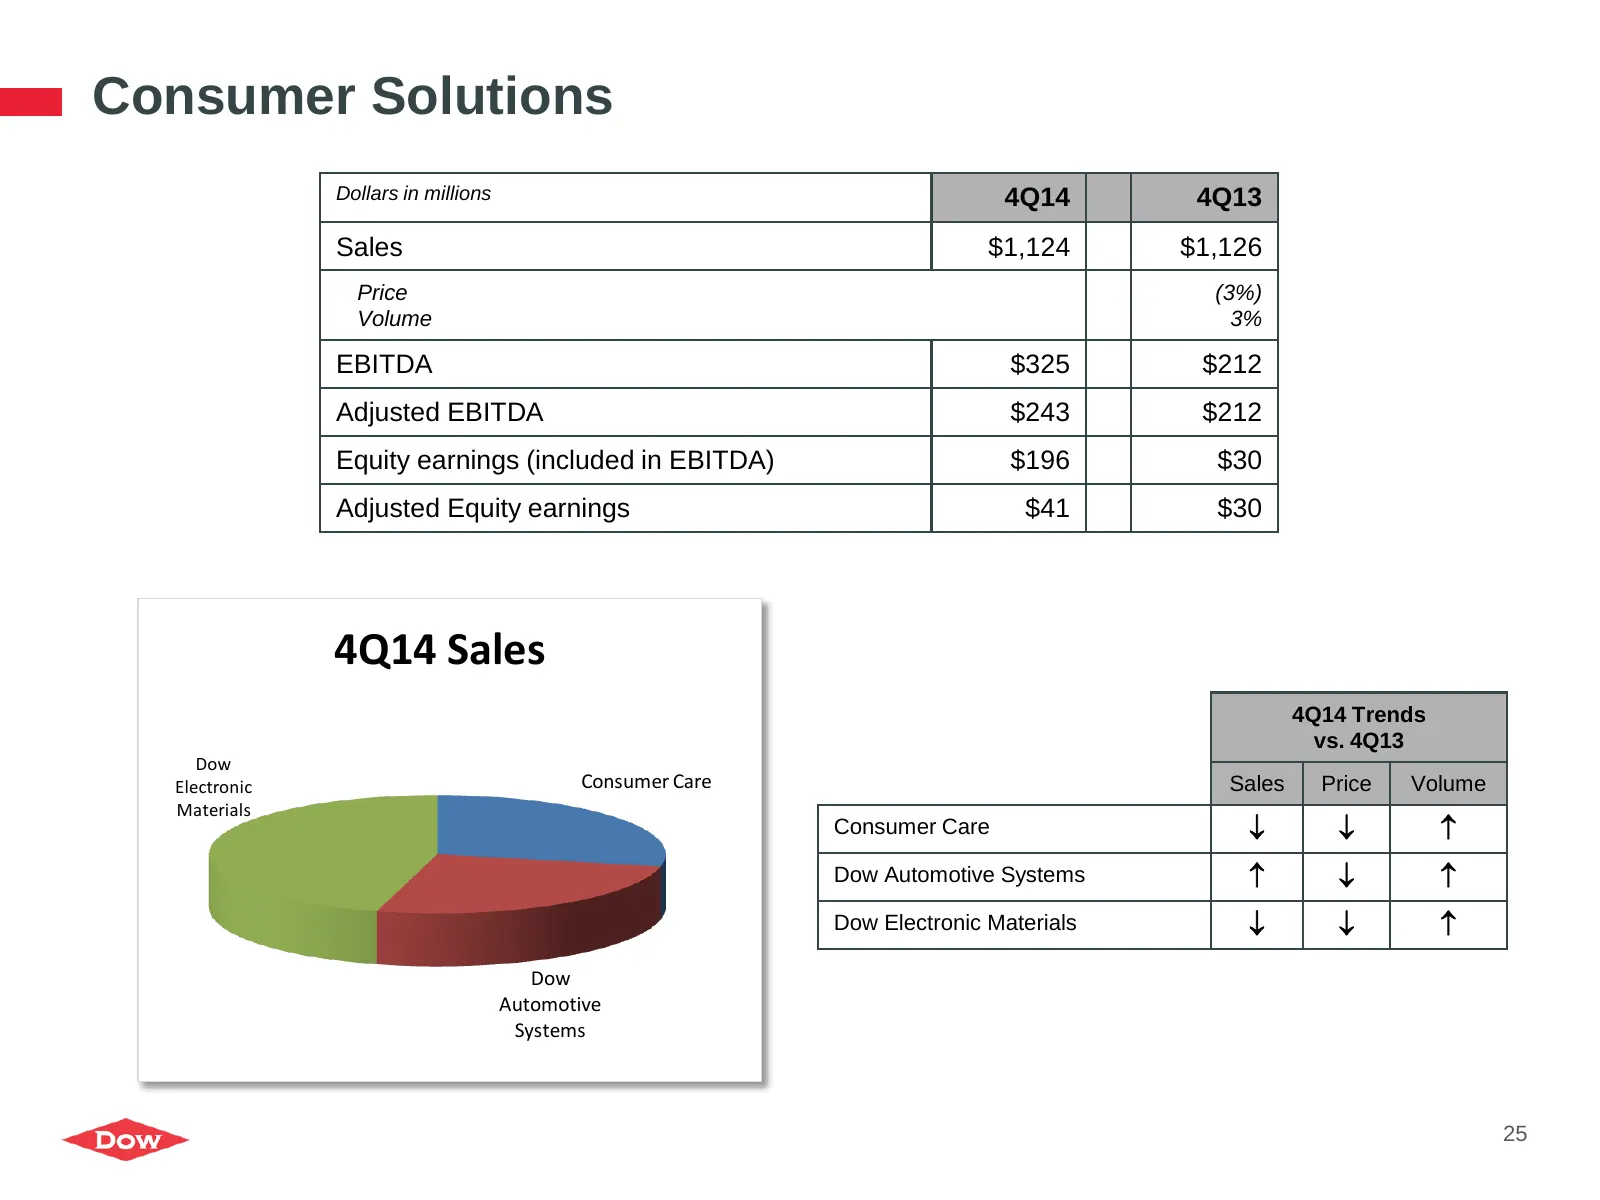
Slide 25: Consumer Solutions 4Q14 Sales
Consumer Solutions Dollars in millions 4Q14 4Q13 Sales $1,124 $1,126 Price (3%) Volume 3% EBITDA $325 $212 Adjusted EBITDA $243 $212 Equity earnings (included in EBITDA) $196 $30 Adjusted Equity earnings $41 $30 4Q14 Sales 4Q14 Trends vs. 4Q13 Dow Electronic Consumer Care Sales Price Volume Material
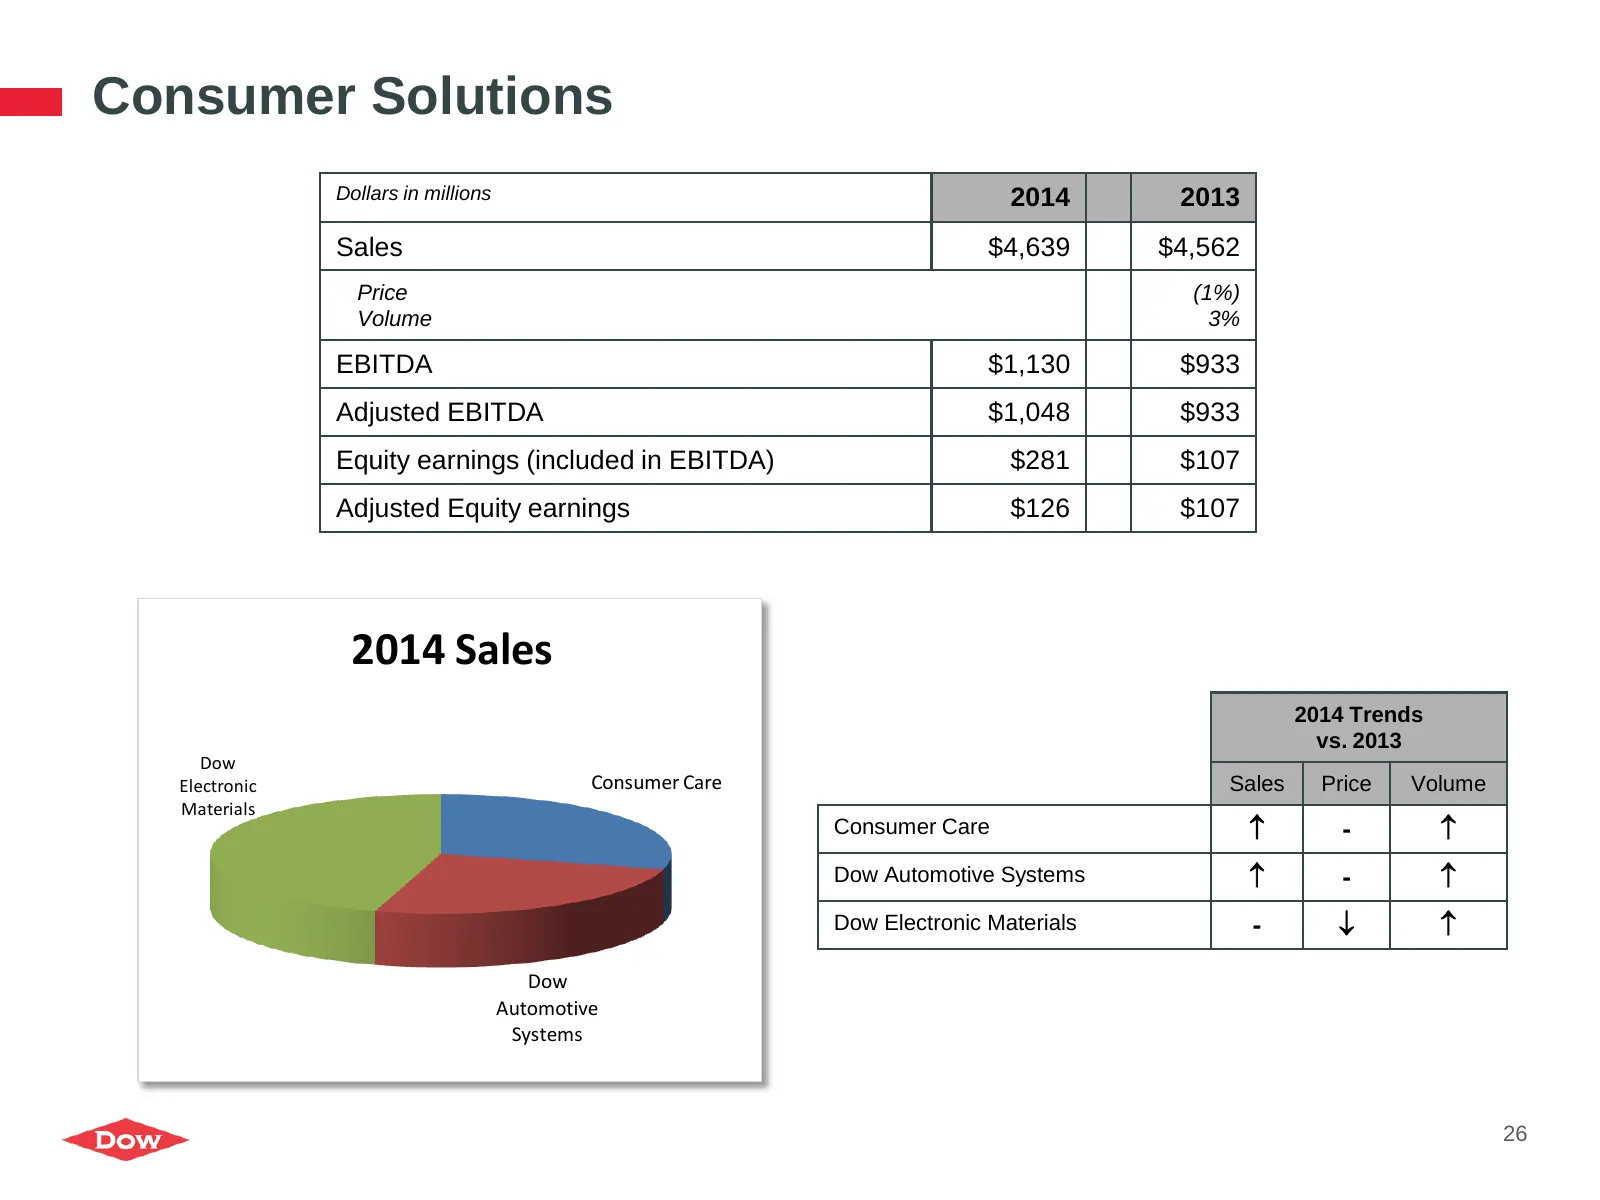
Slide 26: Consumer Solutions 2014 Sales
Consumer Solutions Dollars in millions 2014 2013 Sales $4,639 $4,562 Price (1%) Volume 3% EBITDA $1,130 $933 Adjusted EBITDA $1,048 $933 Equity earnings (included in EBITDA) $281 $107 Adjusted Equity earnings $126 $107 2014 Sales 2014 Trends vs. 2013 Dow Electronic Consumer Care Sales Price Volume M
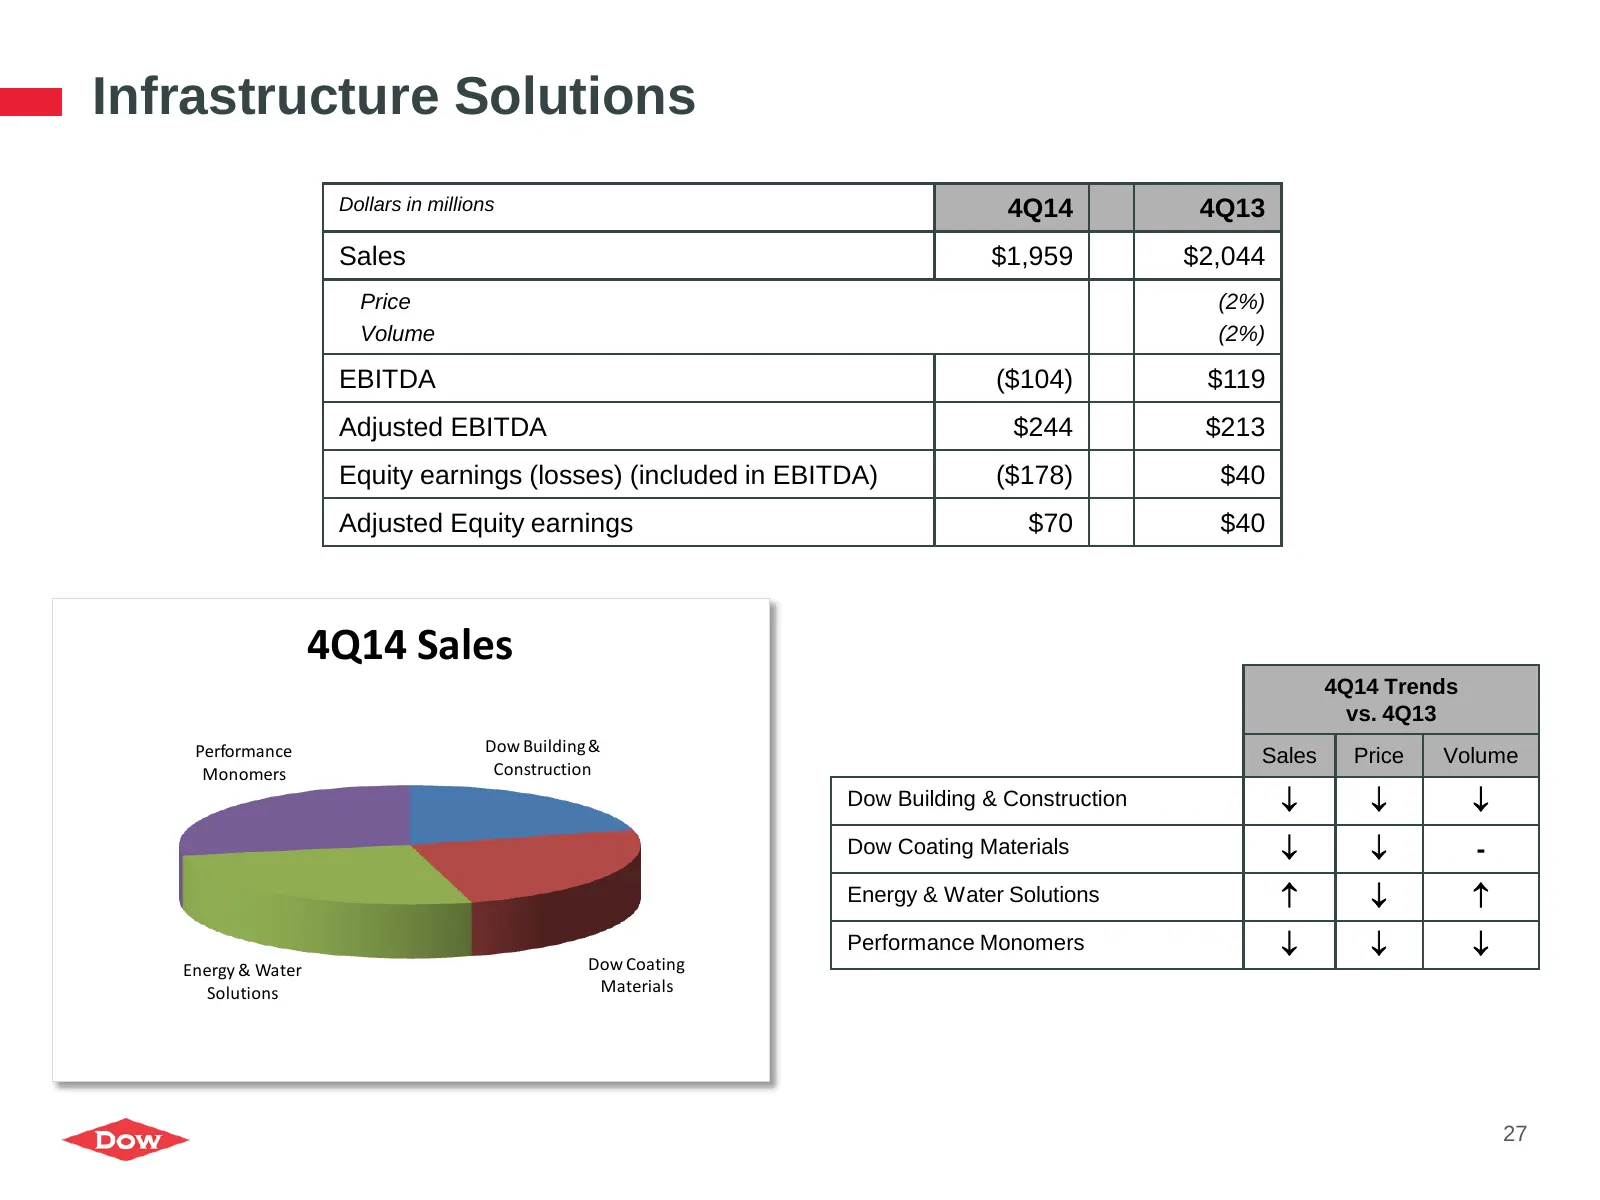
Slide 27: Infrastructure Solutions 4Q14 Sales
Infrastructure Solutions Dollars in millions 4Q14 4Q13 Sales $1,959 $2,044 Price (2%) Volume (2%) EBITDA ($104) $119 Adjusted EBITDA $244 $213 Equity earnings (losses) (included in EBITDA) ($178) $40 Adjusted Equity earnings $70 $40 4Q14 Sales 4Q14 Trends vs. 4Q13 Performance Dow Building & Sales Pr
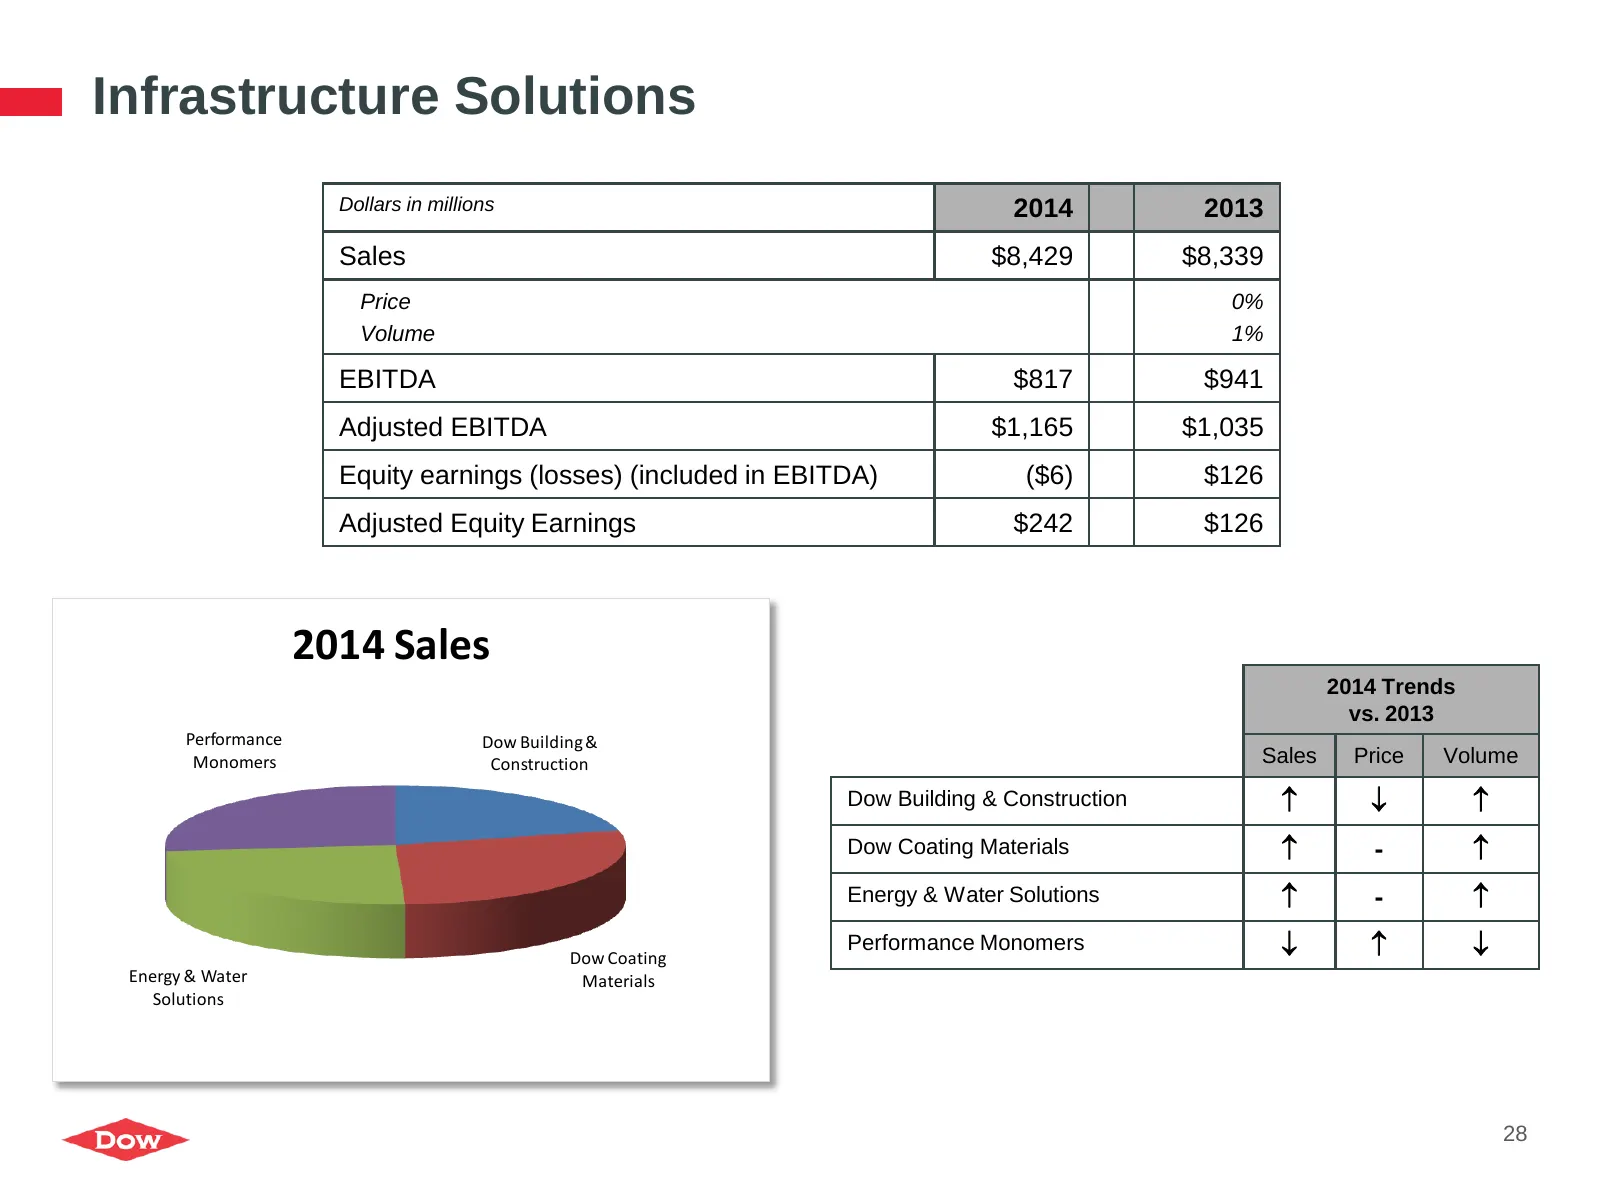
Slide 28: Infrastructure Solutions 2014 Sales
Infrastructure Solutions Dollars in millions 2014 2013 Sales $8,429 $8,339 Price 0% Volume 1% EBITDA $817 $941 Adjusted EBITDA $1,165 $1,035 Equity earnings (losses) (included in EBITDA) ($6) $126 Adjusted Equity Earnings $242 $126 2014 Sales 2014 Trends vs. 2013 Performance Dow Building & Monomers
Slide 29: Performance Materials & Chemicals
Performance Materials & Chemicals Dollars in millions 4Q14 4Q13 Sales $3,912 $3,740 Price (2%) Volume 7% EBITDA $636 $483 Adjusted EBITDA $636 $538 Equity losses (included in EBITDA) $54 $124 4Q14 Trends vs. 4Q13 4Q14 Sales Sales Price Volume Chlor-Alkali & Vinyl Chlorinated Organics Ind
Slide 30: Performance Materials & Chemicals
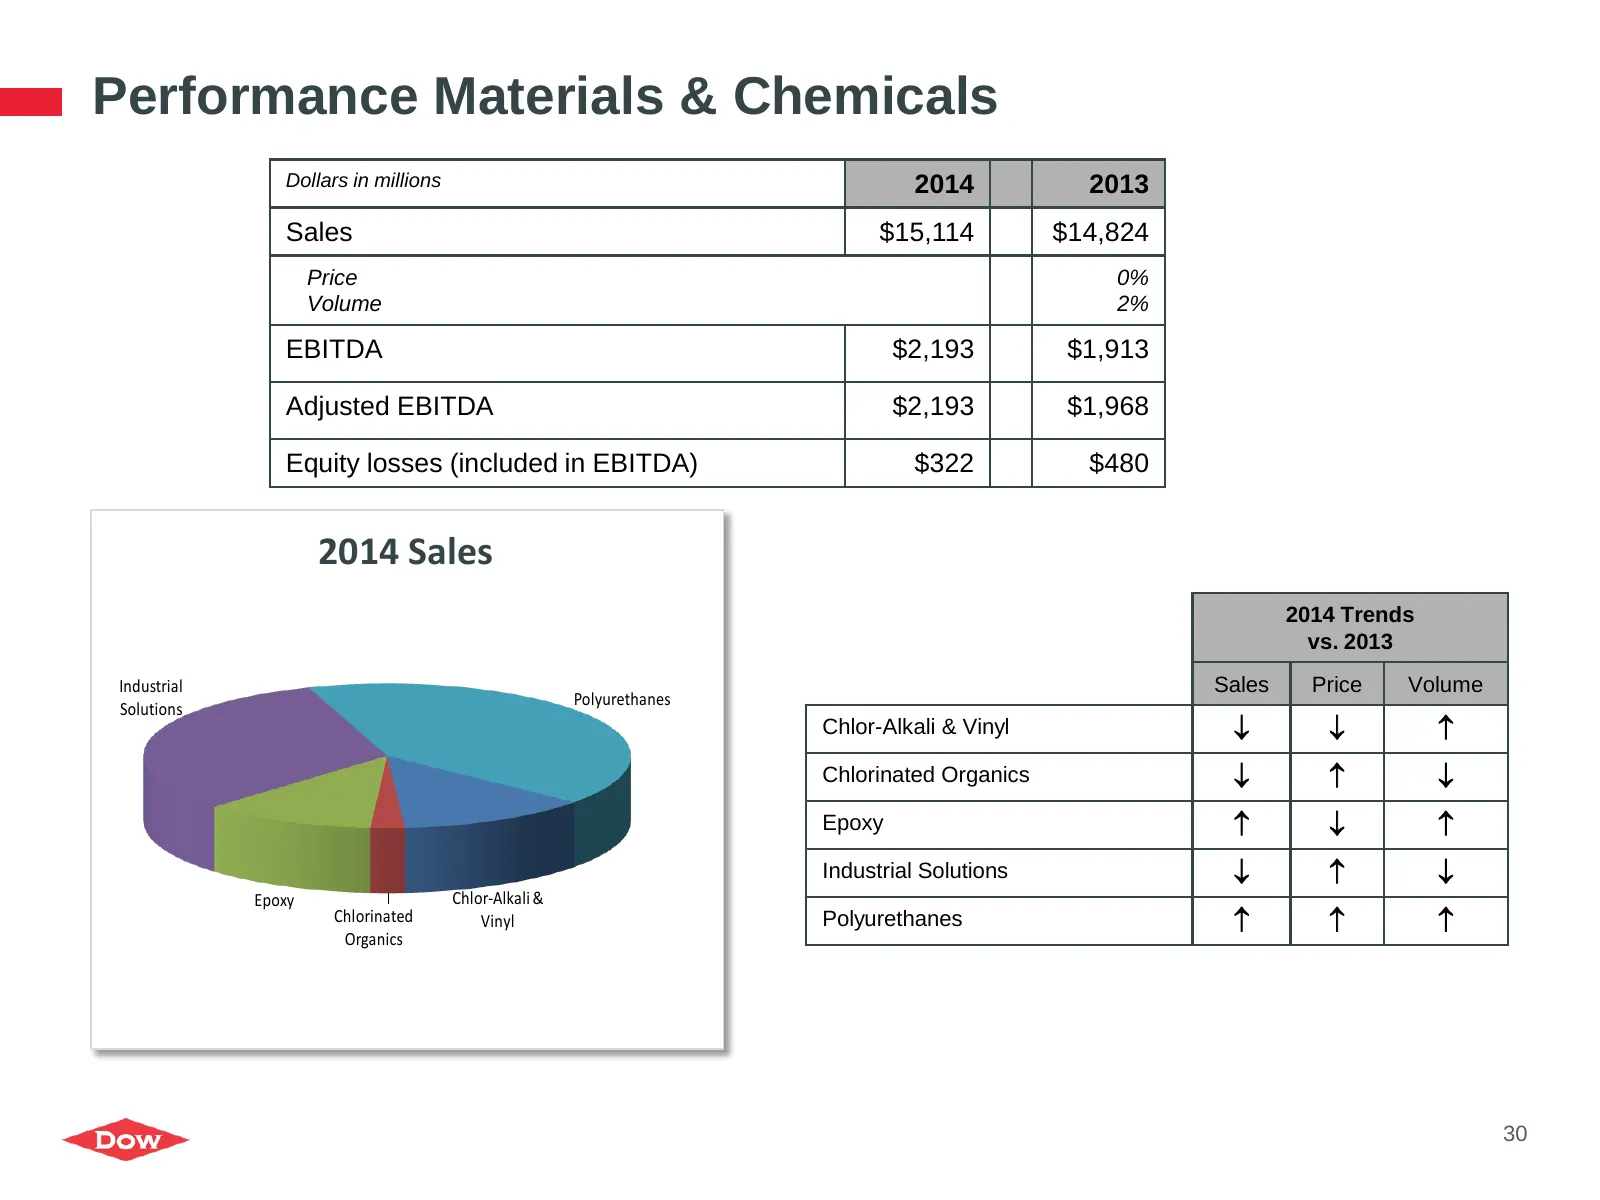
Performance Materials & Chemicals Dollars in millions 2014 2013 Sales $15,114 $14,824 Price 0% Volume 2% EBITDA $2,193 $1,913 Adjusted EBITDA $2,193 $1,968 Equity losses (included in EBITDA) $322 $480 2014 Sales 2014 Trends vs. 2013 Industrial Sales Price Volume Polyurethanes Solutions Chlor-Alkali
Slide 31: Performance Plastics
Performance Plastics Dollars in millions 4Q14 4Q13 Sales $5,465 $5,632 Adjusted Sales $5,465 $5,621 Adjusted Price (6%) Adjusted Volume 3% Adjusted Price (1%) excluding Hydrocarbons & Energy Adjusted Volume 1% EBITDA $1,194 $1,672 Adjusted EBITDA $1,194 $1,128 Equity earnings (included in EBITDA) $5
Slide 32: Performance Plastics
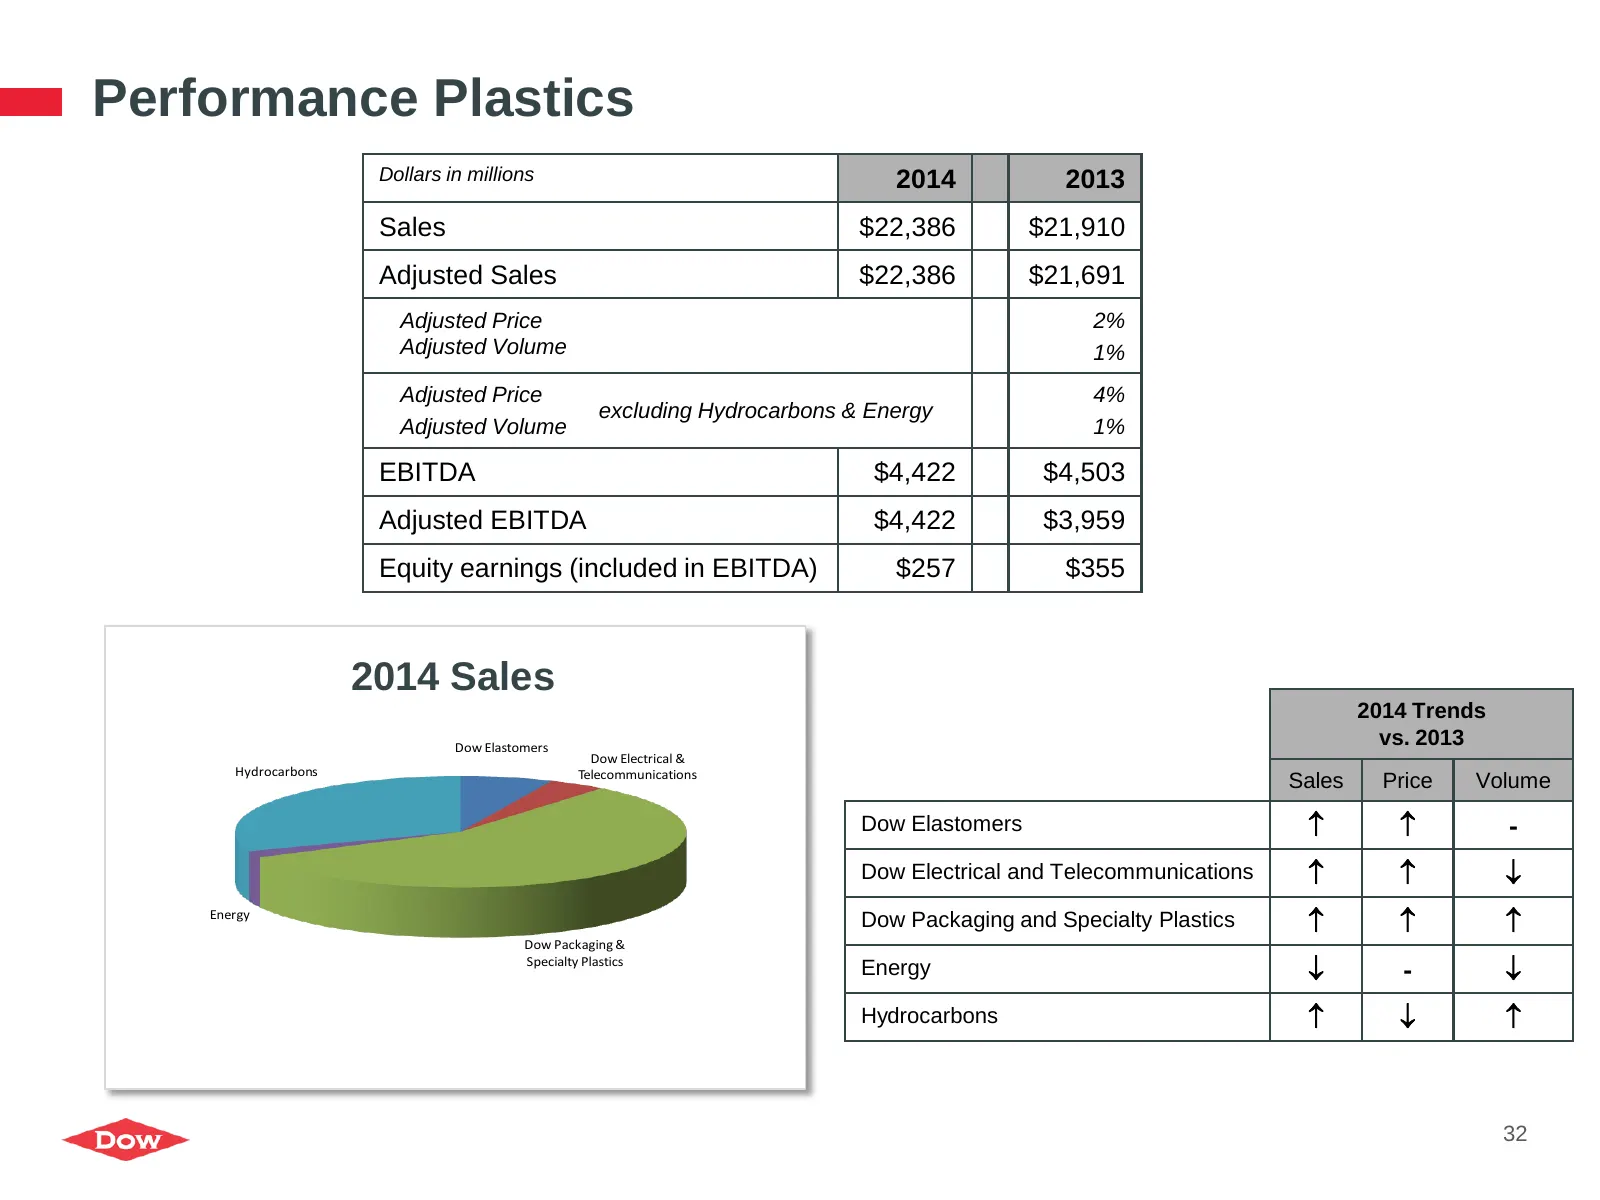
Performance Plastics Dollars in millions 2014 2013 Sales $22,386 $21,910 Adjusted Sales $22,386 $21,691 Adjusted Price 2% Adjusted Volume 1% Adjusted Price 4% excluding Hydrocarbons & Energy Adjusted Volume 1% EBITDA $4,422 $4,503 Adjusted EBITDA $4,422 $3,959 Equity earnings (included in EBITDA) $2
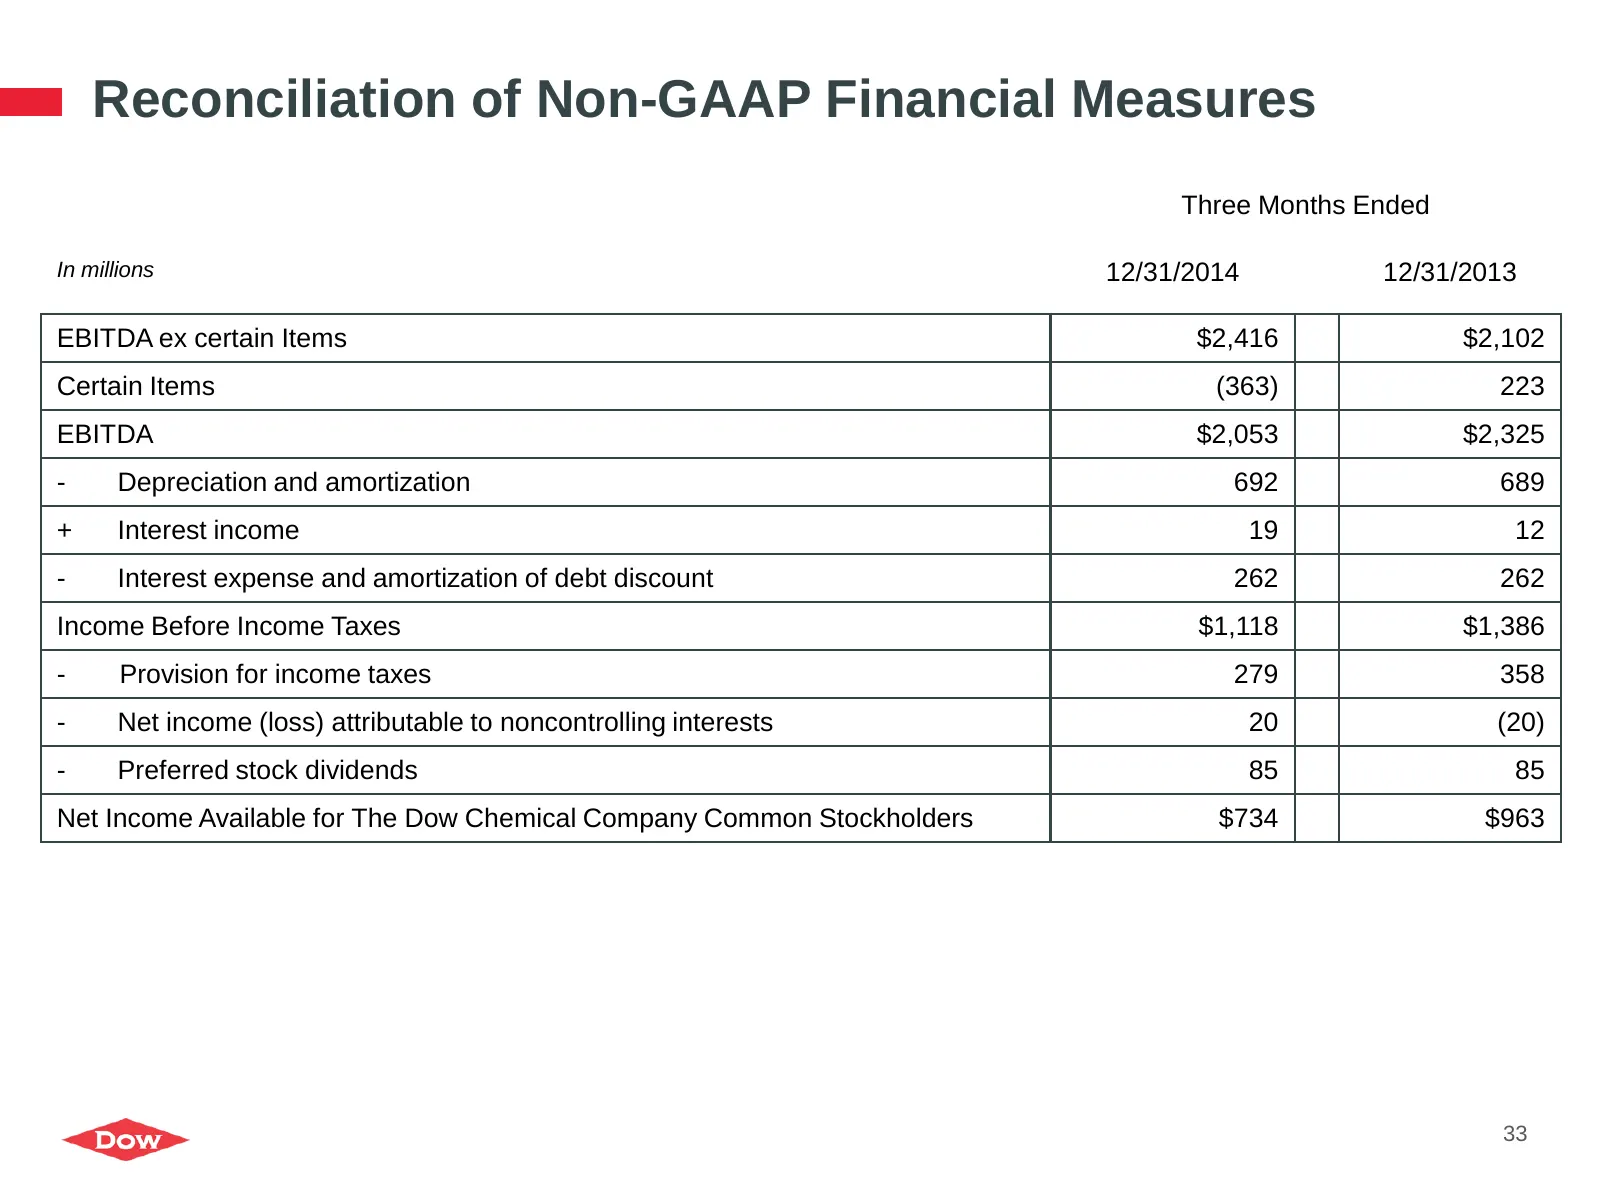
Slide 33: Reconciliation of Non-GAAP Financial Measures
Reconciliation of Non-GAAP Financial Measures Three Months Ended In millions 12/31/2014 12/31/2013 EBITDA ex certain Items $2,416 $2,102 Certain Items (363) 223 EBITDA $2,053 $2,325 - Depreciation and amortization 692 689 + Interest income 19 12 - Interest expense and amortization of debt discount 2
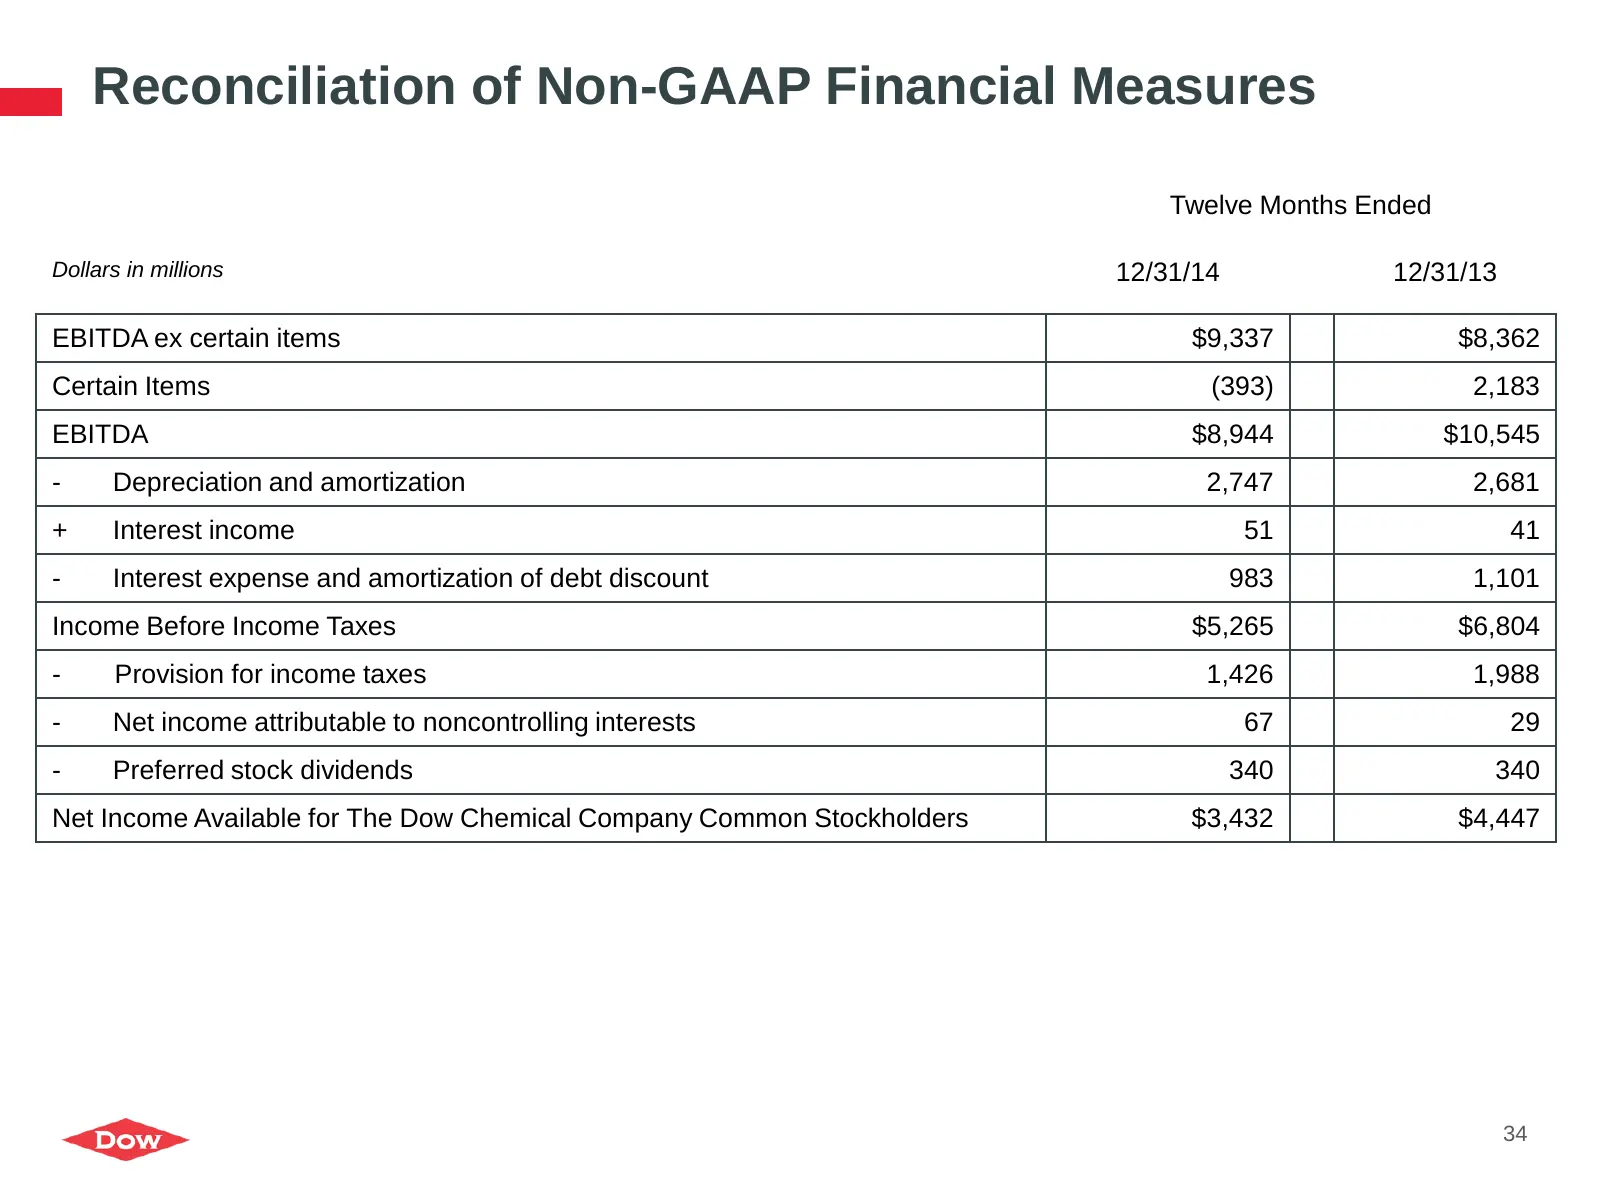
Slide 34: Reconciliation of Non-GAAP Financial Measures
Reconciliation of Non-GAAP Financial Measures Twelve Months Ended Dollars in millions 12/31/14 12/31/13 EBITDA ex certain items $9,337 $8,362 Certain Items (393) 2,183 EBITDA $8,944 $10,545 - Depreciation and amortization 2,747 2,681 + Interest income 51 41 - Interest expense and amortization of deb
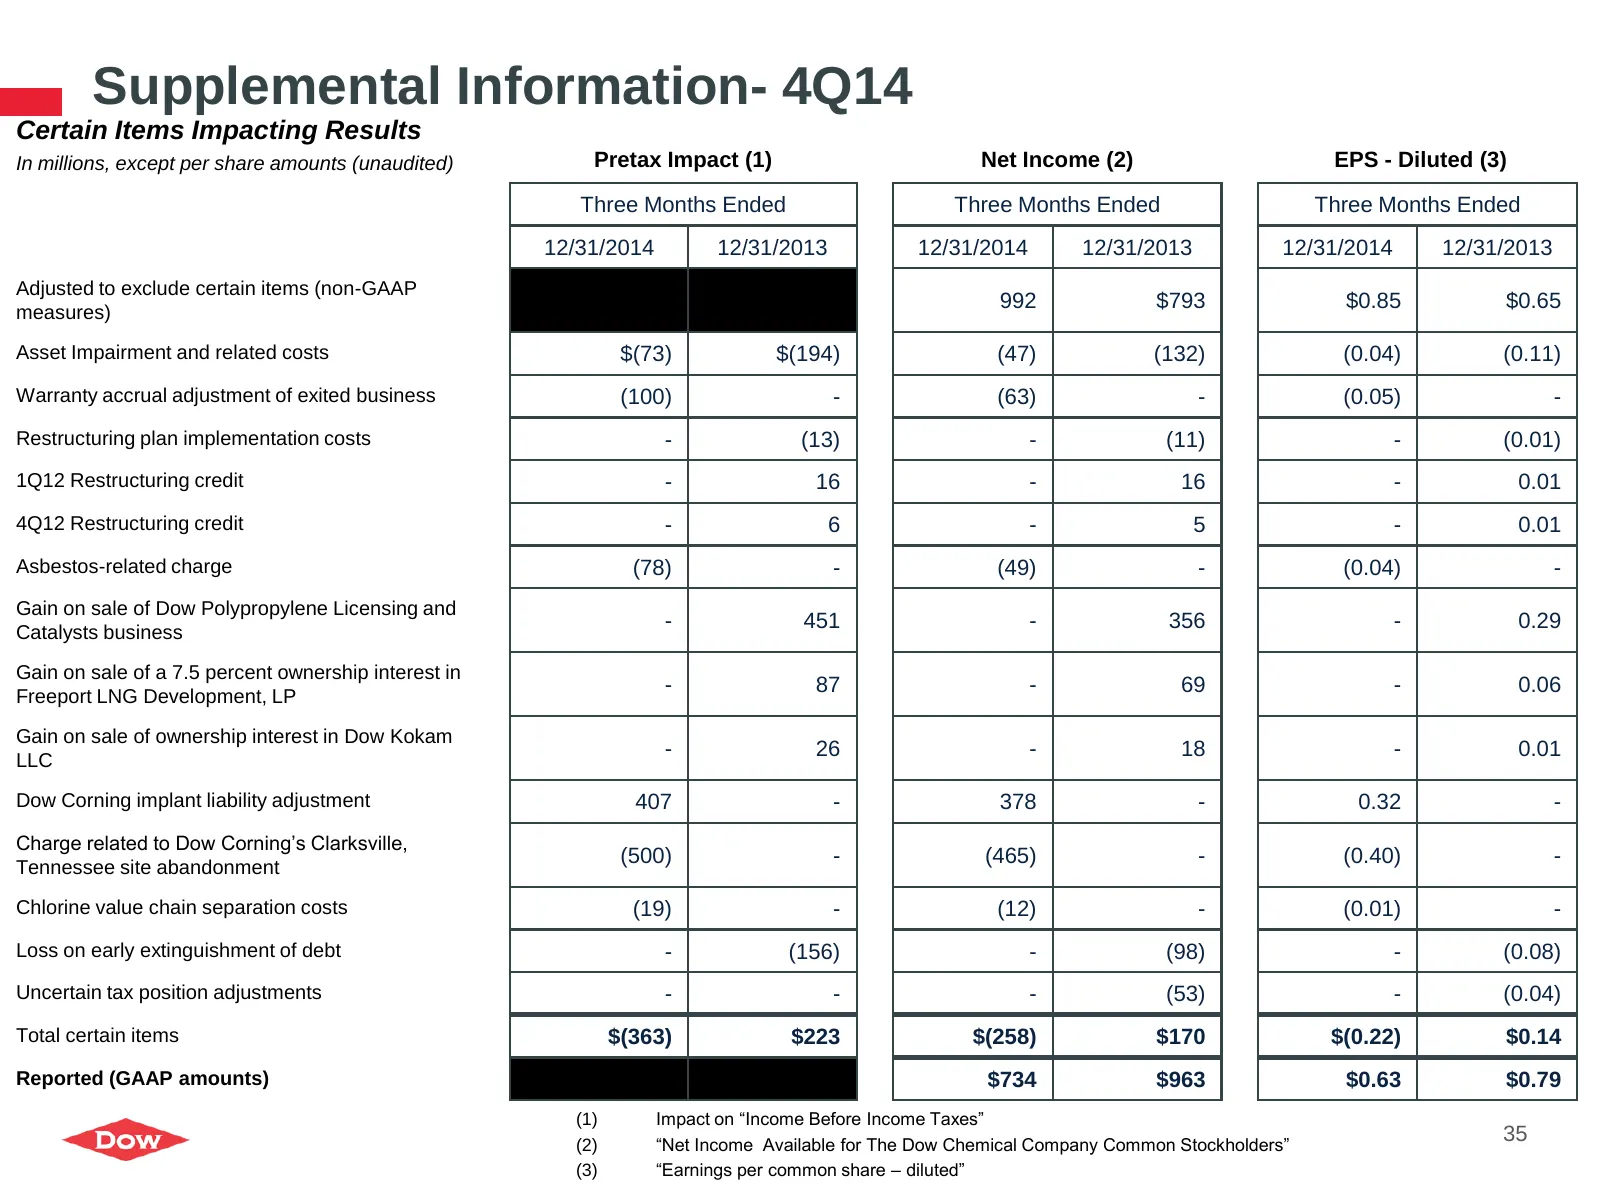
Slide 35: Supplemental Information- 4Q14
Supplemental Information- 4Q14 Certain Items Impacting Results In millions, except per share amounts (unaudited) Pretax Impact (1) Net Income (2) EPS - Diluted (3) Three Months Ended Three Months Ended Three Months Ended 12/31/2014 12/31/2013 12/31/2014 12/31/2013 12/31/2014 12/31/2013 Adjusted to e
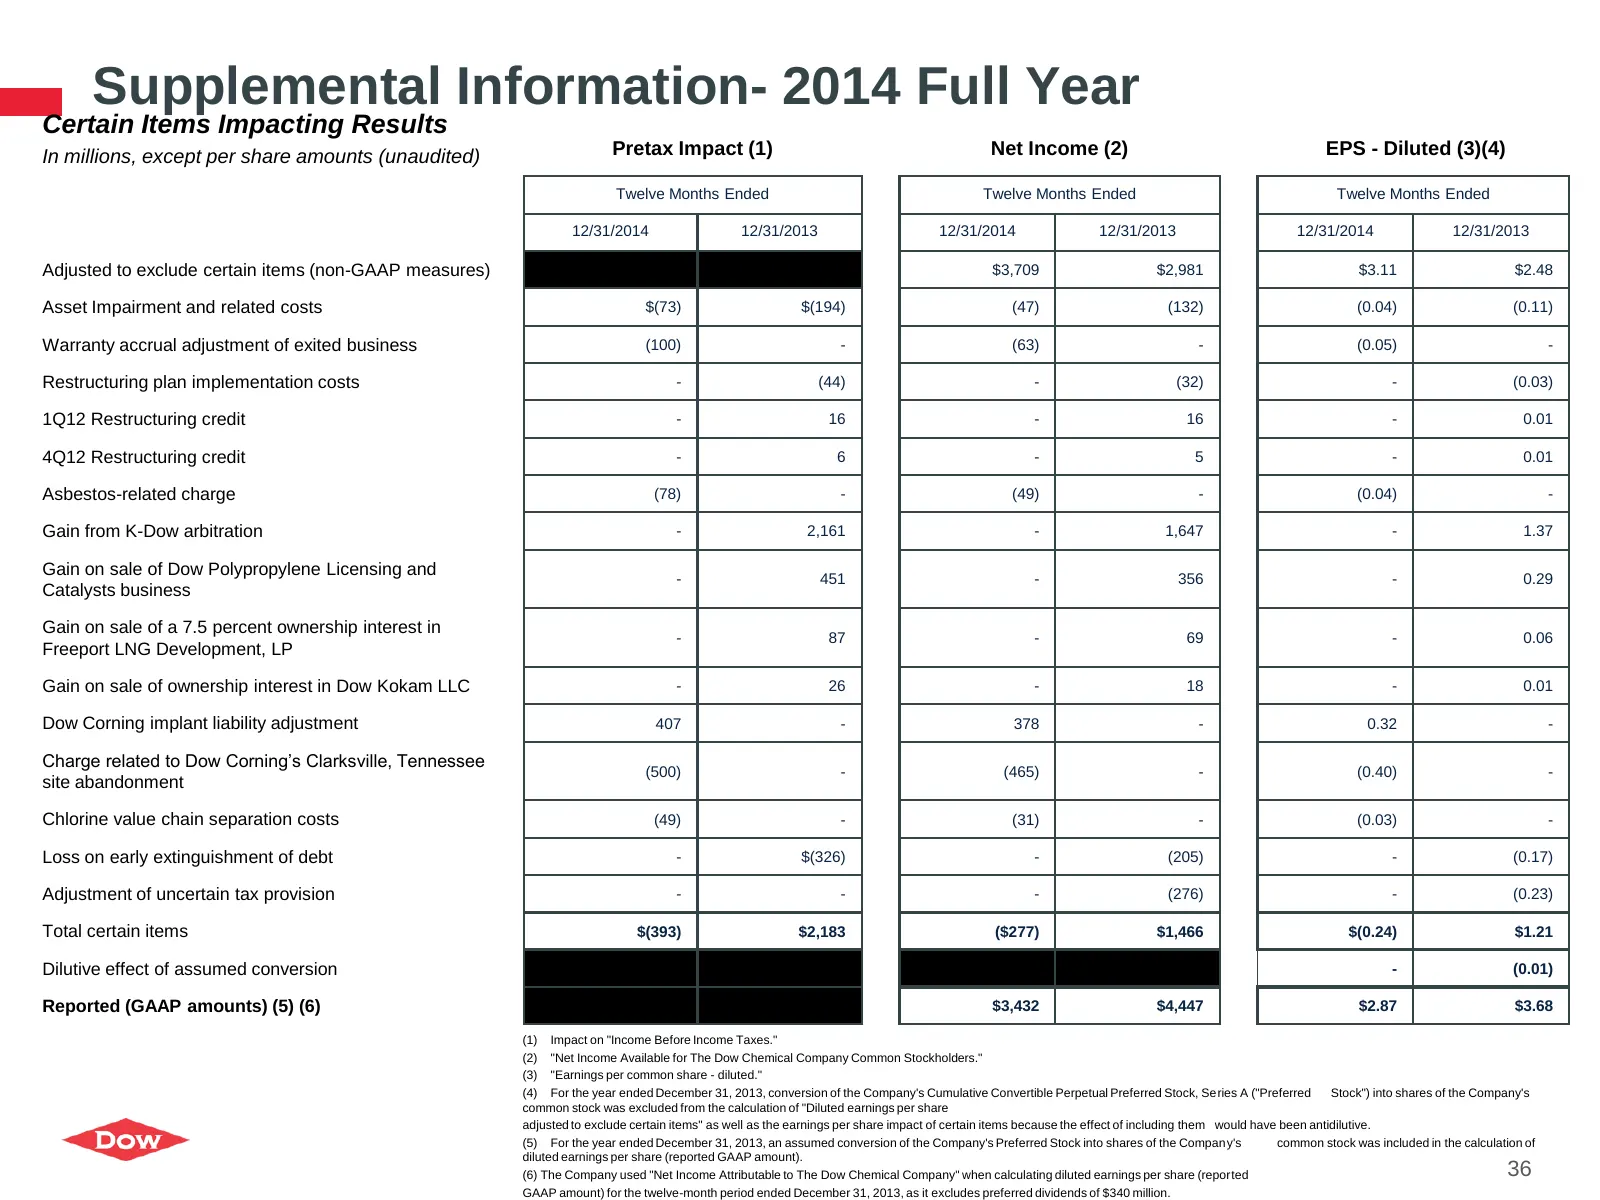
Slide 36: Supplemental Information- 2014 Full Year
Supplemental Information- 2014 Full Year Certain Items Impacting Results In millions, except per share amounts (unaudited) Pretax Impact (1) Net Income (2) EPS - Diluted (3)(4) Twelve Months Ended Twelve Months Ended Twelve Months Ended 12/31/2014 12/31/2013 12/31/2014 12/31/2013 12/31/2014 12/31/20
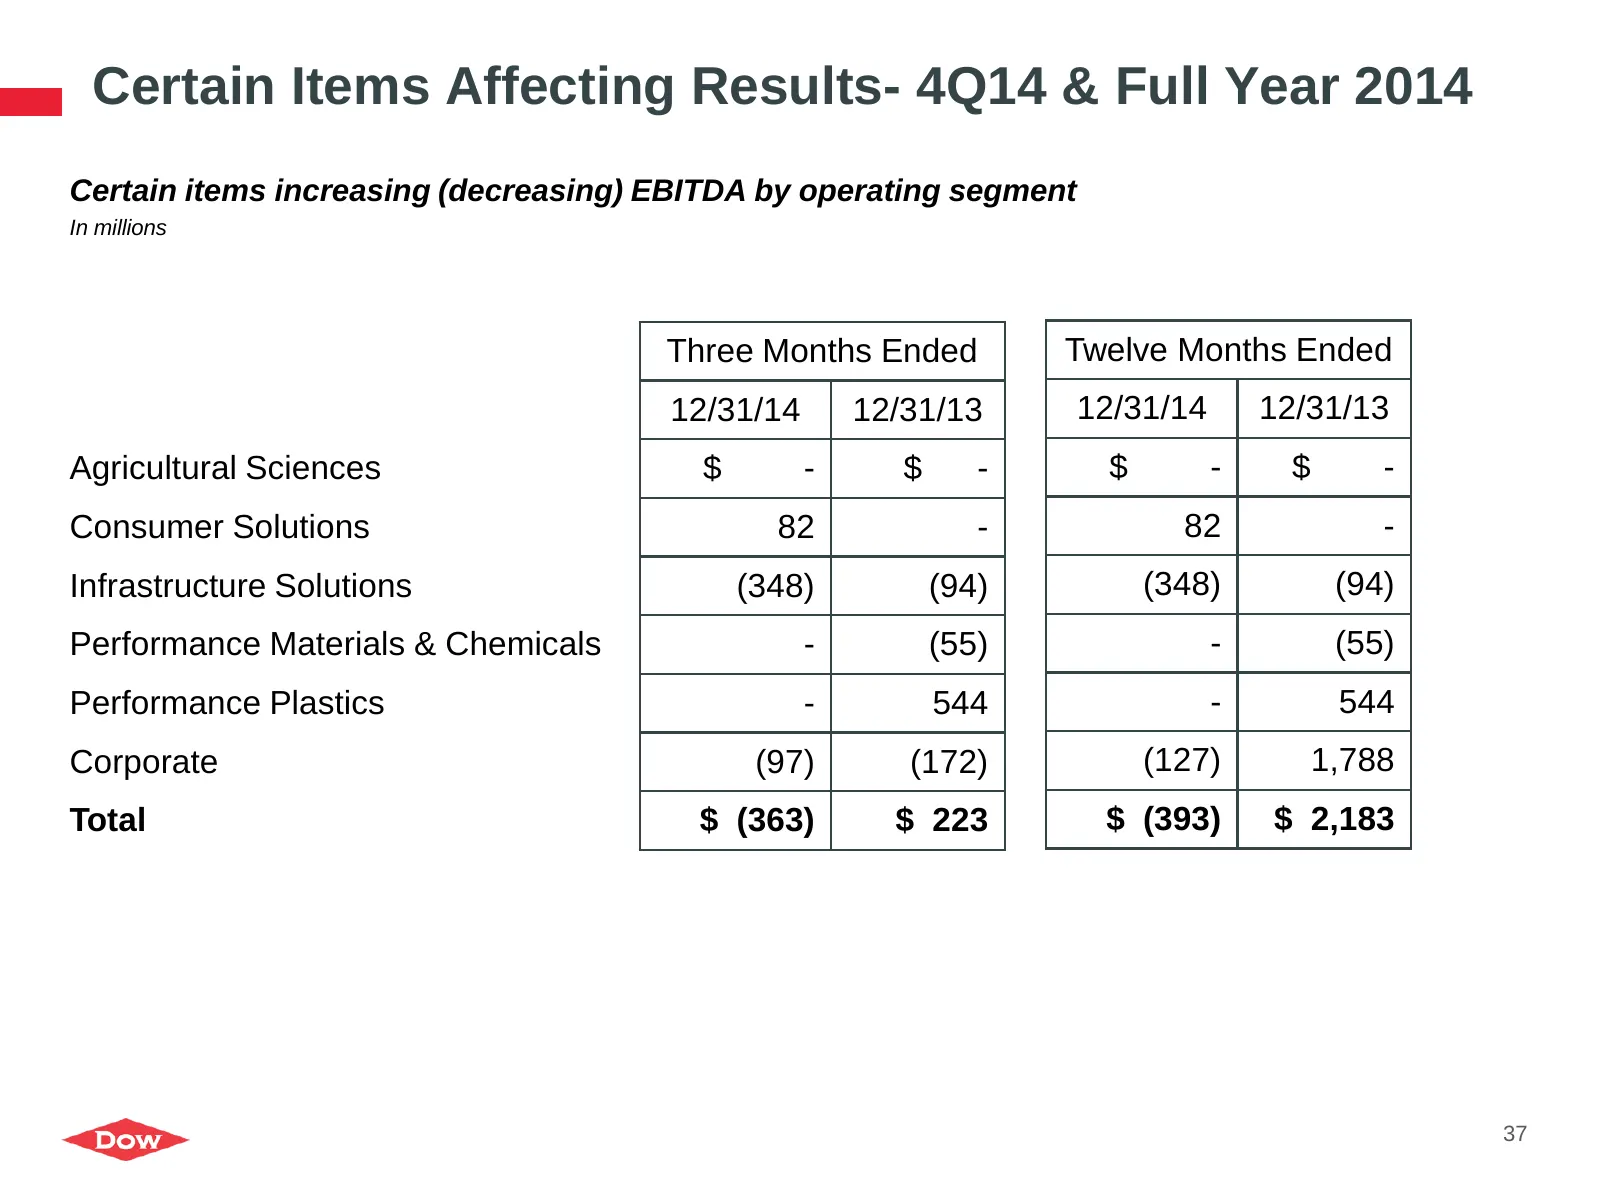
Slide 37: Certain Items Affecting Results- 4Q14 & Full Year 2014
Certain Items Affecting Results- 4Q14 & Full Year 2014 Certain items increasing (decreasing) EBITDA by operating segment In millions Three Months Ended Twelve Months Ended 12/31/14 12/31/13 12/31/14 12/31/13 Agricultural Sciences $ - $ - $ - $ - Consumer Solutions 82 - 82 - Infrastructure Solutions
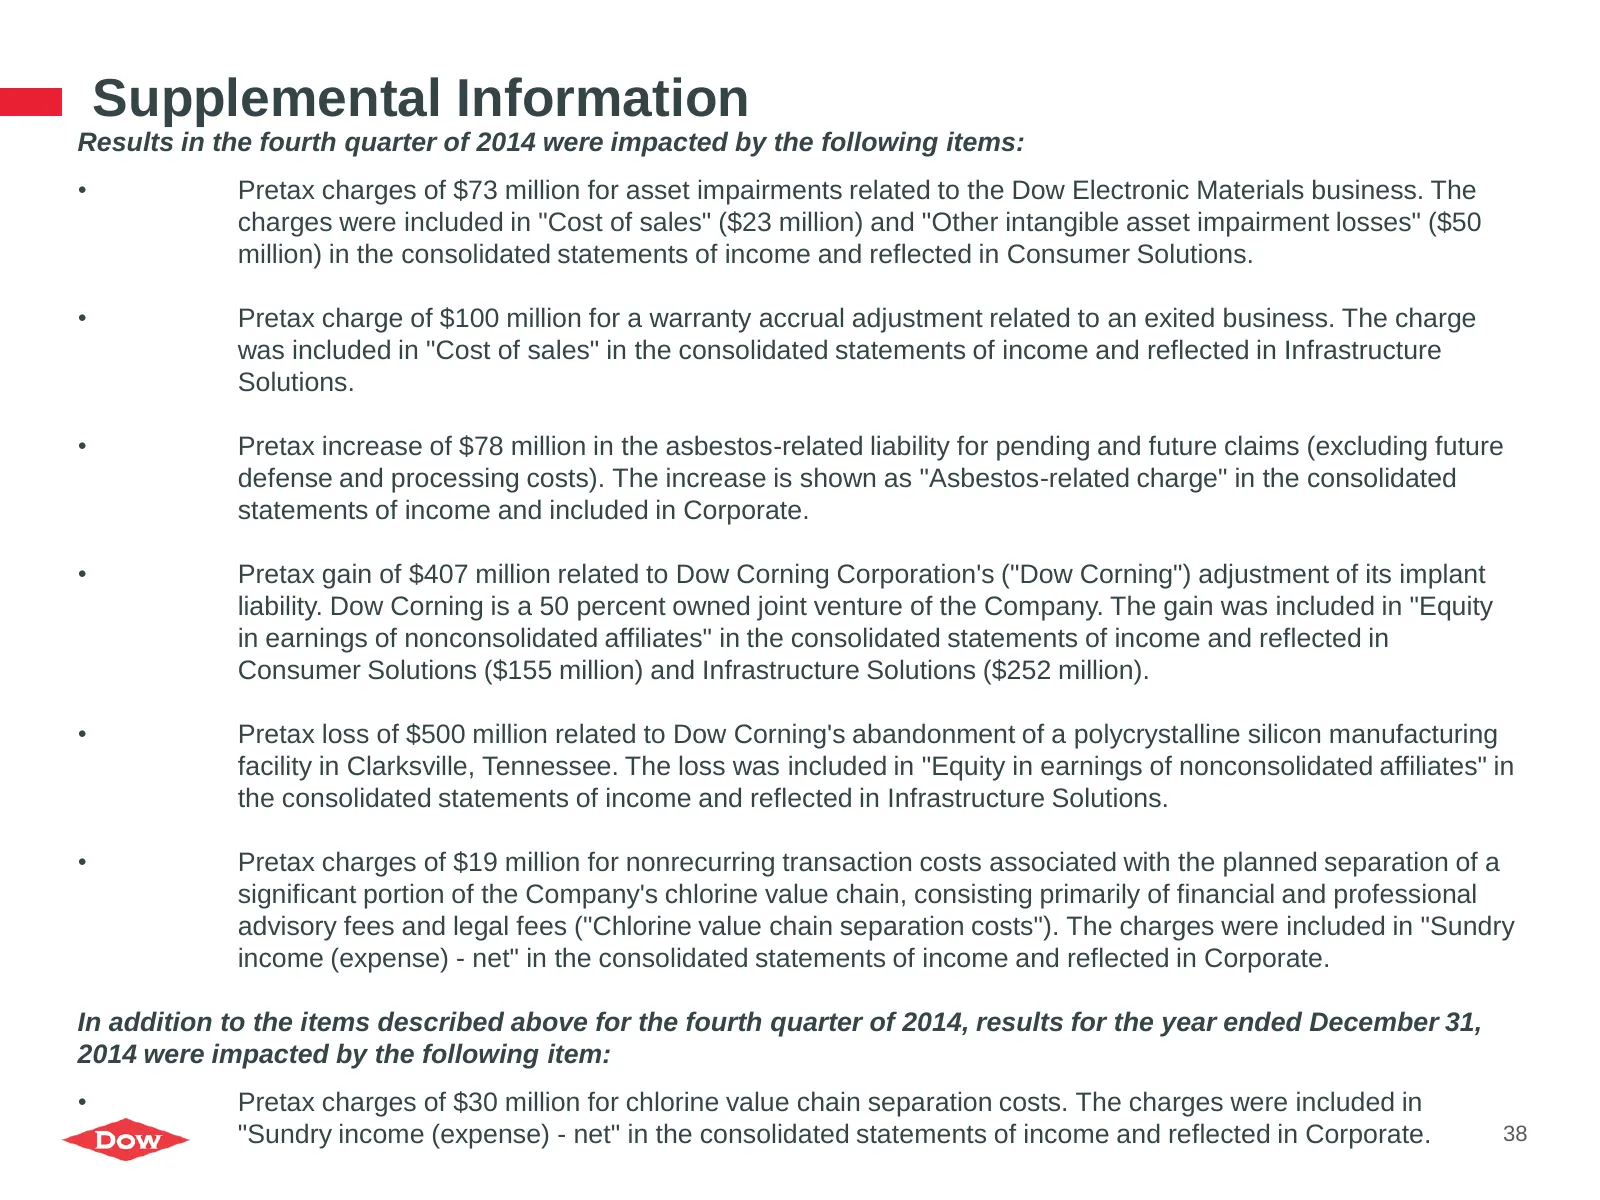
Slide 38: Supplemental Information
Supplemental Information Results in the fourth quarter of 2014 were impacted by the following items: • Pretax charges of $73 million for asset impairments related to the Dow Electronic Materials business. The charges were included in "Cost of sales" ($23 million) and "Other intangible asset impairme
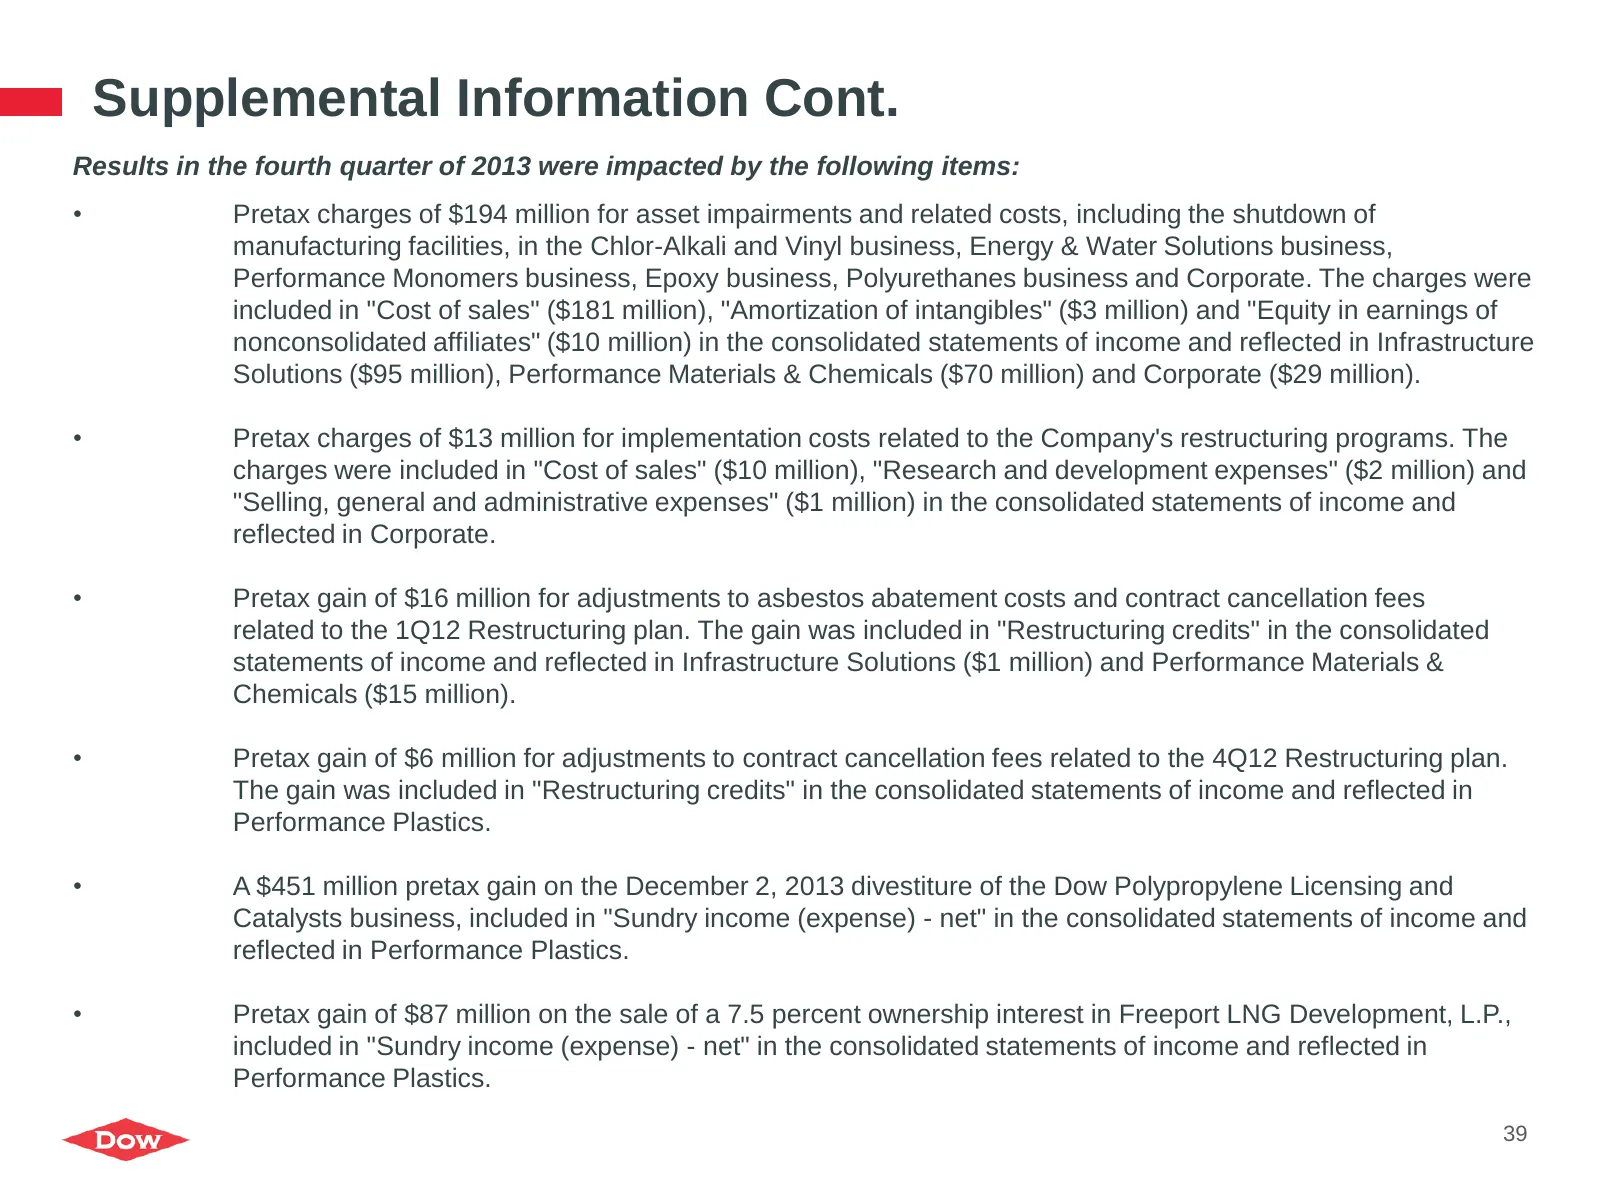
Slide 39: Supplemental Information Cont.
Supplemental Information Cont. Results in the fourth quarter of 2013 were impacted by the following items: • Pretax charges of $194 million for asset impairments and related costs, including the shutdown of manufacturing facilities, in the Chlor-Alkali and Vinyl business, Energy & Water Solutions bu
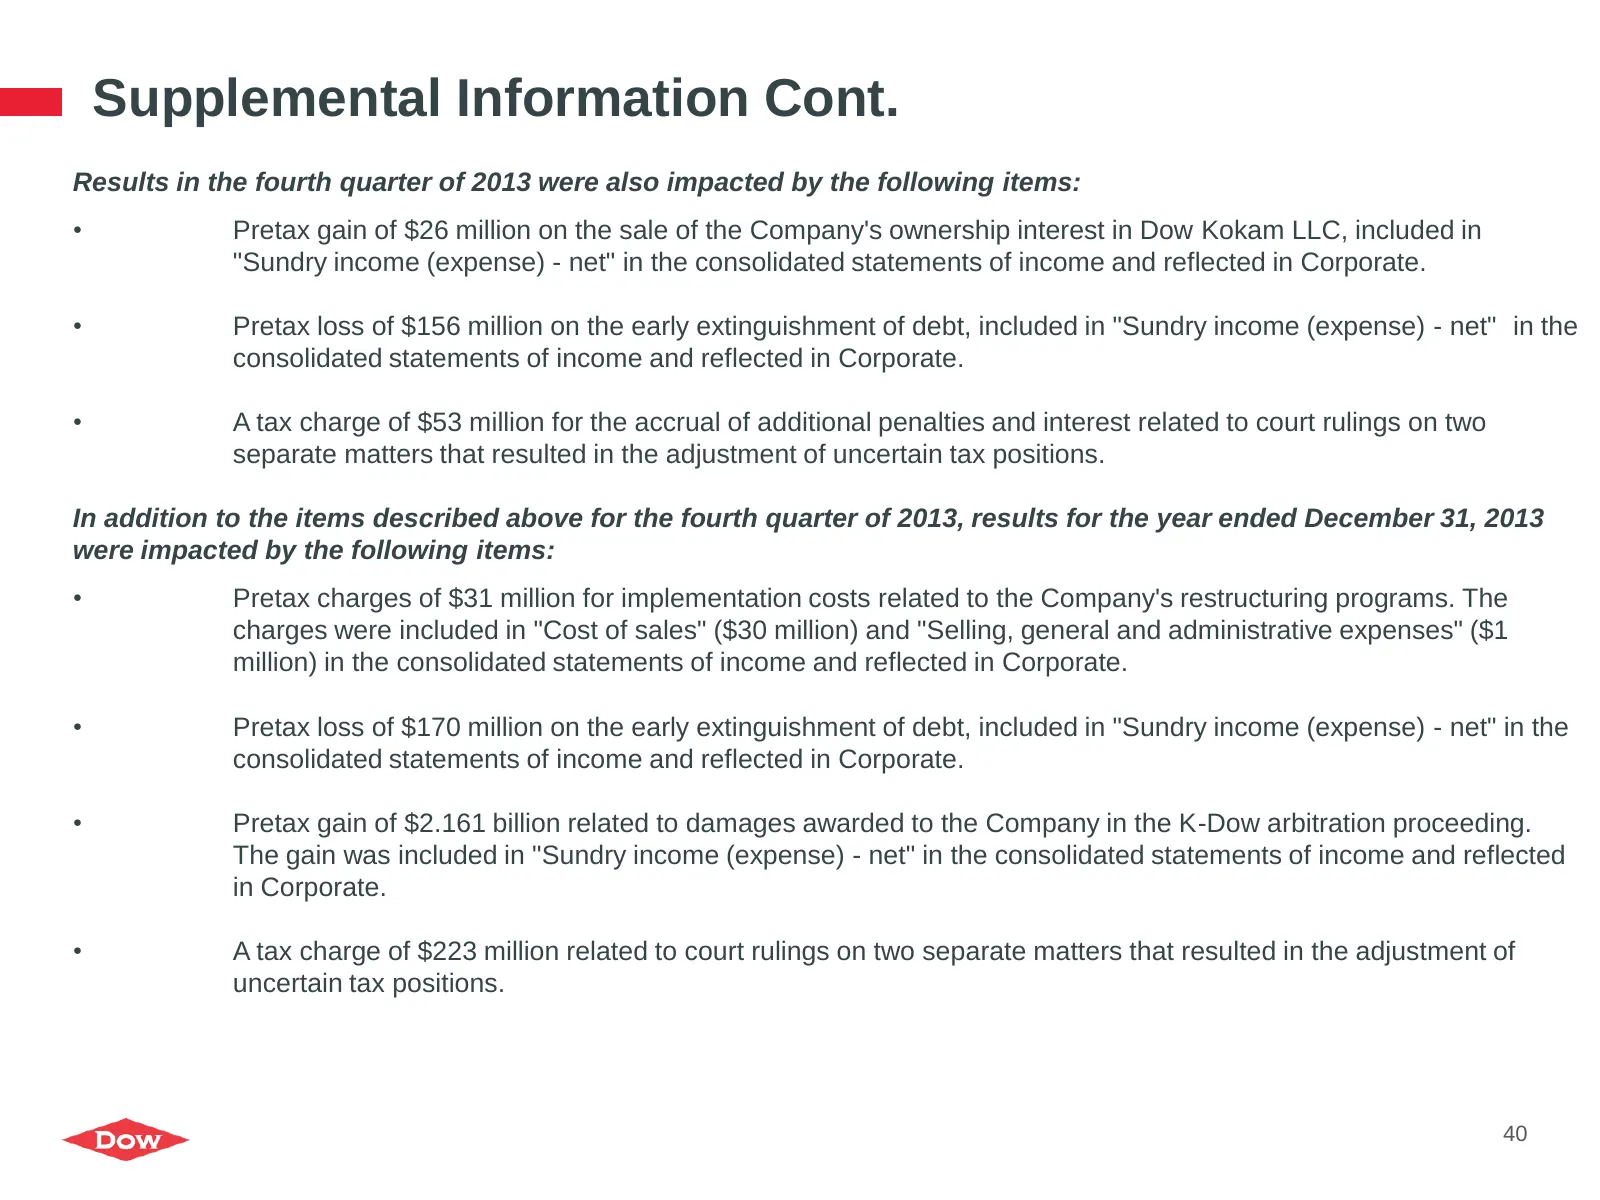
Slide 40: Supplemental Information Cont.
Supplemental Information Cont. Results in the fourth quarter of 2013 were also impacted by the following items: • Pretax gain of $26 million on the sale of the Company's ownership interest in Dow Kokam LLC, included in "Sundry income (expense) - net" in the consolidated statements of income and refl
Slide 41: Emerging Geographies
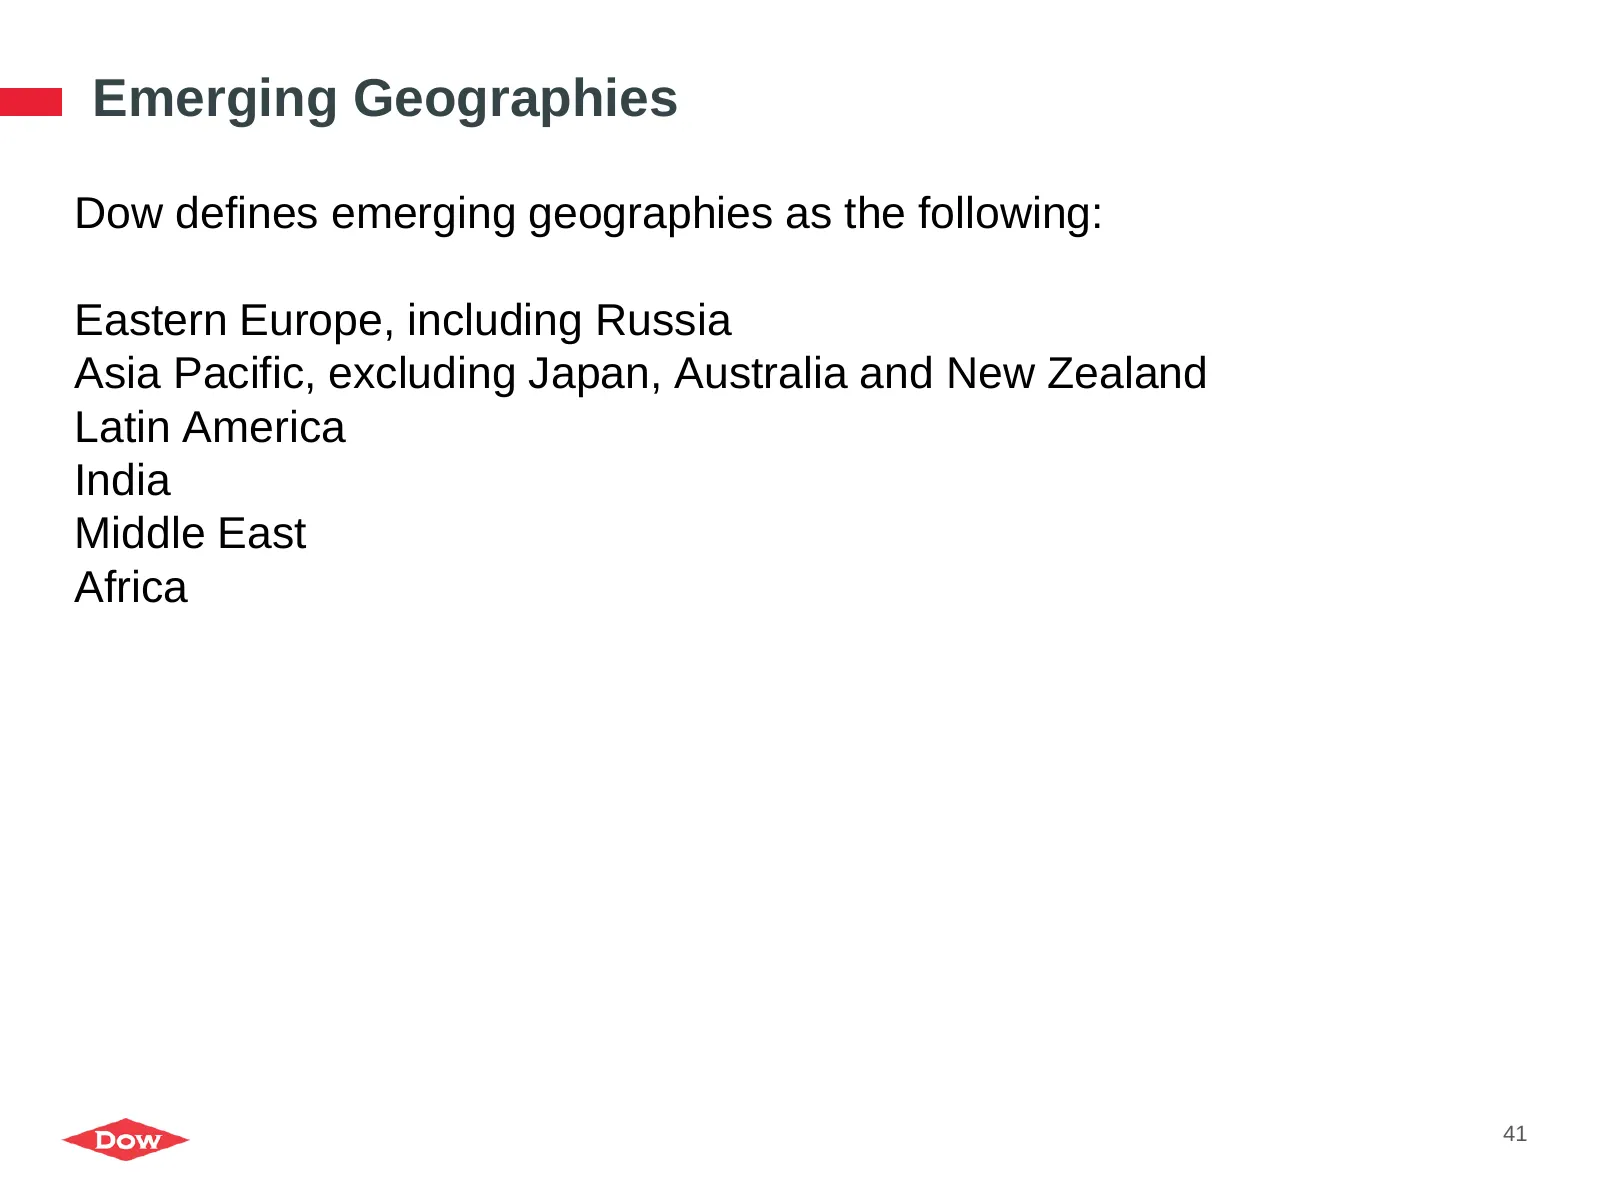
Emerging Geographies Dow defines emerging geographies as the following: Eastern Europe, including Russia Asia Pacific, excluding Japan, Australia and New Zealand Latin America India Middle East Africa 41
Slide 42: Principal Joint Ventures
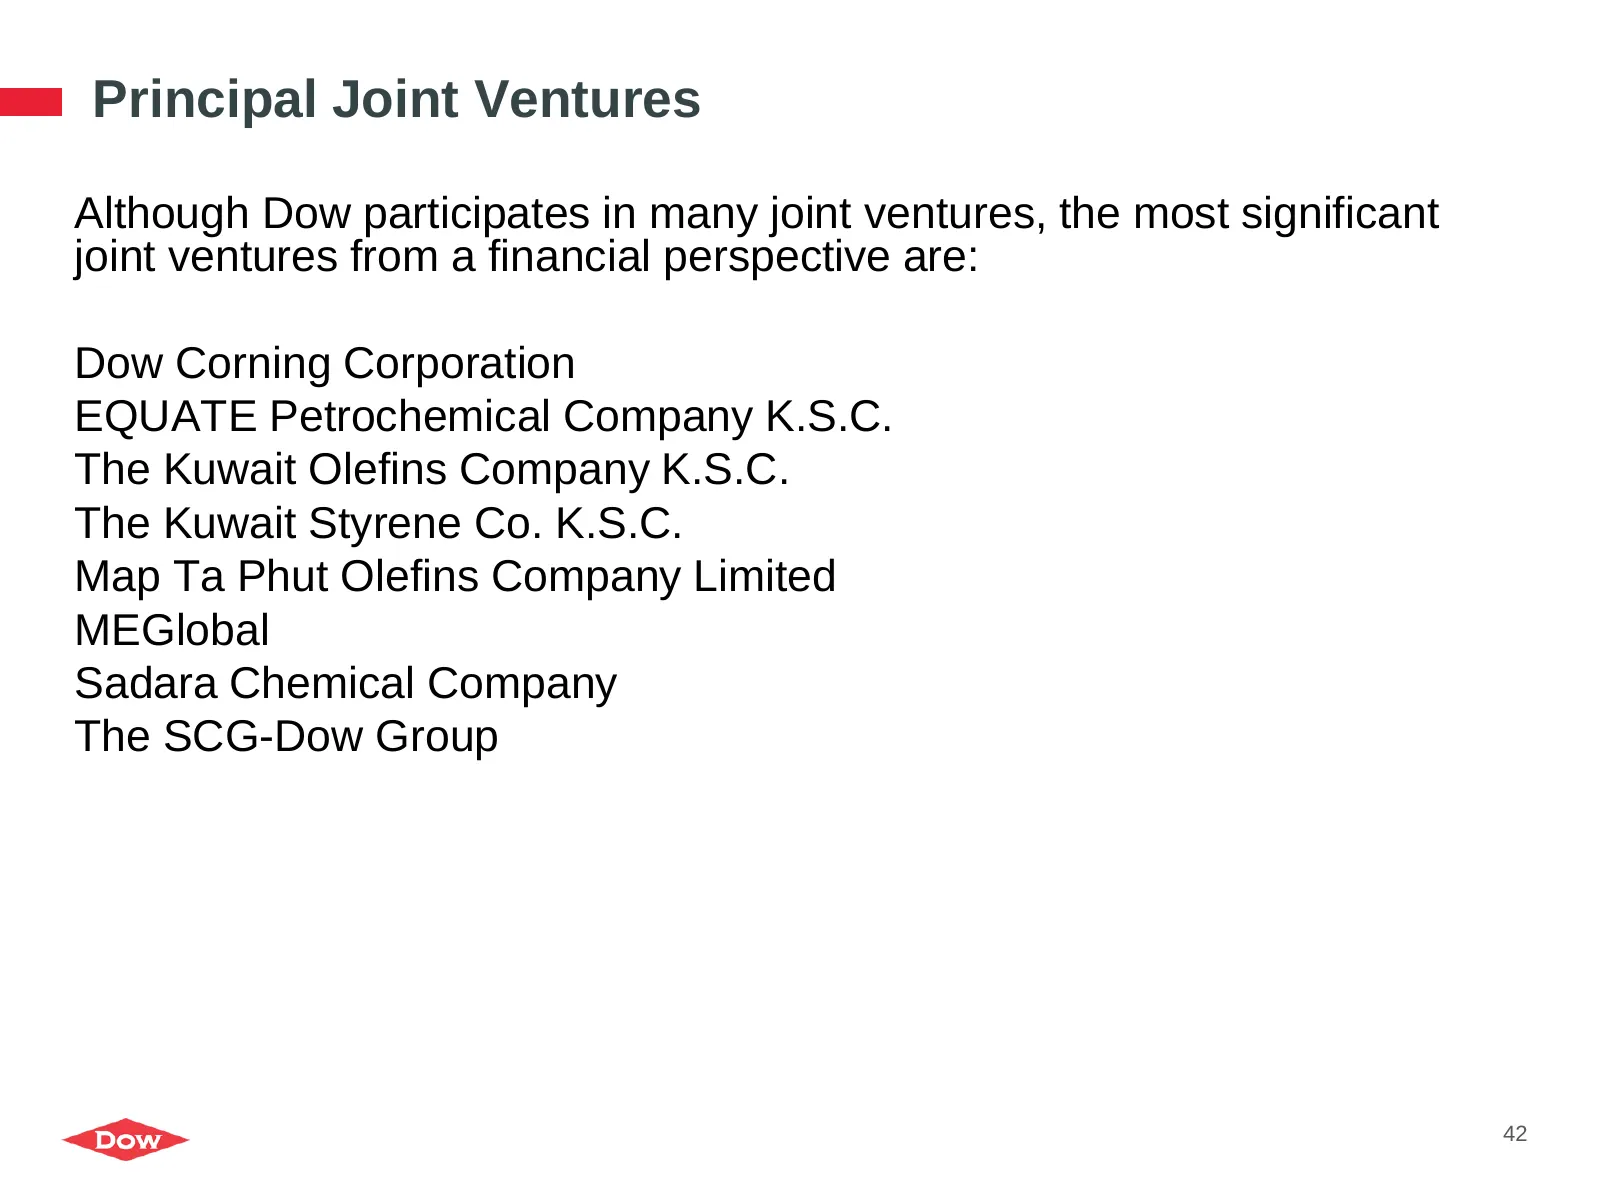
Principal Joint Ventures Although Dow participates in many joint ventures, the most significant joint ventures from a financial perspective are: Dow Corning Corporation EQUATE Petrochemical Company K.S.C. The Kuwait Olefins Company K.S.C. The Kuwait Styrene Co. K.S.C. Map Ta Phut Olefins Company Lim
Slide 43: Preliminary Results for Principal Joint Ventures
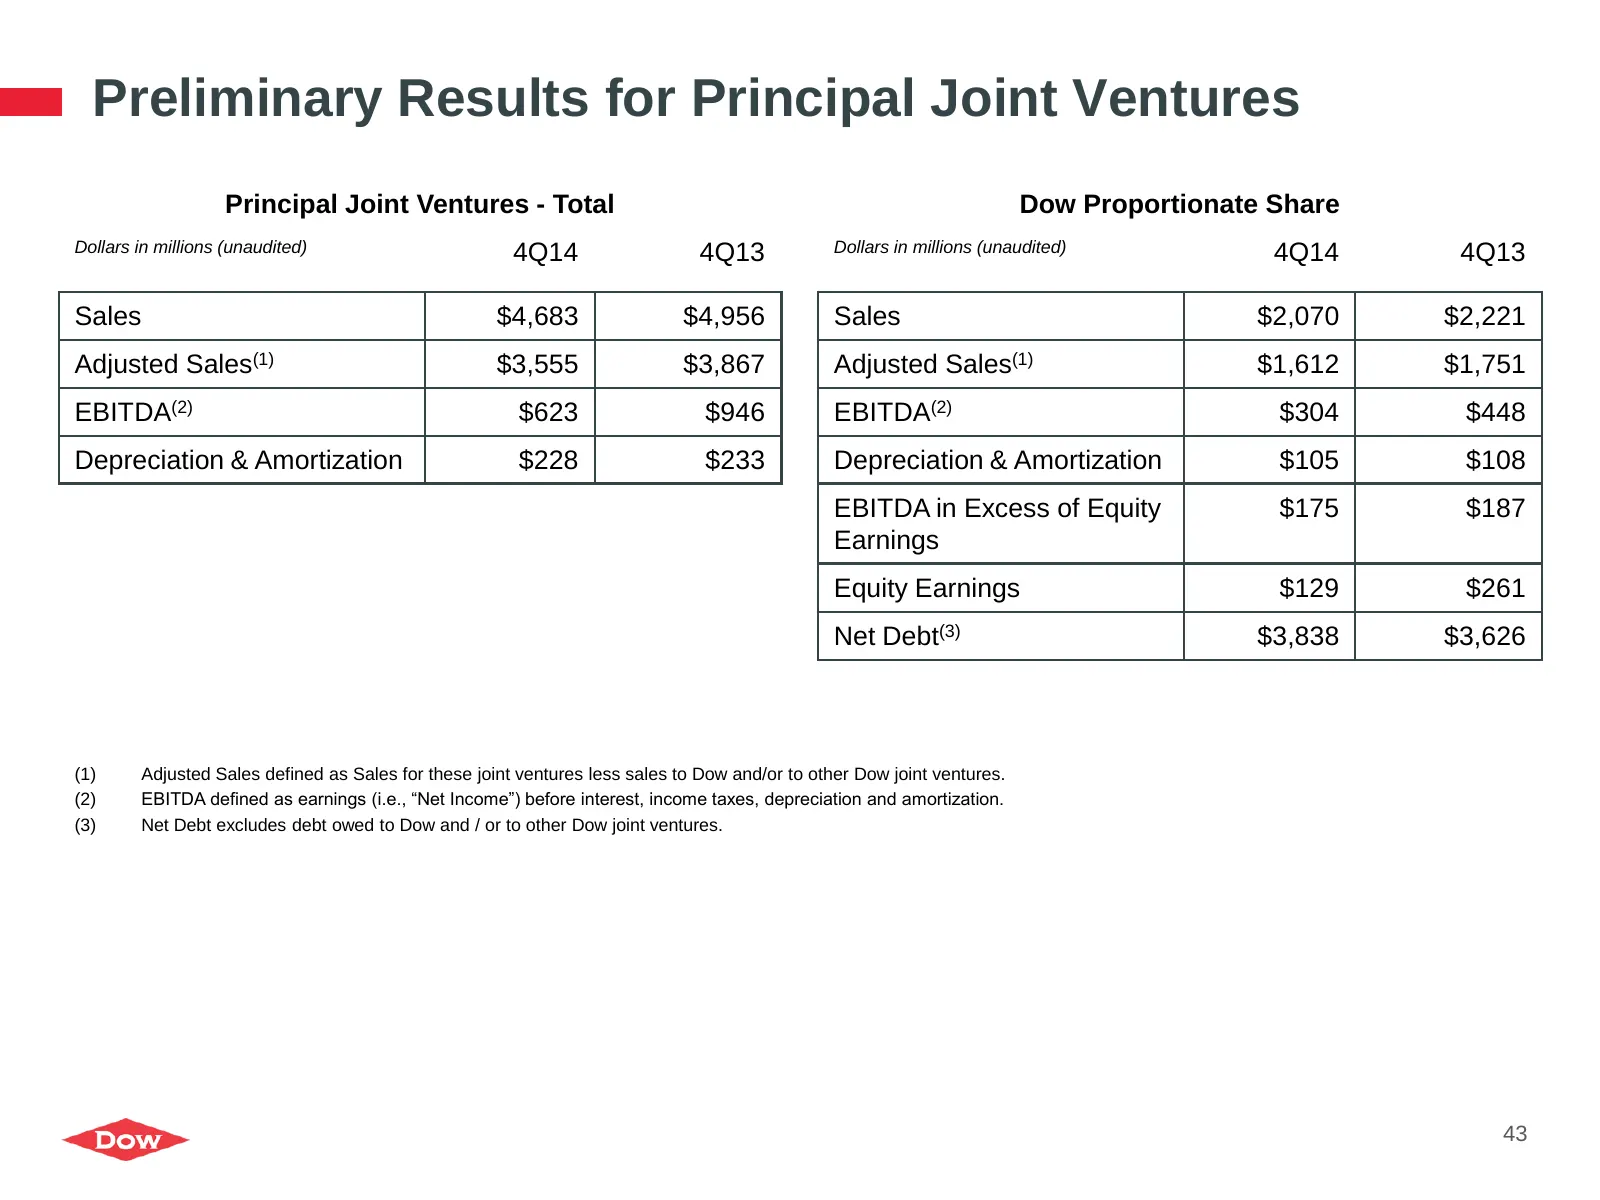
Preliminary Results for Principal Joint Ventures Principal Joint Ventures - Total Dow Proportionate Share Dollars in millions (unaudited) 4Q14 4Q13 Dollars in millions (unaudited) 4Q14 4Q13 Sales $4,683 $4,956 Sales $2,070 $2,221 Adjusted Sales(1) $3,555 $3,867 Adjusted Sales(1) $1,612 $1,751 EBITDA
Slide 44: Preliminary Results for Principal Joint Ventures
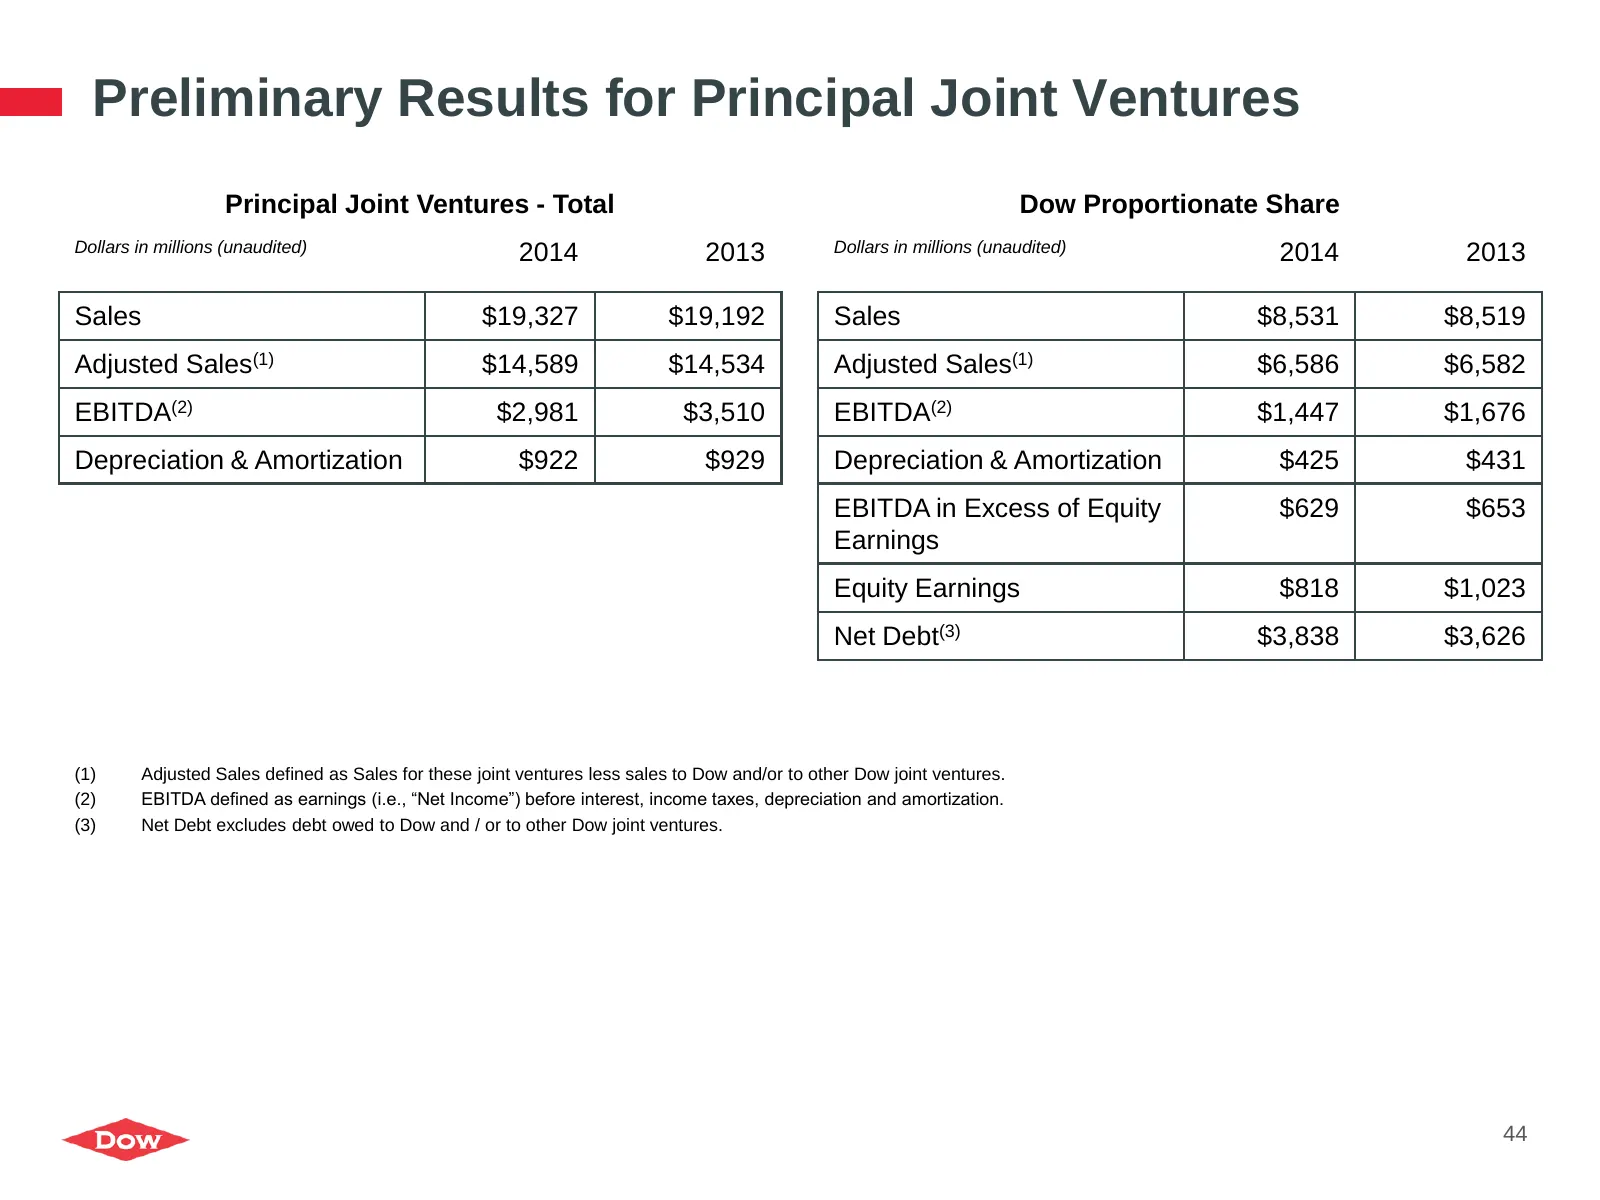
Preliminary Results for Principal Joint Ventures Principal Joint Ventures - Total Dow Proportionate Share Dollars in millions (unaudited) 2014 2013 Dollars in millions (unaudited) 2014 2013 Sales $19,327 $19,192 Sales $8,531 $8,519 Adjusted Sales(1) $14,589 $14,534 Adjusted Sales(1) $6,586 $6,582 EB
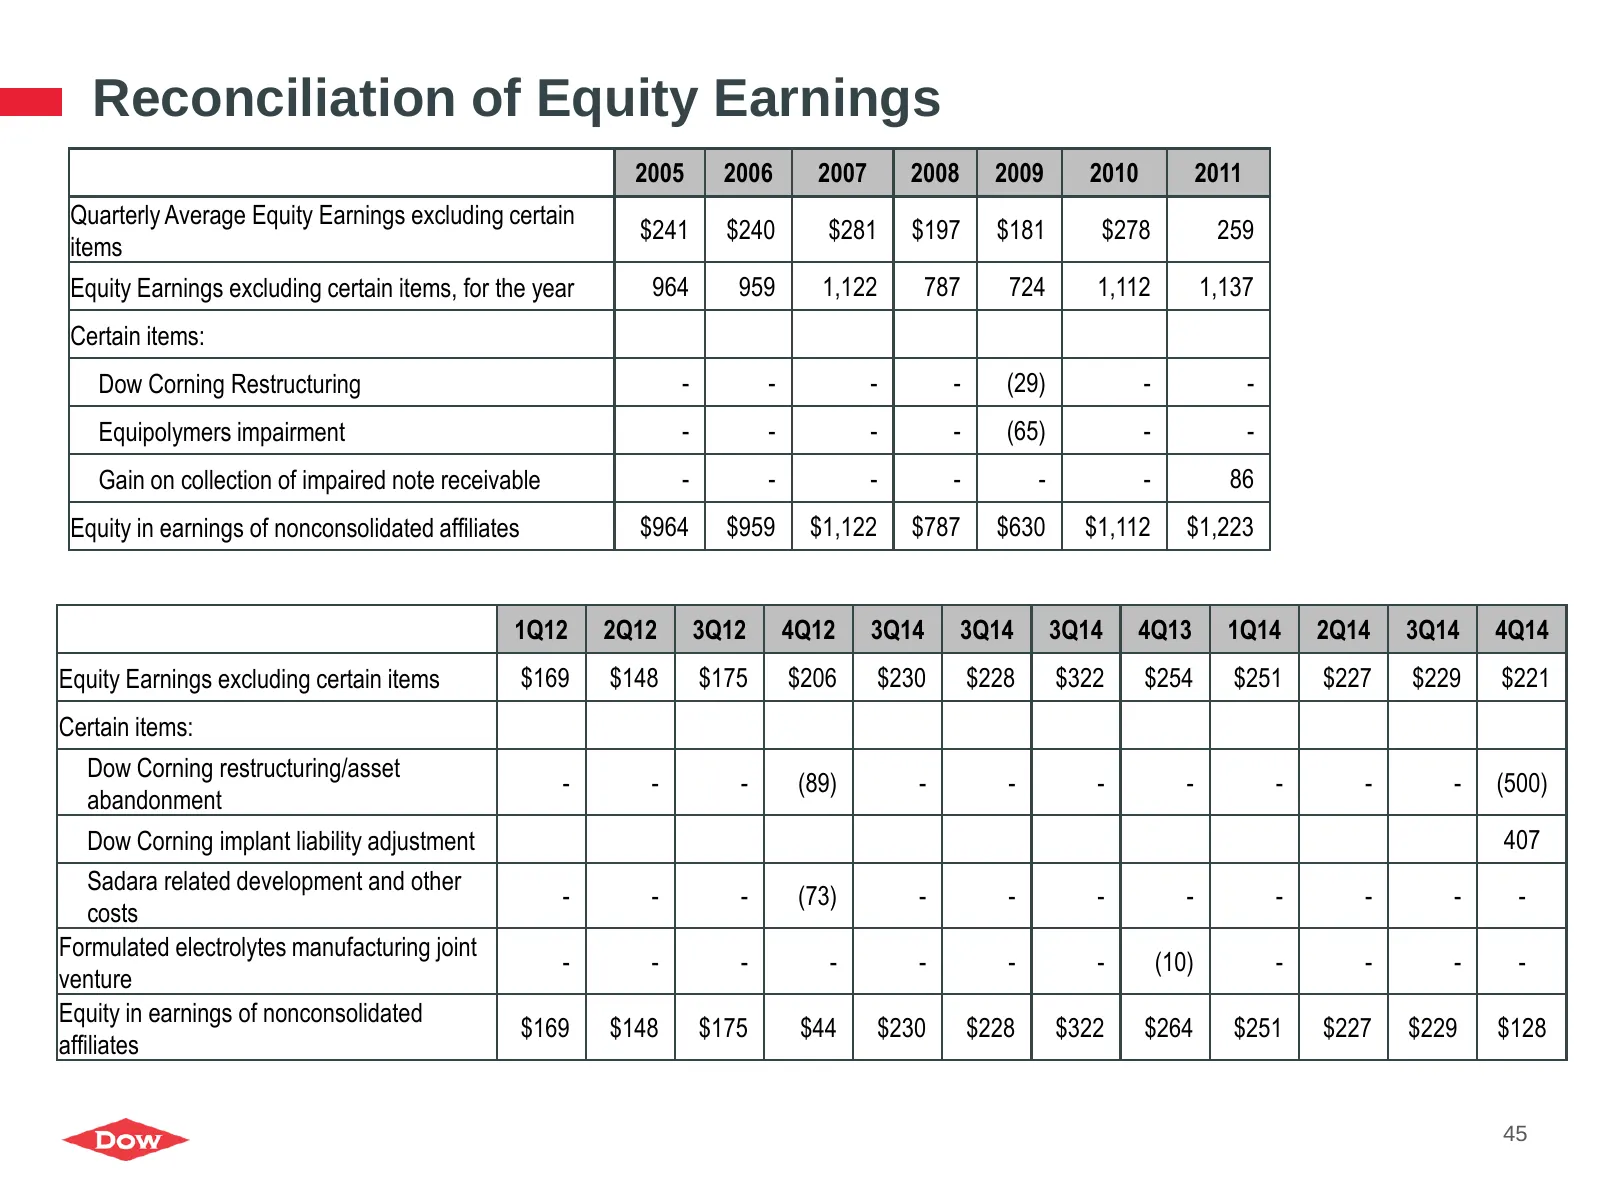
Slide 45: Reconciliation of Equity Earnings
Reconciliation of Equity Earnings 2005 2006 2007 2008 2009 2010 2011 Quarterly Average Equity Earnings excluding certain $241 $240 $281 $197 $181 $278 259 items Equity Earnings excluding certain items, for the year 964 959 1,122 787 724 1,112 1,137 Certain items: Dow Corning Restructuring - - - - (2
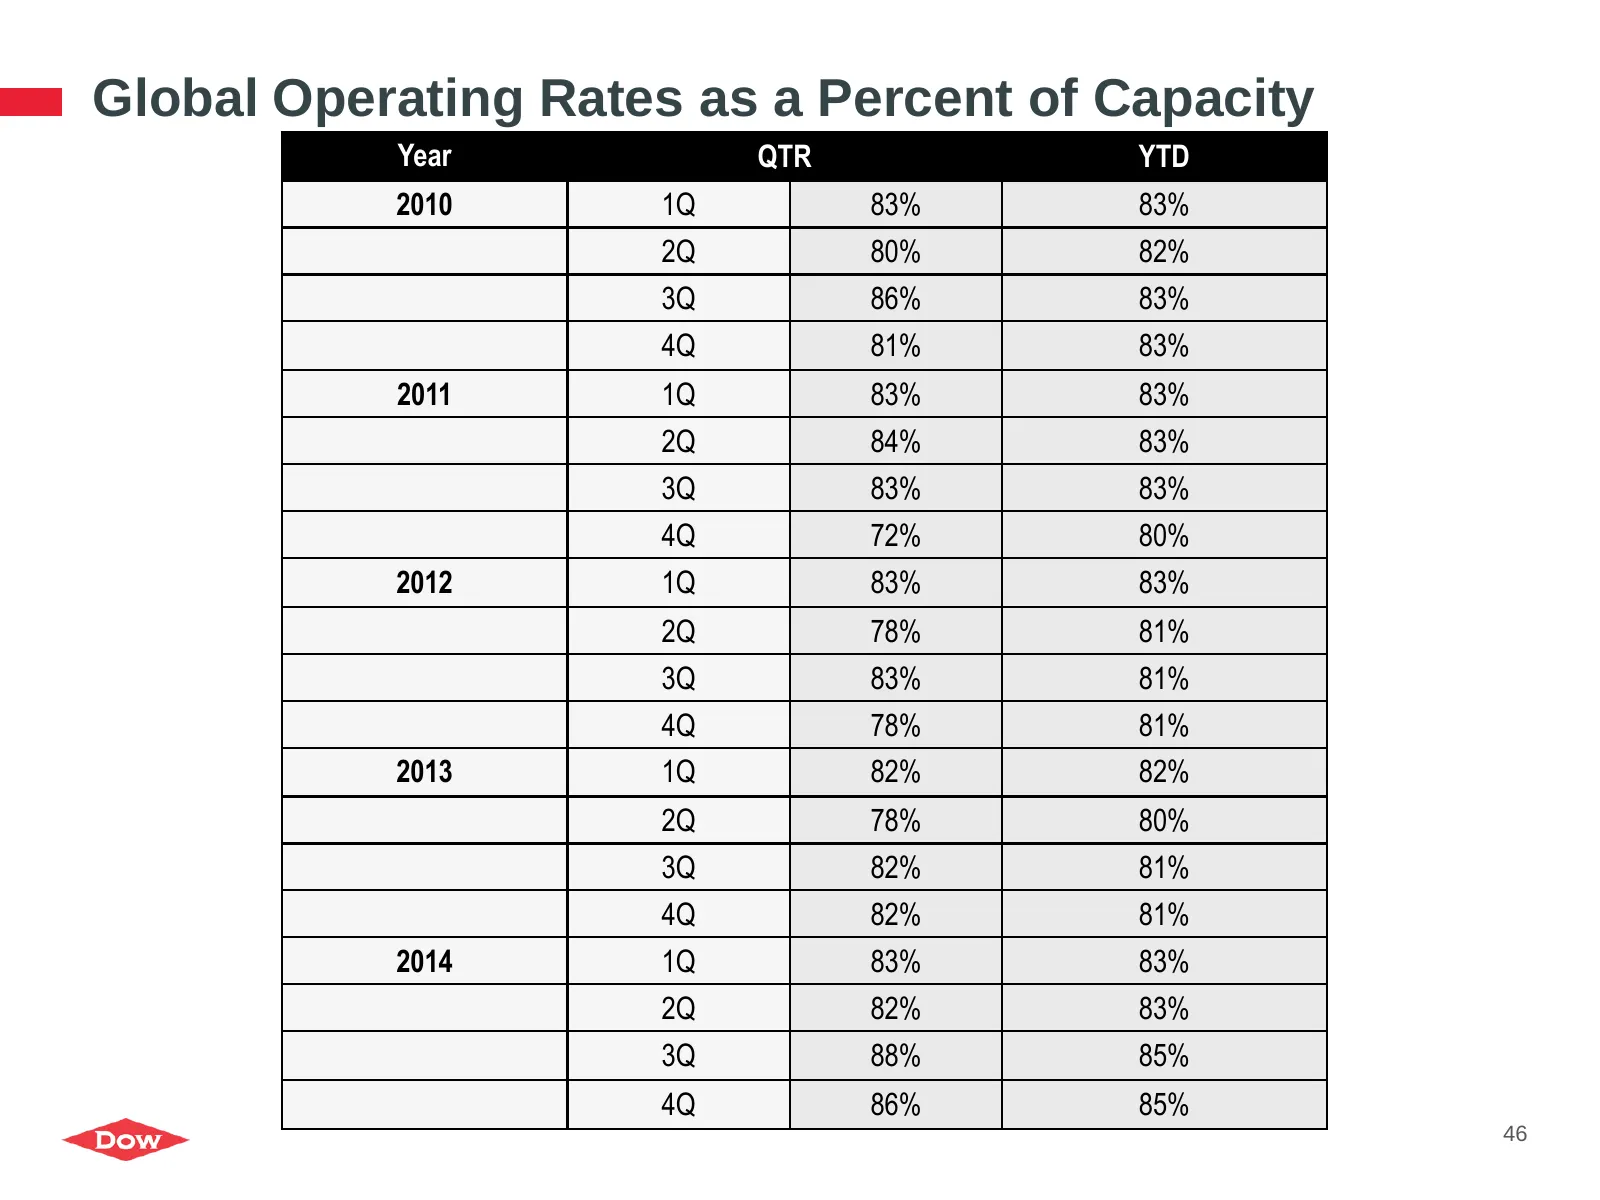
Slide 46: Global Operating Rates as a Percent of Capacity
Global Operating Rates as a Percent of Capacity Year QTR YTD 2010 1Q 83% 83% 2Q 80% 82% 3Q 86% 83% 4Q 81% 83% 2011 1Q 83% 83% 2Q 84% 83% 3Q 83% 83% 4Q 72% 80% 2012 1Q 83% 83% 2Q 78% 81% 3Q 83% 81% 4Q 78% 81% 2013 1Q 82% 82% 2Q 78% 80% 3Q 82% 81% 4Q 82% 81% 2014 1Q 83% 83% 2Q 82% 83% 3Q 88% 85% 4Q 86
Slide 47
Source: Internet Archive copy of dow.com
More decks from The Dow Chemical Company
 Technical Presentation (September 2021)31 slides · September 2021
 Q2 2017 Earnings Presentation34 slides · Jul 27, 2017
 Q2 2016 Earnings Presentation30 slides · Jul 28, 2016
 Merger or Acquisition (March 2016)27 slides · Mar 2, 2016
 Merger or Acquisition (March 2016)27 slides · Mar 1, 2016
 Q4 2015 Earnings Presentation6 slides · Feb 3, 2016