MutualFirst Financial — Investor Presentation (April 2010)
45 slides from MutualFirst Financial's investor presentation, Apr 29, 2010
Slide 1: MutualFirst Financial, Inc.
MutualFirst Financial, Inc.

Slide 2: MutualFirst Financial, Inc.
MutualFirst Financial, Inc.
Slide 3: MutualFirst Financial, Inc.
MutualFirst Financial, Inc.

Slide 4: Forward Looking Statement
Forward Looking Statement This presentation contains statements which constitute forward looking statements within the meaning of the Private Securities Litigation ReformAct of 1995. These statements may appear in a number of places in this presentation and include statements regarding the intent, b
Slide 5: Broad Economic Overview
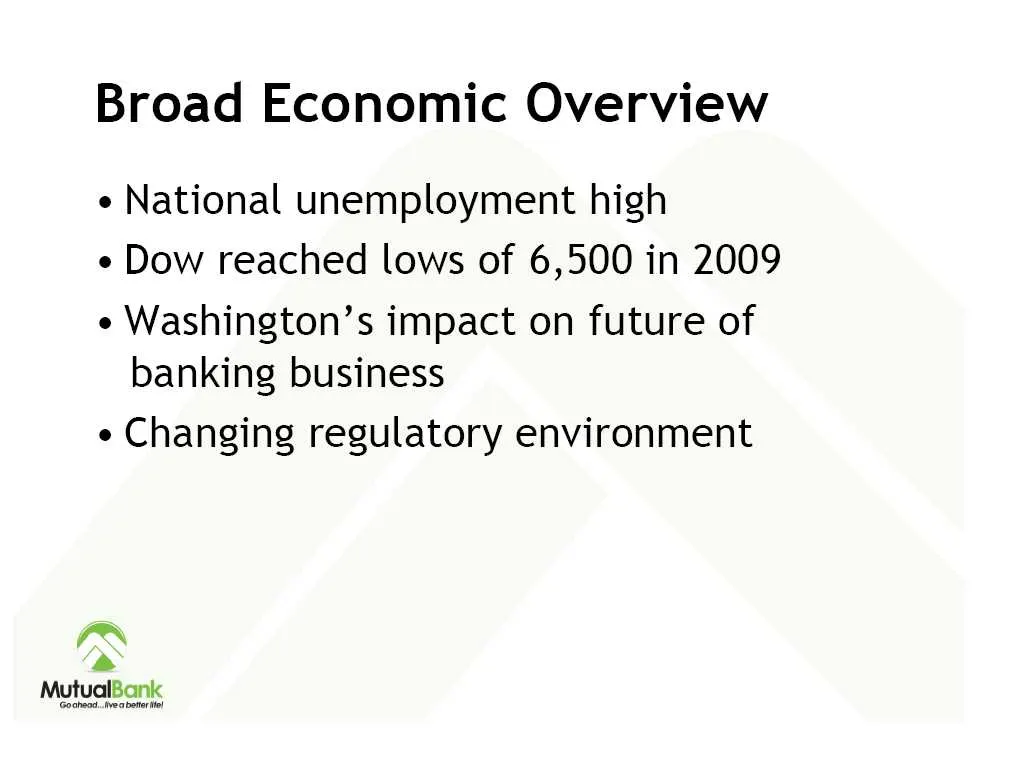
Broad Economic Overview e National unemployment high e Dow reached lows of 6,500 in 2009 e Washington’s impact on future of banking business e Changing regulatory environment v~ a MutualBank
Slide 6: MutualBank's Market
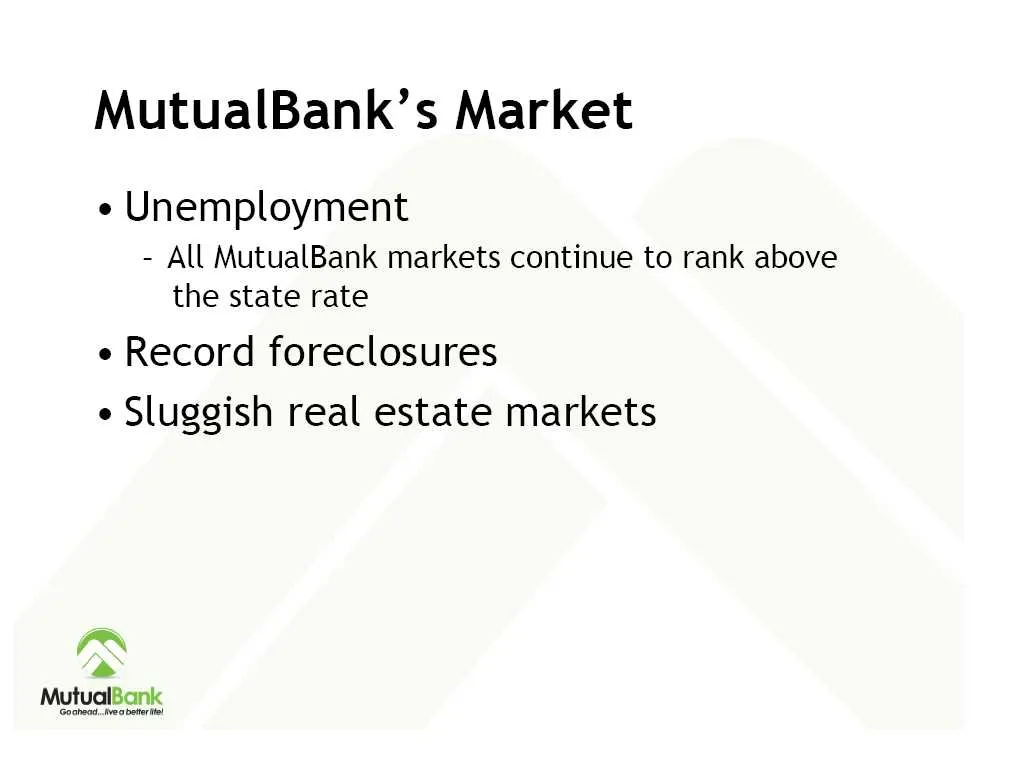
MutualBank’s Market e Unemployment - All MutualBank markets continue to rank above the state rate e Record foreclosures e Sluggish real estate markets
Slide 7: MutualFirst Financial, Inc.
MutualFirst Financial, Inc.
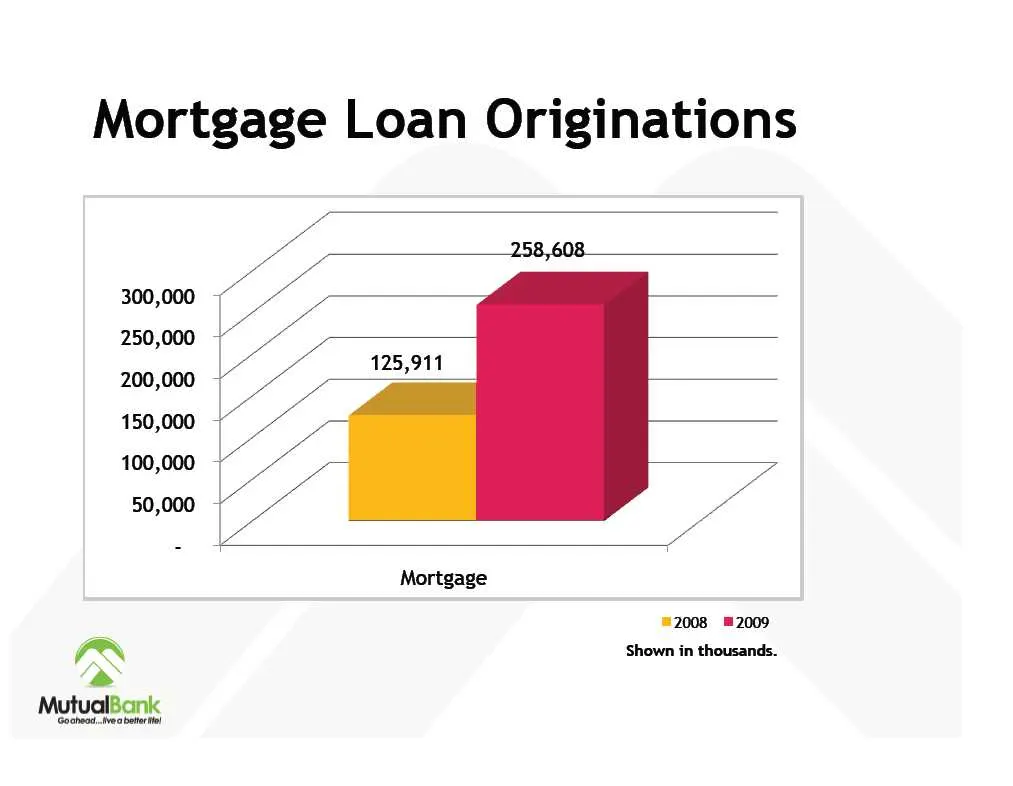
Slide 8: Mortgage Loan Originations
Mortgage Loan Originations Mortgage 2008 ™2009 7~ Shown in thousands.
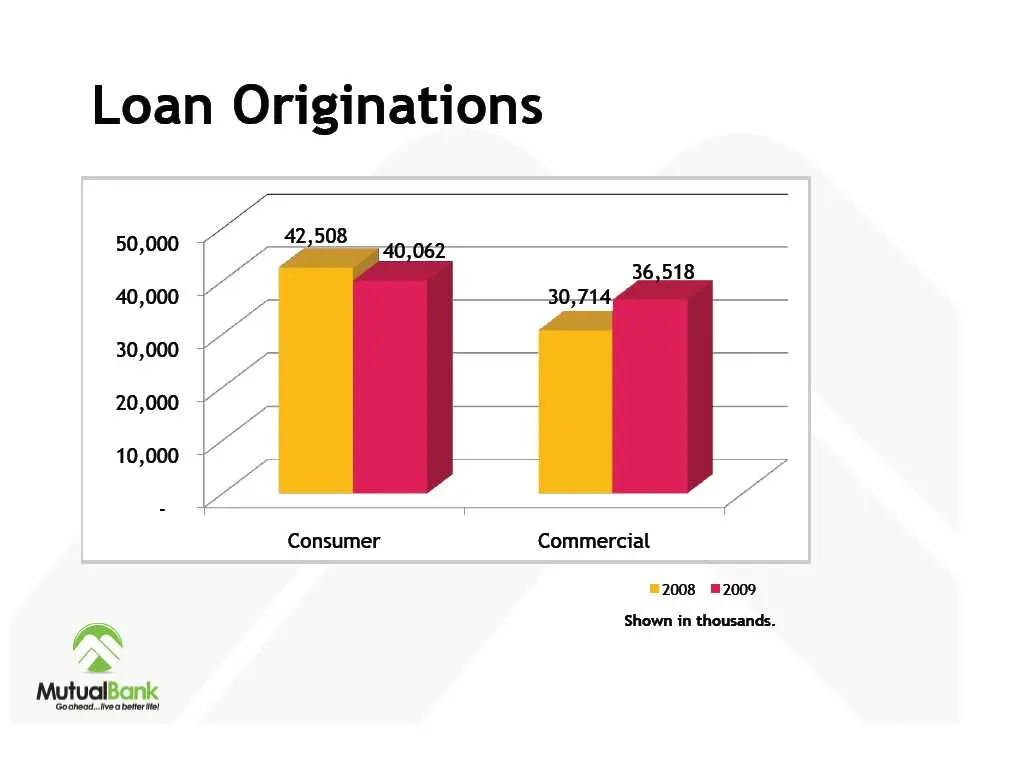
Slide 9: Loan Originations
Loan Originations 50,000 40,000 30,000 20,000 - 10,000 ~~ Consumer Commercial =2008 ™2009 . Shown in thousands. oS MutualBankk
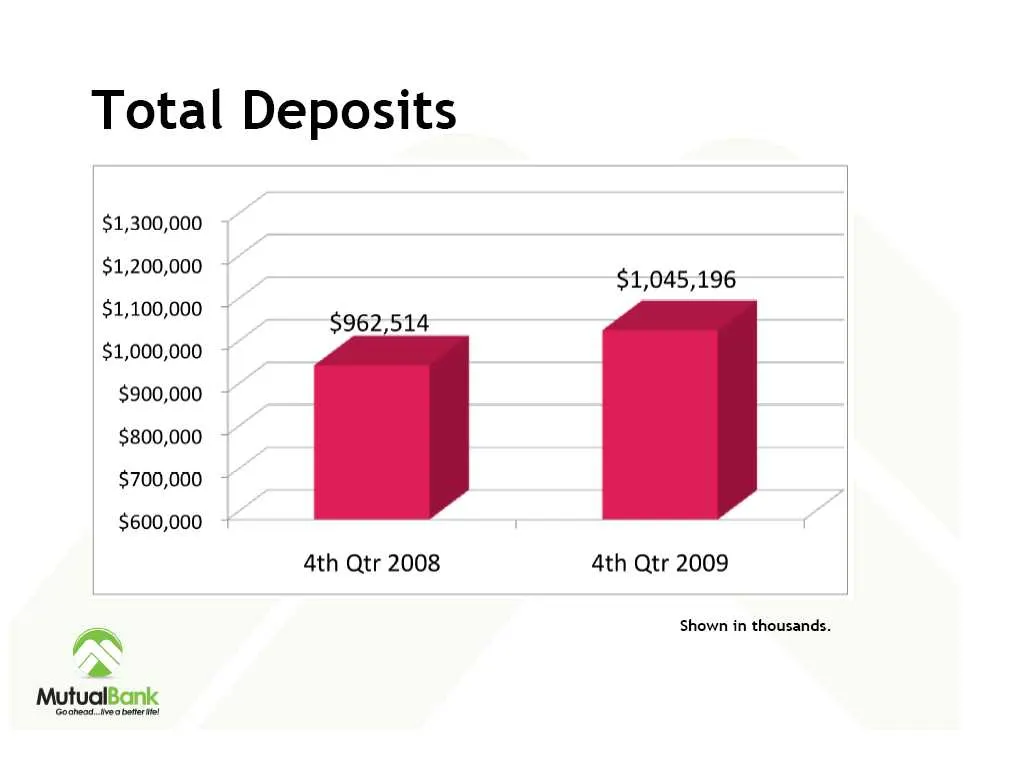
Slide 10: Total Deposits
Total Deposits $1,300,000 $1,200,000 $1,100,000 $900,000 $800,000 $700,000 $600,000 $1,000,000 ~ $962,514 4th Qtr 2008 $1,045,196 4th Qtr 2009 Shown in thousands.
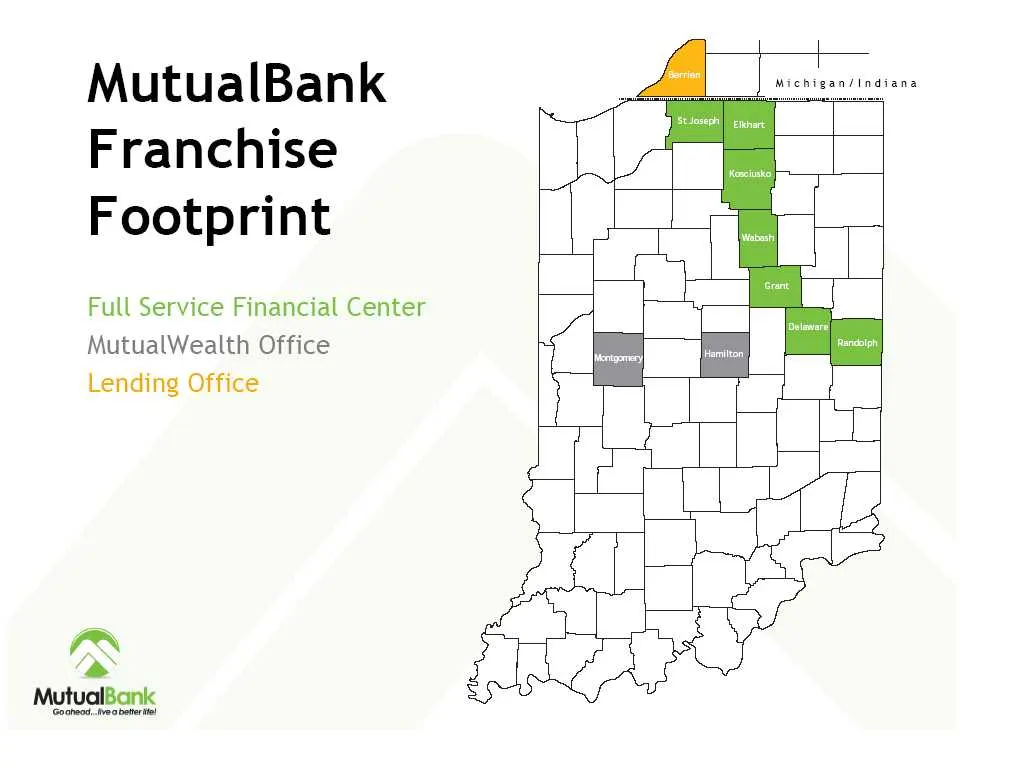
Slide 11: MutualBank Franchise Footprint
MutualBank Franchise Footprint Full Service Financial Center MutualWealth Office Lending Office ~~ C WIS MutualBanic (Gooheod rea bateritel

Slide 12: Trust
Trust Investment Retirement Plan Services a MutualWealth Management Group

Slide 13: Retirement Plans
Retirement Plans Mutual Funds Annuities 529 Plans Stocks & Bonds 401k Rollovers MutualFinancial Investment Services
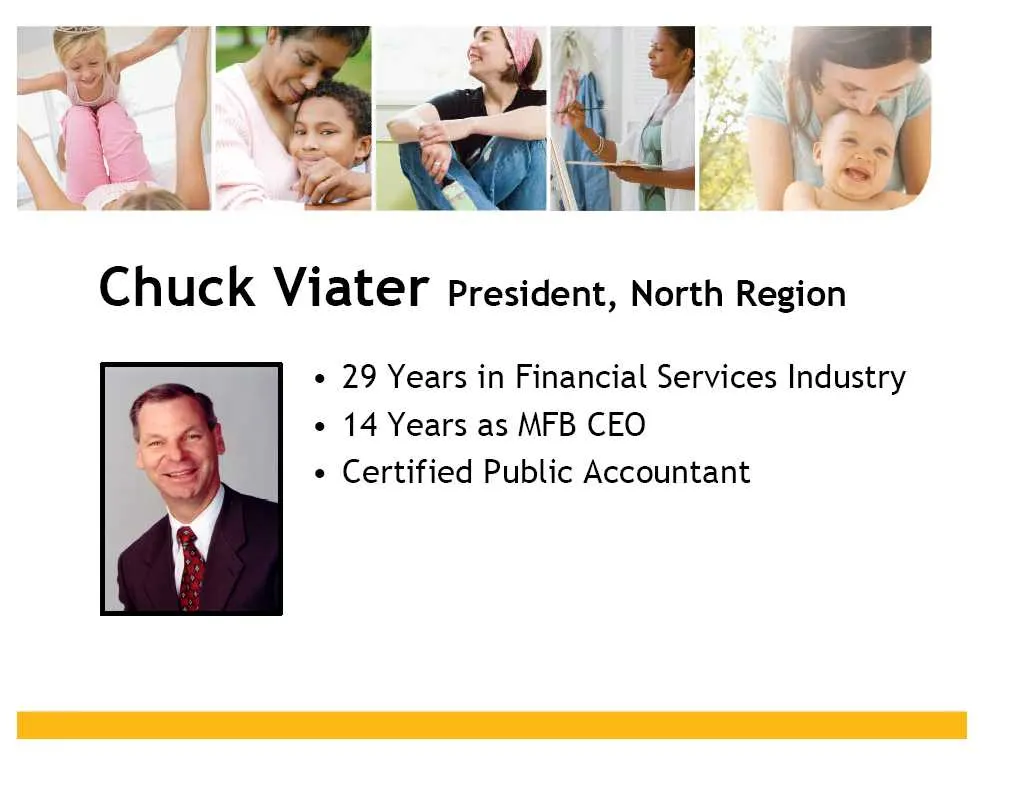
Slide 14: Chuck Viater, President, North Region
Chuck Viater President, North Region ¢ 29 Years in Financial Services Industry ¢ 14 Years as MFB CEO ¢ Certified Public Accountant

Slide 15: Trust
Trust Investment Retirement Plan Services Ca MutualWealth Management Group

Slide 16: Steve Selby, SVP
Steve Selby svp Divisional Manager of Operations e 45+ Years of Service to MutualBank

Slide 17: Tim McArdle, SVP, Chief Financial Officer
wi Tim McArdle svp, chief Financial Officer ¢ 25+ Years as CFO for MutualBank ¢ Serving as Financial Analyst ¢ Certified Public Accountant
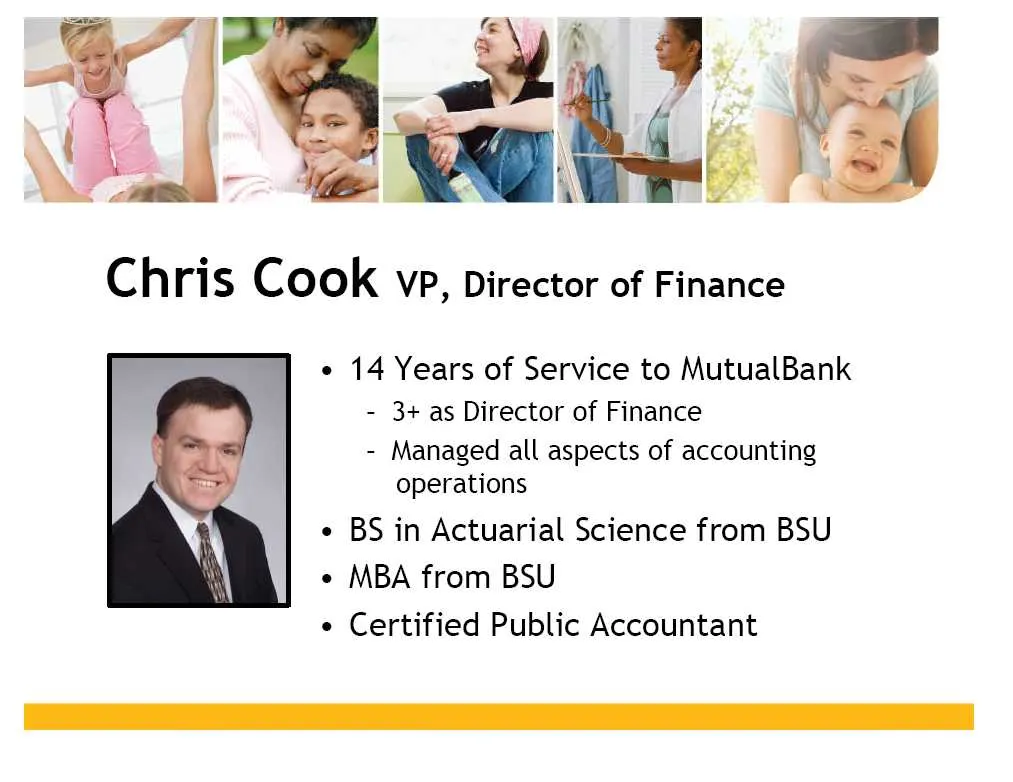
Slide 18: Years of Service to MutualBank
14 Years of Service to MutualBank - 3+ as Director of Finance - Managed all aspects of accounting operations BS in Actuarial Science from BSU MBA from BSU Certified Public Accountant
Slide 19: MutualFirst Financial, Inc.
MutualFirst Financial, Inc.
Slide 20: Total Assets
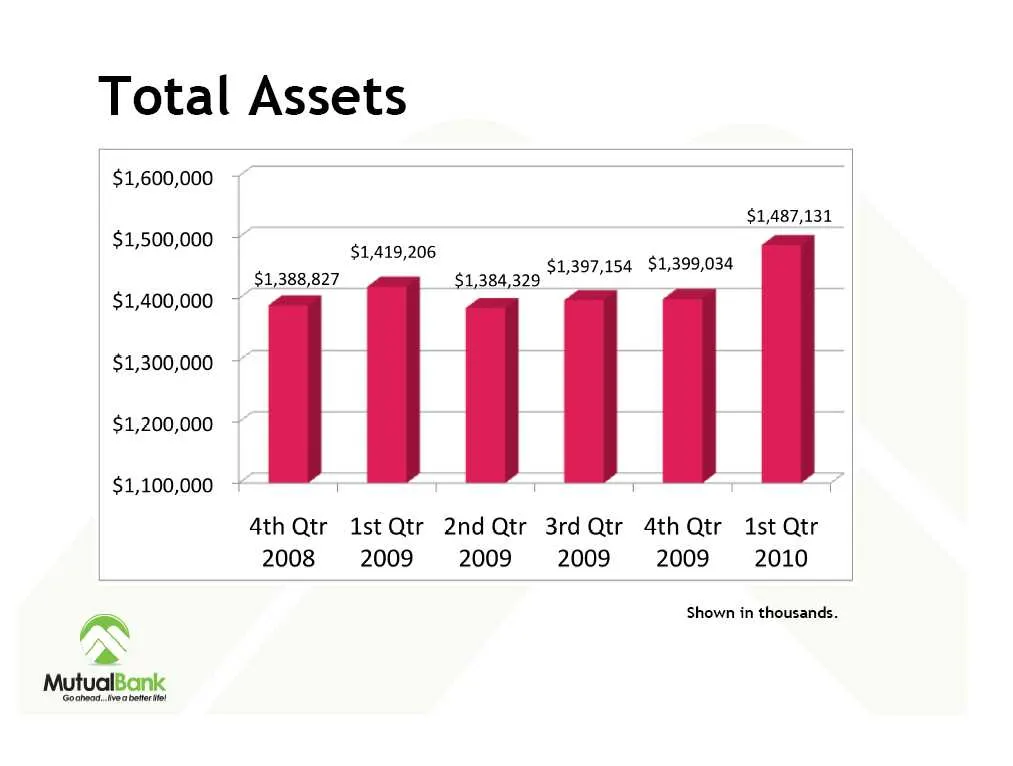
Total Assets $1,600,000 $1,500,000 ~ $1,400,000 ~ $1,300,000 ~ $1,200,000 $1,100,000 + $1,487,131 $1,419,206 1,397,154 $1,399,034 ] i] j | | | | 4th Qtr 1stQtr 2ndQtr 3rdQtr 4th Qtr 1st Qtr 2008 2009 2009 2009 2009 2010 ‘Shown in thousands.
Slide 21: Balance Sheet Structure
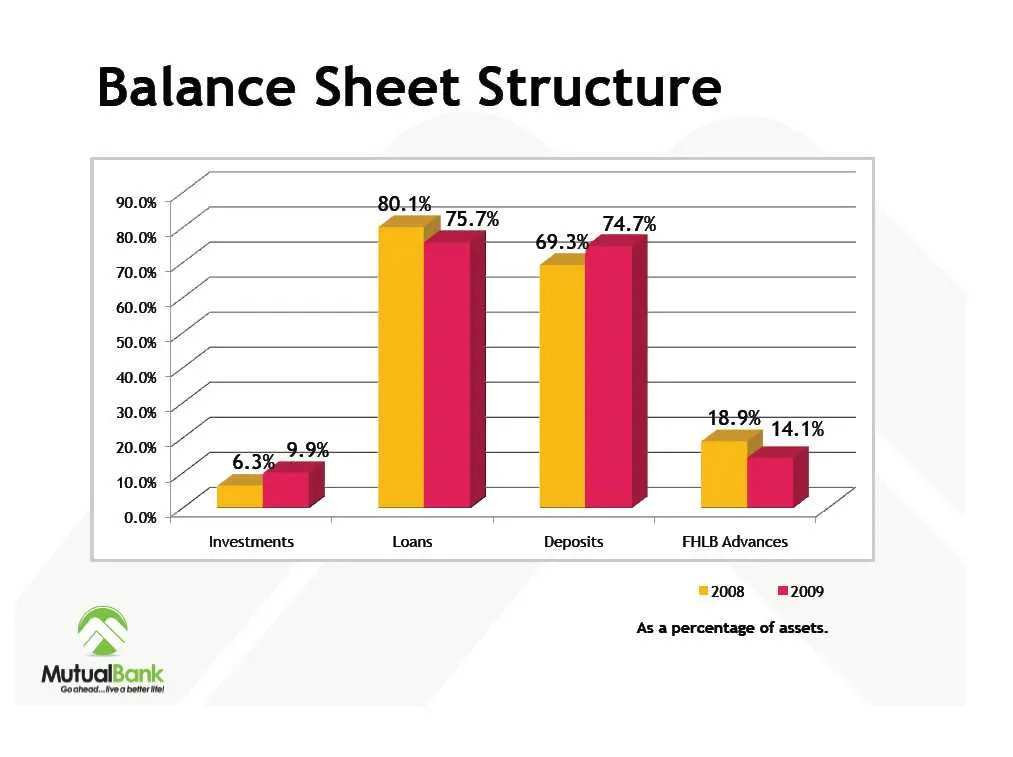
Balance Sheet Structure 90.0% 80.1% som 75.7% : 74.7% 70.0% ~ 60.0% 50.0% ~ 40.0% 2.08 18-96 41% a" 5 10.0% ~ 0.0% T Investments Loans Deposits FHLB Advances ©2008 ™2009 aS (As a percentage of assets. MutualBank
Slide 22: Total Deposits
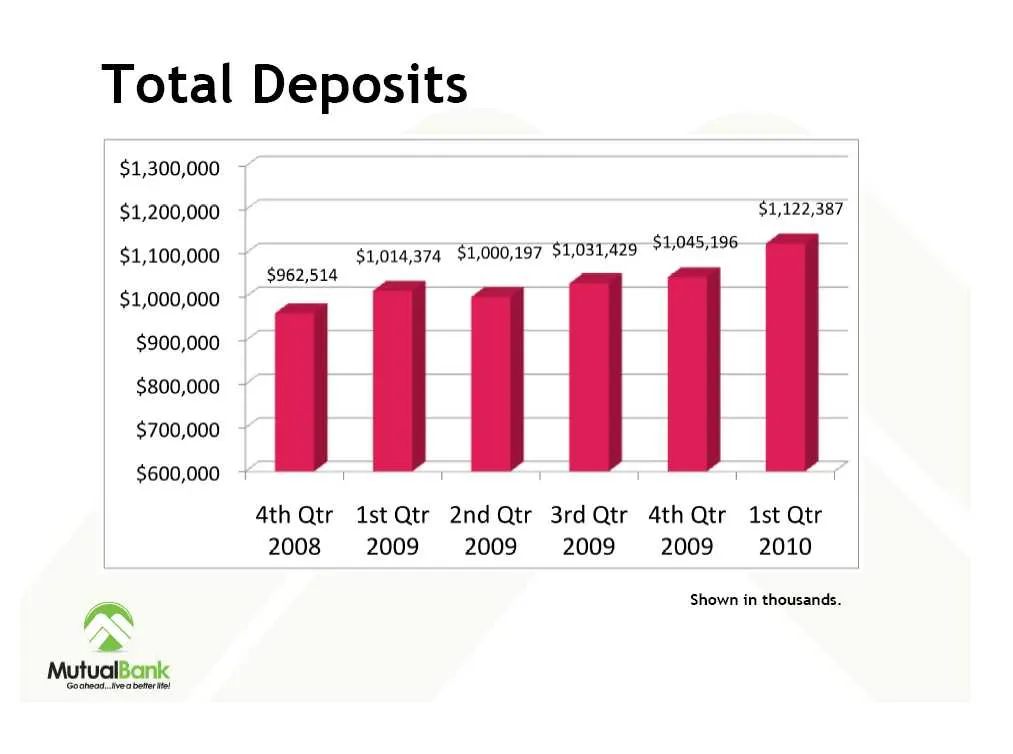
Total Deposits $1,300,000 $1,200,000 $1,100,000 $1,000,000 $900,000 $800,000 $700,000 $600,000 $1,122,387 $1,014,374 $1,000,197 $1,031,429 $40457496 ] | | T | ] 1 ] 4th Qtr 1stQtr 2ndQtr 3rdQtr 4thQtr 1st Qtr 2008 2009 2009 2009 2009 2010 Shown in thousands.
Slide 23: Deposit Mix
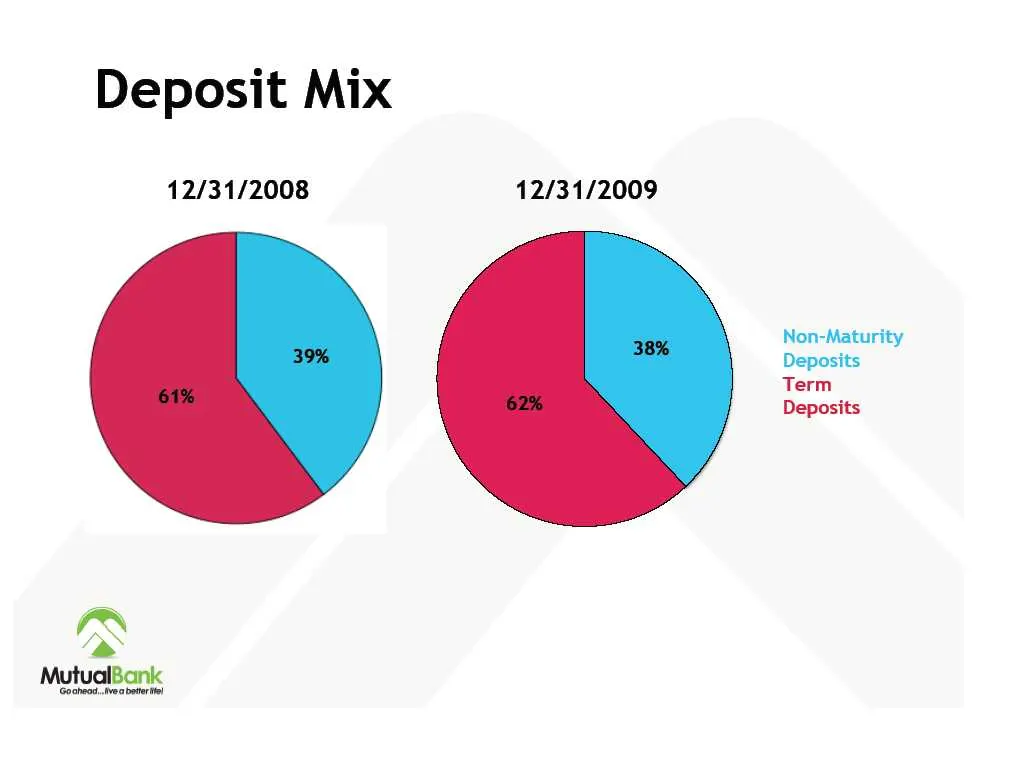
Deposit Mix 12/31/2008 12/31/2009 Non-Maturity Deposits Term Deposits
Slide 24: Loans Receivable
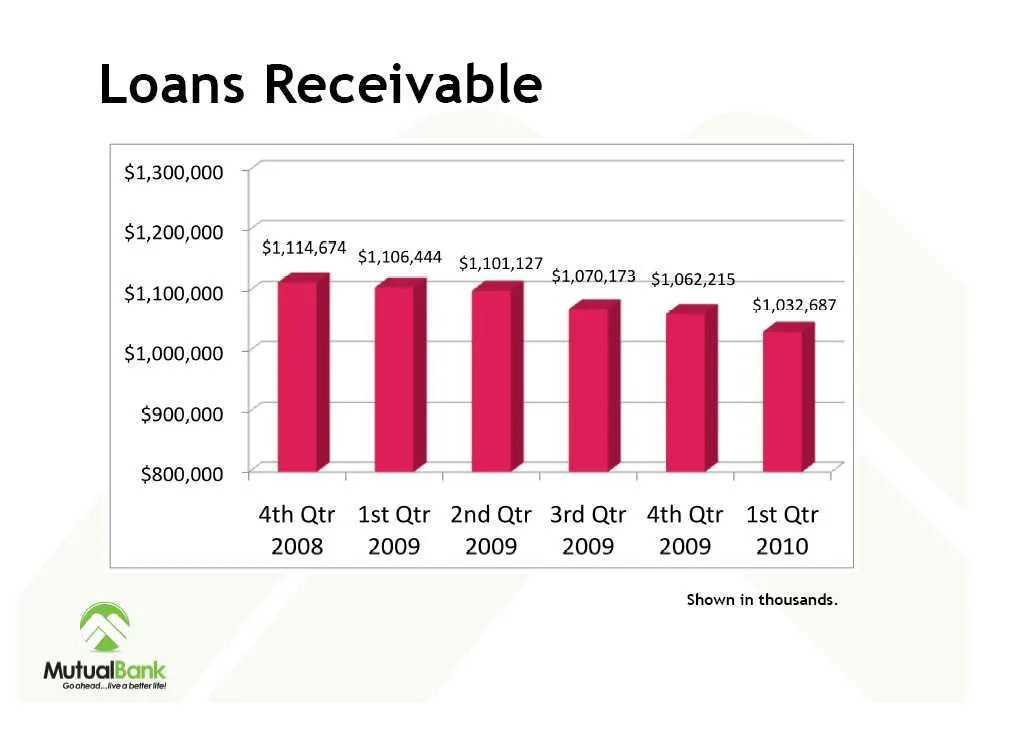
Loans Receivable $1,300,000 92,200,000 Tt ssiera cade $1,106,444 $1 101,127 $1,070,173 $1,062,215. $1,100,000 $1,032,687 $1,000,000 $900,000 ~ | | $800,000 ~ 4th Qtr 1stQtr 2ndQtr 3rd Qtr 4th Qtr 1st Qtr 2008 2009 2009 2009 2009 2010 n Shown in thousands.
Slide 25: Loan Mix
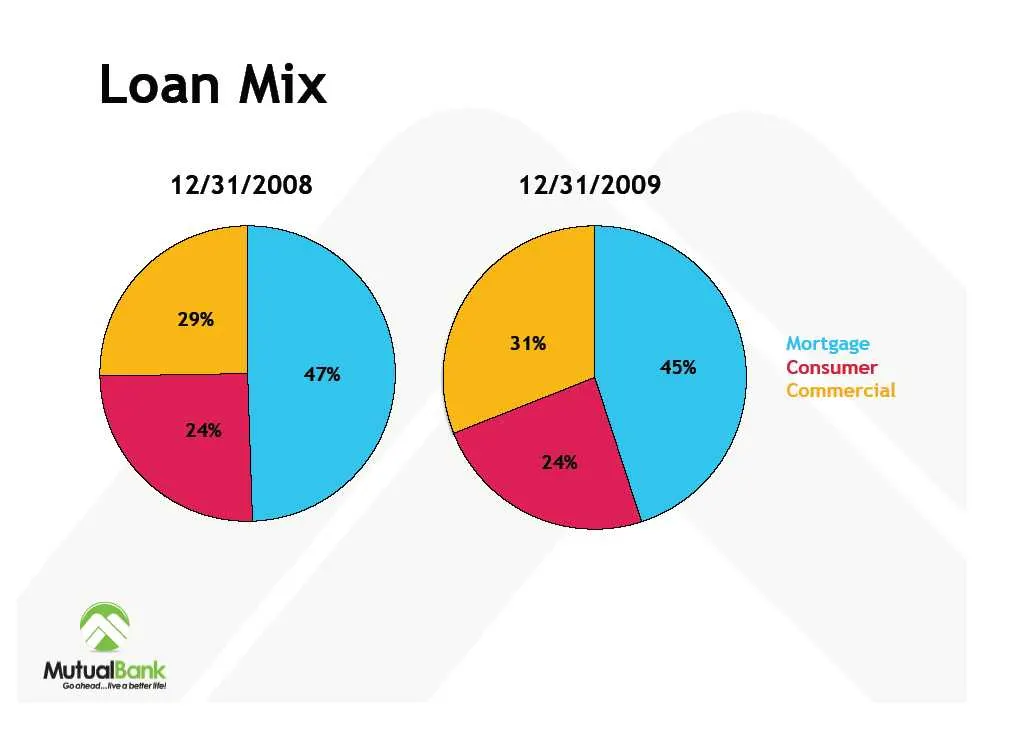
Loan Mix 12/31/2008 12/31/2009 Mortgage Consumer Commercial
Slide 26: Net Interest Margin
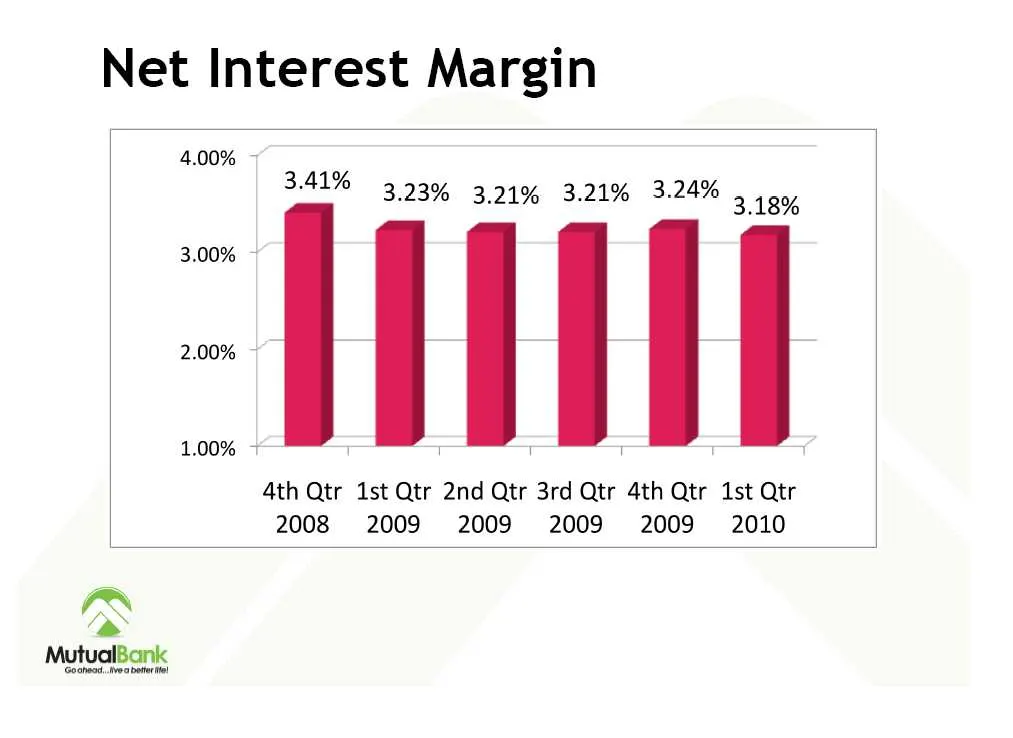
Net Interest Margin 4.00% 3.00% 2.00% 1.00% 3.41% 3.23% 3.21% 3.21% 3.24% 5 106, Ath Qtr 1st Qtr 2nd Qtr 3rd Qtr 4th Qtr 1st Qtr 2008 2009 2009 2009 2009 2010
Slide 27: Net Interest Income
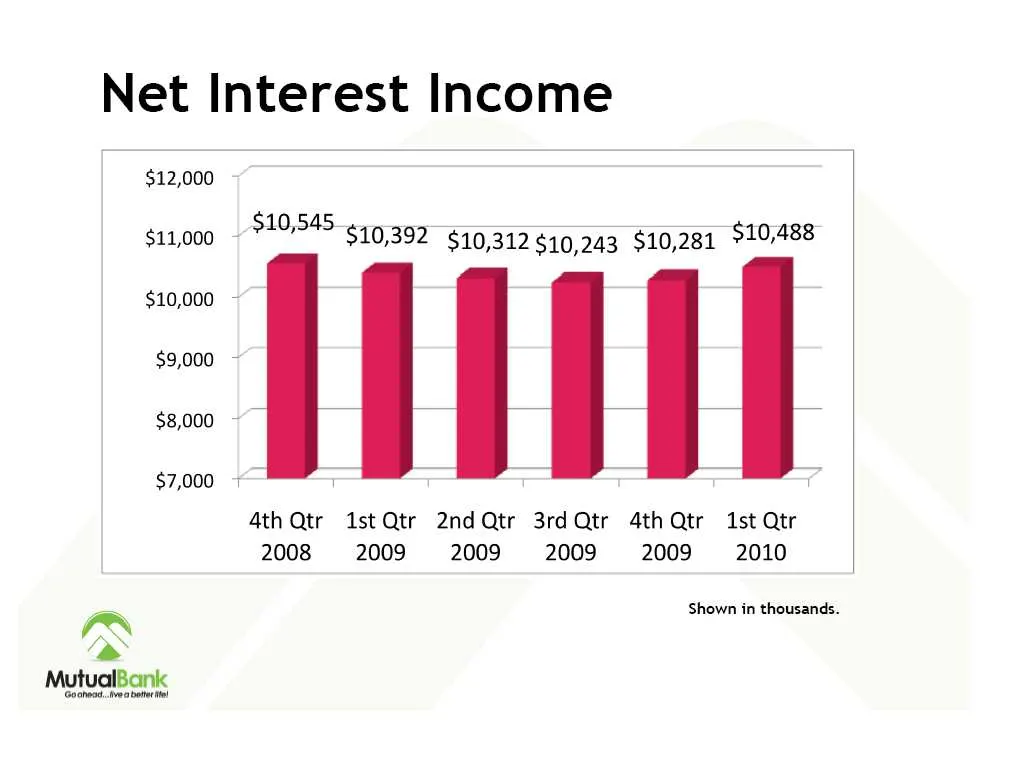
Net Interest Income $12,000 10,545. " $11,000 $10, $10,392 $10,312 $10,243 $10,281 $10,488 $10,000 ~ $9,000 ~ $8,000 ~ | $7,000 Ath Qtr 1stQtr 2ndQtr 3rdQtr 4th Qtr 1st Qtr 2008 2009 2009 2009 2009 2010 Shown in thousands. lax as MutualBanic \Goahead Area Bote

Slide 28: Credit Quality
EX ¥ i | of 3 Pig WS i — fay f z q rf 9 | ' {i _ \ : s i H L Credit Quality
Slide 29: Non Performing Assets/Total Assets
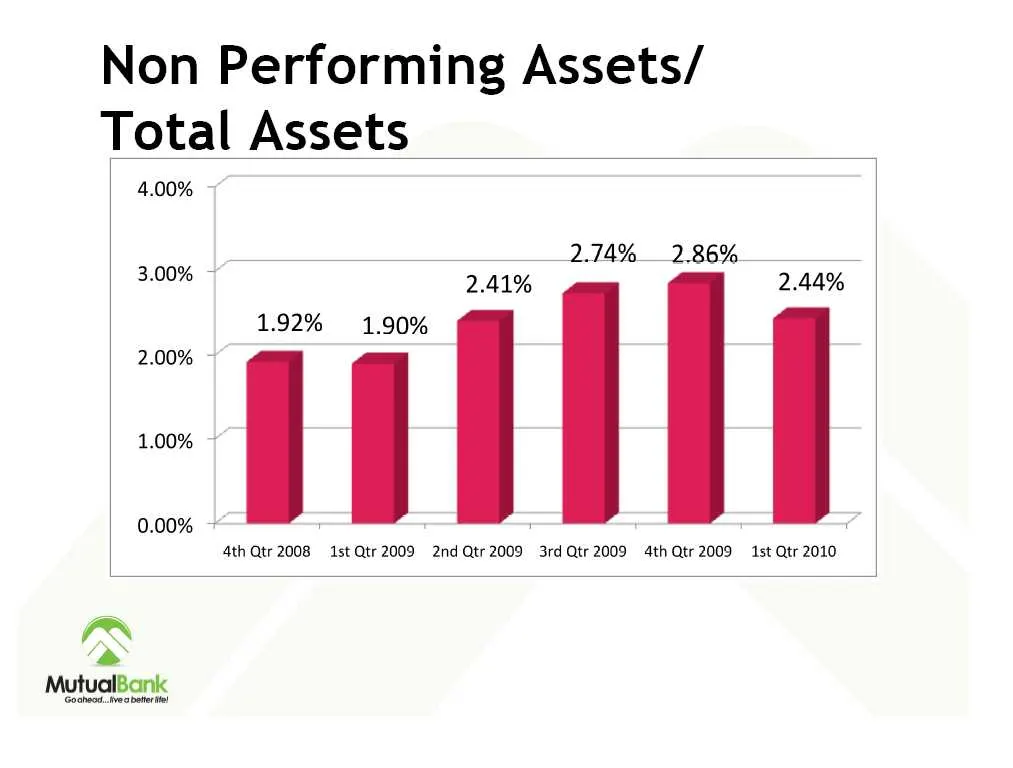
Non Performing Assets/ Total Assets 4.00% 2.74% 2.86%. 3.00% — 2.41% 2.44% 1.92% 1.90% 2.00% ~ _ | | 0.00% ~ ; ; i Ath Qtr 2008 1st Qtr 2009 2nd Qtr 2009 3rd Qtr 2009 4th Qtr 2009 1st Qtr 2010 a MutualBanic \Goaheod Averett
Slide 30: Non Performing Loans/Total Loans
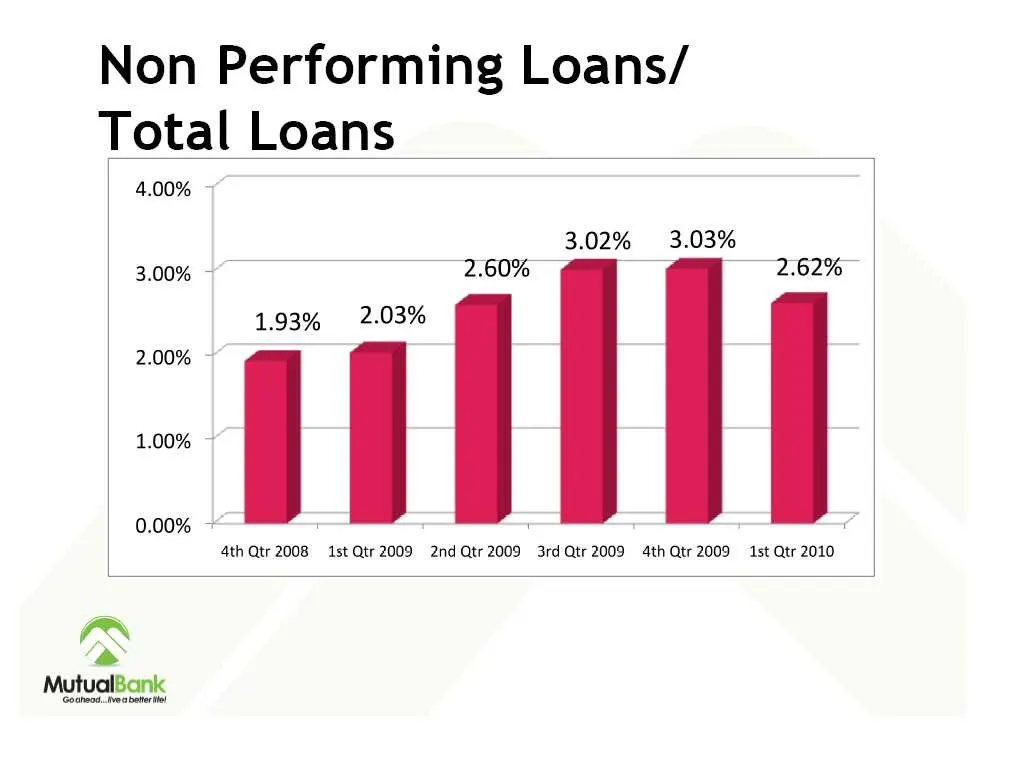
Non Performing Loans/ Total Loans 4.00% 3.02% 3.03% 3.00% ~ 2.60% 2.62% 1.93% 2.03% 2.00% 1.00% ~ | 0.00% ~ —_ ; ; 4th Qtr 2008 1st Qtr 2009 2nd Qtr 2009 3rd Qtr 2009 4th Qtr 2009 1st Qtr 2010
Slide 31: Net Charge-Offs/Average Loans
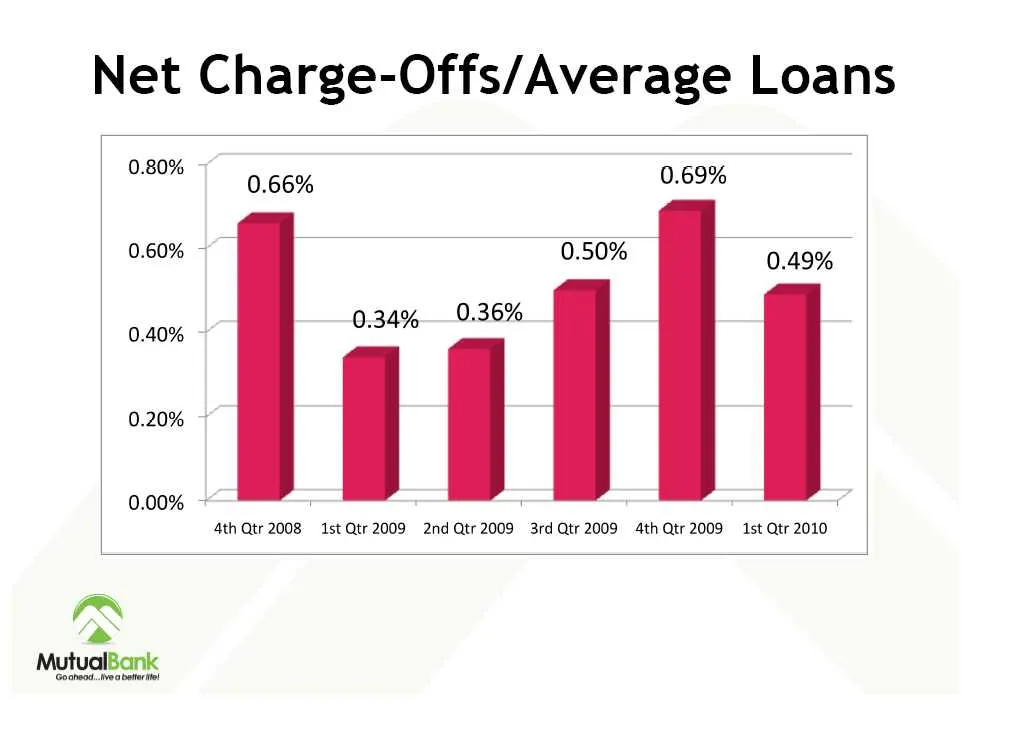
Net Charge-Offs/Average Loans 0.80% 7 4 geo 0.69% 0.60% ~ | 0.50% 0:46% 0.40% 0.34% 0.36% 0.20% ~ | | 0.00% ~ | Ath Qtr 2008 1st Qtr 2009 2nd Qtr 2009 3rd Qtr 2009 4th Qtr 2009 1st Qtr 2010
Slide 32: Allowance for Loan Loss/Total Loans
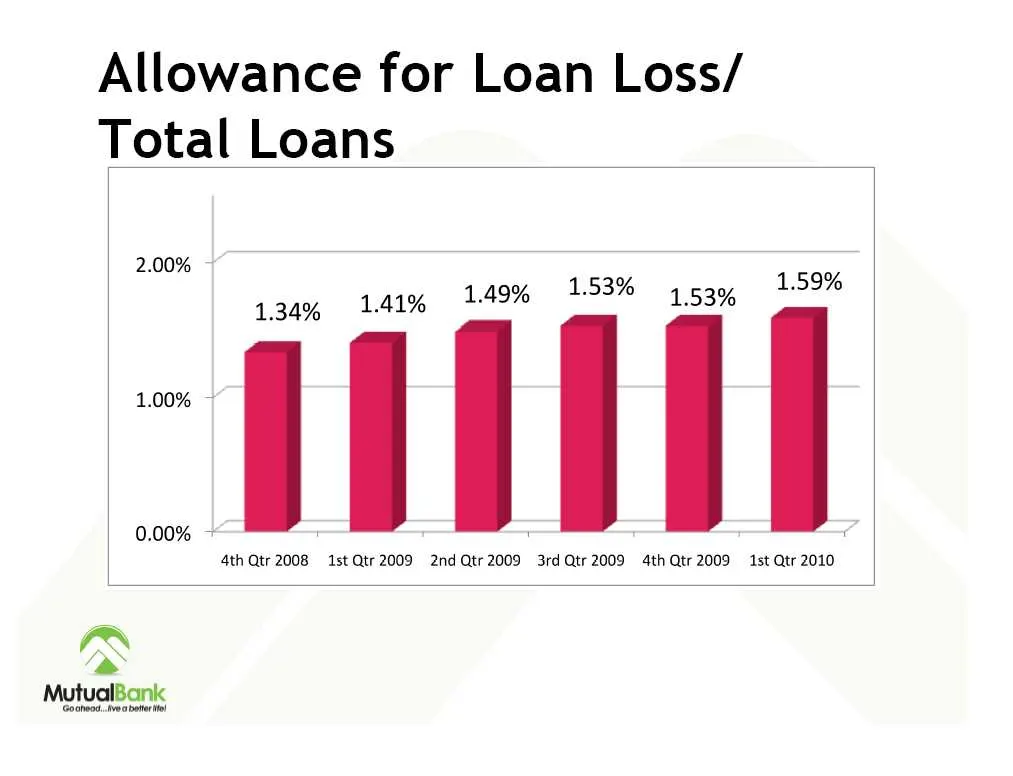
Allowance for Loan Loss/ Total Loans 2.00% 9 134% 1.41% 1.49% eat ac9y Eee - | | ] | | | 0.00% ~ 7 r t 4th Qtr 2008 1st Qtr 2009 2nd Qtr 2009 3rd Qtr 2009 4th Qtr 2009 1st Qtr 2010
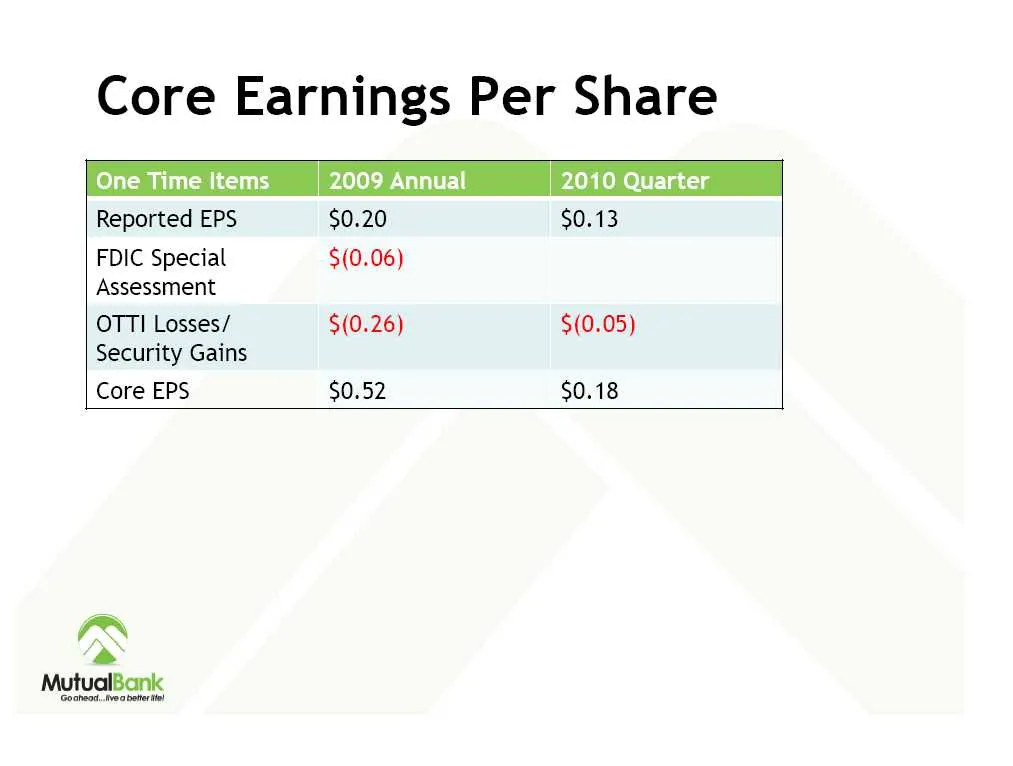
Slide 33: Core Earnings Per Share
Core Earnings Per Share One Time Items 2009 Annual 2010 Quarter Reported EPS $0.20 $0.13 FDIC Special $(0.06) Assessment OTTI Losses/ $(0.26) (0.05) Security Gains Core EPS $0.52 $0.18 »
Slide 34: Capital
Capital
Slide 35: Capital Purchase Plan
Capital Purchase Plan T.A.R.P. oo a Murua
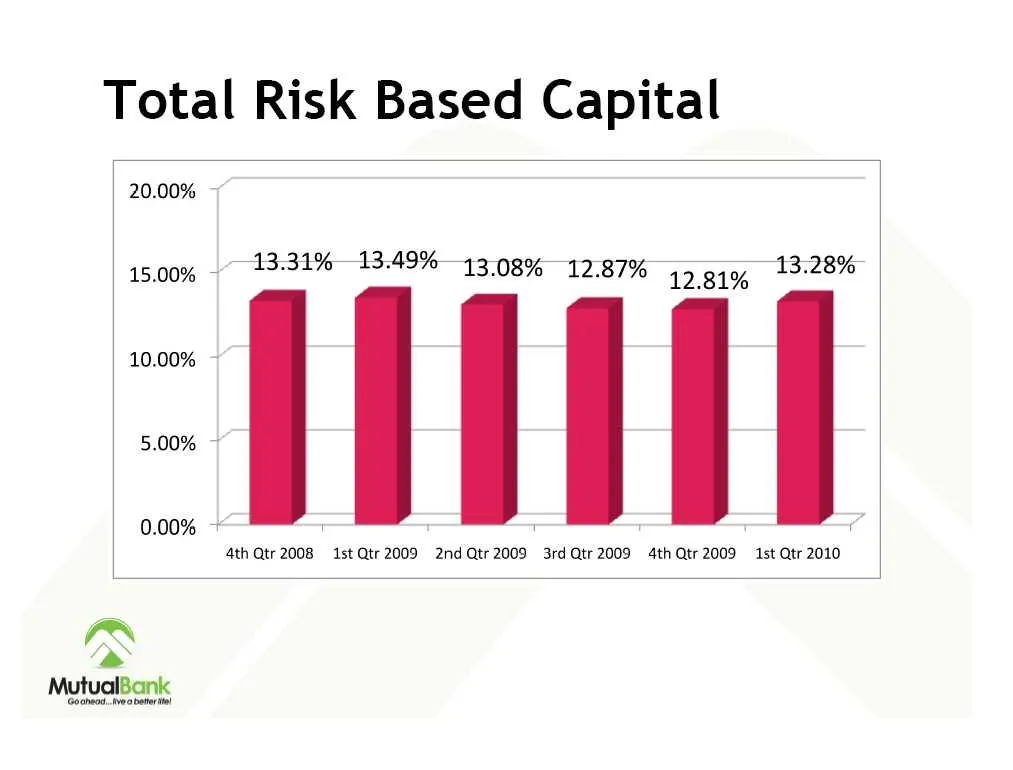
Slide 36: Total Risk Based Capital
Total Risk Based Capital 20.00% ~ 15.00% 13:31% 13. 49% 13.08% 12.87% 12.81% 13.28% 10.00% 5.00% ~ 0.00% Ath Qtr 2008 1st Qtr 2009 2nd Qtr 2009 3rd Qtr 2009 4th Qtr 2009 1st Qtr 2010
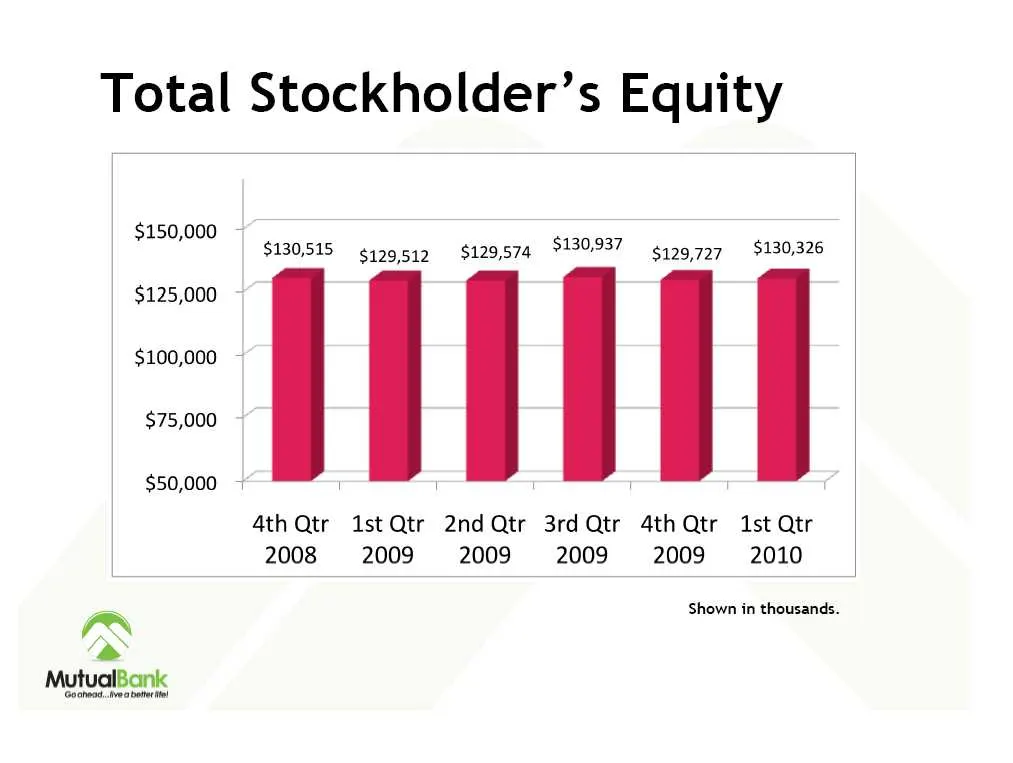
Slide 37: Total Stockholder's Equity
Total Stockholder’s Equity $150,000 ~ $130,515 ¢499512 $129,574 9130937 gy99.797 $130,326 $125,000 $100,000 ~ $75,000 T T T T $50,000 ~ 4th Qtr 1stQtr 2ndQtr 3rdQtr 4thQtr 1st Qtr 2008 2009 2009 2009 2009 2010 Shown in thousands. lax as MutualBanic \Goahead Area Bote
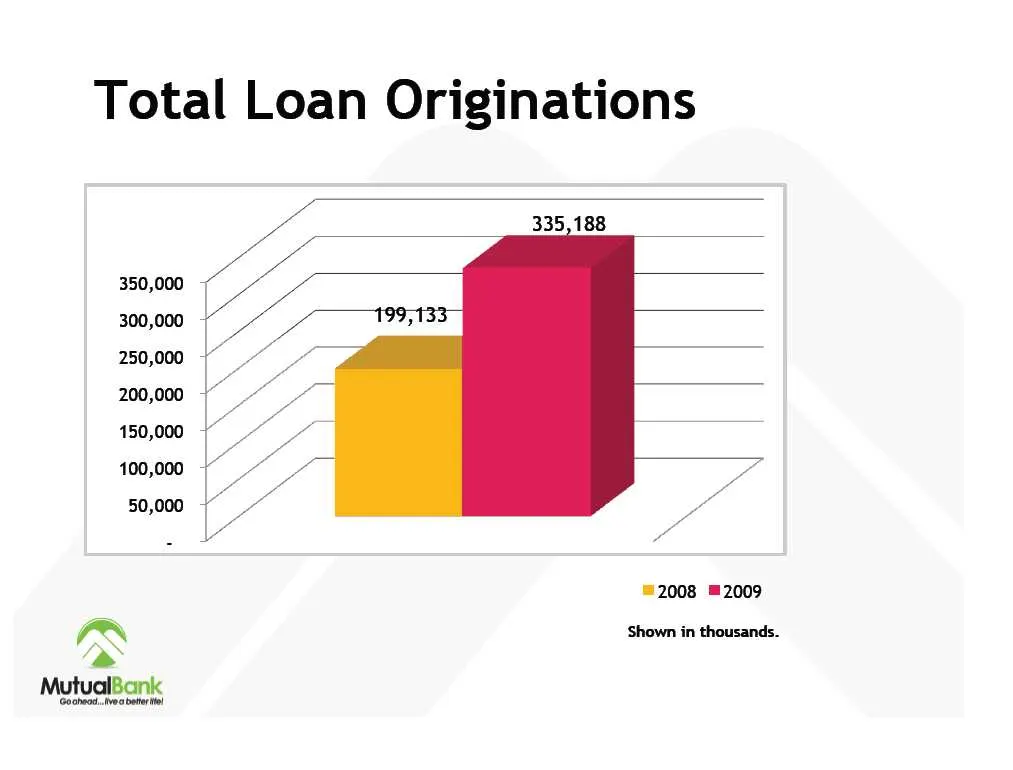
Slide 38: Total Loan Originations
Total Loan Originations ™2008 ™2009 r~ Shown in thousands.
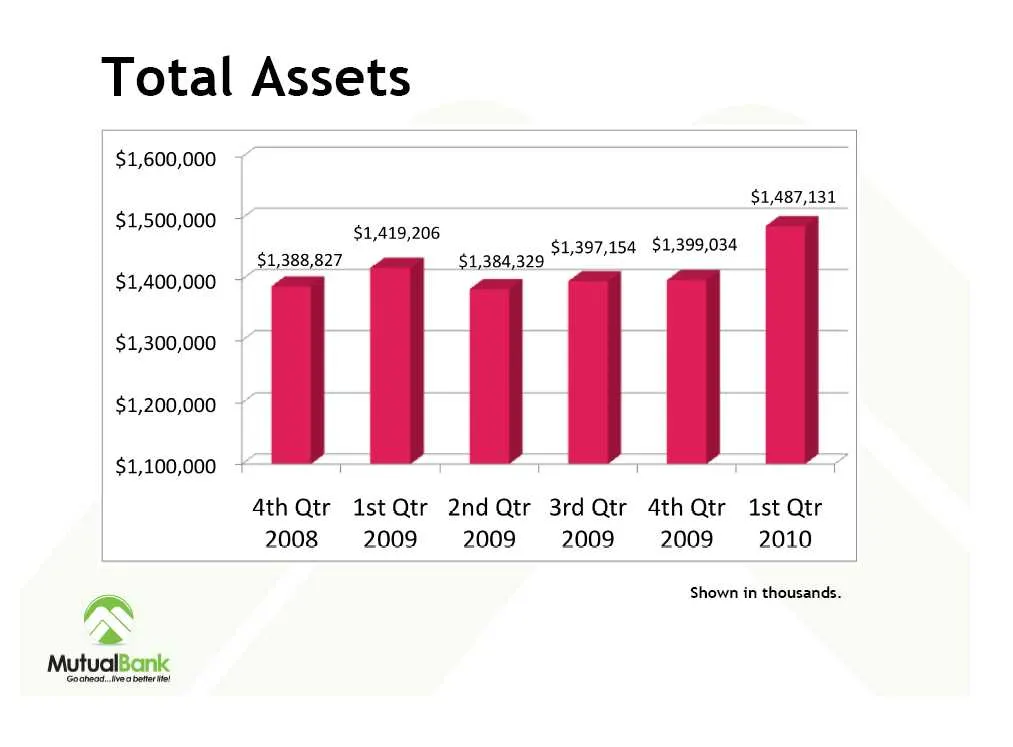
Slide 39: Total Assets
Total Assets $1,600,000 $1,500,000 - $1,400,000 ~ $1,300,000 $1,200,000 $1,100,000 $1,487,131 $1,419,206 1,397,154 $1,399,034 $1,388,827 iT $1,384,329 * | 4th Qtr 1stQtr 2nd Qtr 3rd Qtr 4th Qtr 1st Qtr 2008 2009 2009 2009 2009 2010 Shown in thousands.
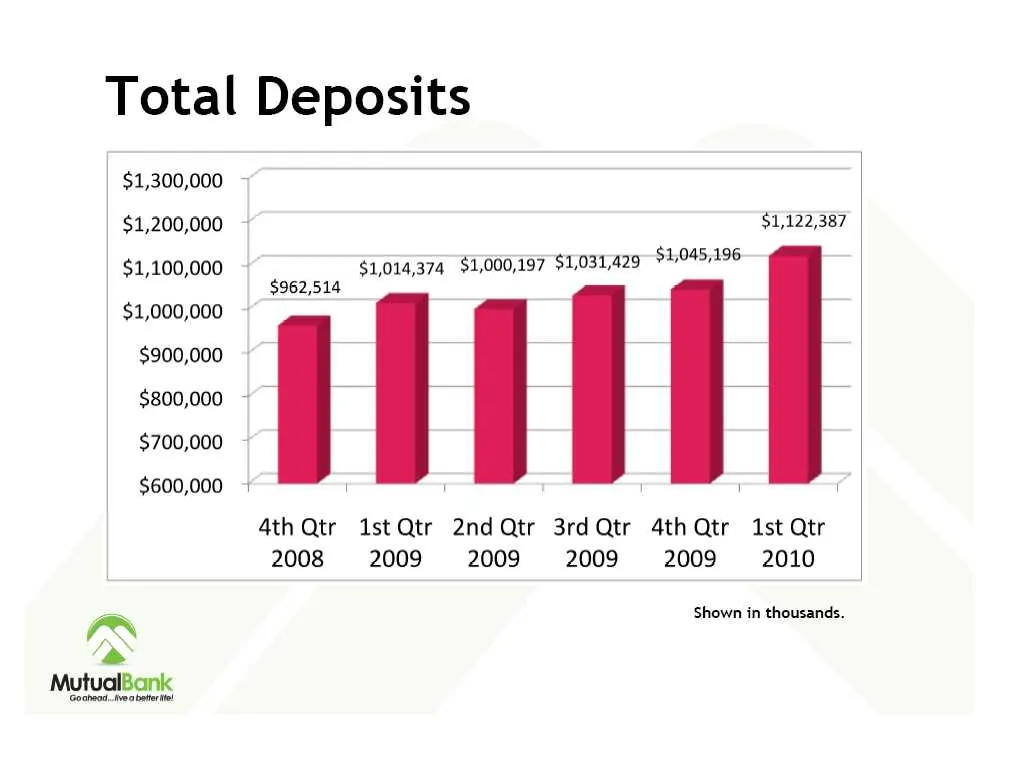
Slide 40: Total Deposits
Total Deposits $1,300,000 + $1,200,000 ~ $1,122,387 $1,100,000 $1,014,374 $1,000,197 $1,031,429 $045,196 $962,514 $1,000,000 $900,000 $800,000 $700,000 $600,000 4th Qtr 1stQtr 2nd Qtr 3rdQtr 4th Qtr 1st Qtr 2008 2009 2009 2009 2009 2010 r~~ Shown in thousands.
Slide 41: Non Performing Assets/Total Assets
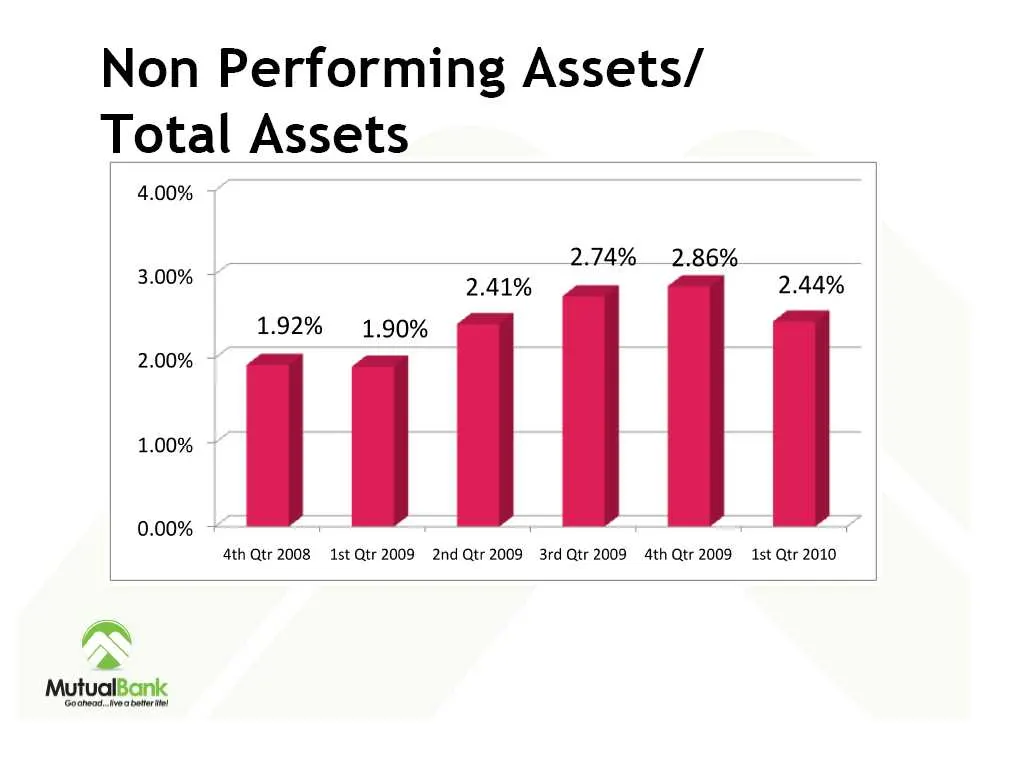
Non Performing Assets/ Total Assets 4.00% 2.74% ___2.86% 3.00% ~ 2.41% 2.44% 1.92% 1.90% 2.00% ~ | | 0.00% ~ 4th Qtr 2008 1st Qtr 2009 2nd Qtr 2009 3rd Qtr 2009 4th Qtr 2009 Ist Qtr 2010
Slide 42: Core Earnings Per Share
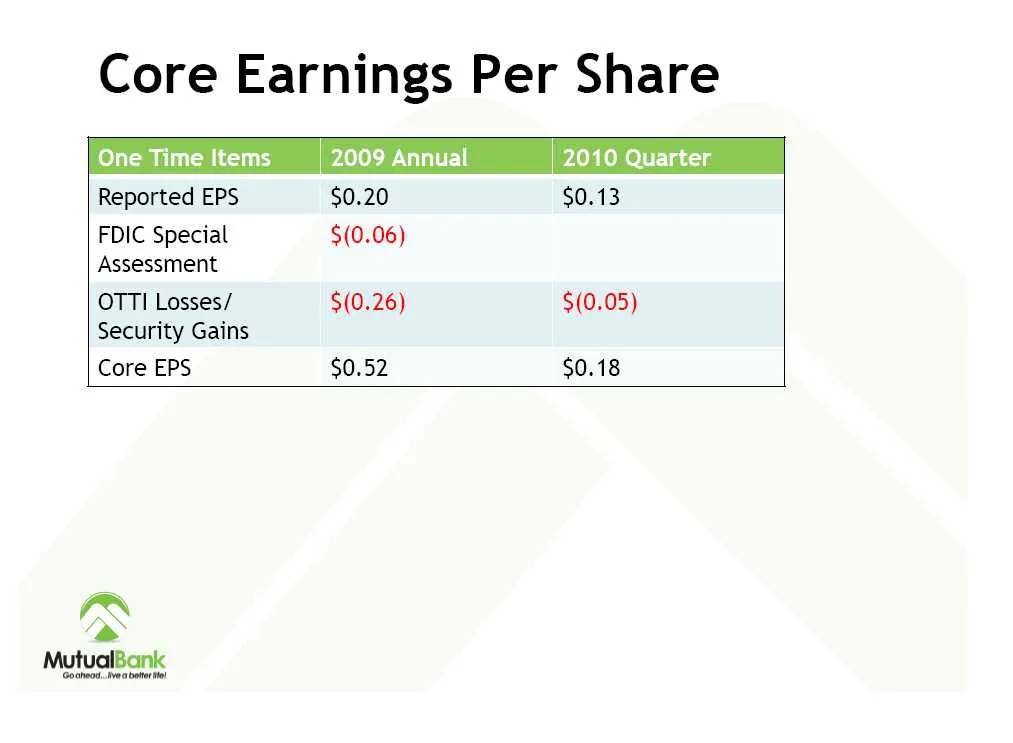
Core Earnings Per Share One Time Items 2009 Annual 2010 Quarter Reported EPS $0.20 $0.13 FDIC Special $(0.06) Assessment OTTI Losses/ $(0.26) $(0.05) Security Gains Core EPS $0.52 $0.18 QN
Slide 43: Non-Interest Expense
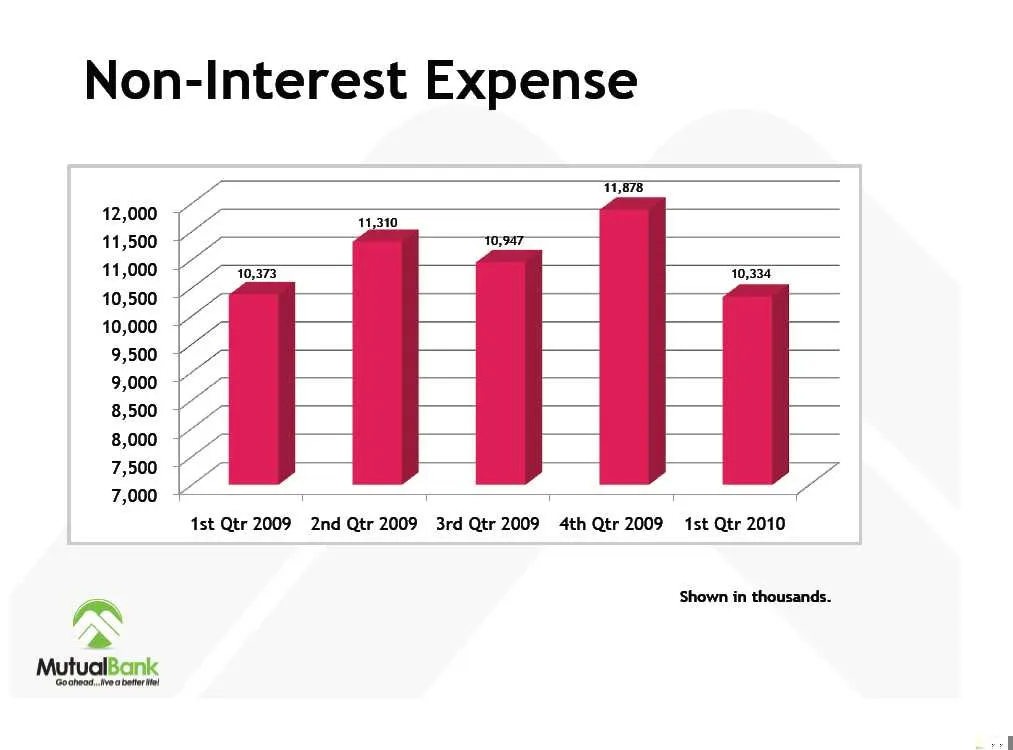
Non-Interest Expense 11,878 12,000 11,310 11,500 10,987. 11,000 - 10,373 10,334 10,500 10,000 9,500 9,000 8,500 8,000 - 7,500 1st Qtr 2009 2nd Qtr 2009 3rd Qtr 2009 4th Qtr 2009 1st Qtr 2010 ‘Shown in thousands.
Slide 44: MutualFirst Financial, Inc.
MutualFirst Financial, Inc.

Slide 45: MutualFirst Financial, Inc.
MutualFirst Financial, Inc.
Source: SEC EDGAR · 8-K filed Apr 29, 2010
More decks from MutualFirst Financial Inc
 Merger or Acquisition (October 2019)14 slides · Oct 29, 2019
 Shareholder Meeting (May 2019)18 slides · May 3, 2019
 2018 KBW Community Bank Investor Conference27 slides · Aug 1, 2018
 Shareholder Meeting (May 2018)28 slides · May 7, 2018
 Merger or Acquisition (October 2017)12 slides · Oct 4, 2017
 KBW 2017 Community Bank Investor Conference34 slides · Aug 3, 2017