Pioneer Energy Services — Non-Deal Roadshow (July 2014)
23 slides from Pioneer Energy Services's roadshow presentation, Jul 9, 2014

Slide 1: Goldman Sachs Non-Deal Roadshow July 9th-10th, 2014
GOLDMAN SACHS NON-DEAL ROADSHOW July 9th-10th, 2014

Slide 2: Forward-looking Statements
Forward-looking Statements 2 This presentation contains various forward-looking statements and information that are based on management’s current expectations and assumptions about future events. Forward-looking statements are generally accompanied by words such as “estimate,” “project,” “predict,”
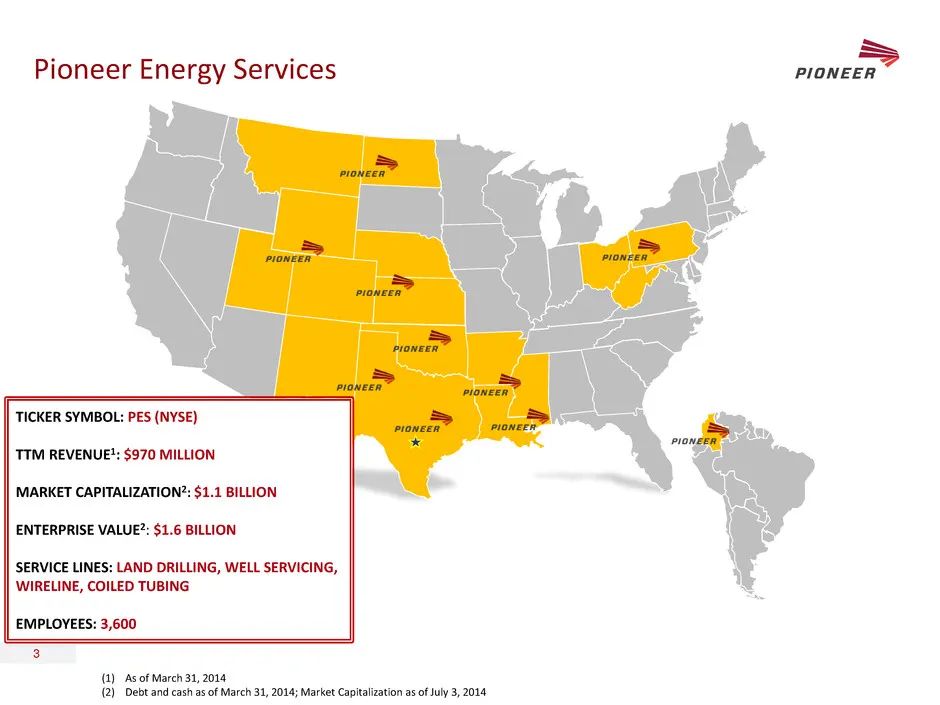
Slide 3: Pioneer Energy Services
Pioneer Energy Services 3 (1) As of March 31, 2014 (2) Debt and cash as of March 31, 2014; Market Capitalization as of July 3, 2014 TICKER SYMBOL: PES (NYSE) TTM REVENUE1: $970 MILLION MARKET CAPITALIZATION2: $1.1 BILLION ENTERPRISE VALUE2: $1.6 BILLION SERVICE LINES: LAND DRILLING, WELL SERVICING,
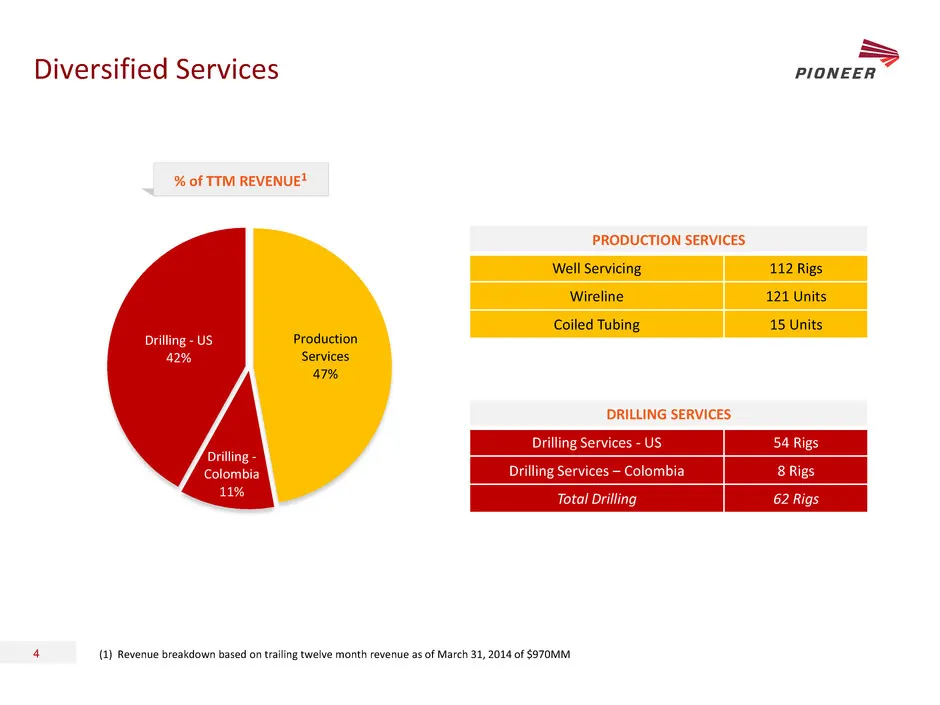
Slide 4: Diversified Services % of TTM Revenue
Diversified Services 4 % of TTM REVENUE1 (1) Revenue breakdown based on trailing twelve month revenue as of March 31, 2014 of $970MM DRILLING SERVICES Drilling Services - US 54 Rigs Drilling Services – Colombia 8 Rigs Total Drilling 62 Rigs PRODUCTION SERVICES Well Servicing 112 Rigs Wireline 121 Un
Slide 5: Recent Updates
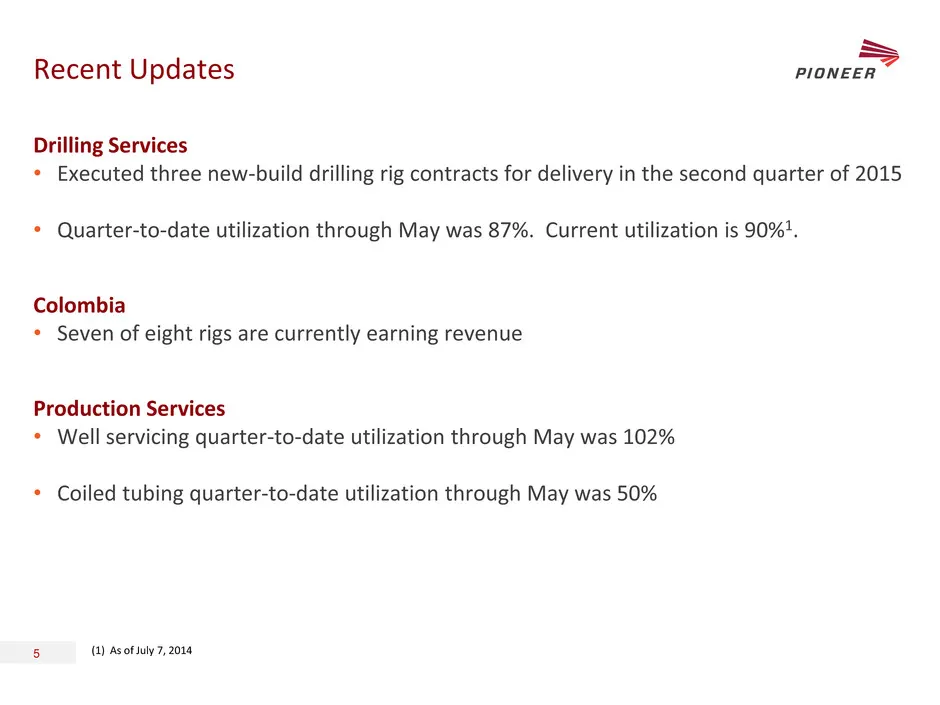
Recent Updates 5 Drilling Services • Executed three new-build drilling rig contracts for delivery in the second quarter of 2015 • Quarter-to-date utilization through May was 87%. Current utilization is 90%1. Colombia • Seven of eight rigs are currently earning revenue Production Services • Well serv
Slide 6: Investment Considerations Summary
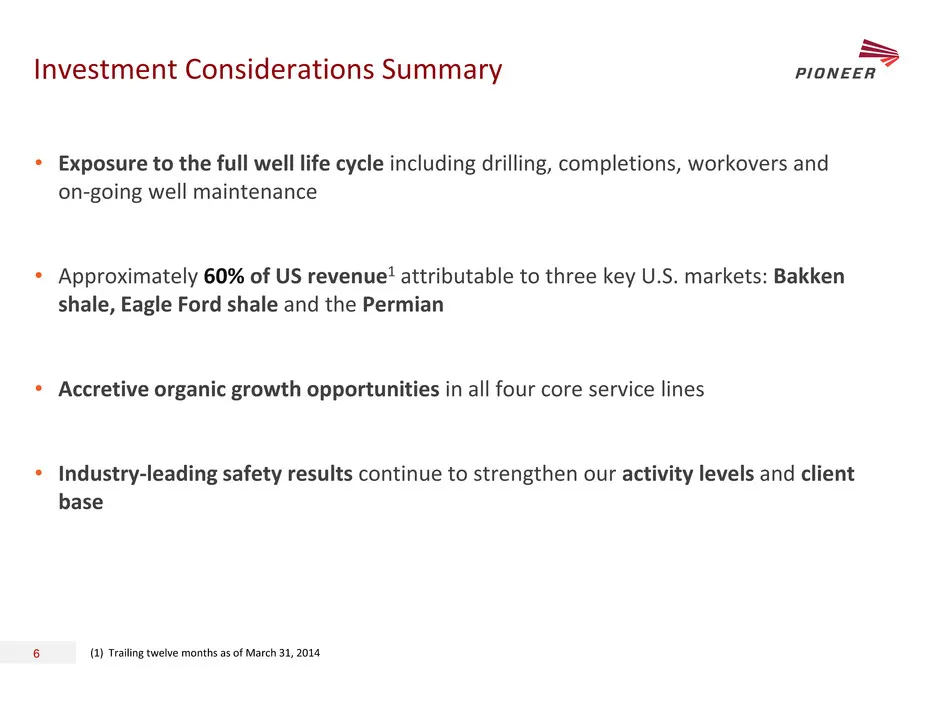
Investment Considerations Summary 6 • Exposure to the full well life cycle including drilling, completions, workovers and on-going well maintenance • Approximately 60% of US revenue1 attributable to three key U.S. markets: Bakken shale, Eagle Ford shale and the Permian • Accretive organic growth opp
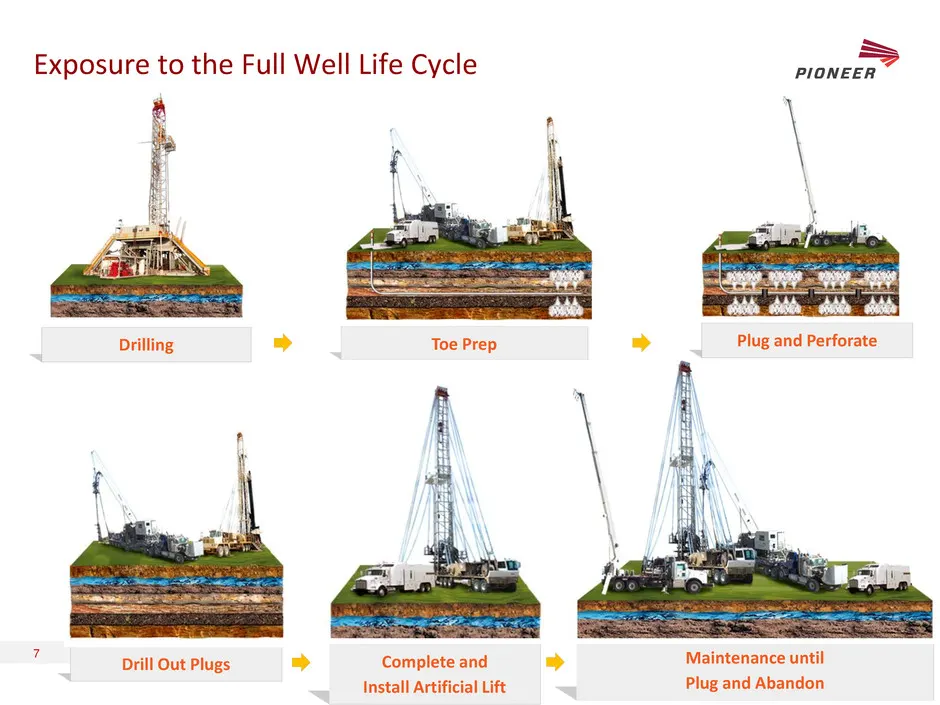
Slide 7: Exposure to the Full Well Life Cycle
Exposure to the Full Well Life Cycle 7 Plug and Perforate Toe Prep Drilling Maintenance until Plug and Abandon Drill Out Plugs Complete and Install Artificial Lift
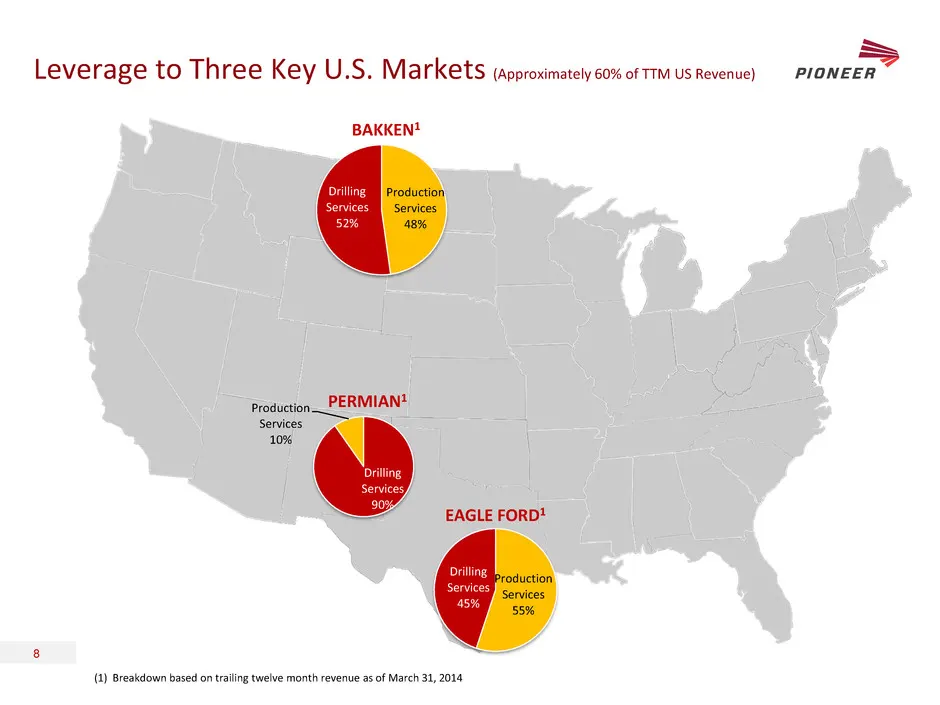
Slide 8: Leverage to Three Key U.S. Markets
Leverage to Three Key U.S. Markets (Approximately 60% of TTM US Revenue) 8 Production Services 48% Drilling Services 52% Drilling Services 90% Production Services 10% Production Services 55% Drilling Services 45% EAGLE FORD1 PERMIAN1 BAKKEN1 (1) Breakdown based on trailing twelve month revenue as of
Slide 9: Accretive Organic Growth Opportunities
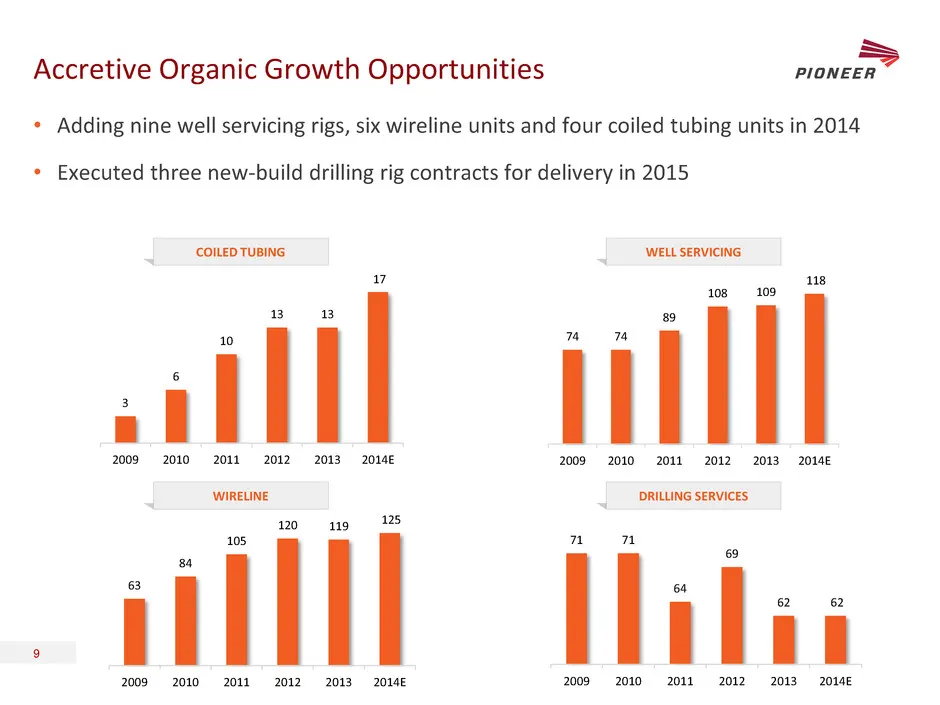
3 6 10 13 13 17 2009 2010 2011 2012 2013 2014E Accretive Organic Growth Opportunities 9 • Adding nine well servicing rigs, six wireline units and four coiled tubing units in 2014 • Executed three new-build drilling rig contracts for delivery in 2015 DRILLING SERVICES WELL SERVICING WIRELINE COILED T
Slide 10: Production Services
10 PRODUCTION SERVICES
Slide 11: Well Servicing
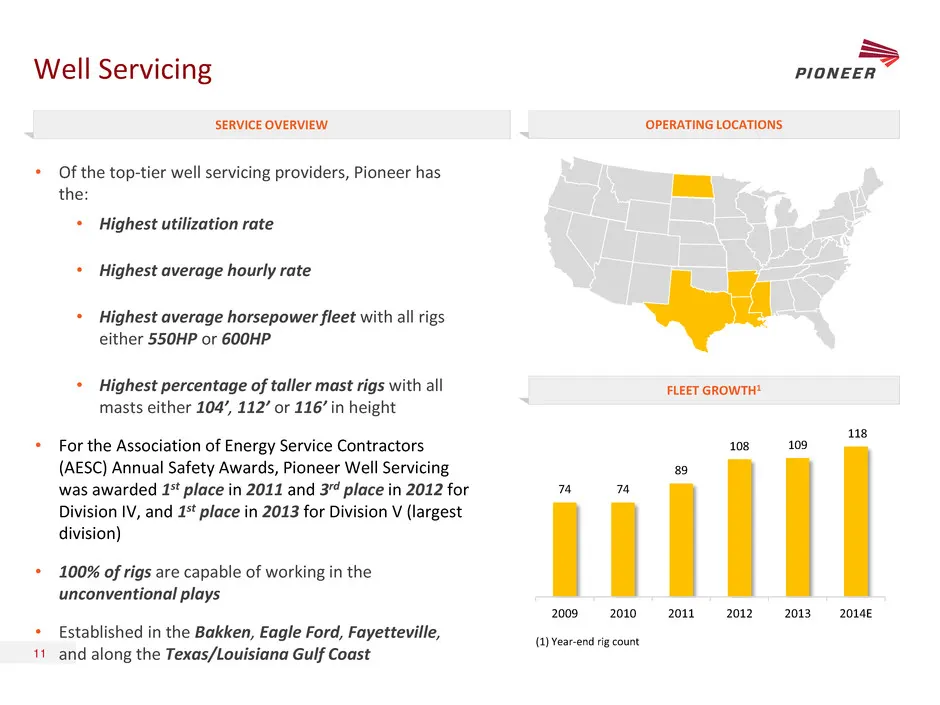
Well Servicing 11 • Of the top-tier well servicing providers, Pioneer has the: • Highest utilization rate • Highest average hourly rate • Highest average horsepower fleet with all rigs either 550HP or 600HP • Highest percentage of taller mast rigs with all masts either 104’, 112’ or 116’ in height •
Slide 12: Wireline
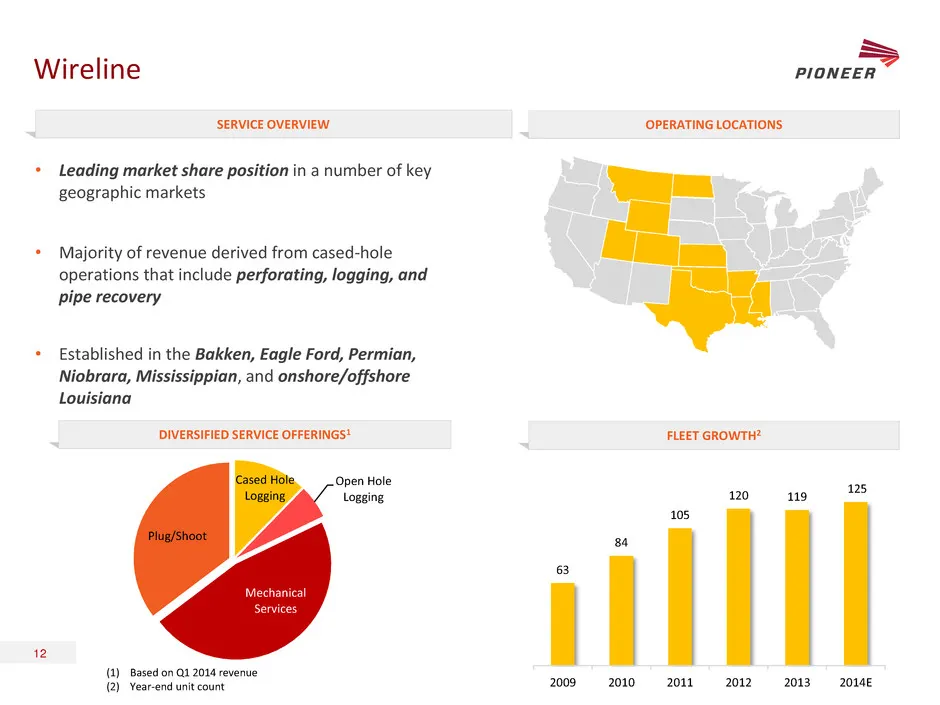
Wireline 12 • Leading market share position in a number of key geographic markets • Majority of revenue derived from cased-hole operations that include perforating, logging, and pipe recovery • Established in the Bakken, Eagle Ford, Permian, Niobrara, Mississippian, and onshore/offshore Louisiana (1
Slide 13: Coiled Tubing
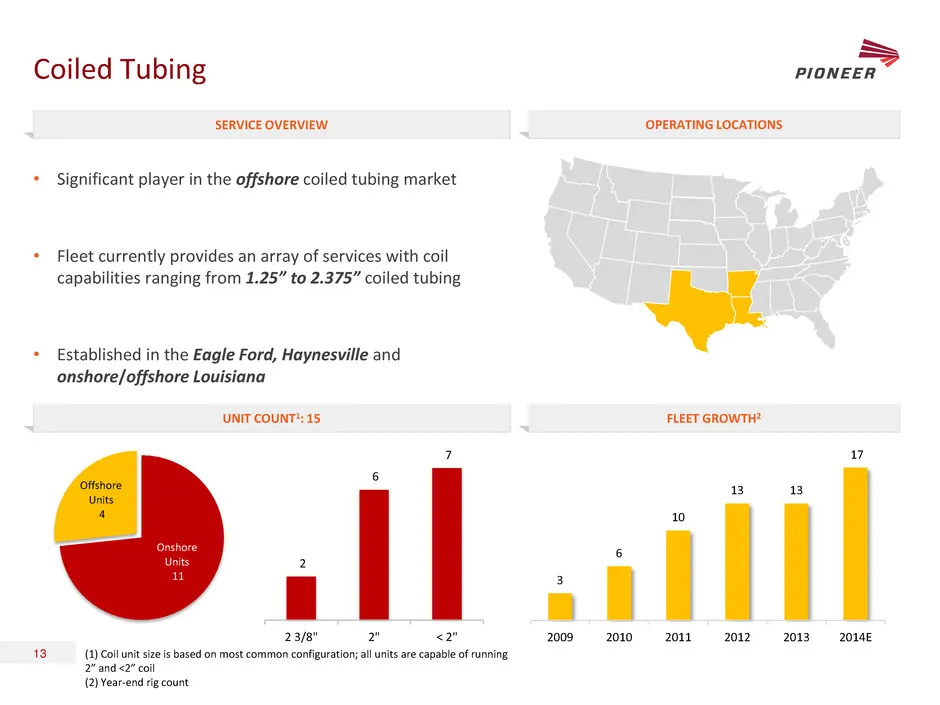
Coiled Tubing 13 • Significant player in the offshore coiled tubing market • Fleet currently provides an array of services with coil capabilities ranging from 1.25” to 2.375” coiled tubing • Established in the Eagle Ford, Haynesville and onshore/offshore Louisiana SERVICE OVERVIEW OPERATING LOCATION
Slide 14: Pioneer Drilling Services
S PIONEER DRILLING SERVICES
Slide 15: Drilling Services
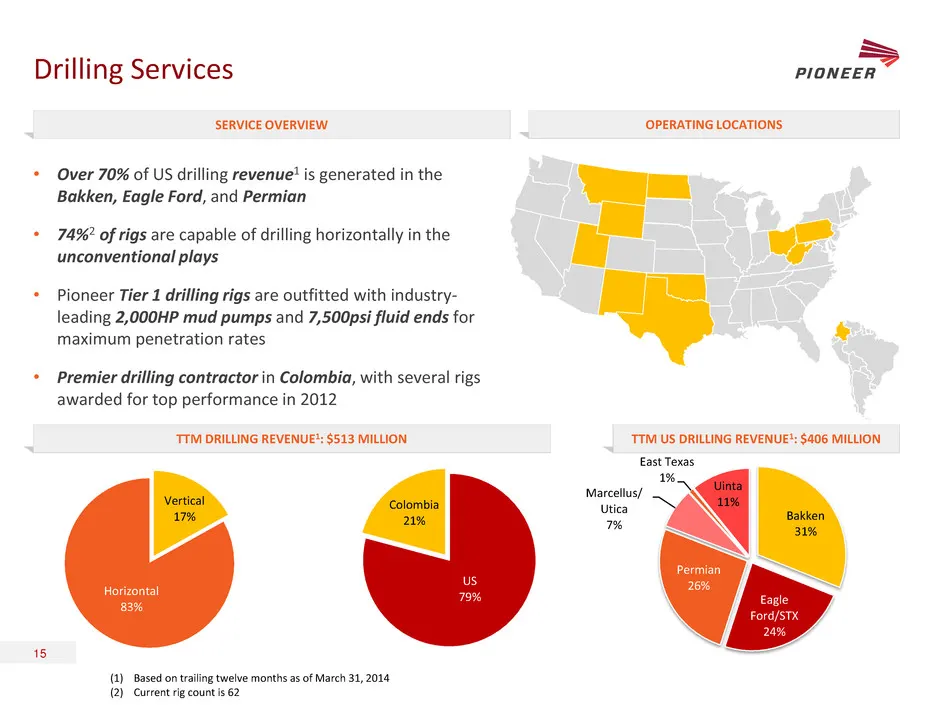
Drilling Services 15 • Over 70% of US drilling revenue1 is generated in the Bakken, Eagle Ford, and Permian • 74%2 of rigs are capable of drilling horizontally in the unconventional plays • Pioneer Tier 1 drilling rigs are outfitted with industry- leading 2,000HP mud pumps and 7,500psi fluid ends fo
Slide 16: Pioneer Drilling Rig Class Comparison
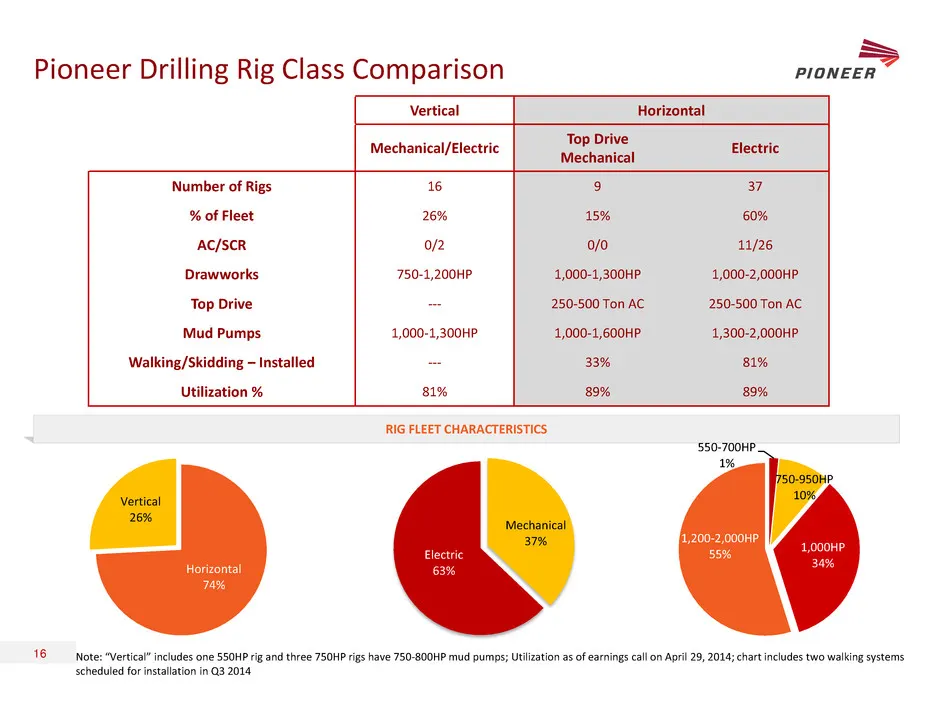
Pioneer Drilling Rig Class Comparison 16 RIG FLEET CHARACTERISTICS Vertical Horizontal Mechanical/Electric Top Drive Mechanical Electric Number of Rigs 16 9 37 % of Fleet 26% 15% 60% AC/SCR 0/2 0/0 11/26 Drawworks 750-1,200HP 1,000-1,300HP 1,000-2,000HP Top Drive --- 250-500 Ton AC 250-500 Ton AC Mu
Slide 17: Maintained High Level of Term-Contracted Cash Flow
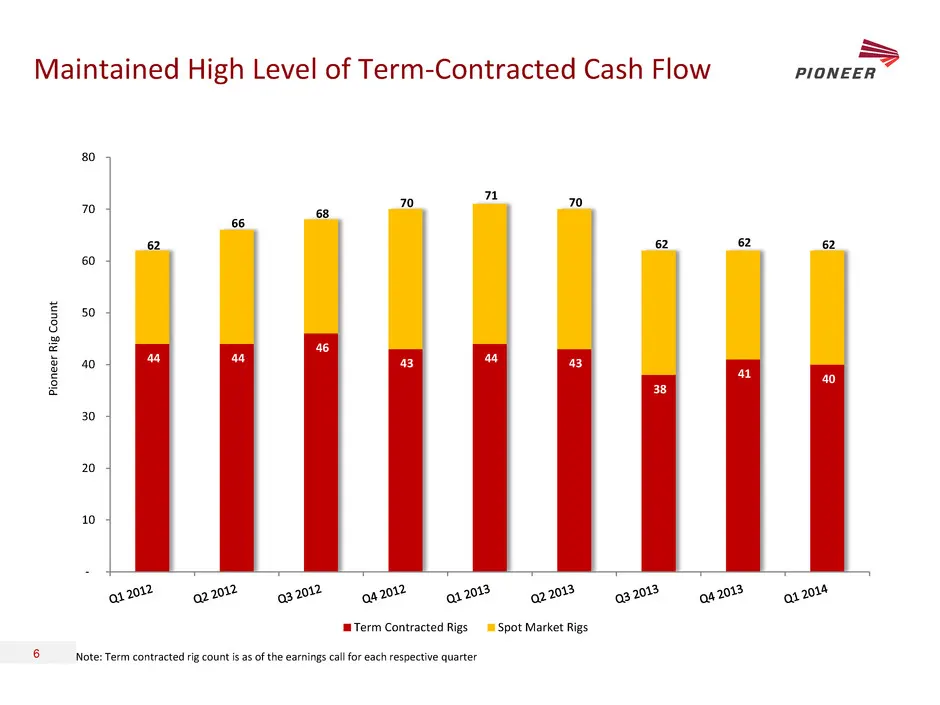
Maintained High Level of Term-Contracted Cash Flow 6 44 44 46 43 44 43 38 41 40 62 66 68 70 71 70 62 62 62 - 10 20 30 40 50 60 70 80 Pi o n ee r Ri g Co u n t Term Contracted Rigs Spot Market Rigs Note: Term contracted rig count is as of the earnings call for each respective quarter
Slide 18: Industry-Leading Safety
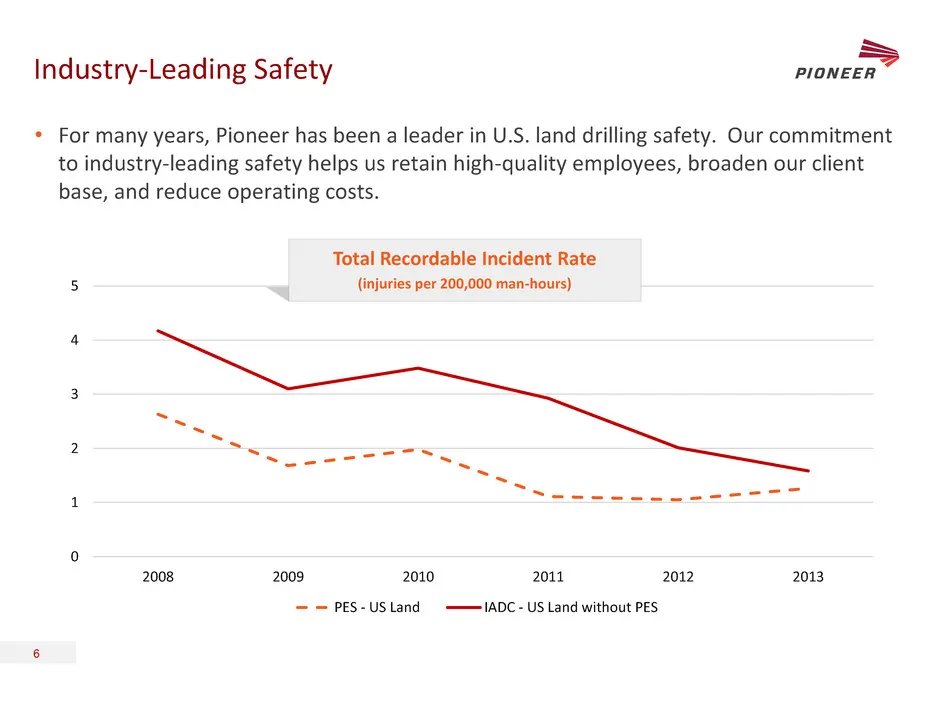
Industry-Leading Safety 6 • For many years, Pioneer has been a leader in U.S. land drilling safety. Our commitment to industry-leading safety helps us retain high-quality employees, broaden our client base, and reduce operating costs. 0 1 2 3 4 5 2008 2009 2010 2011 2012 2013 PES - US Land IADC - US

Slide 19: Financial Performance
FINANCIAL PERFORMANCE
Slide 20: Historical Financial Results
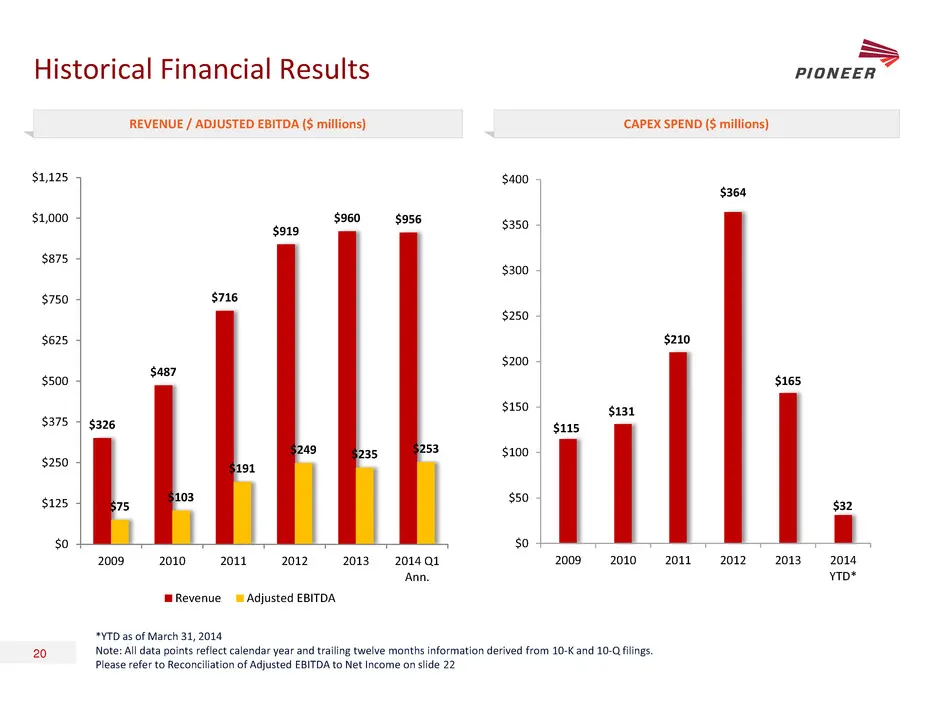
Historical Financial Results 20 REVENUE / ADJUSTED EBITDA ($ millions) CAPEX SPEND ($ millions) *YTD as of March 31, 2014 Note: All data points reflect calendar year and trailing twelve months information derived from 10-K and 10-Q filings. Please refer to Reconciliation of Adjusted EBITDA to Net In
Slide 21: Liquidity and Capital Structure
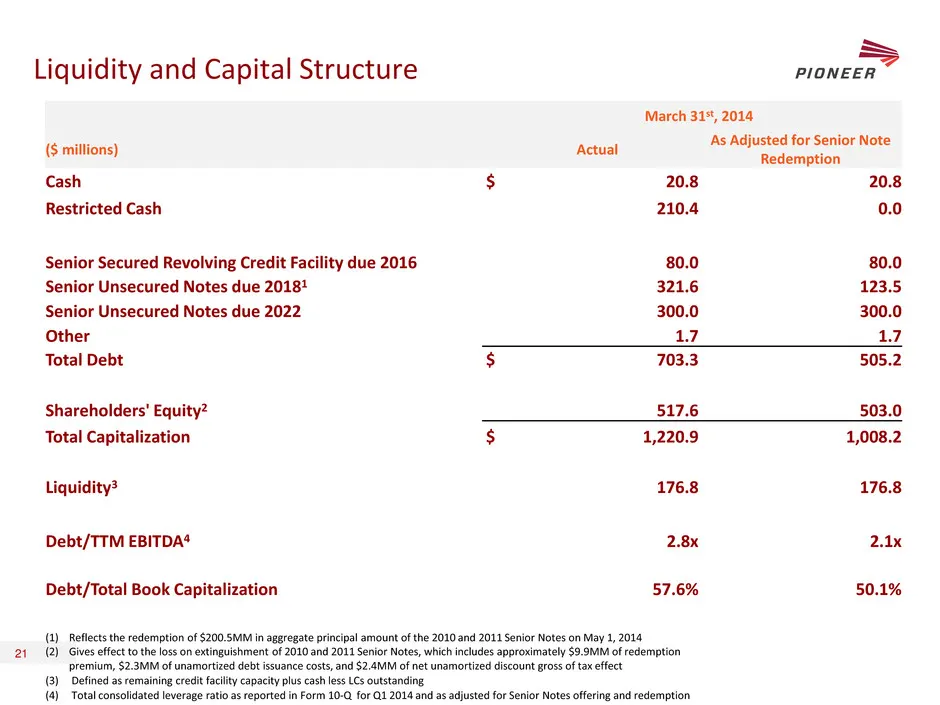
Liquidity and Capital Structure 21 March 31st, 2014 ($ millions) Actual As Adjusted for Senior Note Redemption Cash $ 20.8 20.8 Restricted Cash 210.4 0.0 Senior Secured Revolving Credit Facility due 2016 80.0 80.0 Senior Unsecured Notes due 20181 321.6 123.5 Senior Unsecured Notes due 2022 300.0 300
Slide 22: Reconciliation of Adjusted EBITDA to Net Income
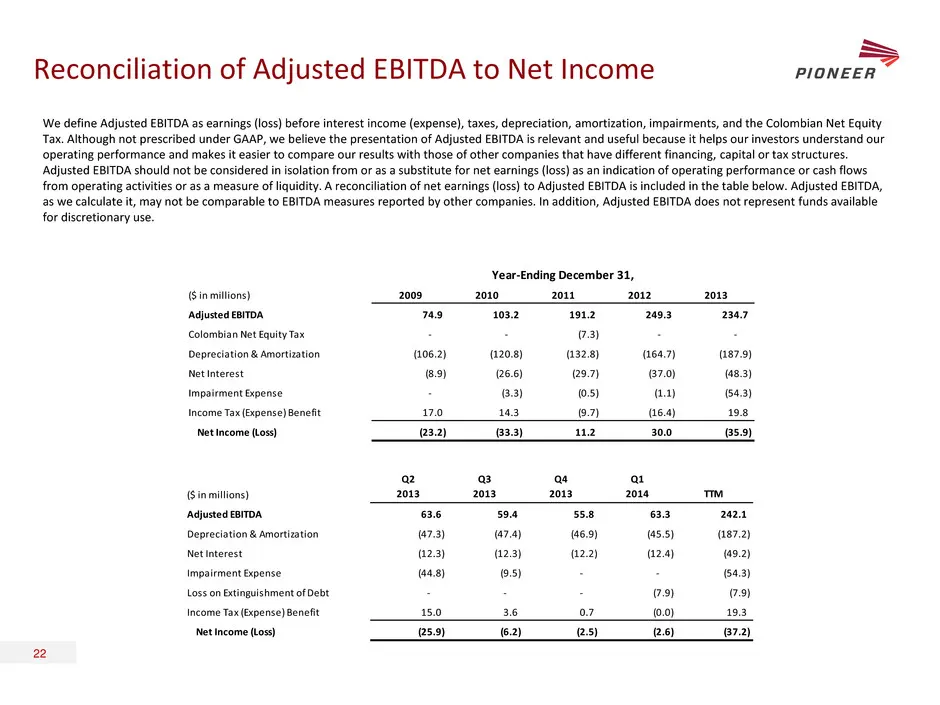
Reconciliation of Adjusted EBITDA to Net Income 22 We define Adjusted EBITDA as earnings (loss) before interest income (expense), taxes, depreciation, amortization, impairments, and the Colombian Net Equity Tax. Although not prescribed under GAAP, we believe the presentation of Adjusted EBITDA is re
Slide 23: Pioneer Energy Services
—— ——_ PIONEER Pioneer Energy Services
Source: SEC EDGAR · 8-K filed Jul 9, 2014
More decks from Pioneer Energy Services Corp
 Merger or Acquisition (July 2021)17 slides · Jul 8, 2021
 2019 Simmons Energy Conference22 slides · Feb 27, 2019
 Goldman Sachs Global Energy Conference 201922 slides · Jan 9, 2019
 Jefferies Energy Conference 201822 slides · Nov 27, 2018
 Johnson Rice 2018 Energy Conference22 slides · Sep 26, 2018
 SGS Energy & Industrials Conference 201822 slides · Aug 28, 2018