Sundance Energy — Sundance Energy Australia — Investor Presentation (February 2014)
29 slides from Sundance Energy's investor presentation, Feb 27, 2014
Slide 1: Execute – Deliver – Grow
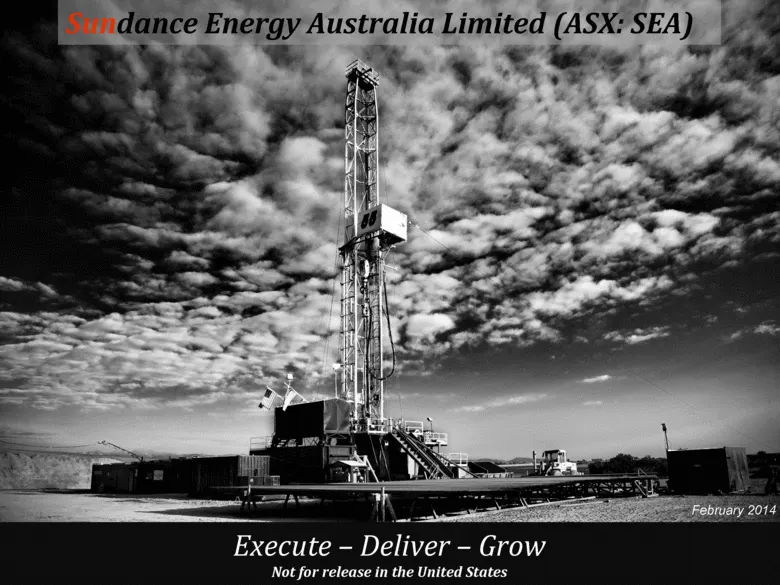
Sundance Energy Australia Limited (ASX: SEA) Execute – Deliver – Grow Not for release in the United States February 2014
Slide 2: Disclaimer
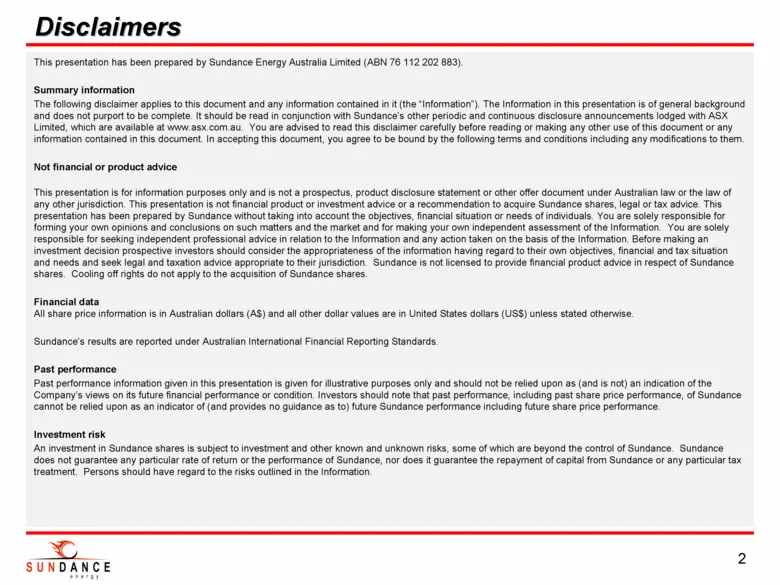
This presentation has been prepared by Sundance Energy Australia Limited (ABN 76 112 202 883). Summary information The following disclaimer applies to this document and any information contained in it (the “Information”). The Information in this presentation is of general background and does not pur
Slide 3: Not an offer / Forward Looking Statements
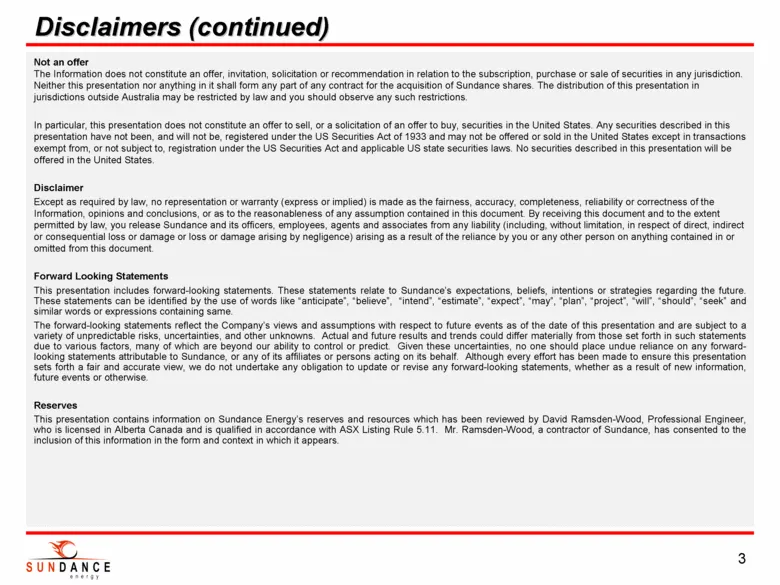
Not an offer The Information does not constitute an offer, invitation, solicitation or recommendation in relation to the subscription, purchase or sale of securities in any jurisdiction. Neither this presentation nor anything in it shall form any part of any contract for the acquisition of Sundance
Slide 4: Equity Raise Overview
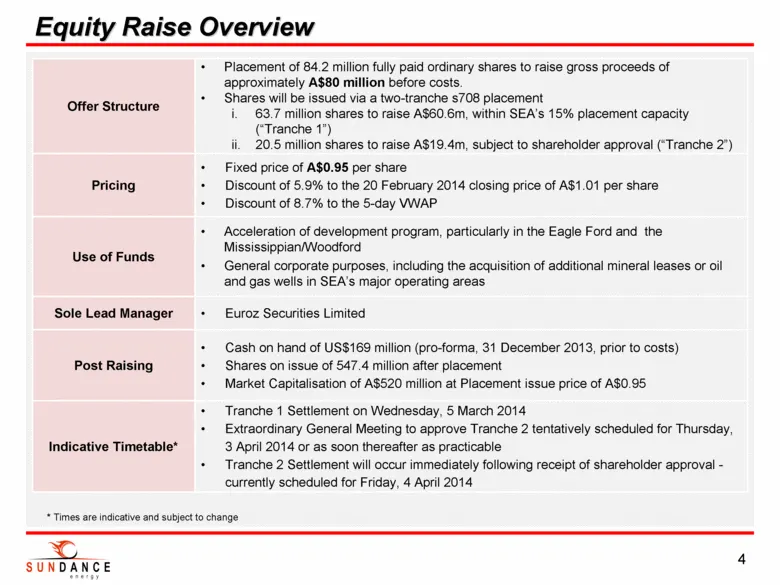
Equity Raise Overview 4 Offer Structure Placement of 84.2 million fully paid ordinary shares to raise gross proceeds of approximately A$80 million before costs. Shares will be issued via a two-tranche s708 placement 63.7 million shares to raise A$60.6m, within SEA’s 15% placement capacity (“Tranche
Slide 5: Updates
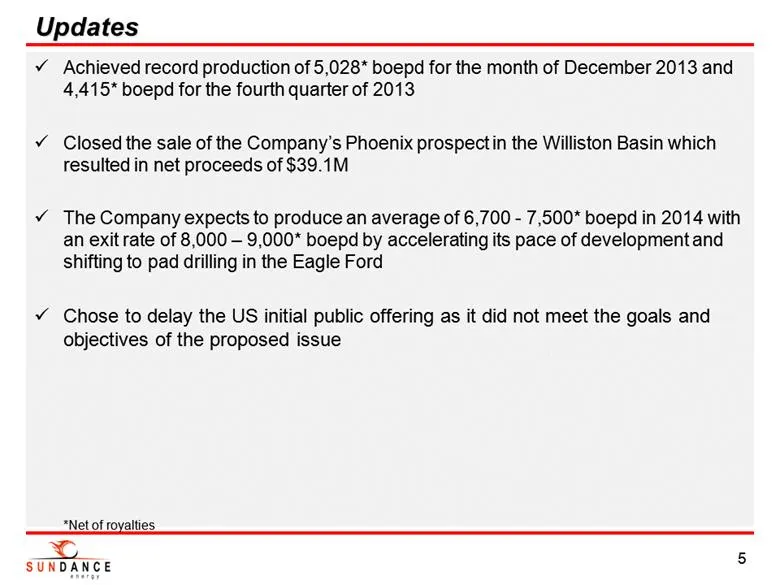
Achieved record production of 5,028* boepd for the month of December 2013 and 4,415* boepd for the fourth quarter of 2013 Closed the sale of the Company’s Phoenix prospect in the Williston Basin which resulted in net proceeds of $39.1M The Company expects to produce an average of 6,700 - 7,500* boep
Slide 6: Investment Highlights
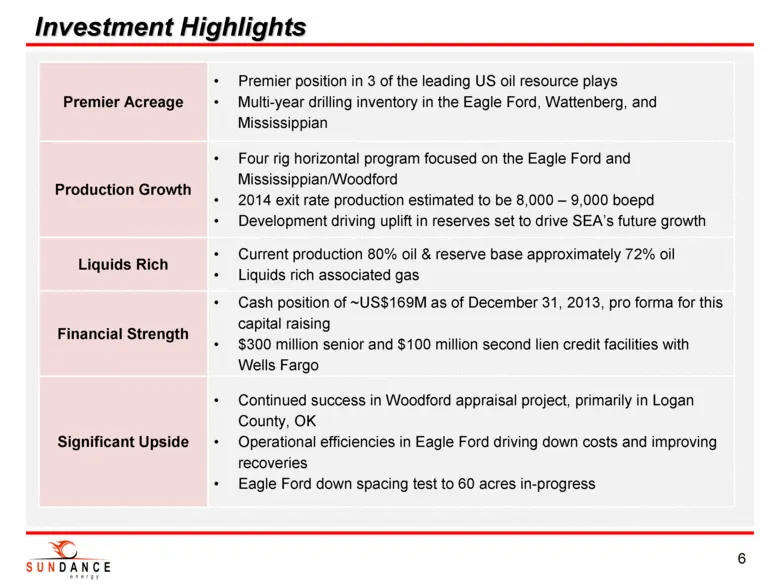
Investment Highlights 6 Premier Acreage Premier position in 3 of the leading US oil resource plays Multi-year drilling inventory in the Eagle Ford, Wattenberg, and Mississippian Production Growth Four rig horizontal program focused on the Eagle Ford and Mississippian/Woodford 2014 exit rate producti
Slide 7: Company Profile
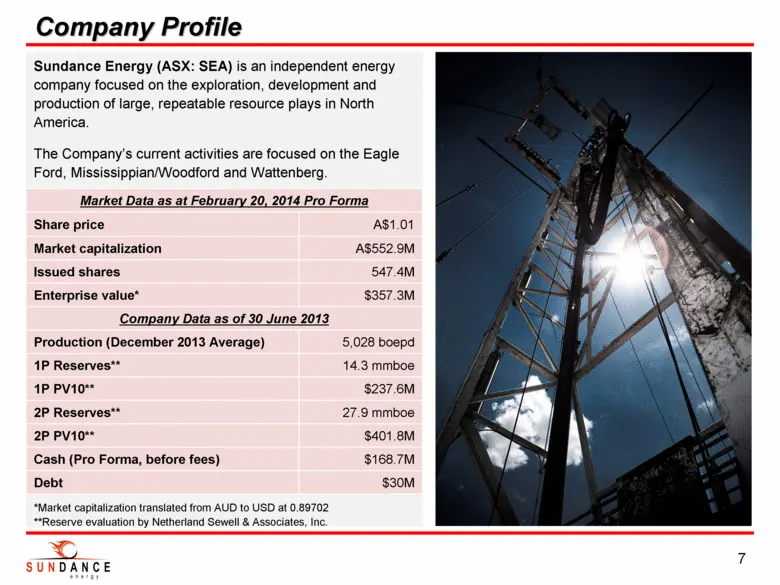
Sundance Energy (ASX: SEA) is an independent energy company focused on the exploration, development and production of large, repeatable resource plays in North America. The Company’s current activities are focused on the Eagle Ford, Mississippian/Woodford and Wattenberg. *Market capitalization trans
Slide 8: 2014 Forecasted Development Program
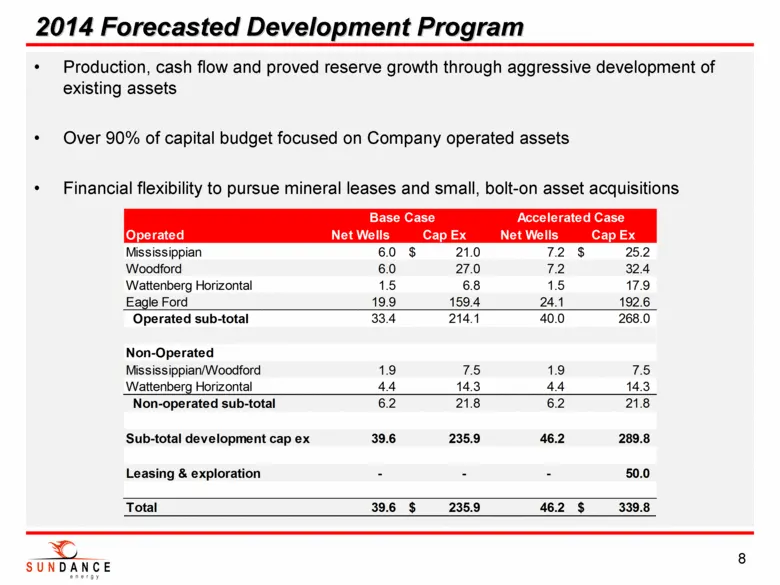
Production, cash flow and proved reserve growth through aggressive development of existing assets Over 90% of capital budget focused on Company operated assets Financial flexibility to pursue mineral leases and small, bolt-on asset acquisitions 2014 Forecasted Development Program 8 Operated Net Well
Slide 9: Company Production Guidance and Reserve Overview
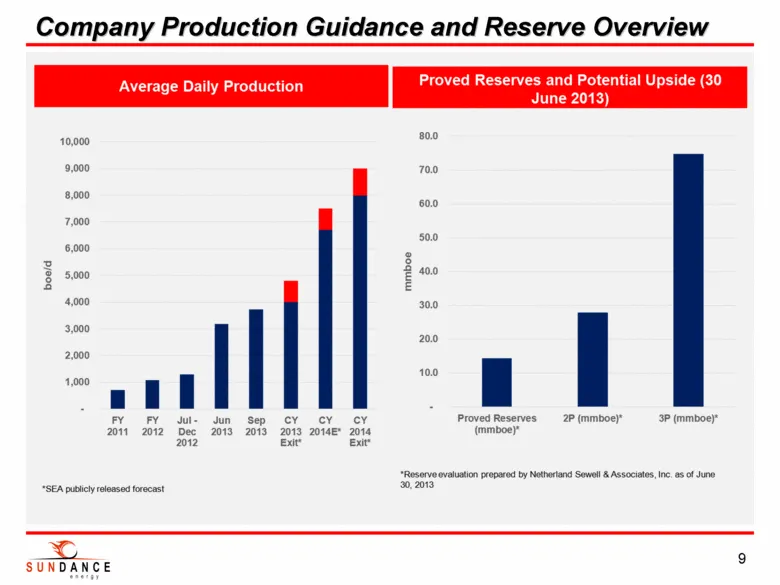
Company Production Guidance and Reserve Overview 9
Slide 10: Diversified Assets in Leading US Liquids Basins
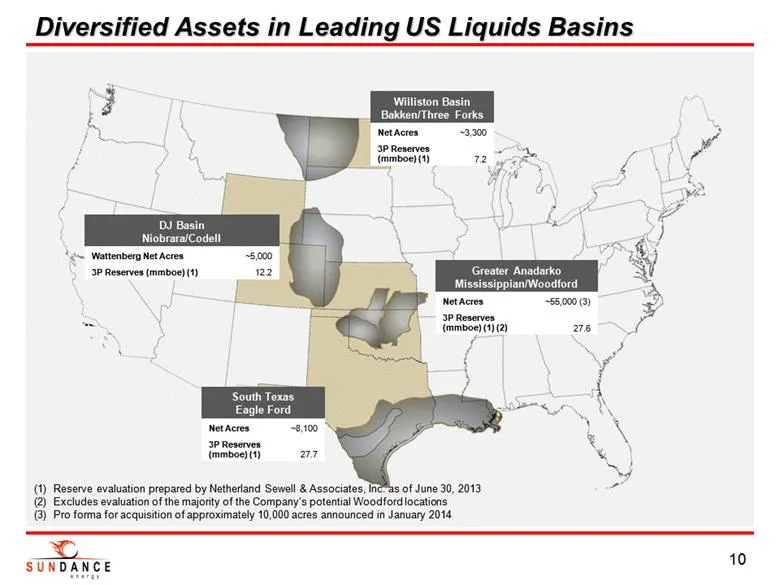
Reserve evaluation prepared by Netherland Sewell & Associates, Inc. as of June 30, 2013 Excludes evaluation of the majority of the Company’s potential Woodford locations Pro forma for acquisition of approximately 10,000 acres announced in January 2014 Diversified Assets in Leading US Liquids Basins
Slide 11: Eagle Ford – Major Players
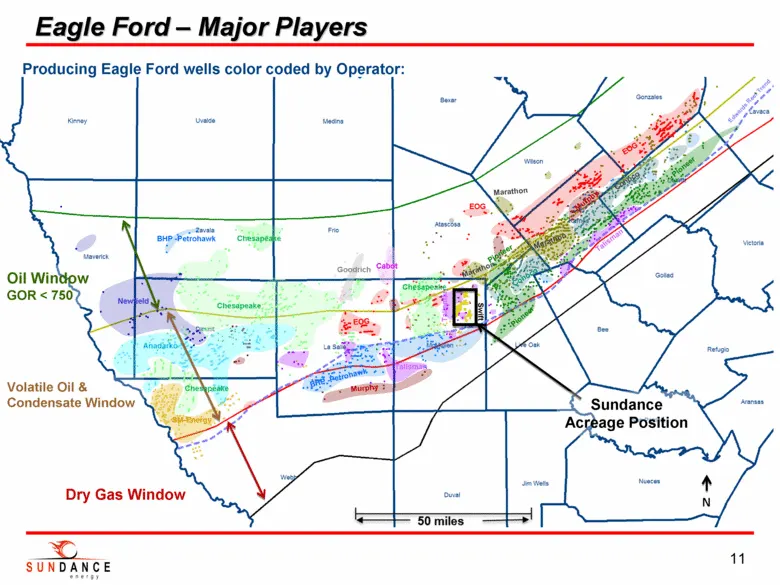
Eagle Ford – Major Players 11 Oil Window GOR < 750 Volatile Oil & Condensate Window Dry Gas Window Sundance Acreage Position EOG EOG EOG Newfield Chesapeake Murphy Murphy Anadarko SM-Energy Pioneer Pioneer Pioneer Conoco Conoco Cabot Goodrich Chesapeake Chesapeake Talisman Talisman Talisman Marathon
Slide 12: Texas: SEA 2013-2014 Drilling Activity
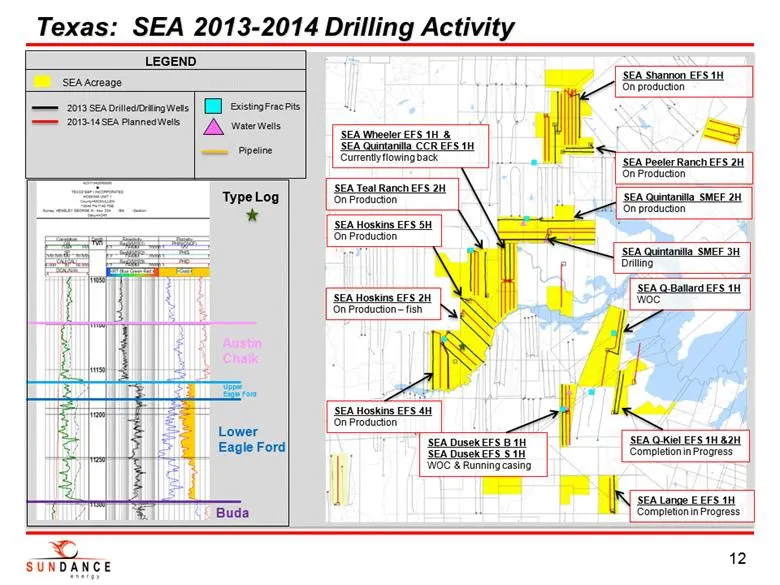
Texas: SEA 2013-2014 Drilling Activity 12 Buda Lower Eagle Ford Upper Eagle Ford Austin Chalk Type Log SEA Hoskins EFS 5H On Production SEA Teal Ranch EFS 2H On Production SEA Quintanilla SMEF 2H On production SEA Shannon EFS 1H On production SEA Wheeler EFS 1H & SEA Quintanilla CCR EFS 1H Currently
Slide 13: Eagle Ford: Operations Overview
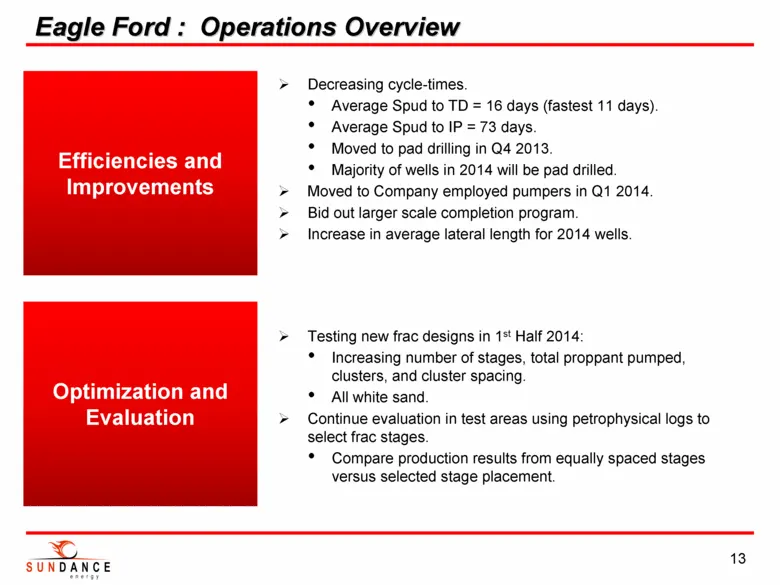
Eagle Ford : Operations Overview 13 Efficiencies and Improvements Decreasing cycle-times. Average Spud to TD = 16 days (fastest 11 days). Average Spud to IP = 73 days. Moved to pad drilling in Q4 2013. Majority of wells in 2014 will be pad drilled. Moved to Company employed pumpers in Q1 2014. Bid o
Slide 14: Track Record of Successful Eagle Ford Development
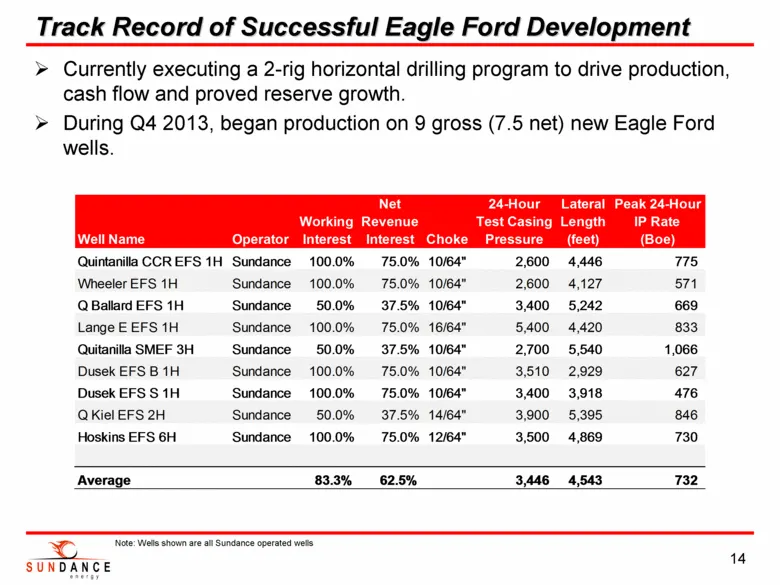
Track Record of Successful Eagle Ford Development 14 Currently executing a 2-rig horizontal drilling program to drive production, cash flow and proved reserve growth. During Q4 2013, began production on 9 gross (7.5 net) new Eagle Ford wells. Note: Wells shown are all Sundance operated wells Net 24-
Slide 15: McMullen County - Eagle Ford Economics
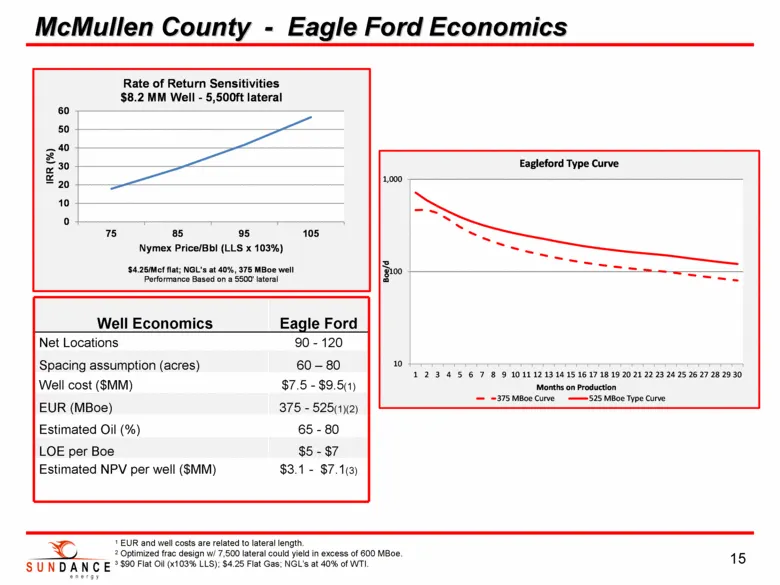
McMullen County - Eagle Ford Economics 15 Well Economics Eagle Ford Net Locations 90 - 120 Spacing assumption (acres) 60 – 80 Well cost ($MM) $7.5 - $9.5(1) EUR (MBoe) 375 - 525(1)(2) Estimated Oil (%) 65 - 80 LOE per Boe $5 - $7 Estimated NPV per well ($MM) $3.1 - $7.1(3) 1 EUR and well costs are r
Slide 16: Logan County Horizontal Activity
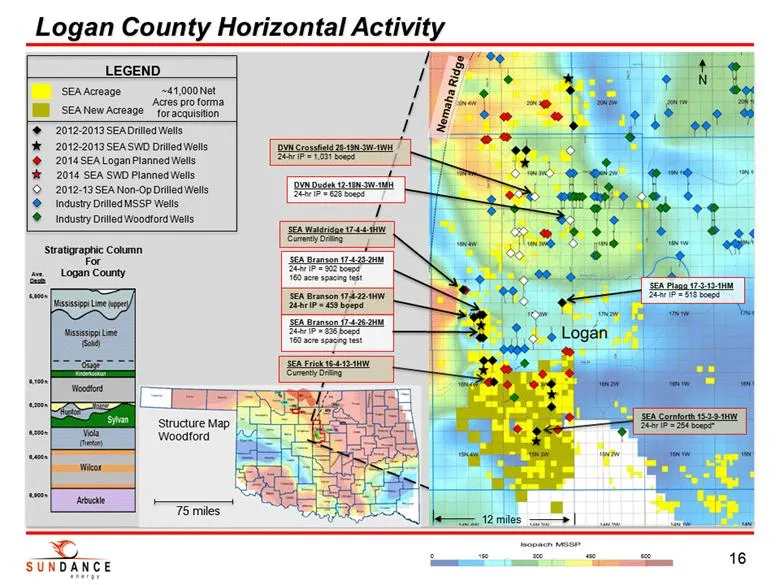
Logan County Horizontal Activity 16 Stratigraphic Column For Logan County LEGEND SEA Acreage 2014 SEA Logan Planned Wells 2012-2013 SEA Drilled Wells 2012-13 SEA Non-Op Drilled Wells Industry Drilled MSSP Wells Industry Drilled Woodford Wells 2012-2013 SEA SWD Drilled Wells 2014 SEA SWD Planned Well
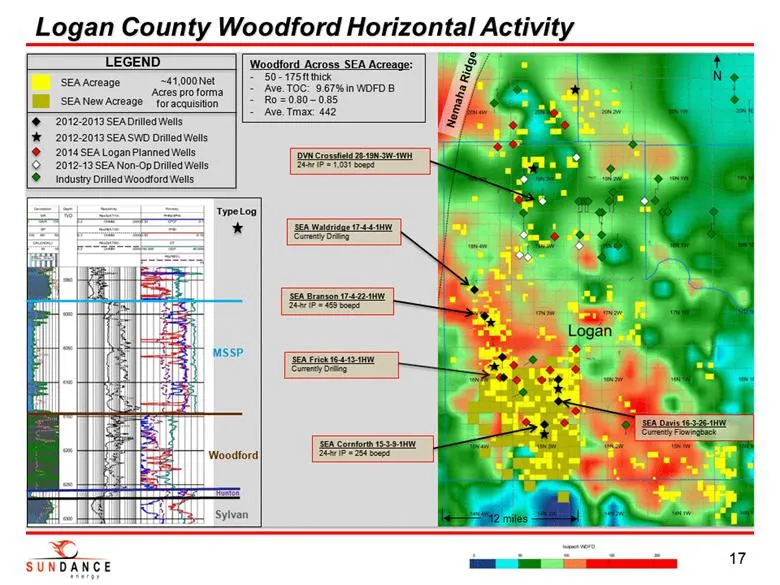
Slide 17: Logan County Woodford Horizontal Activity
Logan County Woodford Horizontal Activity 17 Hunton Woodford MSSP Type Log Sylvan Woodford Across SEA Acreage: 50 - 175 ft thick Ave. TOC: 9.67% in WDFD B Ro = 0.80 – 0.85 Ave. Tmax: 442 LEGEND SEA Acreage 2014 SEA Logan Planned Wells 2012-2013 SEA Drilled Wells 2012-13 SEA Non-Op Drilled Wells Indu
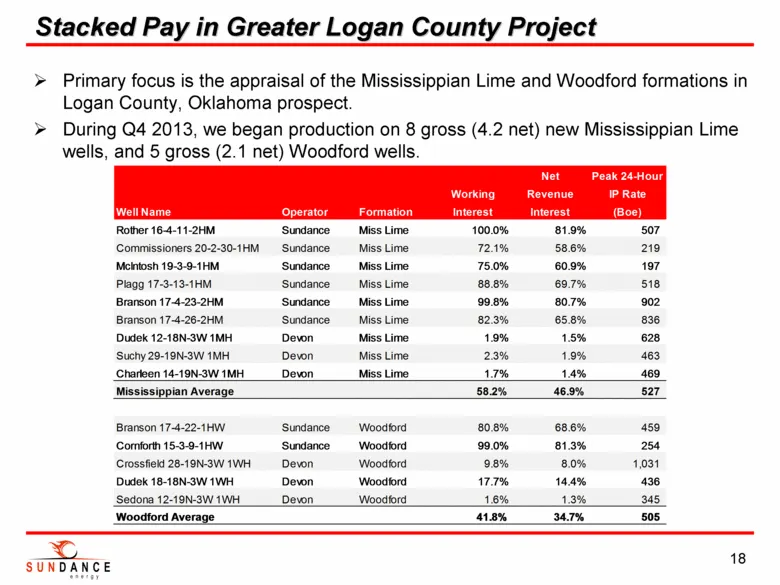
Slide 18: Stacked Pay in Greater Logan County Project
Primary focus is the appraisal of the Mississippian Lime and Woodford formations in Logan County, Oklahoma prospect. During Q4 2013, we began production on 8 gross (4.2 net) new Mississippian Lime wells, and 5 gross (2.1 net) Woodford wells. Stacked Pay in Greater Logan County Project 18 Net Peak 24
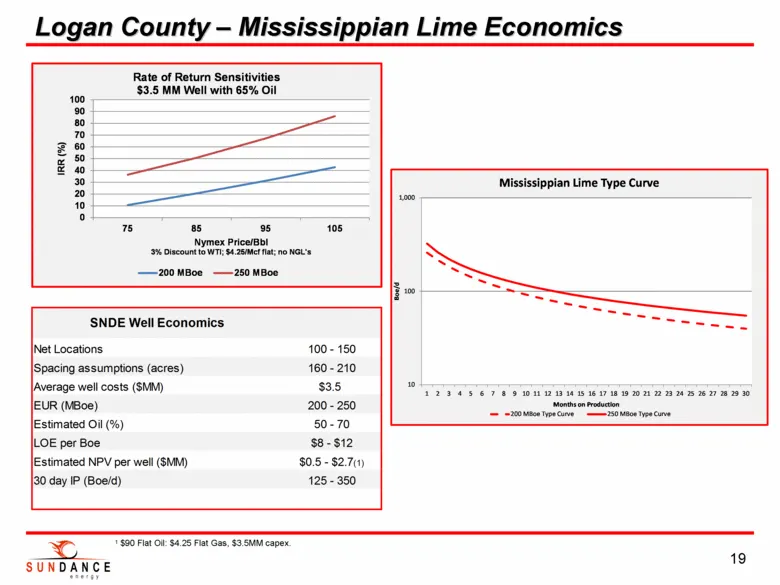
Slide 19: Logan County – Mississippian Lime Economics
Logan County – Mississippian Lime Economics 19 1 $90 Flat Oil: $4.25 Flat Gas, $3.5MM capex. 10 100 1,000 1 2 3 4 5 6 7 8 9 10 11 12 13 14 15 16 17 18 19 20 21 22 23 24 25 26 27 28 29 30 Boe/d Months on Production Mississippian Lime Type Curve 200 MBoe Type Curve 250 MBoe Type Curve 0 10 20 30 40 50
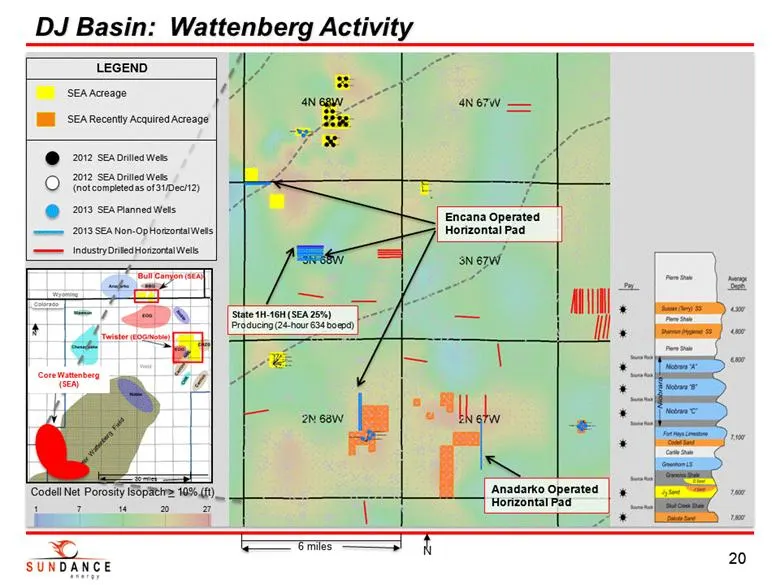
Slide 20: DJ Basin: Wattenberg Activity
30 miles N Wyoming Colorado Greater Wattenberg Field DJ Basin: Wattenberg Activity 20 6 miles N Codell Net Porosity Isopach > 10% (ft) 1 7 20 14 27 Encana Operated Horizontal Pad LEGEND SEA Acreage 2013 SEA Non-Op Horizontal Wells Industry Drilled Horizontal Wells 2012 SEA Drilled Wells SEA Recently
Slide 21: Upside in Potential Wattenberg Horizontal Program
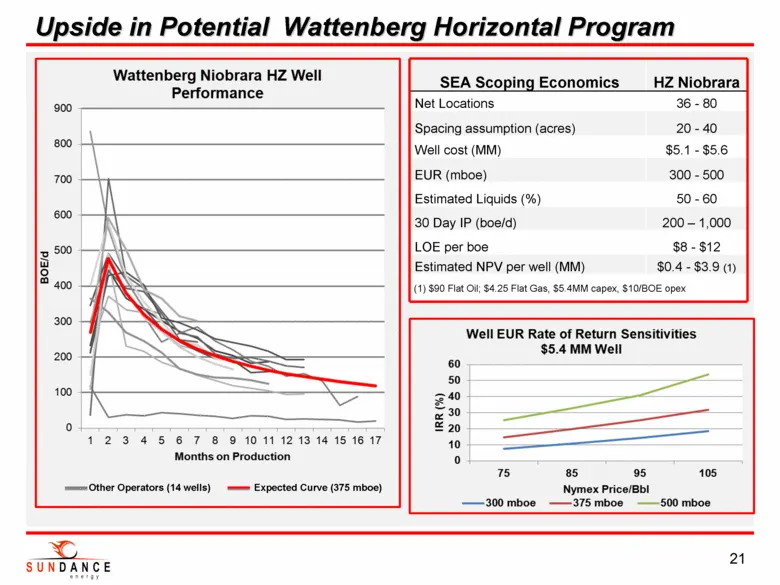
Upside in Potential Wattenberg Horizontal Program 21 Other Operators (14 wells) Expected Curve (375 mboe) SEA Scoping Economics HZ Niobrara Net Locations 36 - 80 Spacing assumption (acres) 20 - 40 Well cost (MM) $5.1 - $5.6 EUR (mboe) 300 - 500 Estimated Liquids (%) 50 - 60 30 Day IP (boe/d) 200 – 1
Slide 22: Activity Pipeline
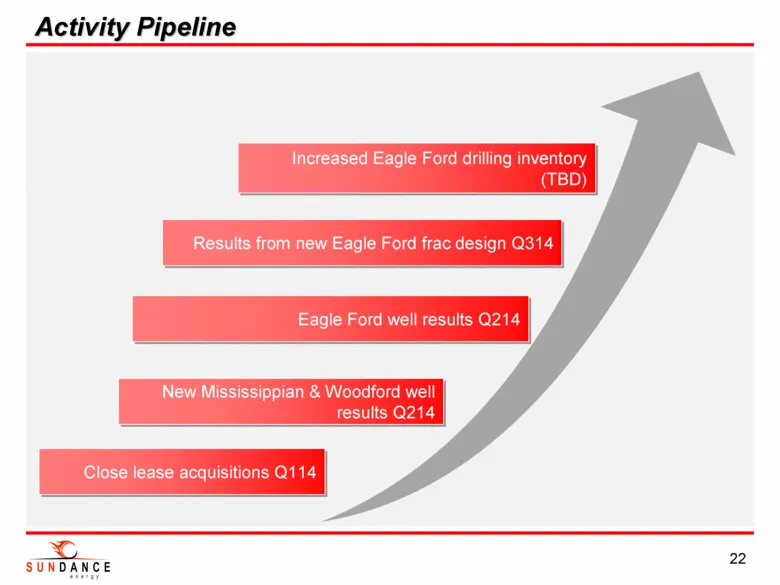
Activity Pipeline 22 Close lease acquisitions Q114 Eagle Ford well results Q214 New Mississippian & Woodford well results Q214 Results from new Eagle Ford frac design Q314 Increased Eagle Ford drilling inventory (TBD)
Slide 23: Appendices
SUNDANCE Appendices 23
Slide 24: High Quality, Scalable Reserves
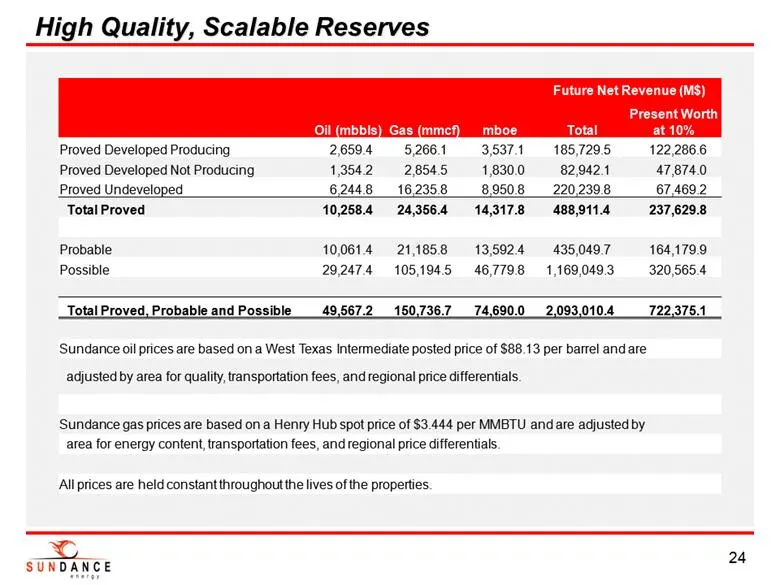
High Quality, Scalable Reserves 24 Future Net Revenue (M$) Oil (mbbls) Gas (mmcf) mboe Total Present Worth at 10% Proved Developed Producing 2,659.4 5,266.1 3,537.1 185,729.5 122,286.6 Proved Developed Not Producing 1,354.2 2,854.5 1,830.0 82,942.1 47,874.0 Proved Undeveloped 6,244.8 16,235.8 8,950.
Slide 25: Board of Directors
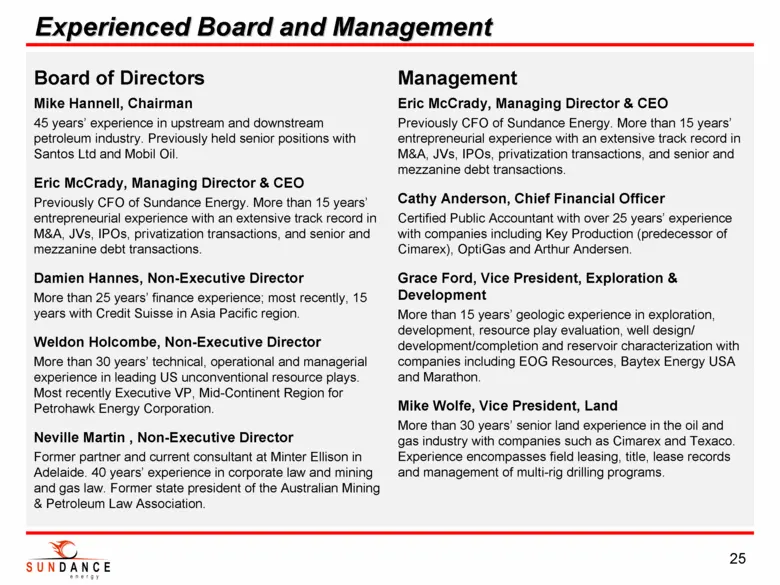
Board of Directors Mike Hannell, Chairman 45 years’ experience in upstream and downstream petroleum industry. Previously held senior positions with Santos Ltd and Mobil Oil. Eric McCrady, Managing Director & CEO Previously CFO of Sundance Energy. More than 15 years’ entrepreneurial experience with a
Slide 26: Reserve pricing and cost assumptions
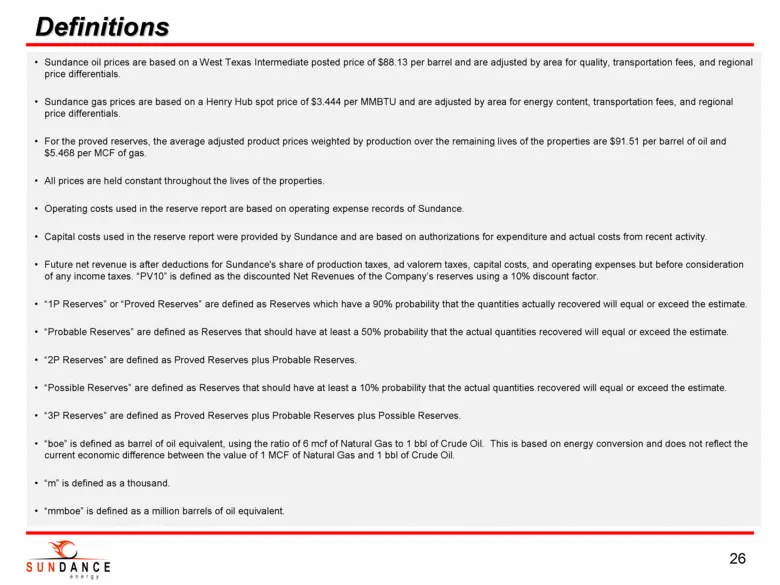
Sundance oil prices are based on a West Texas Intermediate posted price of $88.13 per barrel and are adjusted by area for quality, transportation fees, and regional price differentials. Sundance gas prices are based on a Henry Hub spot price of $3.444 per MMBTU and are adjusted by area for energy co
Slide 27: Offer restrictions: Canada
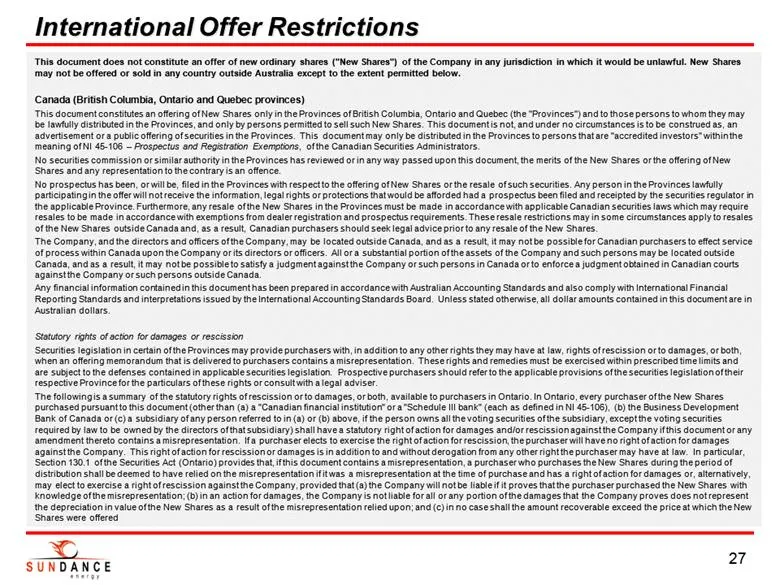
This document does not constitute an offer of new ordinary shares ("New Shares") of the Company in any jurisdiction in which it would be unlawful. New Shares may not be offered or sold in any country outside Australia except to the extent permitted below. Canada (British Columbia, Ontario and Quebec
Slide 28: Offer restrictions: Ontario securities law rights
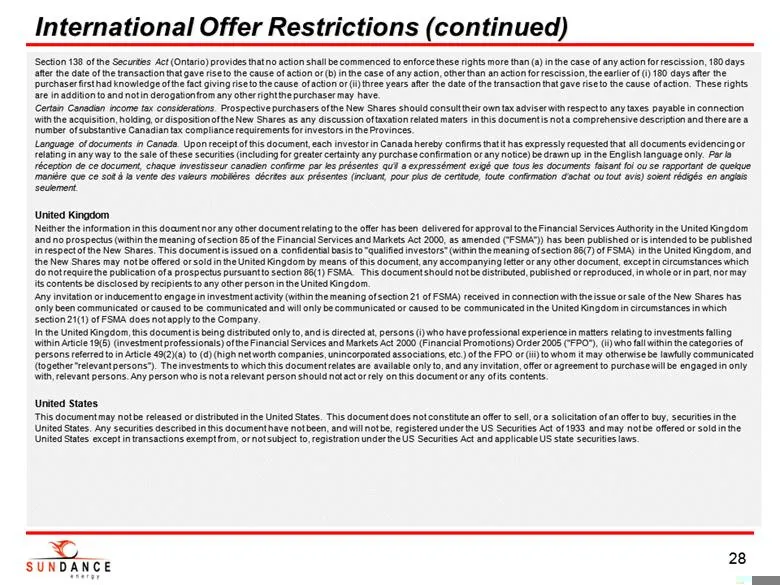
Section 138 of the Securities Act (Ontario) provides that no action shall be commenced to enforce these rights more than (a) in the case of any action for rescission, 180 days after the date of the transaction that gave rise to the cause of action or (b) in the case of any action, other than an acti
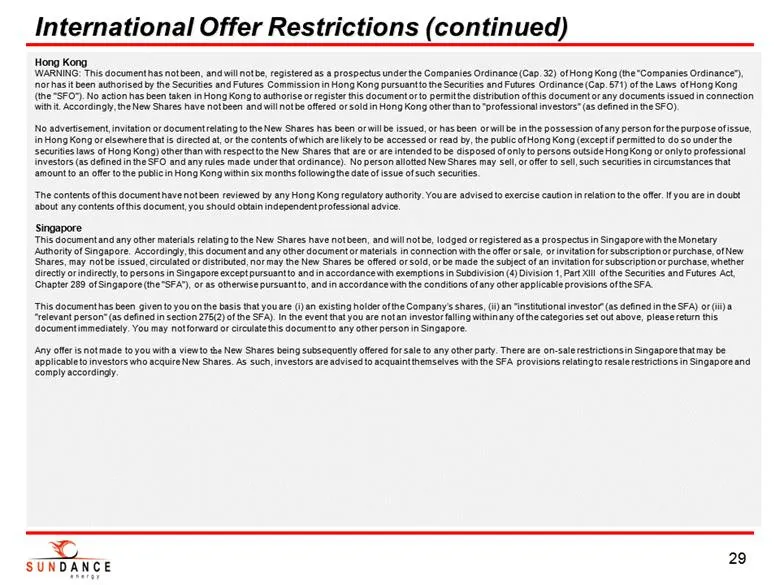
Slide 29: Offer restrictions: Hong Kong
Hong Kong WARNING: This document has not been, and will not be, registered as a prospectus under the Companies Ordinance (Cap. 32) of Hong Kong (the "Companies Ordinance"), nor has it been authorised by the Securities and Futures Commission in Hong Kong pursuant to the Securities and Futures Ordinan
Source: SEC EDGAR · 6-K filed Feb 27, 2014
More decks from Sundance Energy Inc
 Investor Presentation (February 2020)25 slides · Feb 10, 2020
 Sundance Energy Australia — Q3 2019 Earnings Presentation24 slides · Nov 18, 2019
 Sundance Energy Australia — Q2 2019 Earnings Presentation25 slides · Aug 16, 2019
 Sundance Energy Australia — Investor Presentation (July 2019)19 slides · Jul 24, 2019
 Sundance Energy Australia — Investor Presentation (June 2019)16 slides · Jun 3, 2019
 Sundance Energy Australia — Q1 2019 Earnings Presentation17 slides · May 21, 2019