Chiquita Brands International Inc
Chiquita Brands International — Merger or Acquisition (September 2014)
23 slides from Chiquita Brands International's merger presentation, Sep 17, 2014
Slide 1: Investor Presentation, September 2014
17 September 2014 Investor Presentation
Slide 2: Forward-looking statements
1 This presentation contains certain statements that are "forward - looking statements." These statements are subject to a number of assumptions, risks and uncertainties, many of which are beyond the control of Chiquita and Fyffes, including: the customary risks experienced by glo bal food companies
Slide 3: Choice for Chiquita Shareholders
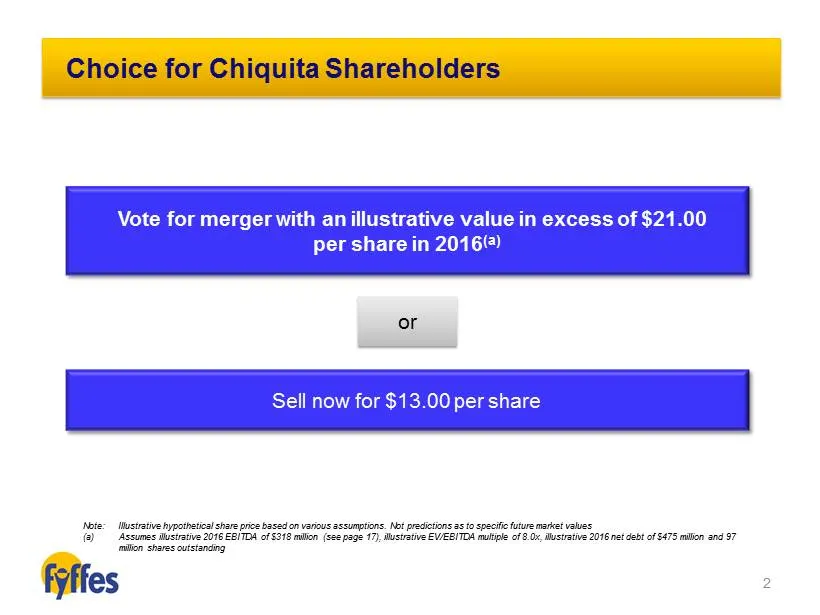
2 Choice for Chiquita Shareholders Sell now for $13.00 per share Vote for merger with a n illustrative value in excess of $21.00 per share in 2016 (a) or Note: Illustrative hypothetical share price based on various assumptions. Not predictions as to specific future market values (a) Assumes illustra
Slide 4: Value-Maximising Opportunity for Chiquita Shareholders
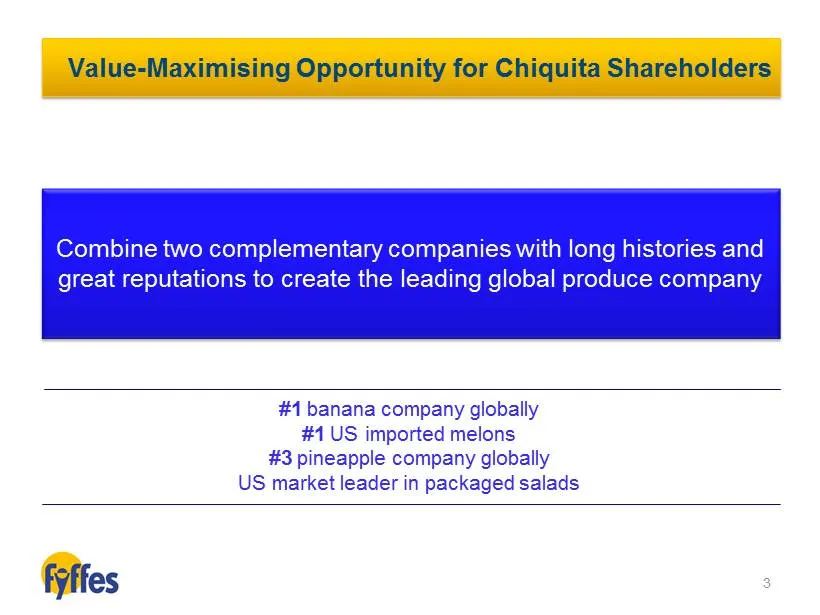
Combine two complementary companies with long histories and great reputations to create the leading global produce company Value - Maximising Opportunity for Chiquita Shareholders #1 banana company globally # 1 US i mported melons #3 pineapple company globally US market leader in packaged salads 3
Slide 5: Agenda
4 Agenda Fyffes Introduction Chiquita / Fyffes Merger Rationale
Slide 6: Fyffes Proven Management Team
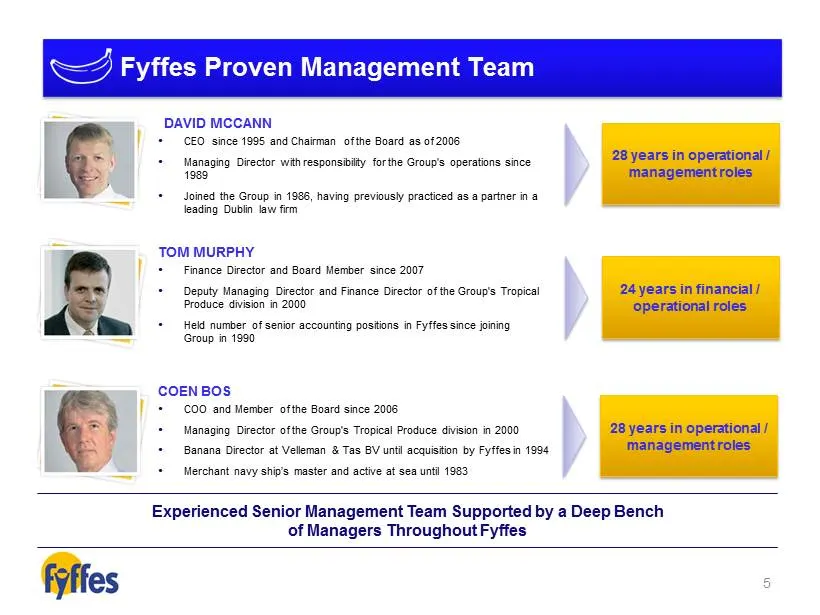
Fyffes Proven Management Team 28 years in operational / management roles • CEO since 1995 and Chairman of the Board as of 2006 • Managing Director with responsibility for the Group's operations since 1989 • Joined the Group in 1986, having previously practiced as a partner in a leading Dublin law fi
Slide 7: A Strong Business
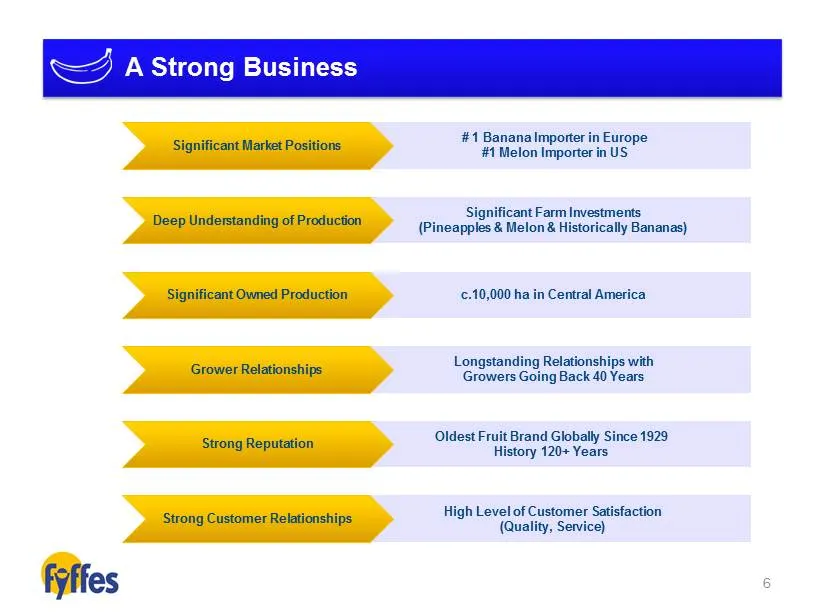
Significant Farm Investments ( Pineapples & Melon & Historically Bananas) c.10,000 ha in Central America Longstanding Relationships with Growers Going Back 40 Years Oldest Fruit Brand Globally Since 1929 History 120+ Years # 1 Banana Importer in Europe #1 Melon Importer in US High Level of Customer
Slide 8: Growth and Development Part of Our DNA
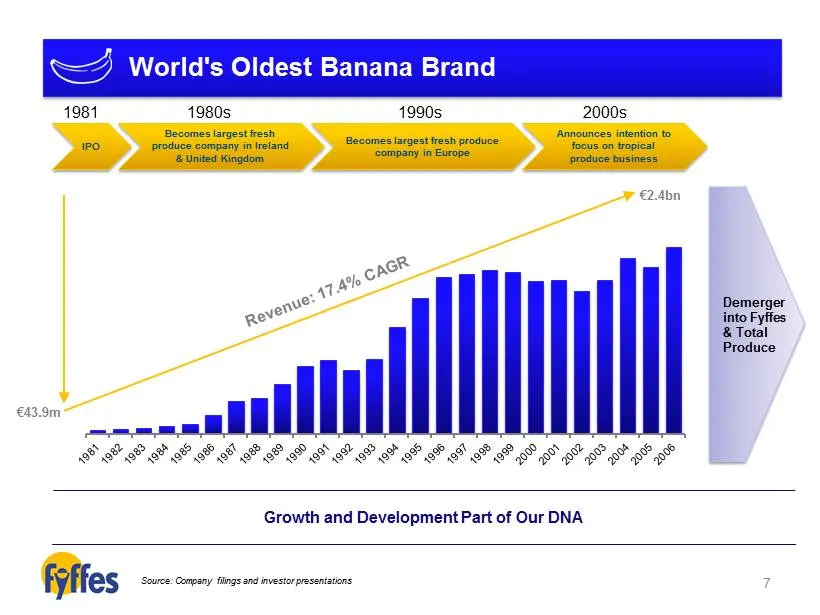
IPO Becomes largest fresh produce company in Ireland & United Kingdom Becomes largest fresh produce company in Europe 1981 1980s 1990s Demerger into Fyffes & Total Produce € 43.9m € 2.4bn Announces intention to focus on tropical produce business 2000s World's Oldest Banana Brand Growth and Developme
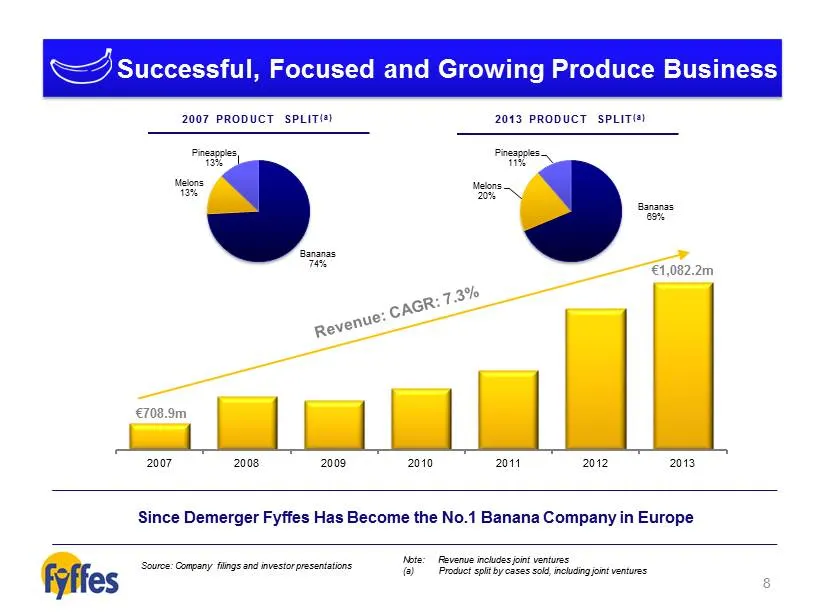
Slide 9: Successful, Focused and Growing Produce Business
2007 2008 2009 2010 2011 2012 2013 Bananas 69% Melons 20% Pineapples 11% Source: Company filings and investor presentations € 708.9m € 1,082.2m 2007 PRODUCT SPLIT (a) Bananas 74% Melons 13% Pineapples 13% 2013 PRODUCT SPLIT (a) Successful, Focused and Growing Produce Business Note: Revenue includes
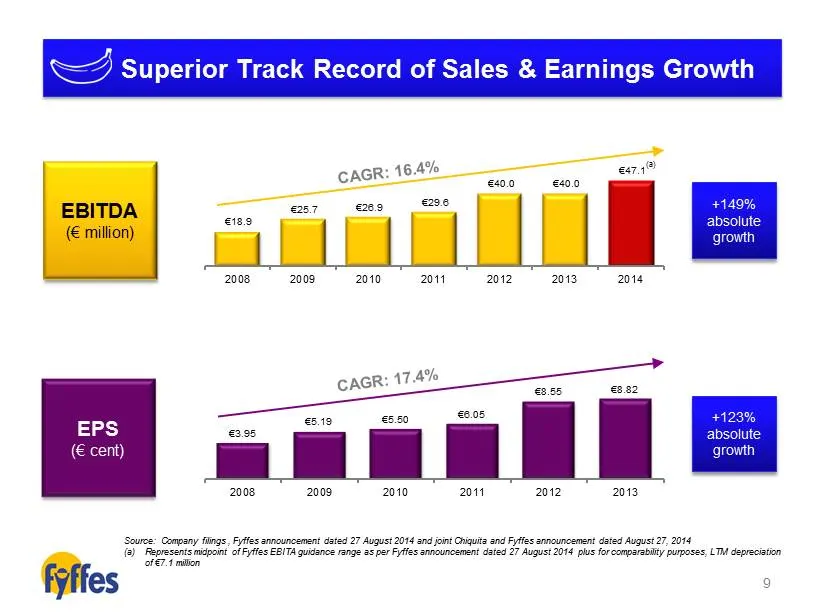
Slide 10: Superior Track Record of Sales & Earnings Growth
€ 18.9 € 25.7 € 26.9 € 29.6 € 40.0 € 40.0 € 47.1 2008 2009 2010 2011 2012 2013 2014 EBITDA ( € million) € 3.95 € 5.19 € 5.50 € 6.05 € 8.55 € 8.82 2008 2009 2010 2011 2012 2013 + 149% absolute growth +123% absolute growth Superior Track Record of Sales & Earnings Growth (a) Source : Company filings ,
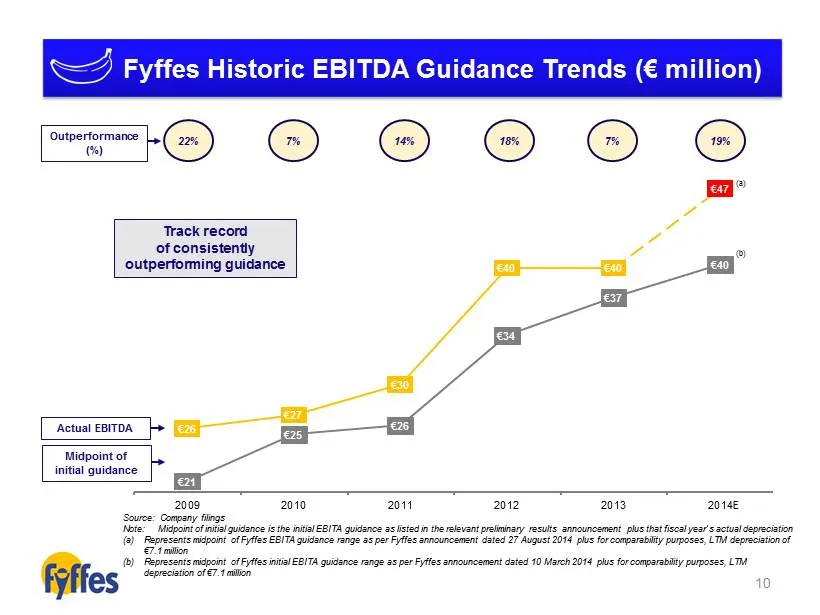
Slide 11: Fyffes Historic EBITDA Guidance Trends
€ 26 € 27 € 30 € 40 € 40 € 47 € 21 € 25 € 26 € 34 € 37 € 40 2009 2010 2011 2012 2013 2014 (a) (b) Fyffes Historic EBITDA Guidance Trends ( € million) Source: Company filings Note: Midpoint of initial guidance is the initial EBITA guidance as listed in the relevant preliminary results announcement pl
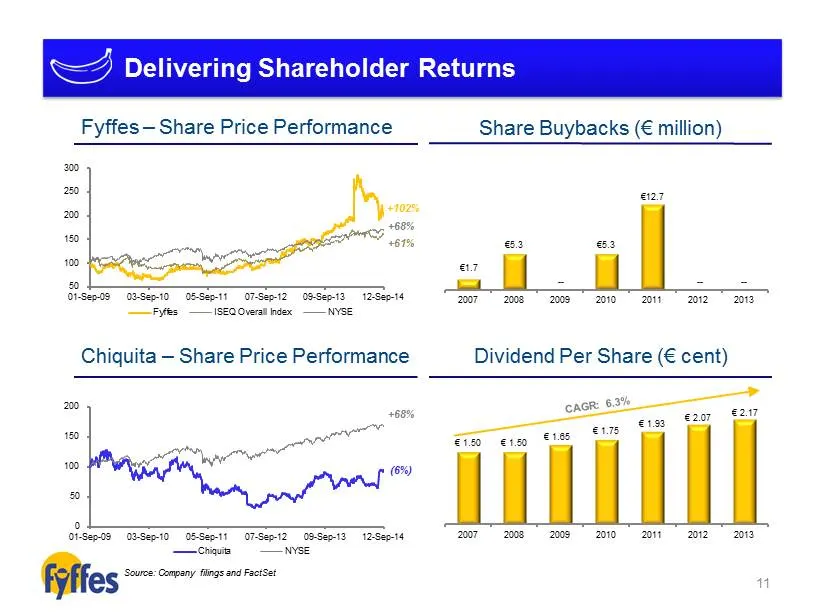
Slide 12: Delivering Shareholder Returns
11 € 1.50 € 1.50 € 1.65 € 1.75 € 1.93 € 2.07 € 2.17 2007 2008 2009 2010 2011 2012 2013 50 100 150 200 250 300 01-Sep-09 03-Sep-10 05-Sep-11 07-Sep-12 09-Sep-13 12-Sep-14 Fyffes ISEQ Overall Index NYSE Source: Company filings and FactSet +102% +61% 0 50 100 150 200 01-Sep-09 03-Sep-10 05-Sep-11 07-Se
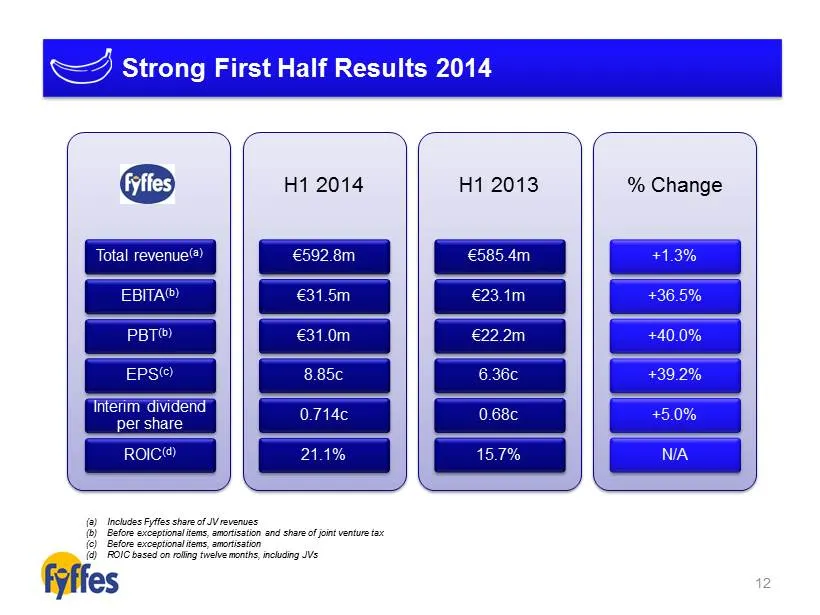
Slide 13: Strong First Half Results 2014
12 Total revenue (a) EBITA (b) PBT (b) EPS (c) Interim dividend per share ROIC (d) H1 2014 € 592.8m € 31.5m € 31.0m 8.85c 0.714c 21.1% H1 2013 € 585.4m € 23.1m € 22.2m 6.36c 0.68c 15.7% % Change +1.3% +36.5% +40.0% +39.2% +5.0% N/A (a) Includes Fyffes share of JV revenues (b) Before exceptional item
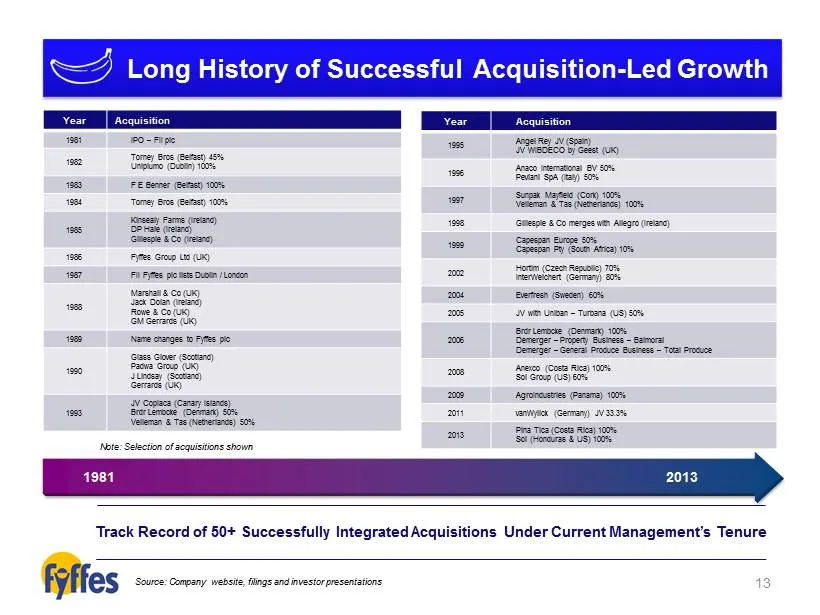
Slide 14: Long History of Successful Acquisition-Led Growth
13 Long History of Successful Acquisition - Led Growth Year Acquisition 1995 Angel Rey JV (Spain) JV WIBDECO by Geest (UK) 1996 Anaco International BV 50% Peviani SpA (Italy) 50% 1997 Sunpak Mayfield (Cork) 100% Velleman & Tas (Netherlands) 100% 1998 Gillespie & Co merges with Allegro (Ireland) 1999
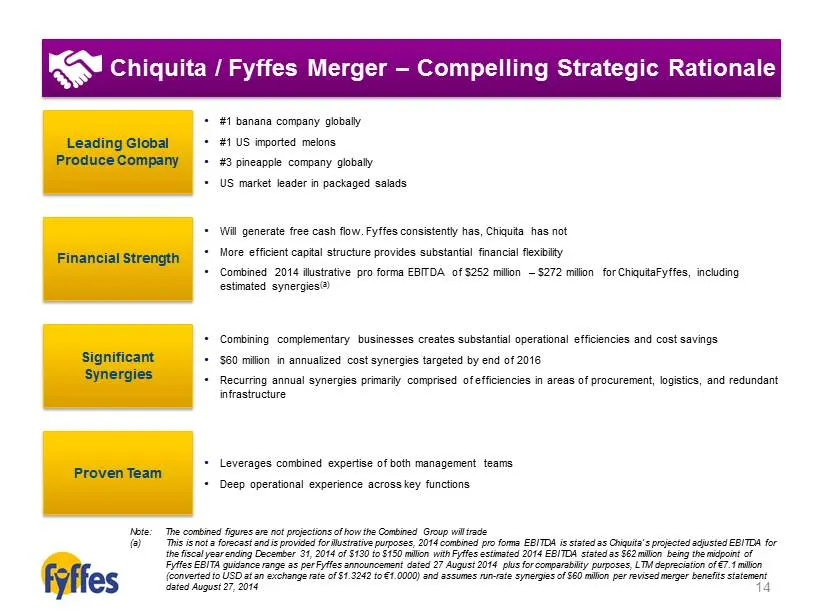
Slide 15: Chiquita / Fyffes Merger – Compelling Strategic Rationale
Chiquita / Fyffes Merger – Compelling Strategic Rationale Leading Global Produce Company • #1 banana company globally • # 1 US imported melons • #3 pineapple company globally • US market leader in packaged salads Financial Strength • Will generate free cash flow. Fyffes consistently has, Chiquita ha
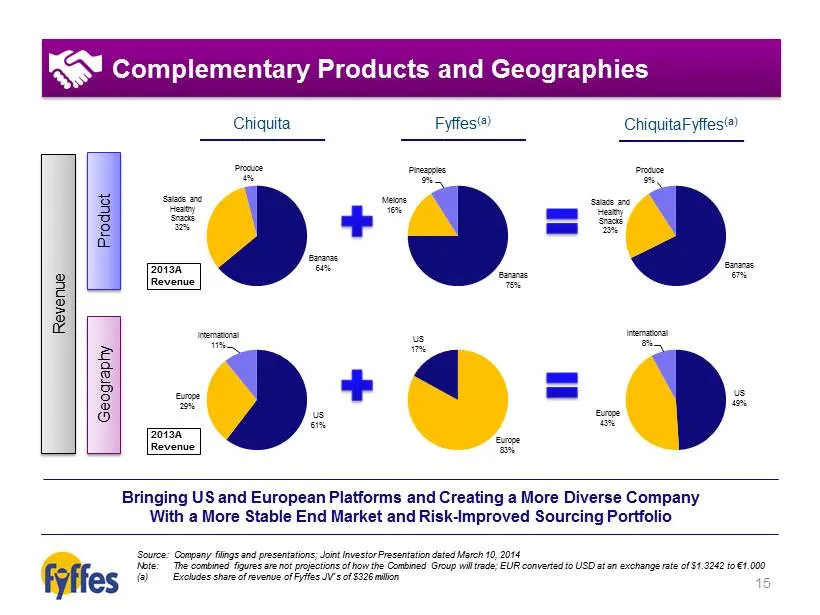
Slide 16: Complementary Products and Geographies
Chiquita Source: Company filings and presentations; Joint Investor Presentation dated March 10, 2014 Note: The combined figures are not projections of how the Combined Group will trade; EUR converted to USD at an exchange rate o f $1.3242 to € 1.000 (a) Excludes share of revenue of Fyffes JV’s of $3
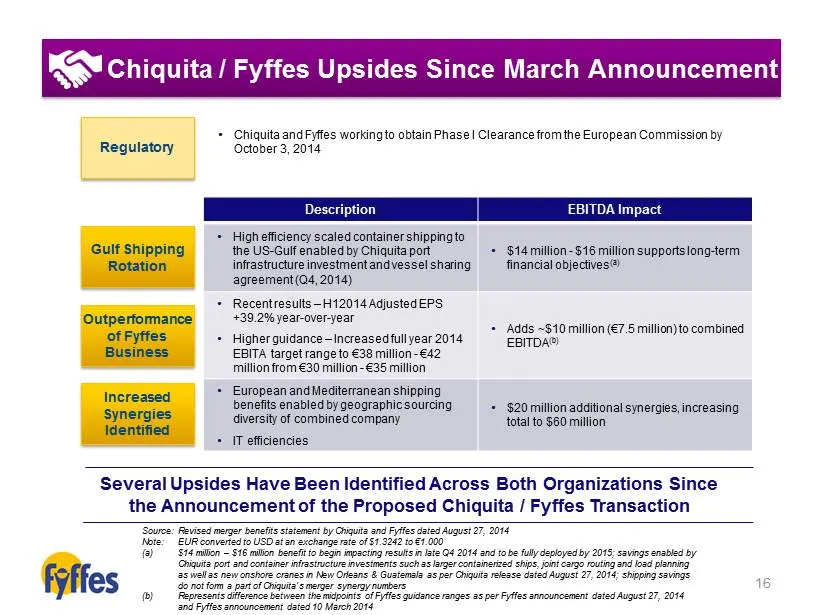
Slide 17: Chiquita / Fyffes Upsides Since March Announcement
Chiquita / Fyffes Upsides Since March Announcement Description EBITDA Impact • High efficiency scaled container shipping to the US - Gulf enabled by Chiquita port infrastructure investment and vessel sharing agreement (Q4, 2014) • $14 million - $16 million supports long - term financial objectives (
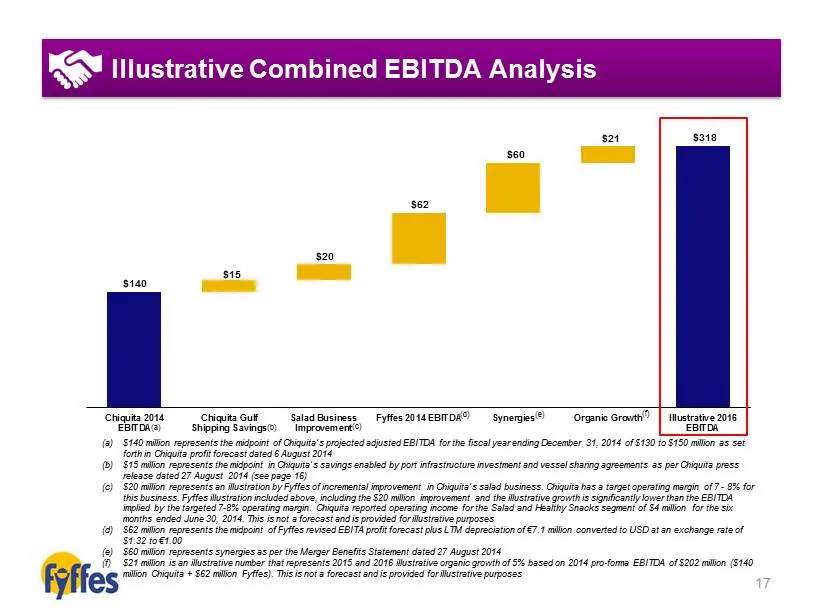
Slide 18: Illustrative Combined EBITDA Analysis
17 Illustrative Combined EBITDA Analysis $140 $318 $15 $20 $62 $60 $21 Chiquita 2014 EBITDA Chiquita Gulf Shipping Savings Salad Business Improvement Fyffes 2014 EBITDA Synergies Organic Growth Illustrative 2016 EBITDA (a) $140 million represents the midpoint of Chiquita’s projected adjusted EBITDA
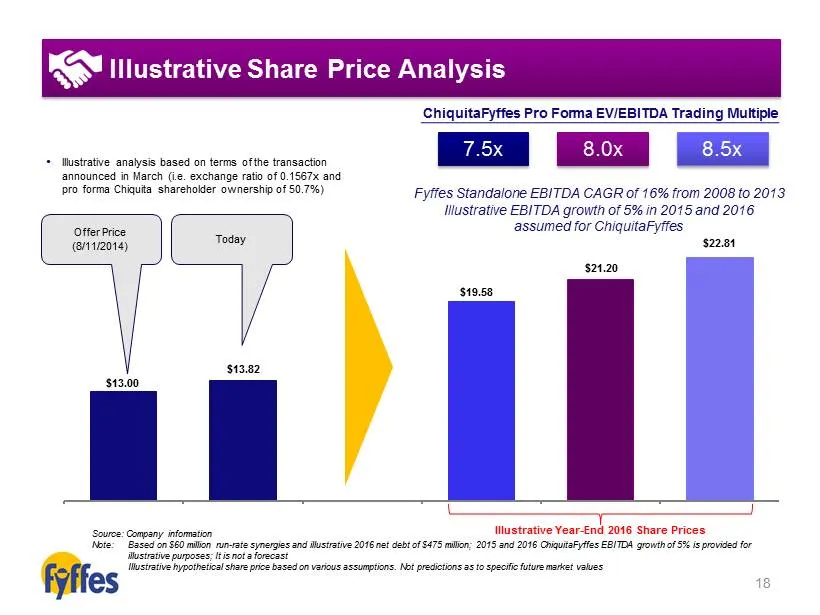
Slide 19: Illustrative Share Price Analysis
18 Illustrative Share Price Analysis $13.00 $13.82 $19.58 $21.20 $22.81 Fyffes Standalone EBITDA CAGR of 16% from 2008 to 2013 Illustrative EBITDA growth of 5% in 2015 and 2016 assumed for ChiquitaFyffes Source: Company information Note: Based on $60 million run - rate synergies and illustrative 201
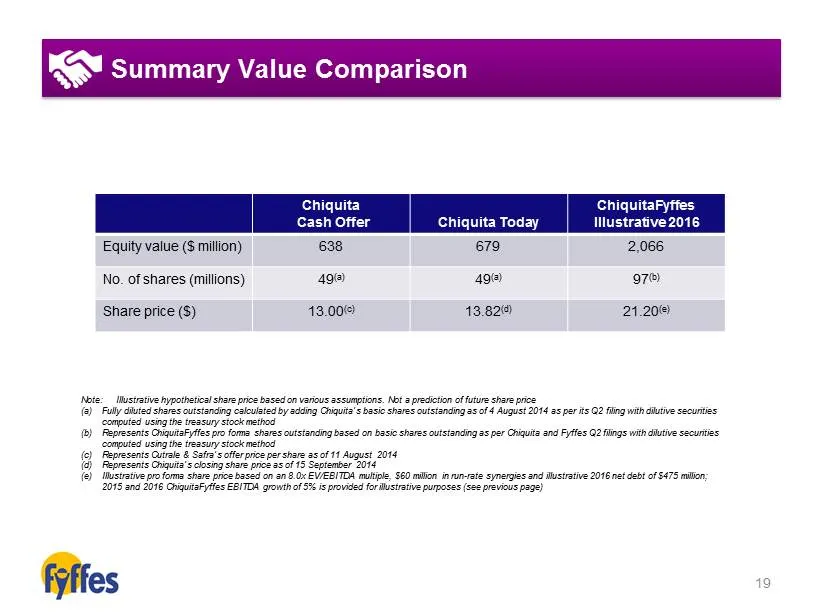
Slide 20: Summary Value Comparison
19 Summary Value Comparison Chiquita Cash Offer Chiquita Today ChiquitaFyffes Illustrative 2016 Equity value ($ million) 638 679 2,066 No. of shares (millions) 49 (a) 49 (a) 97 (b) Share price ($) 13.00 (c) 13.82 (d) 21.20 (e) Note: Illustrative hypothetical share price based on various assumptions.
Slide 21: No Offer or Solicitation
20 No Offer or Solicitation This communication is not intended to and does not constitute an offer to sell or the solicitation of an offer to subscribe f or or buy or an invitation to purchase or subscribe for any securities or the solicitation of any vote or approval in any jurisdiction pursuant to
Slide 22: Important Information
21 Important Information GENERAL The release, publication or distribution of this presentation in or into certain jurisdictions may restricted by the laws of thos e j urisdictions. Accordingly, copies of this presentation and all other documents relating to the combination are not being, and must no
Slide 23: Historical performance of Fyffes notice
22 This presentation contains certain information regarding the historical performance of Fyffes. There can be no assurance that ac tual results will not materially differ from expectations based on such historical performance. Important factors could cause actual results to dif fer materially from
Source: SEC EDGAR · 425 filed Sep 17, 2014
More decks from Chiquita Brands International Inc
 Merger or Acquisition (October 2014)24 slides · Oct 20, 2014
 Merger or Acquisition (October 2014)23 slides · Oct 20, 2014
 Proxy Contest (October 2014)15 slides · Oct 16, 2014
 Merger or Acquisition (October 2014)15 slides · Oct 14, 2014
 Proxy Contest (September 2014)28 slides · Sep 23, 2014
 Merger or Acquisition (September 2014)24 slides · Sep 2, 2014