Guaranty Bancorp — Sandler O'Neill + Partners 2014 West Coast Financial Services Conference
23 slides from Guaranty Bancorp's conference presentation, Mar 10, 2014

Slide 1: Sandler O'Neill 2014 West Coast Financial Services Conference
G GUARANTY BANCORP” Sandler O'Neill + Partners, L.P. 2014 West Coast Financial Services Conference Phoenix, AZ March 11, 2014
Slide 2: Forward Looking Statements
Forward Looking Statements a This presentation contains forward-looking statements, which are included in acoordance with the “safe harbor provisions ofthe Private Secures Litigation Reform Act of 1995. In some cases, you can ident forward-looking statements by terminology such as may, “will” “shoul
Slide 3: About Us - Guaranty Bancorp
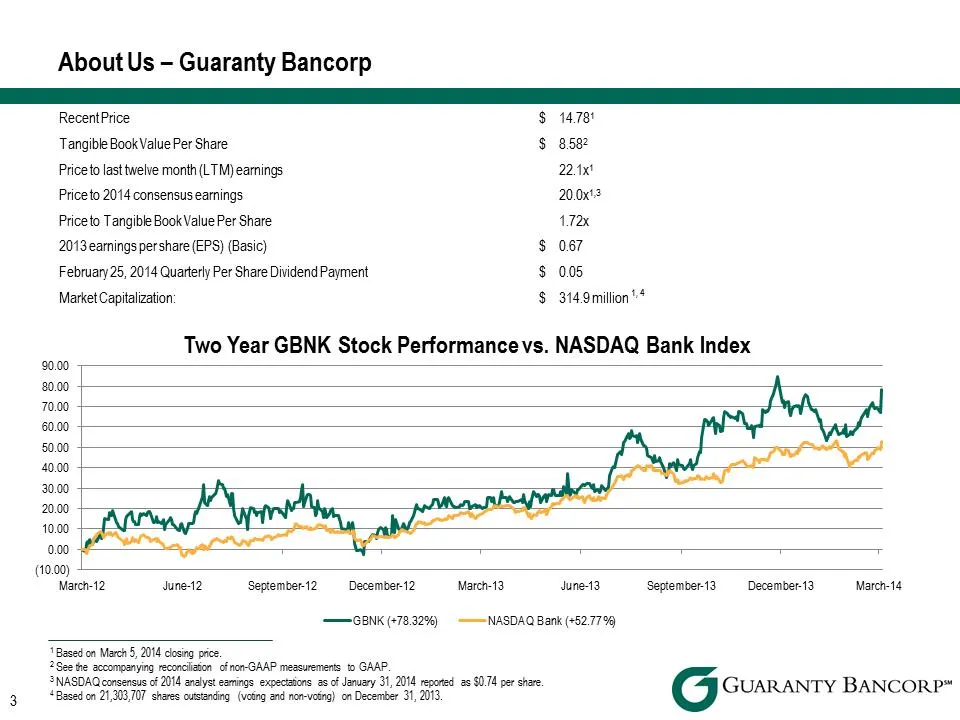
About Us - Guaranty Bancorp RecentPrice S$ 1478 Tangible Book Value Per Share $8582 Priveto last twelve month (LTM) eamings 22.Ax1 Priceto 2044 consensus eamings 20.0x'3 Priceto Tangible Book Value Per Share 11x 2013 eamings per share (EPS) (Basic) $ 067 February 25, 2014 Quarterly Per Share Dividen
Slide 4: About Us - Guaranty Bancorp
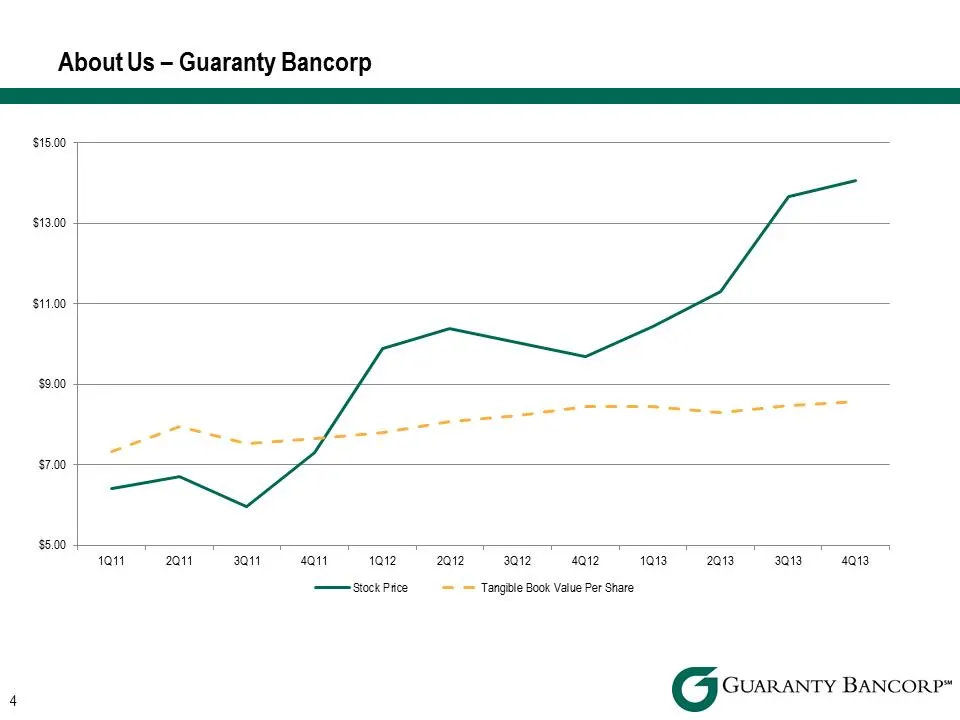
About Us - Guaranty Bancorp $16.00 sis a $11.00 $9.00 $7.00 $5.00 1011 2a1t 3att 4att 1012 2ar2-3a12 4a12 10132018 a3 4013 stock Price = — Tangible Book Value Per Share G GUARANTY BANCORP”
Slide 5: About Us - Guaranty Bancorp
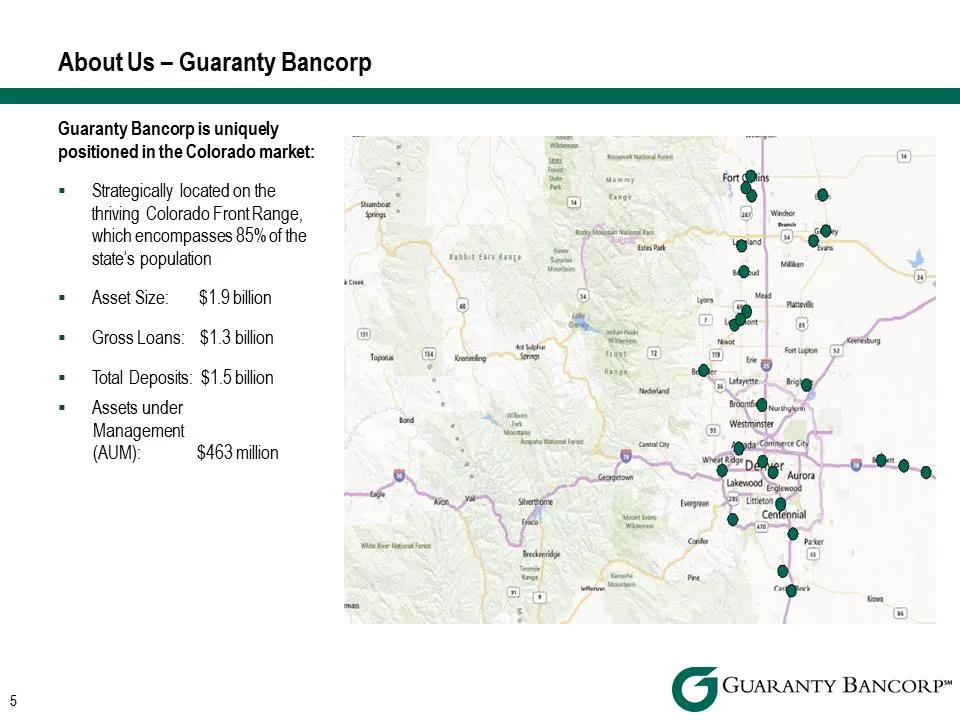
About Us - Guaranty Bancorp a Guaranty Bancorp is uniquely positioned in the Colorado market: = — Strategically located on the “¢ ry thriving Colorado Front Range, mms ed which encompasses 89% of the et © & state’s population * Asset Size: $1.9billion oa = GrossLoans: $1.3 billion = = Total Deposits
Slide 6: Investment Considerations
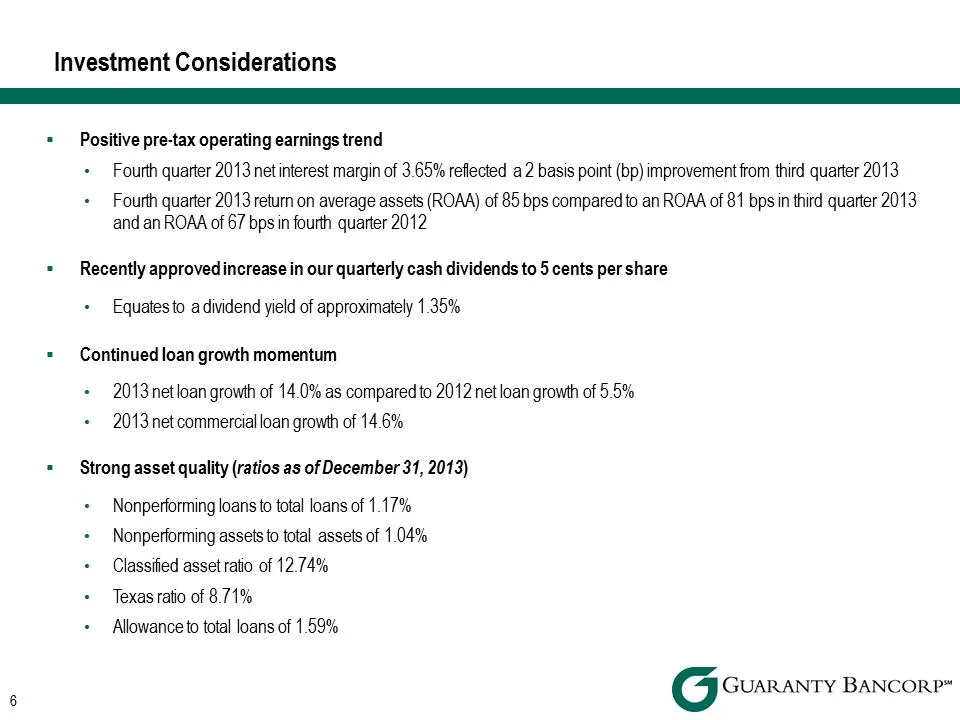
Investment Considerations a = — Positive pre-tax operating earnings trend Fourth quarter 2013 net interest margin of 3.65% reflected a 2 basis point (bp) improvement from third quarter 2013 Fourth quarter 2013 return on average assets (ROAA) of 85 bps compared to an ROAA of 81 bpsiin third quarter 2
Slide 7: Investment Considerations
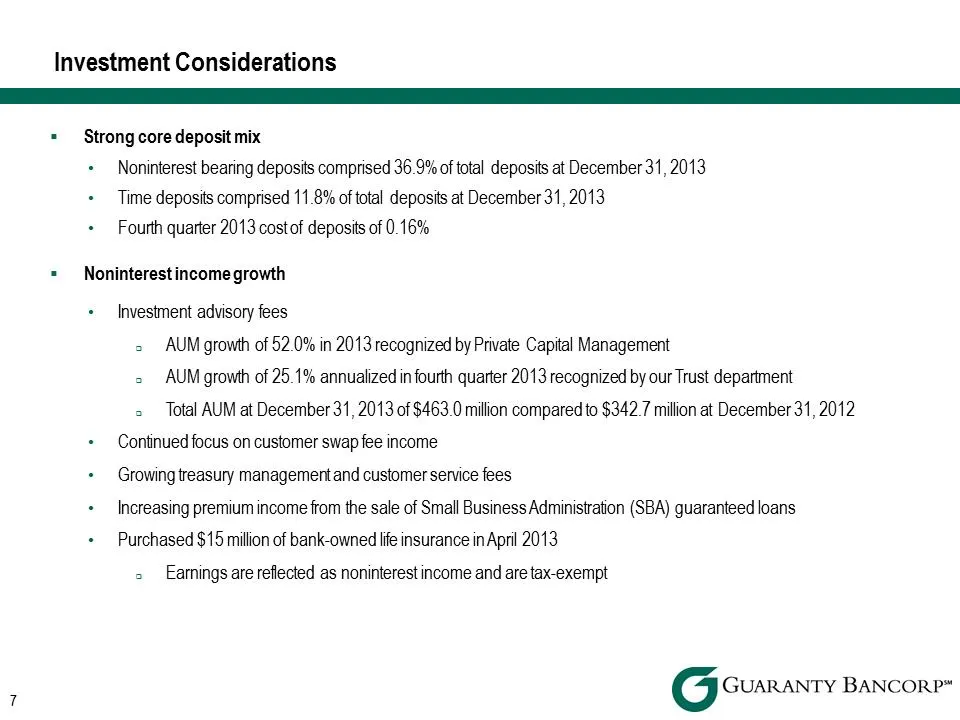
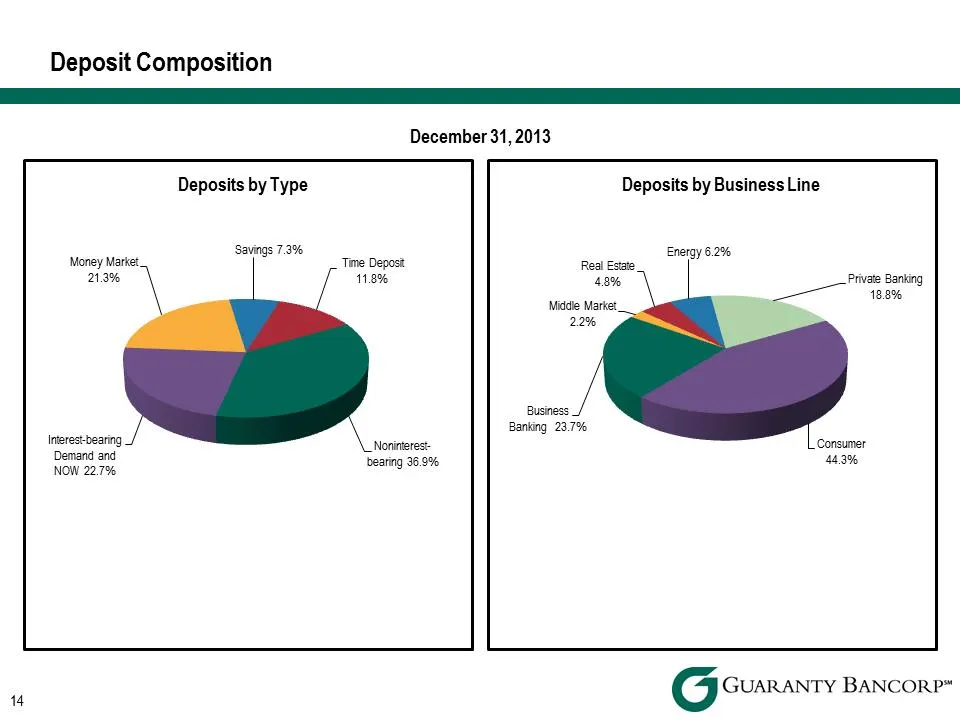
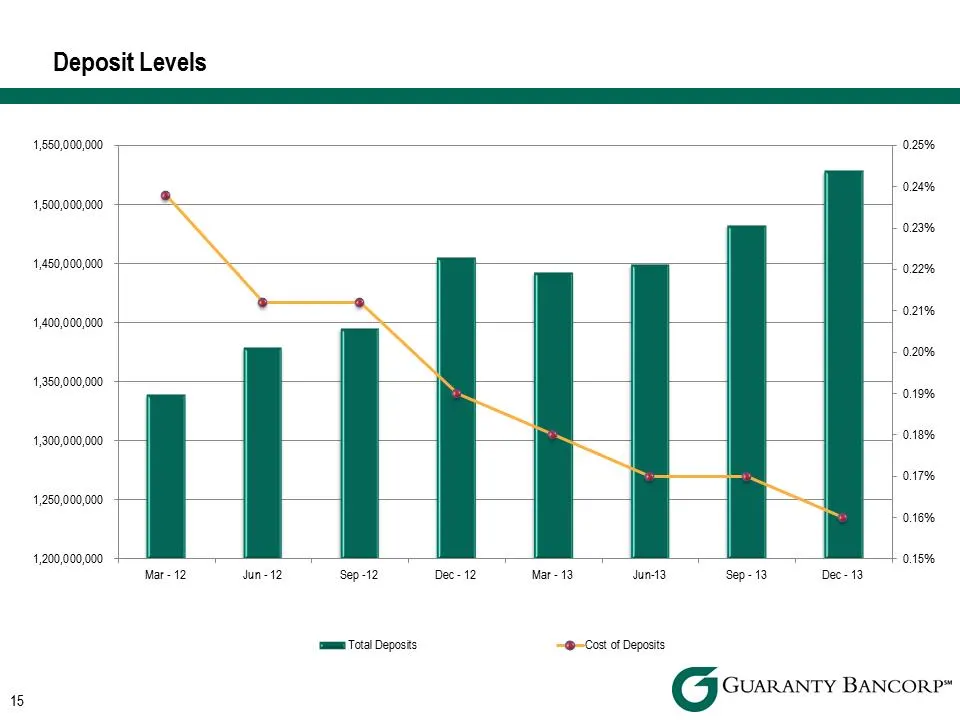
Investment Considerations a = — Strong core deposit mix Noninterest bearing deposits comprised 36.9% of total deposits at December 31, 2013 Time deposits comprised 11.8% of total deposits at December 31, 2013 Fourth quarter 2013 cost of deposits of 0.16% = — Noninterest income growth Investment advi
Slide 8: Investment Considerations
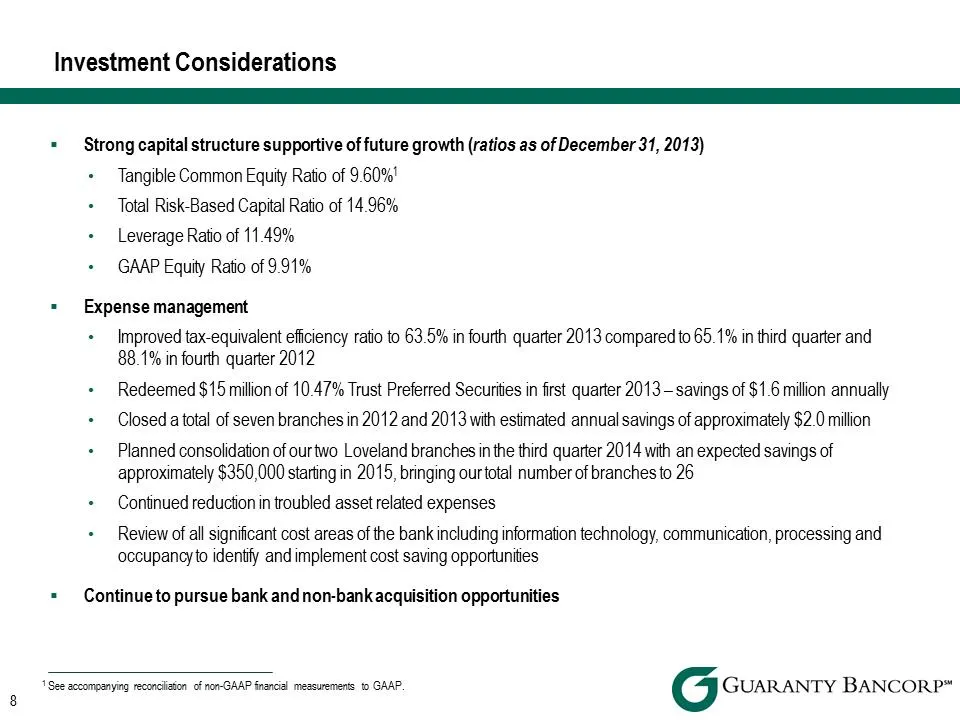
Investment Considerations a = Strong capital structure supportive of future growth (ratios as of December 31, 2013) + Tangible Common Equity Ratio of 9.60%! + Total Risk-Based Capital Ratio of 14.96% + — Leverage Ratio of 11.49% + GAAP Equity Ratio of 9.91% = — Expense management + Improved tax-equi
Slide 9: Net Interest Income
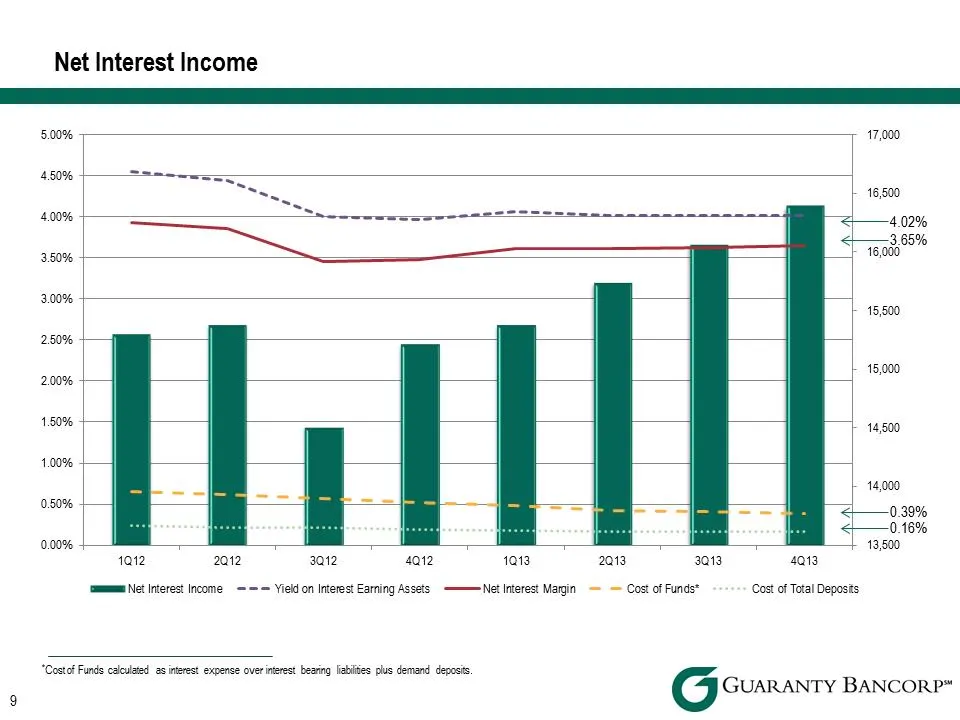
Net Interest Income ‘mmm Net Inierest Income === Yield on Interest Earning Assets —=Net Interest Main — — Cost of Funds* Cost of Total Deposts “Costof Funds calculated as nteest expanse over interest bearing bites plus demand deposi. G GUARANTY BANCORP”
Slide 10: Core Noninterest Income and Tax Equivalent Efficiency Ratio
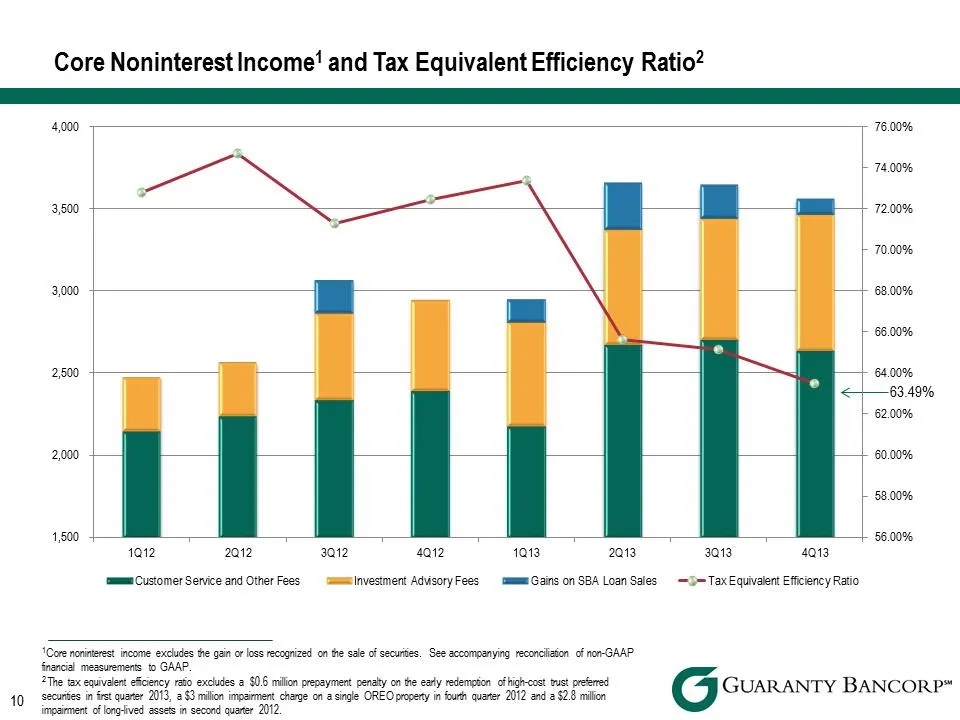
Core Noninterest Income’ and Tax Equivalent Efficiency Ratio? 00 vem . 74.00% aan —S— eK seit ri si si iti a0 sco <+-63.49% 200% 00 — smn + sai a a a a i a eo mmm Customer Service and Other Fees sm lnvestment AdvsoryFees mmm Gains on SBA Loan Sales —=D=TaxEquivalent Efficiency Ratio ‘Core noninteres
Slide 11: Loan Composition
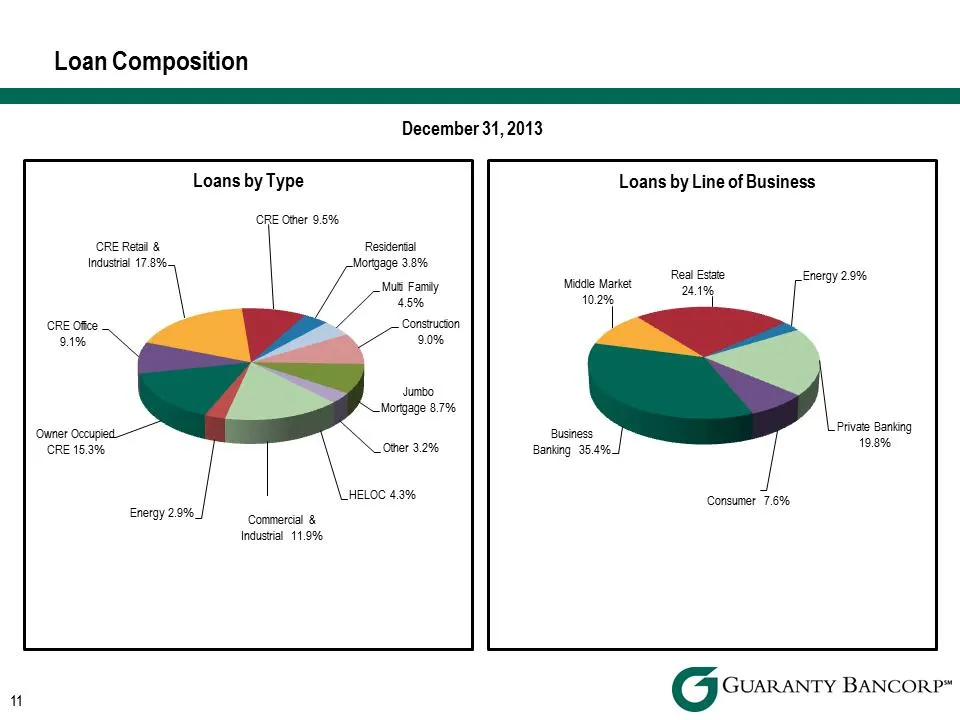
Loan Composition 1 December 31, 2013 Loans by Type CRE Other 9.5% CRE Real & Residental Industrial 17.996. Morigage 3.8% Muti Family 45% CRE Ofce ‘Construction 91% 9.0% jumbo Morigage 8.7% ‘Owner Occupied CRE 15.3% Omer 3.2% HELOC 4.3% EnerOy 2%: Commercial 8 Industrial 11.99% Loans by Line of Busin
Slide 12: Loan Growth
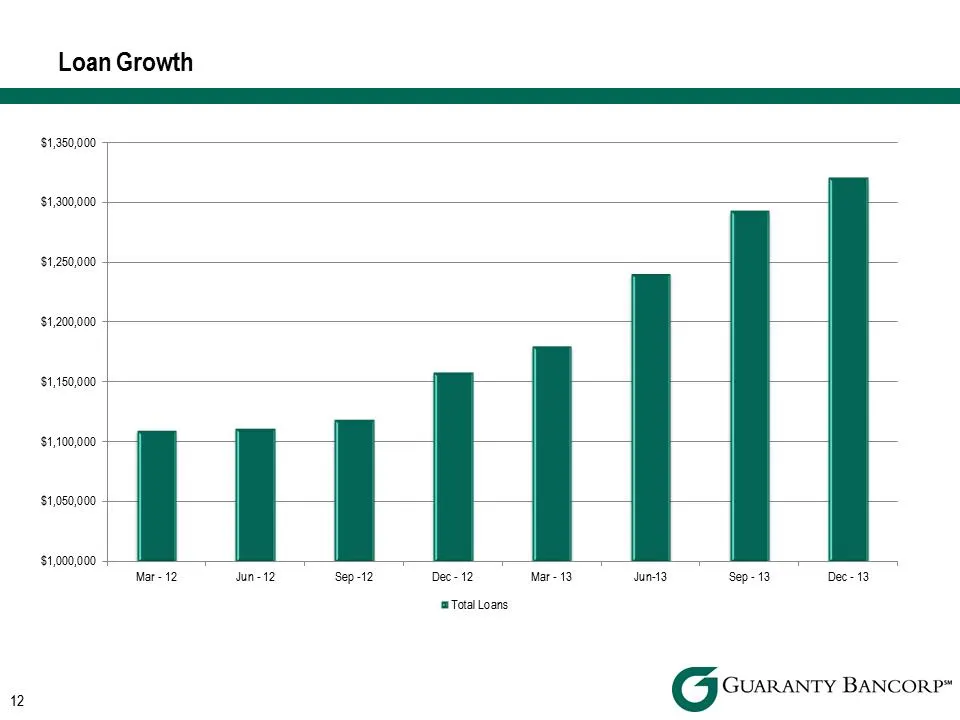
Loan Growth 12 $1,350,000 $1,300,000 $1,250,000 $1,200,000 $1,180,000 $1,100,000 $1,050,000 $1,000,000 Mar- 12 Jun-12 Dec- 12 ‘Total Loans Mar- 13 Junt3 Dec-13 G GUARANTY BANCORP“
Slide 13: Classified Assets
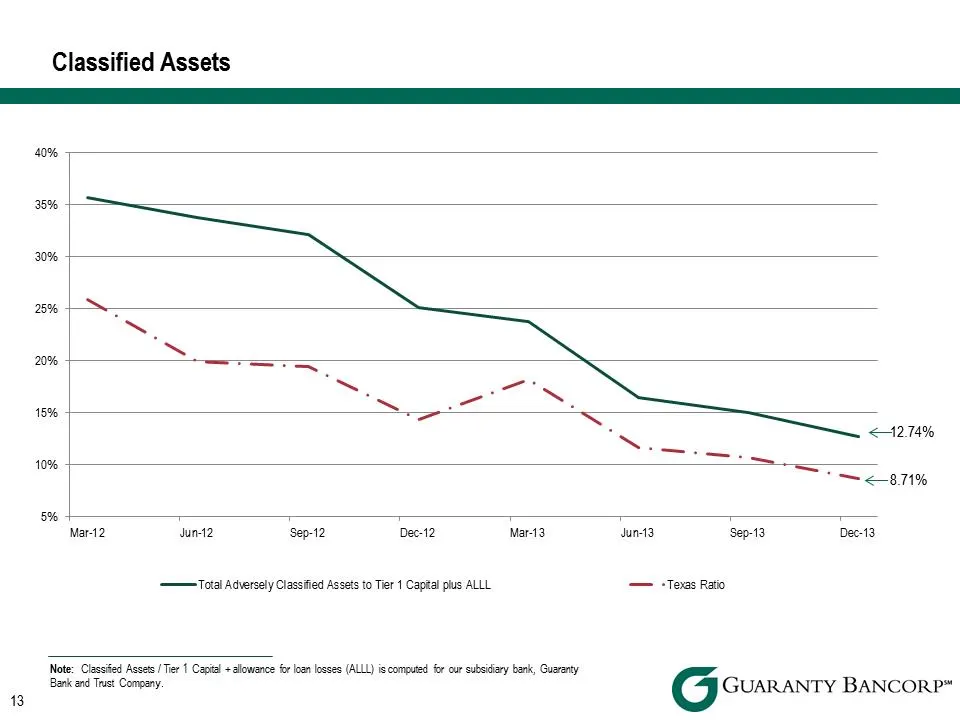
Classified Assets a 35% 25% 15% as ee <A274% 10% << 871% 5% Mar12 Junt2 ‘Sep-t2 Dee-12 Mar13 Junt3 Sep-13 Dee-13 Total Adversely Classified Assets to Tier 1 Captal plus ALLL — + Texas Ratio Note: Classied Acces Tier 1 Capital + alowance fr loan losses (ALLL) is computed for our subsidiary bank, Guar
Slide 14: Deposit Composition
Deposit Composition ee December 31, 2013 Deposits by Type Savings 7.3% Money Market Time Depost 213% 11.8% Interest bearing Nonintorest Demand and NOW 22.7% Dee 89% Deposits by Business Line Energy 6.2% Real Estate 4.8% Private Banking 18.8% Middle Market, i 22% Business Banking 237% Consumer 44.3%
Slide 15: Deposit Levels
Deposit Levels 15 1,860,000,000 1,800,000,000 1,450,000,000 1,400,000,000 1,350,000,000 1,300,000,000 4,260,000,000 1,200,000,000 0.28% 0.28% 0.23% 020% 021% 0.20% 0.19% 0.18% 0.17% 0.16% Mar- 12 Jun-12. Sep -12 ‘mmm Total Deposts Dec- 12 Mar- 13 Junt3 @-Cost of Deposits 0.18% Sep-13 Dec-13 G GUARAN
Slide 16: Quarterly Financial Statement Summary
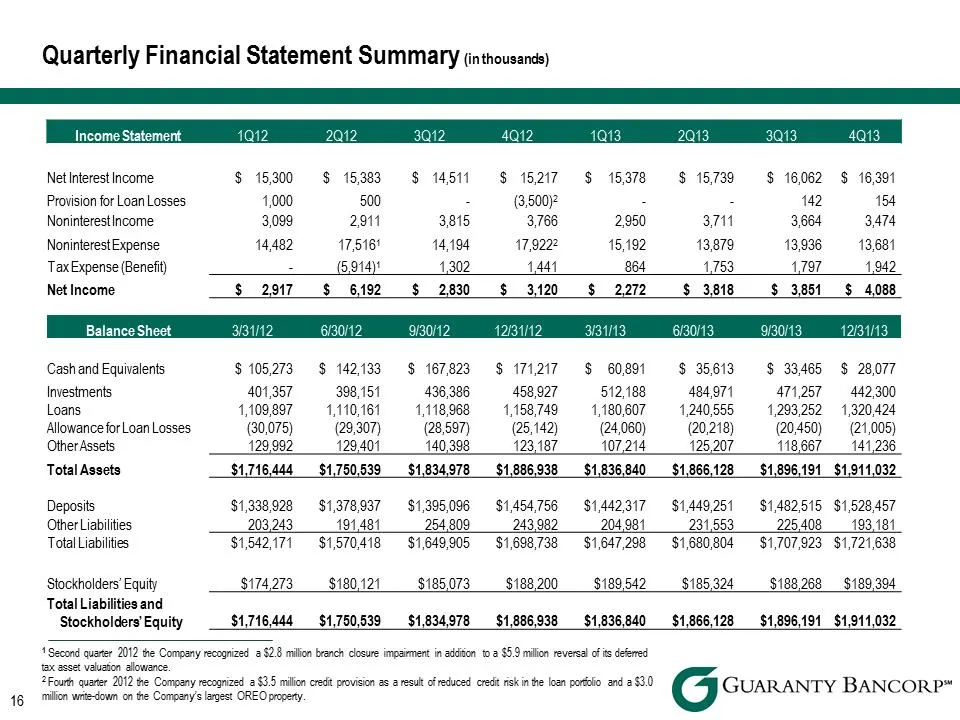
Quarterly Financial Statement Summary (inthousencs) Income Statement Net Interest Income. $ 15,300 $ 15383 $ 14511 $ 15217 $ 15378 $ 15,739 $ 16,062 $ 16,391 Provision for Loan Losses 4,000 500 = (3,500) 5 5 142 154 NoninterestIncome 3,099 2911 3815 3,766 2.950 37tt 3,664 3474 Noninterestxpense 14,4
Slide 17: Colorado Market
7 Colorado Market G GUARANTY BANCORP*
Slide 18: Market Data
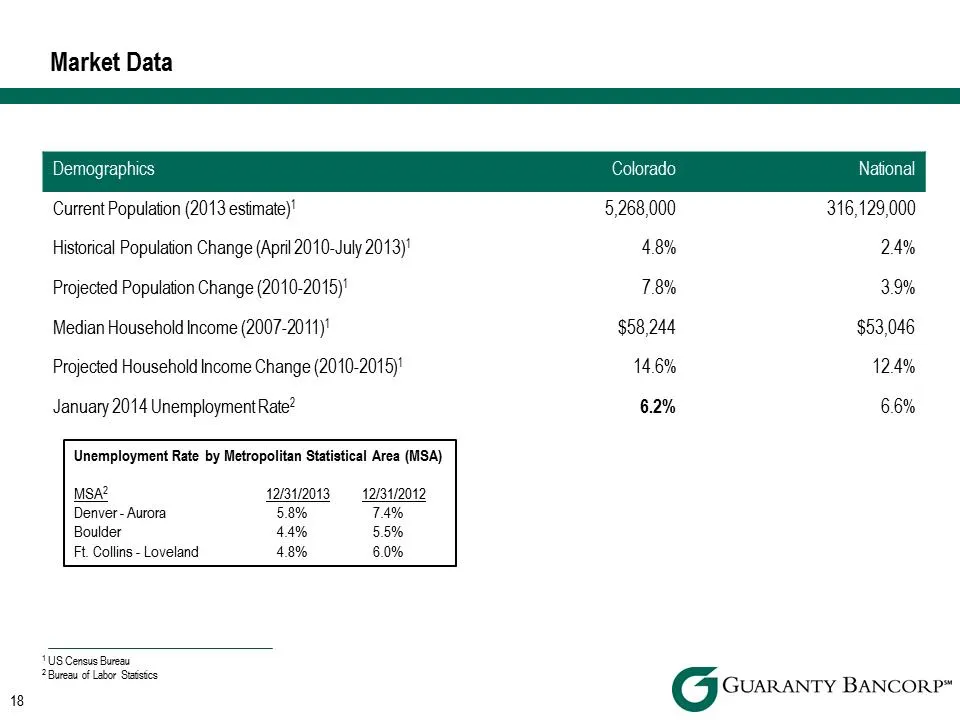
18 Market Data Current Population (2013 estimate)’ Historical Population Change (April 2010-July 2013)! Projected Population Change (2010-2015)! Median Household Income (2007-2011)! Projected Household Income Change (2010-2015)' January 2014 Unemployment Rate? Unemployment Rate by Metropolitan Stati
Slide 19: Market Data
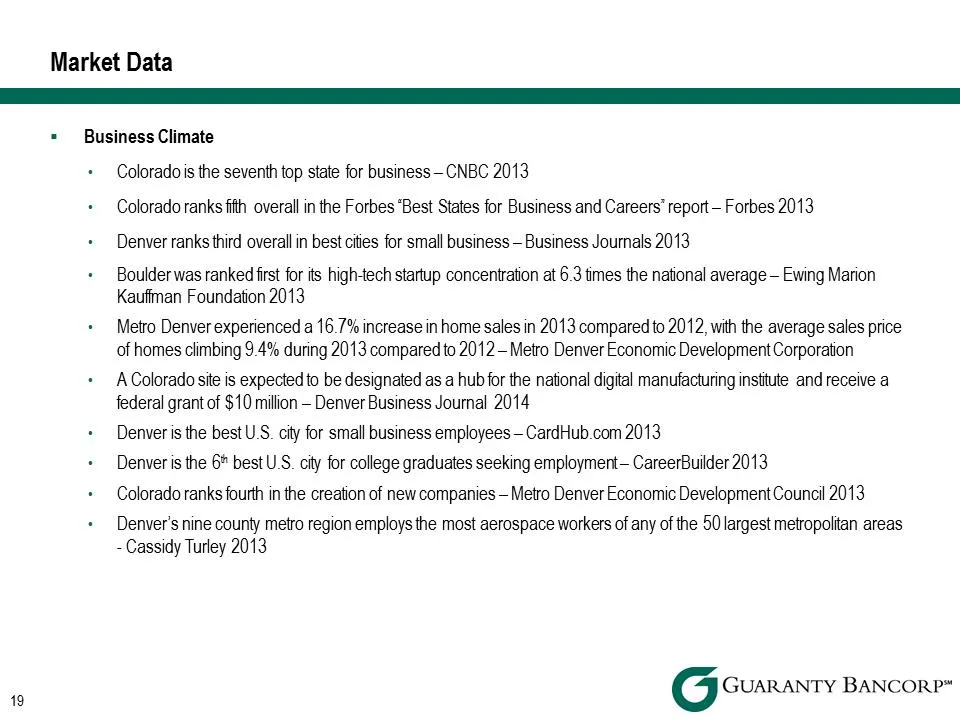
Market Data 19 Business Climate + Coloradois the seventh top state for business CNBC 2013 + Colorado ranks fith overall in the Forbes “Best States for Business and Careers’ report— Forbes 2013 + Denver ranks third overall in best cities for small business — Business Journals 2013 + Boulderwas ranked
Slide 20: Market Data
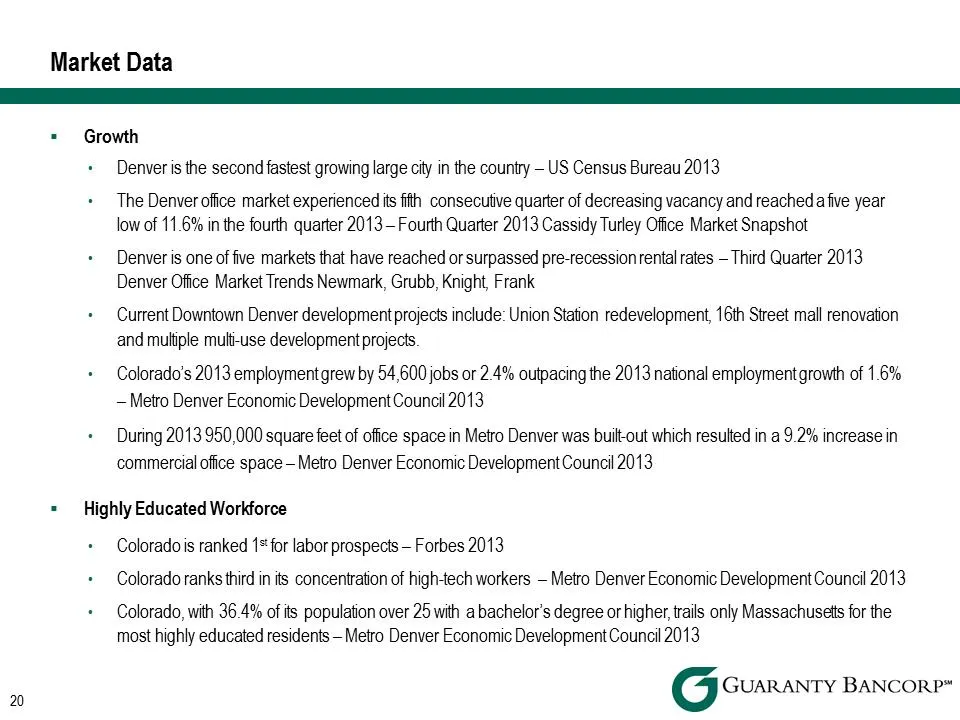
20 Market Data a = Growth Denver is the second fastest growing large city in the country - US Census Bureau 2013 The Denver office market experienced its fifth consecutive quarter of decreasing vacancy and reacheda five year low of 11.6% in the fourth quarter 2013 — Fourth Quarter 2013 Cassidy Turle
Slide 21: Reconciliation of Non-GAAP Financial Measures
2 Reconciliation of Non-GAAP Financial Measures G GUARANTY BANCORP*
Slide 22: Reconciliation of Non-GAAP Financial Measures
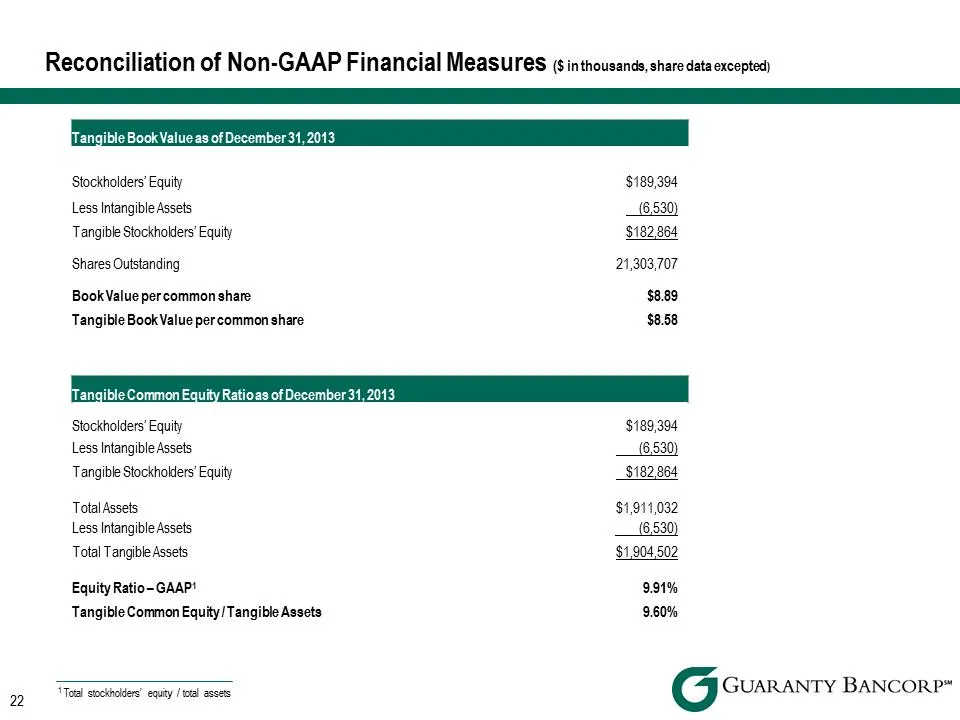
Reconciliation of Non-GAAP Financial Measures (5 inthousands, share data excepted) ee Tangible Book Value as of December 31, 2013 Stockholders’ Equity $189,394 Less Intangible Assets 6,530) Tangible Stockhoklers' Equity $182,864 Shares Outstanding 21,303,707 Book Value percommon share $8.89 Tangible
Slide 23: Reconciliation of Non-GAAP Financial Measures
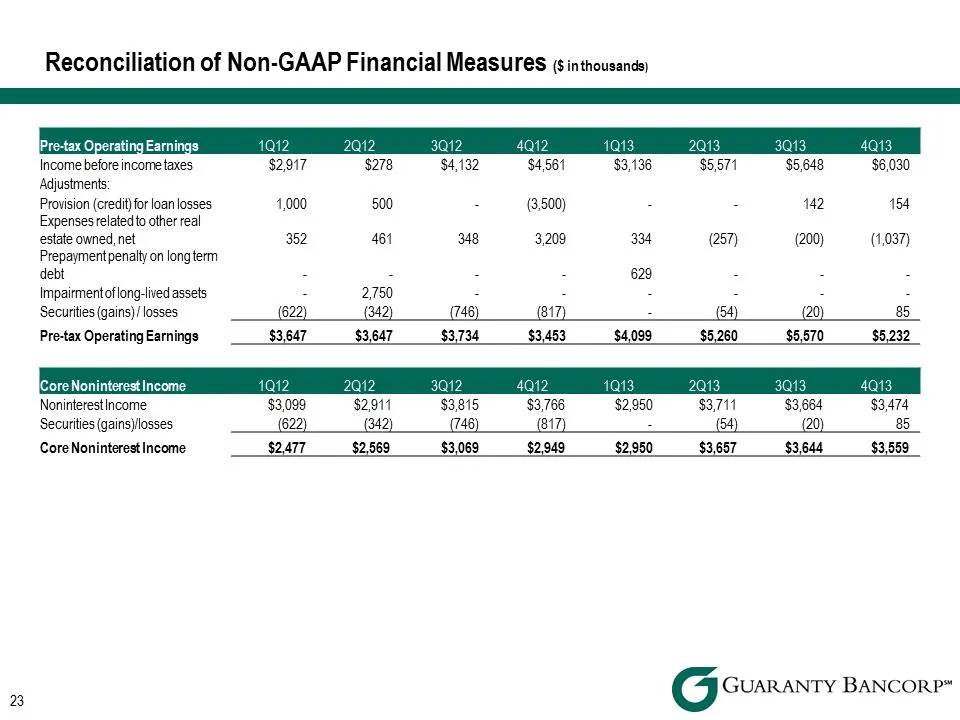
23 Reconciliation of Non-GAAP Financial Measures ( inthousancs) Income before incometaxes $2917 $278 $3,136 $5571 $5,648, $6,030 Adjustments: Provision (credit) for loan losses 4,000 500 = (3.500) - z 142 184 Expenses elatedio other real estate owned, net 352 461 MB 3,209 36 (257) (200) (1,037) Prep
Source: SEC EDGAR · 8-K filed Mar 10, 2014
More decks from Guaranty Bancorp
 Merger or Acquisition (May 2018)19 slides · May 23, 2018
 Merger or Acquisition (July 2017)8 slides · Jul 19, 2017
 D.A. Davidson 19th Annual Financial Services Conference 201722 slides · May 9, 2017
 FIG Partners 8th Annual West Coast Bank CEO Forum 201727 slides · Jan 31, 2017
 2016 FBR 23rd Annual Investor Conference27 slides · Nov 28, 2016
 2016 KBW Community Bank Investor Conference26 slides · Aug 1, 2016