Omega Protein — Investor Presentation (September 2009)
48 slides from Omega Protein's investor presentation, Sep 28, 2009
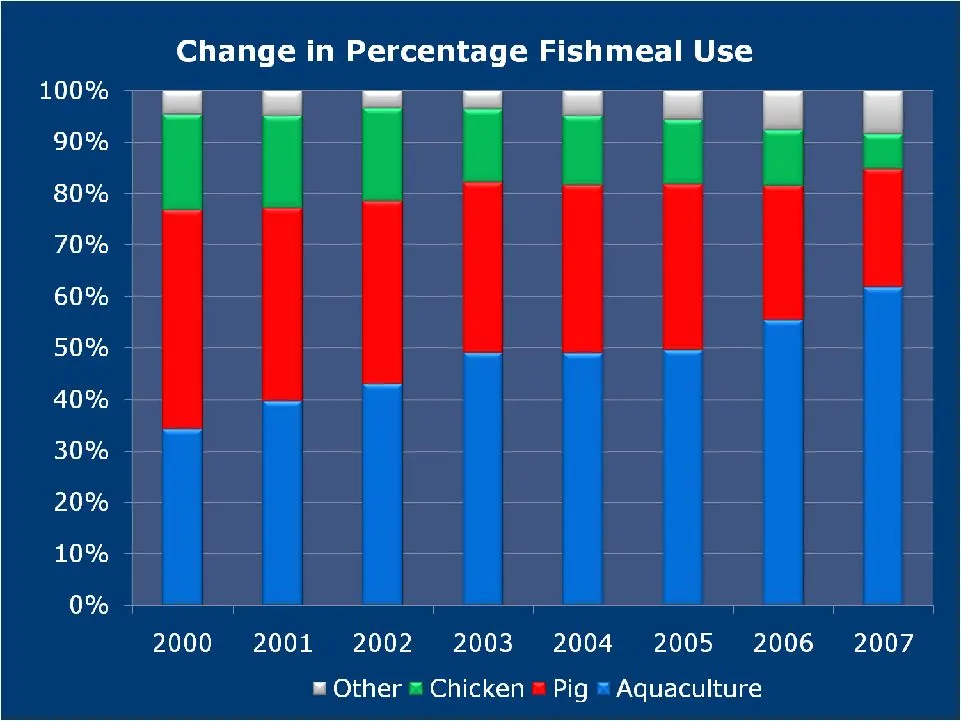
Slide 1: Change in Percentage Fishmeal Use
Change in Percentage Fishmeal Use 100% 90% ~ 80% ~ 70% | 60% 50% ~ 40% 30% 20% + 10% + 0% + 2000 2001 2002 2003 2004 2005 2006 2007 2001 2002 2003 2004 2005 2006 2007 ™ Other = Chicken = Pig = Aquaculture
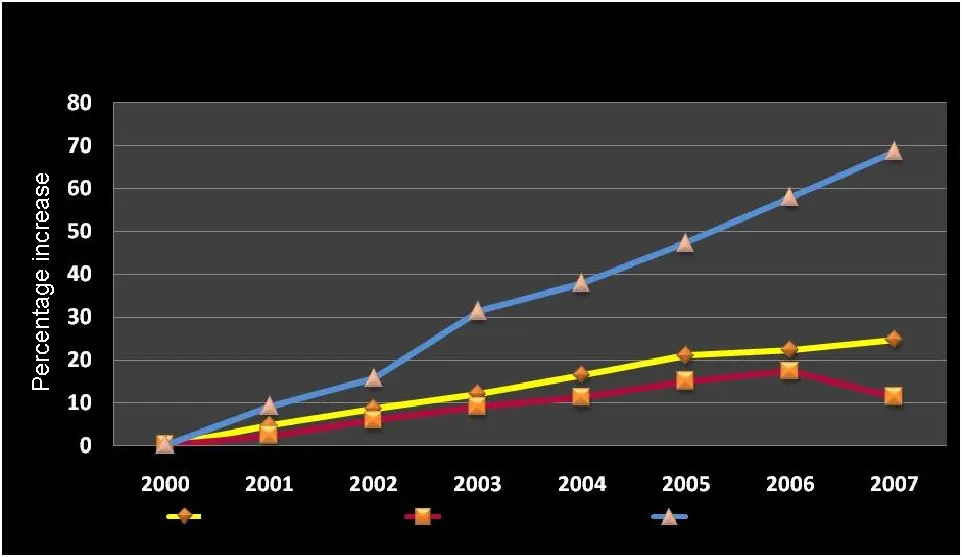
Slide 2: Aquaculture, Chicken and Pig Production Increase since 2000
Aquaculture, Chicken and Pig Production Increase since 2000 Chicken Pig Aquaculture More People = More Animals Source: Dr. Andrew Jackson. “Changes in Consumption of Fishmeal and Fish Oil.” IFFO Annual Conference
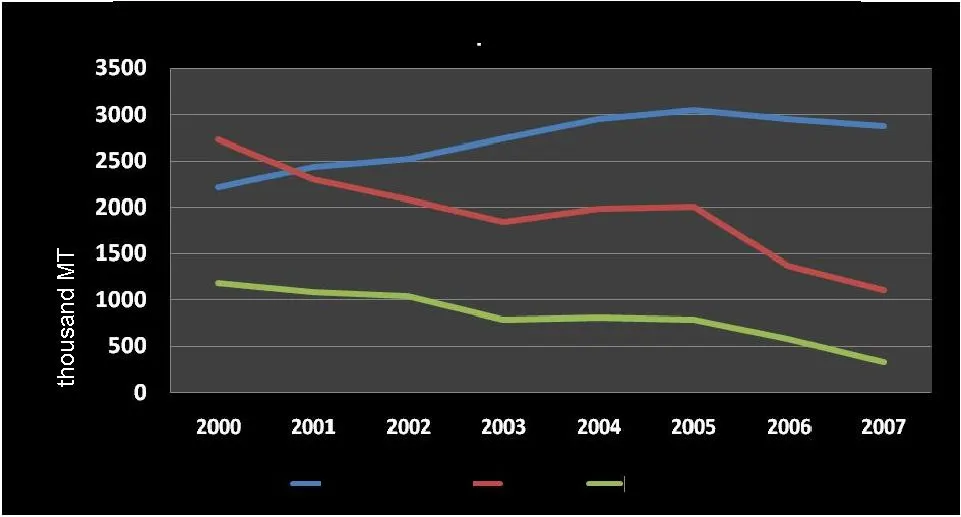
Slide 3: Changing markets for fishmeal
Changing markets for fishmeal Chicken Pig Aquaculture The Shift from Pig and Poultry to Aquaculture Source: Dr. Andrew Jackson. “Changes in Consumption of Fishmeal and Fish Oil.” IFFO Annual Conference
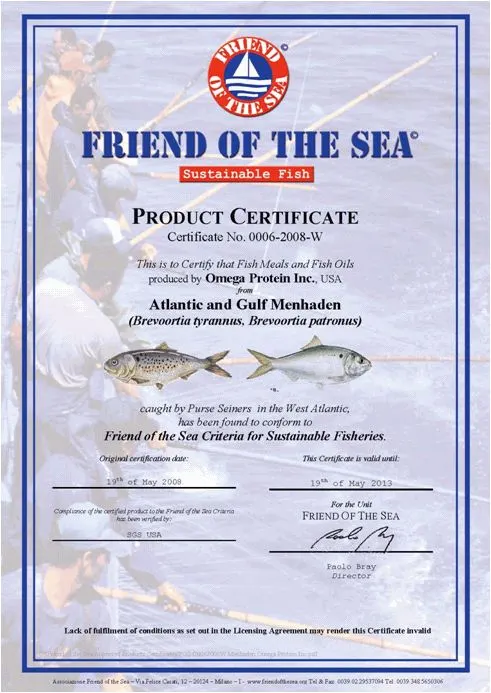
Slide 4: Eco-labelling NGO criteria for fisheries
• Italian, non profit, non- governmental organization (NGO) • Follows the Food and Agriculture Organization (FAO) of the United Nations Guidelines for Eco-labelling • Follows ISO65 guidelines • The fishery method does not discard more than 8% in weight of the total catch • The fishing method does no
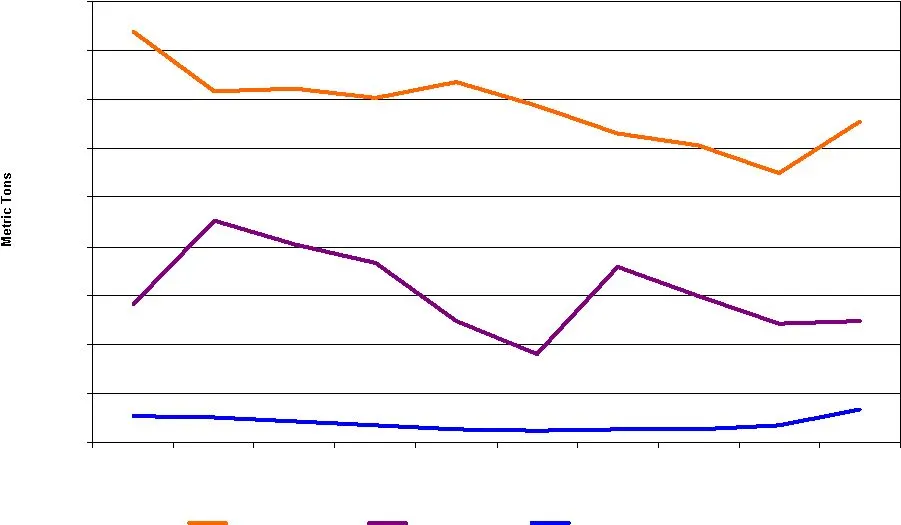
Slide 5: OPI Total Volume Sold
OPI Total Volume Sold 20,000 40,000 60,000 80,000 100,000 120,000 140,000 160,000 180,000 2009 LE Meal Oil Solubles Year (Includes Refined) Source: Internal 131,000 MT 49,345 MT 13,238 MT
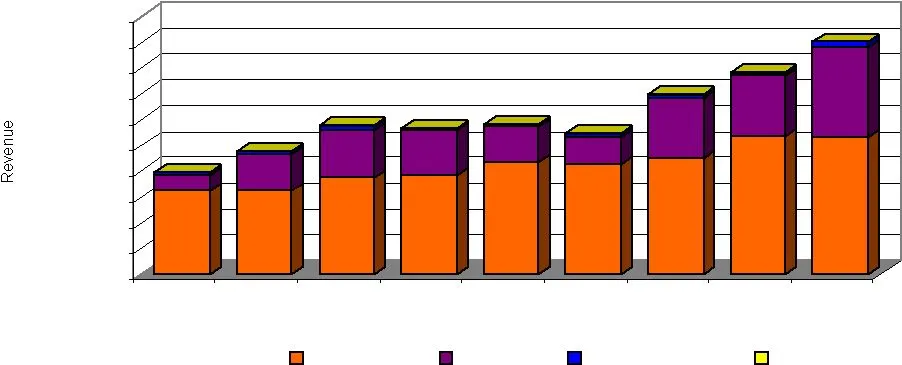
Slide 6: OPI Total Revenue
OPI Total Revenue (Includes Refined) Source: Internal $0 $20,000,000 $40,000,000 $60,000,000 $80,000,000 $100,000,000 $120,000,000 $140,000,000 $160,000,000 $180,000,000 $200,000,000 Meal Oil Solubles OmegaPure
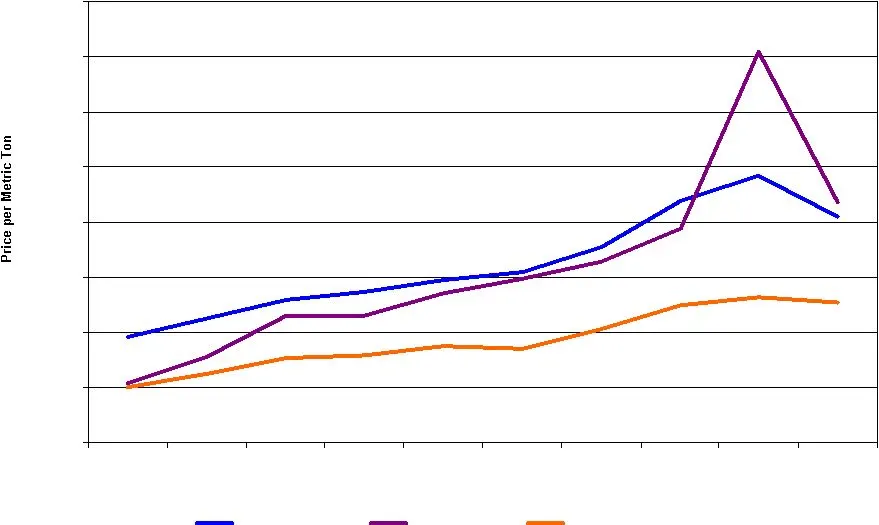
Slide 7: OPI Price per Ton
OPI Price per Ton $0 $200 $400 $600 $800 $1,000 $1,200 $1,400 $1,600 2009 LE Meal Oil Solubles (Includes Refined) Source: Internal $871 $817 $509
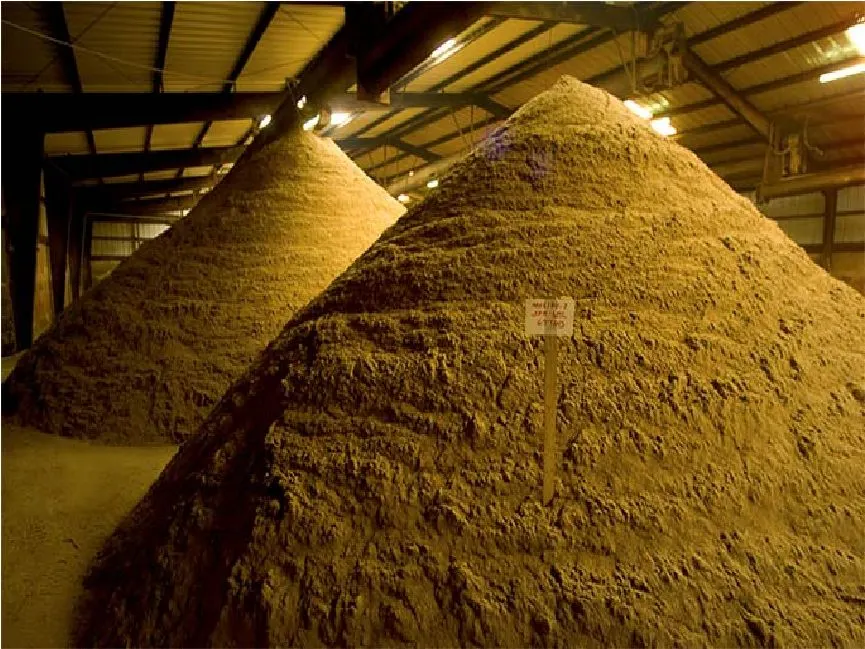
Slide 8: Fish Meal
Fish Meal
Slide 9: Fish Meal Market
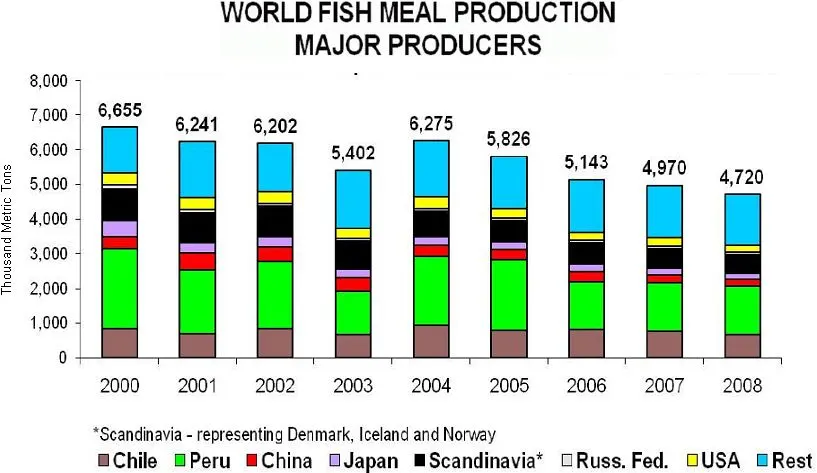
Year Fish Meal Market Source: J. Mora, “Market Outlook,” International Fish Meal and Fish Oil Organization, June 1, 2009 **Omega Protein = 2.4% of 2008 Total
Slide 10: World Production of Fish Meal
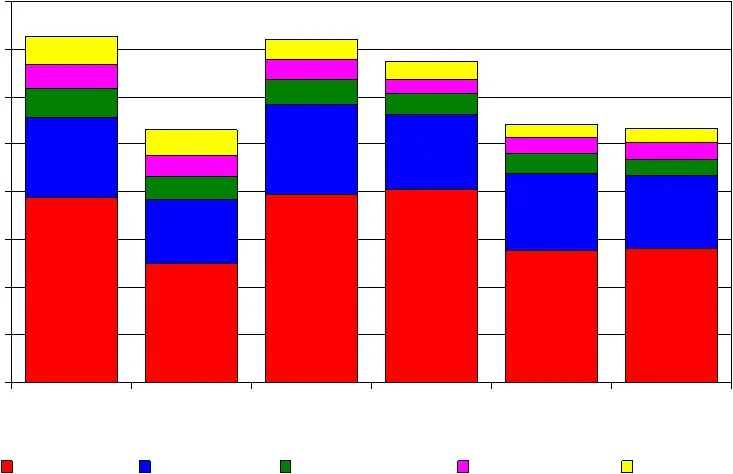
World Production of Fish Meal 500,000 1,000,000 1,500,000 2,000,000 2,500,000 3,000,000 3,500,000 4,000,000 Peru Chile Denmark Norway Iceland Source: IFFO Fishmeal and Fish Oil Statistical Yearbook 2008 3,636,000 2,651,500 3,594,300 3,369,900 2,711,800 2,667,000
Slide 11: OPI Fish Meal Revenue
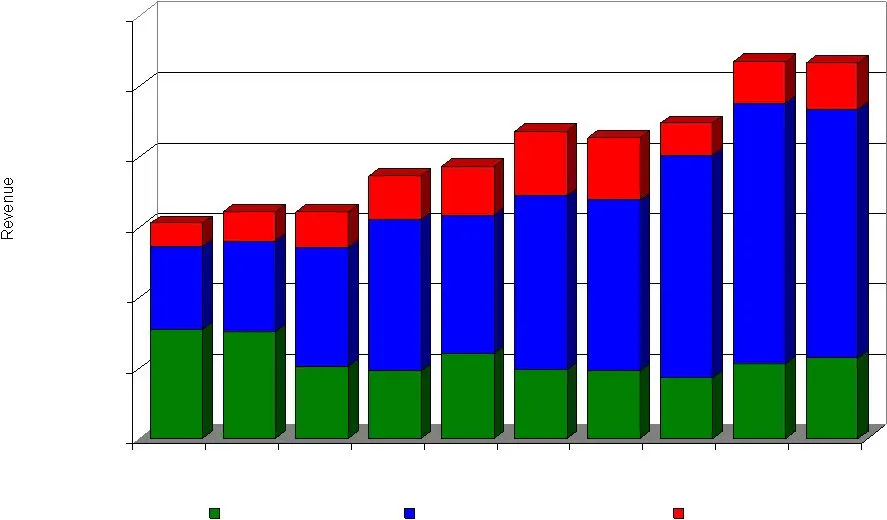
OPI Fish Meal Revenue $0 $20,000,000 $40,000,000 $60,000,000 $80,000,000 $100,000,000 $120,000,000 FAQ Special Select SeaLac Fish Meal Revenue 1999 to 2008 Source: Internal
Slide 12: Fish Meal Year-End Inventories
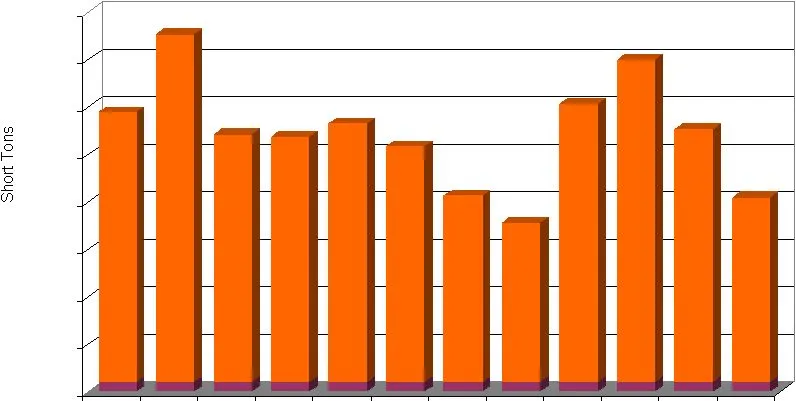
Fish Meal Year-End Inventories Source: Internal
Slide 13: OPI Fish Meal Prices
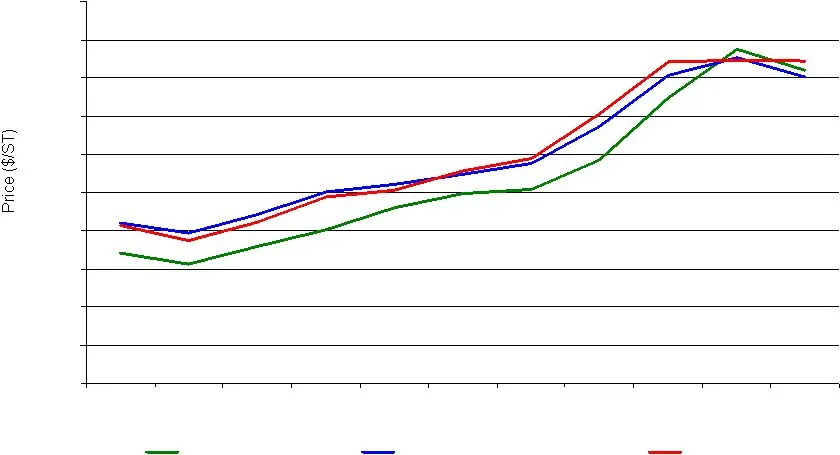
OPI Fish Meal Prices $0 $100 $200 $300 $400 $500 $600 $700 $800 $900 $1,000 2009 LE FAQ Special Select SeaLac Fish Meal Price History 1999 to 2009 LE (through Q2) Source: Internal
Slide 14: Fish Meal Sales by Markets
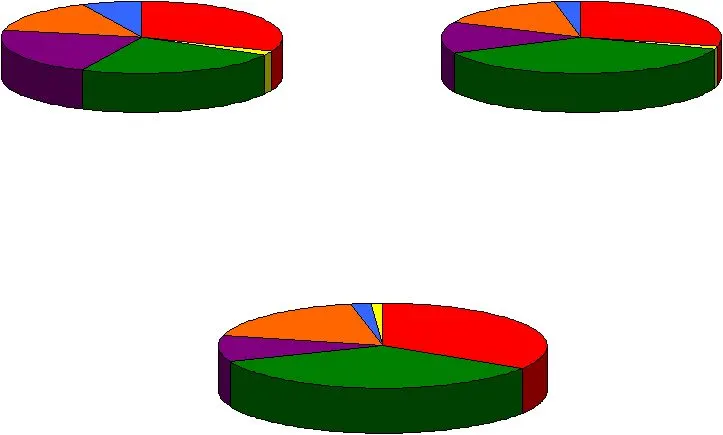
Fish Meal Sales by Markets Swine 31% Dairy 21% Pet 15% Poultry 7% Aquaculture 24% Fermentation 2% Swine 29% Pet 15% Dairy 14% Poultry 3% Aquaculture 38% Fermentation 2% Pet 18% Swine 34% Poultry 2% Agronomy 1% Aquaculture 38% Dairy 10% Total Volume: 155,837 short tons Total Volume: 128,788 short ton
Slide 15: OPI Fish Meal Sales by Country
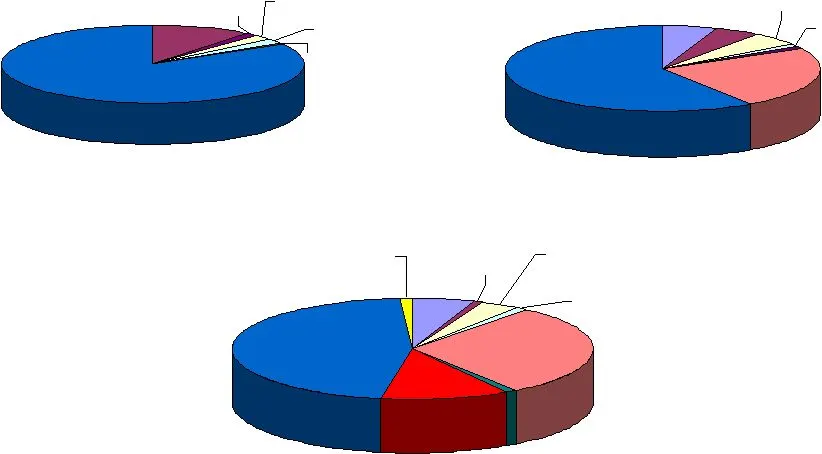
Mexico 11% Saudia Arabia 2% US 83% UK 1% Philippines 2% Belize 1% Source: Internal US 60% China 23% UK 1% Philippines 1% Saudia Arabia 5% Canada 5% Mexico 5% Fish Meal Sales by Country 2005 Total Volume: 155,837 ST Fish Meal Sales by Country 2008 Total Volume: 128,788 ST Fish Meal Sales by Country 2
Slide 16: Fish Meal Market: Protein Price Comparison
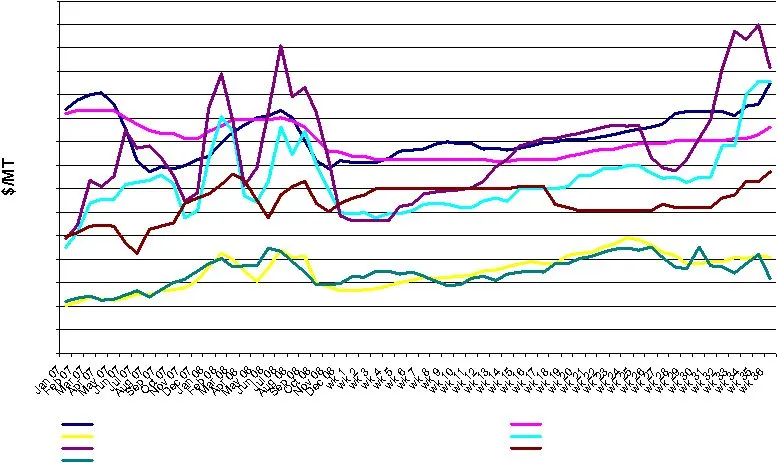
Fish Meal Market Source: ISTA Mielke GmbH, Oil World Weekly. The Jacobsen Publishing Company, The Jacobsen, September 11, 2009 Protein Price Comparison Date Fish Meal** FOB Peru Fish Meal, FOB US Omega Weekly Price M&B Meal MO River (J) Rum. Blood MO River(J) Porc. Blood Mdwst (J) Low Ash Chicken SE
Slide 17: Fish Meal Outlook
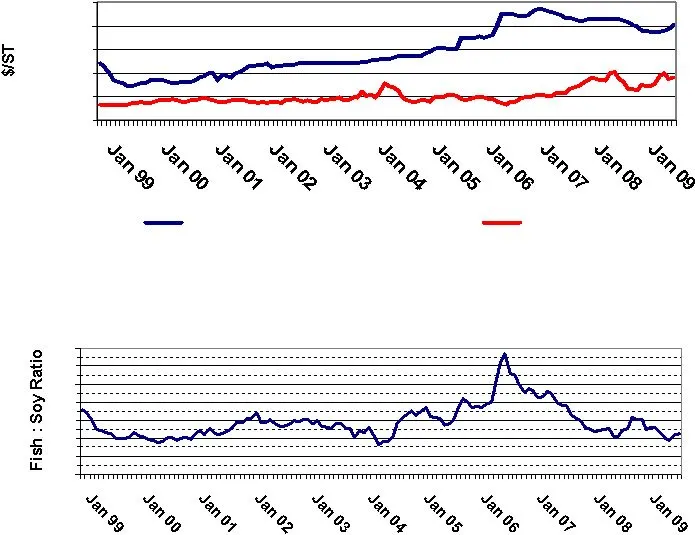
Source: The Jacobsen Publishing Company, The Jacobsen, and Informa Economics, Feed Ingredient Daily . Fish Meal / Soy Meal Price Ratio (Monthly Averages) Fishmeal and Soymeal Prices $0 $200 $400 $600 $800 $1,000 Fish Meal Soy Meal Fish Meal Outlook • Global supplies are extremely tight. • Peru will
Slide 18: Top Feed Manufacturers Worldwide 2007; El Niño
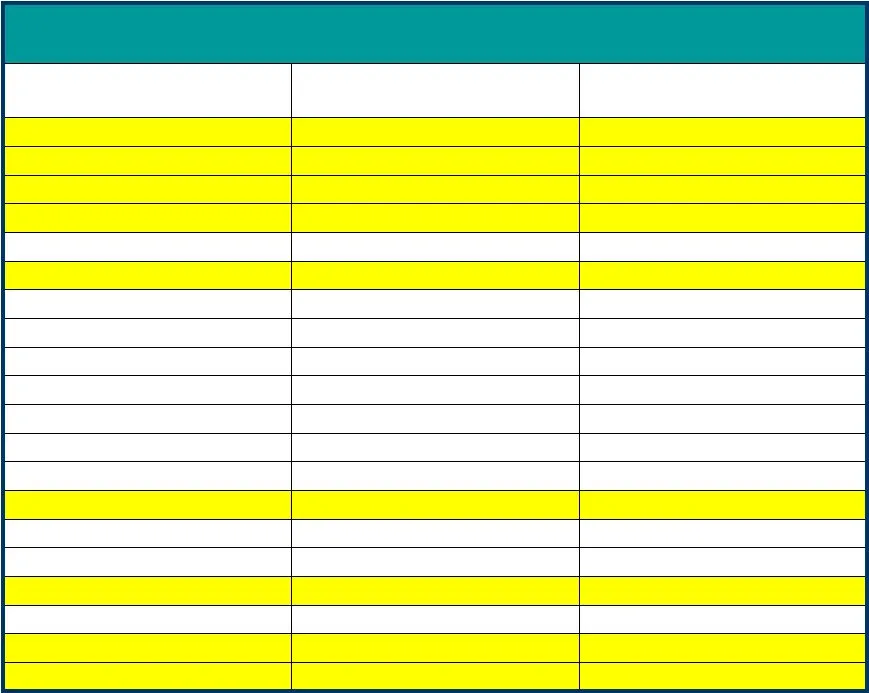
Top 20 Feed Manufacturers Worldwide 2007 3.2 France Ridley 3.2 USA ADM Alliance Nutrition 3.5 France Glon 3.6 USA Smithfield Foods 3.6 China Hunan Tangrenshan Group 3.7 Denmark DLG 3.8 The Netherlands Provimi France Ucaab Co-operative 4.4 France Evialis 4.6 UK AB Agri 4.8 Brazil Perdigao 5.4 Brazil
Slide 19: NOAA/NESDIS SST Anomaly, 9/21/2009
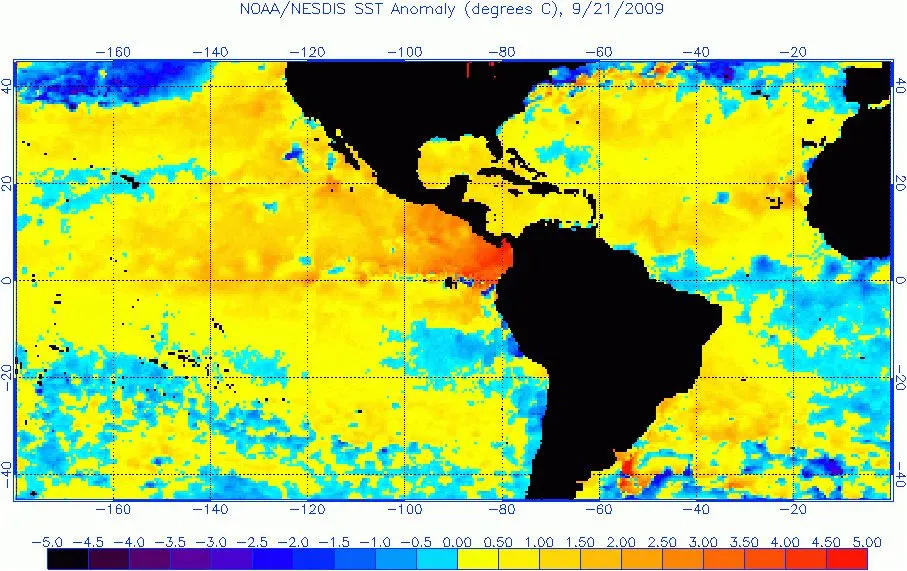
NOAA/NESDIS SST Anornaly (degrees C), 9/21/2009 =120 =100 =80 =160 =140 =120 =100 =80 $0 45 —40 35 -30 25 20 -15 -10 -05 0.00 0.50 1,00
Slide 20: SST Anomalies
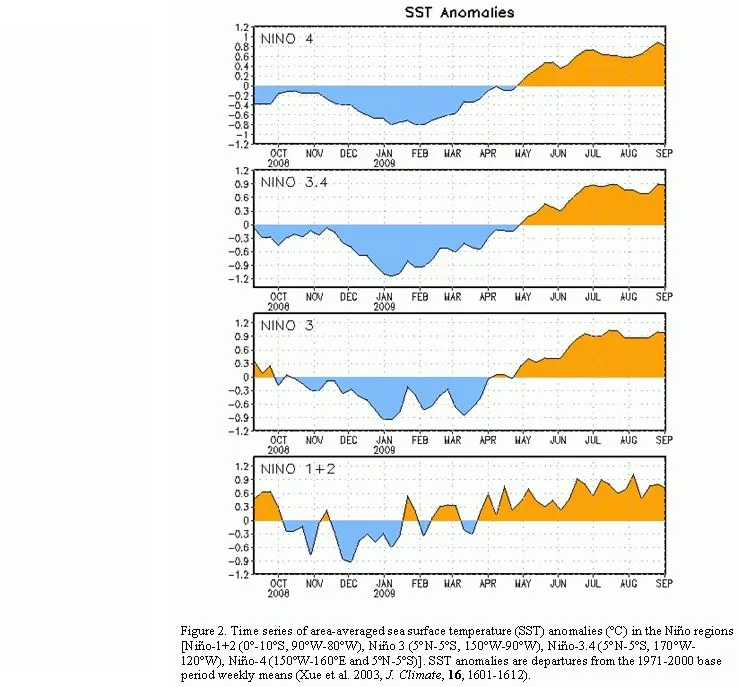
‘SST Anomalies NINO 4 oer WO DED AN FEB WR APR WAY AN UR NG 2008 2008 09] NINO 3.4 Ge NOR a wi WR uN io St 121 NINO 3 ocr WO DEC AN FEB WAR APR WAY AN JL AUD SEP 2008 2008 121 NINO 142 er WY OC IN Fee WAR PR WAY WN NUS SEP 2008 2008 Figure 2. Time series of area-averaged sea surface temperature (SST
Slide 21: Fish Oil
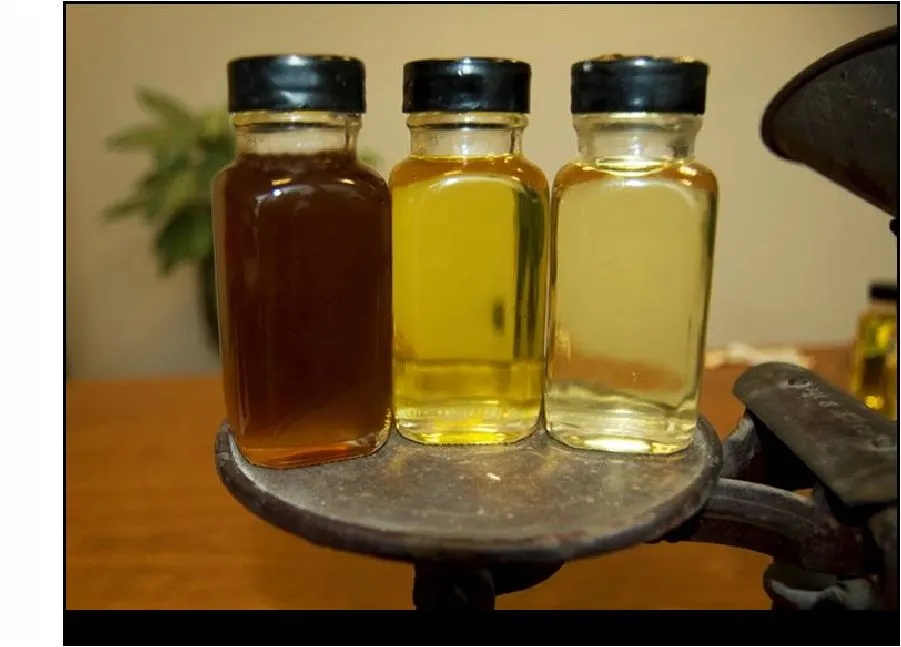
Menhaden oil: ~35% total Omega-3’s and ~25% EPA and DHA. Fish Oil
Slide 22: Fish Oil Market
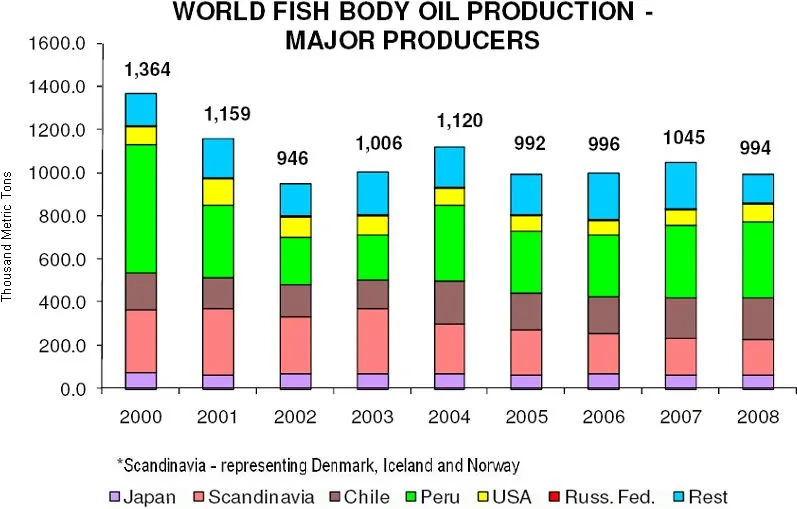
Fish Oil Market Source: J. Mora, “Market Outlook,” International Fish Meal and Fish Oil Organization, June 1, Year **Omega Protein = 5.9% of 2008 Total
Slide 23: OPI Fish Oil Revenue
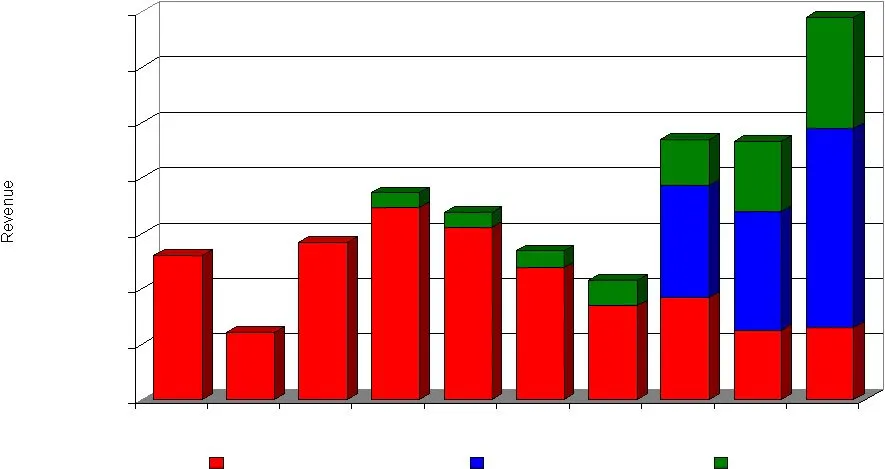
OPI Fish Oil Revenue Source: Internal Fish Oil Revenue History 1999 to 2008 $0 $10,000,000 $20,000,000 $30,000,000 $40,000,000 $50,000,000 $60,000,000 $70,000,000 Crude Aqua Refined
Slide 24: OPI Fish Oil Volume
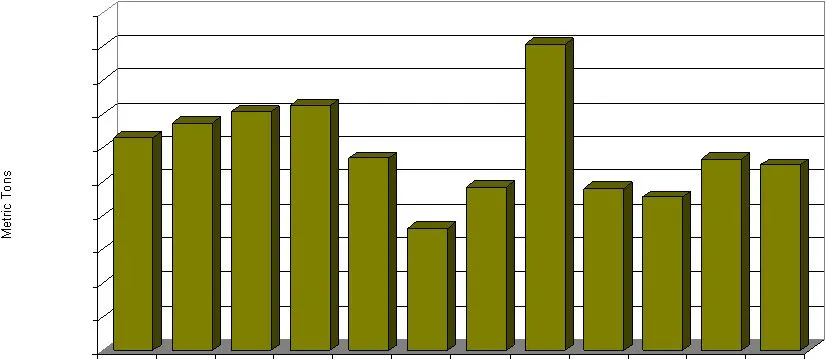
OPI Fish Oil Volume Source: Internal Fish Oil Inventory History 1998 to 2009
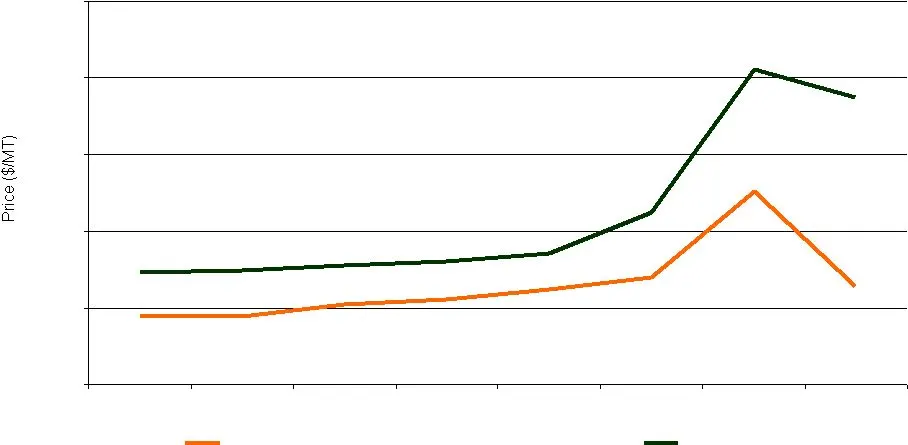
Slide 25: OPI Fish Oil Prices
$0 $500 $1,000 $1,500 $2,000 $2,500 2009 LE Crude & Aqua Refined Oil Source: Internal OPI Fish Oil Prices (through Quarter 2)
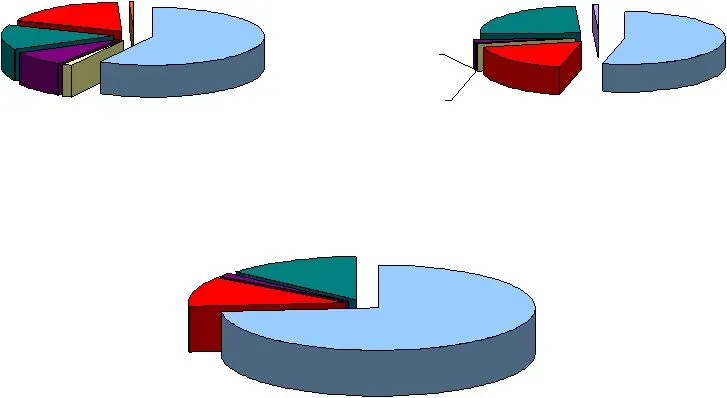
Slide 26: OPI Fish Oil Sales by Specie
OPI Fish Oil Sales Oil Sales by Specie 2008 Total Volume: 48,880 MT Source: Internal Oil Sales by Specie 2005 Total Volume: 40,973 MT Oil by Specie 2009 YTD Total: 37,217 MT AQUACULTURE 57% DAIRY 1% INDUSTRIAL 8% PET 14% BEEF 19% POULTRY 1% 14% AQUACULTURE 74% INDUSTRIAL 1% BEEF 11% Beef 18% DAIRY 1
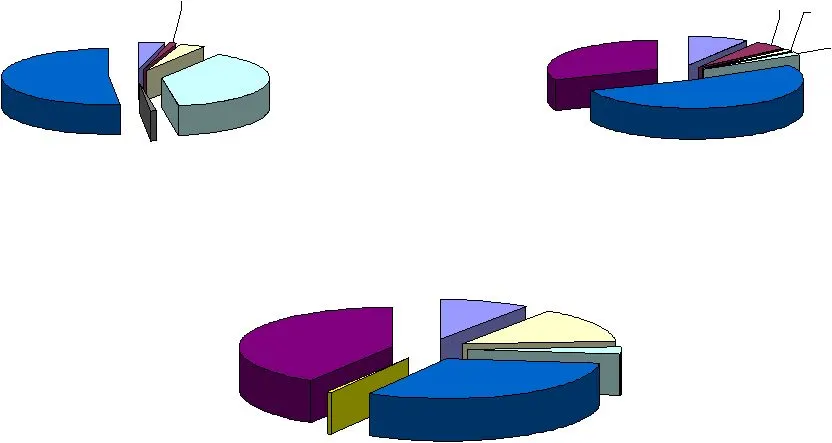
Slide 27: OPI Fish Oil Sales by Country; Fish Oil Prices
US 52% Norway/Denmark 31% Japan 2% Mexico 5% The Netherlands 1% Canada 9% US 51% Canada 4% Belize 1% The Netherlands 4% Japan 39% Mexico 1% Oil Sales by Country 2005 Total: 40,973 MT Oil Sales by Country 2008 Total: 48,883 MT Source: Internal OPI Fish Oil Sales Oil Sales by Country 2009 YTD Total: 3
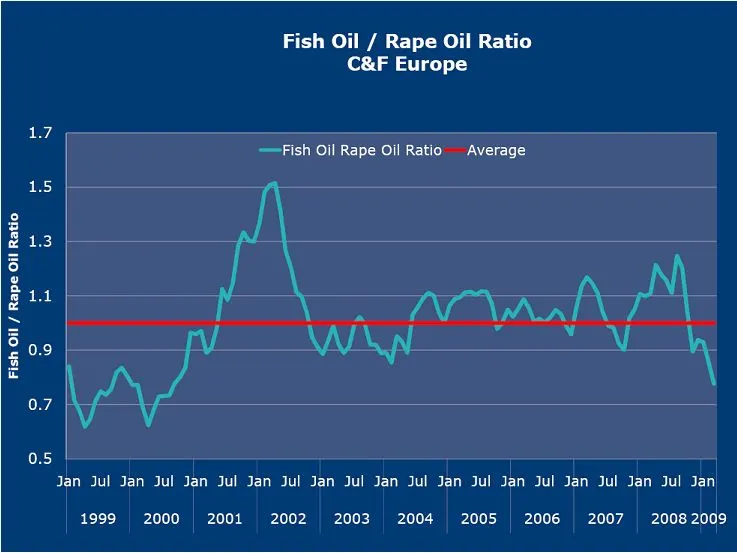
Slide 28: Global Market
Global Market Source: Andrew Jackson, “Fish Oil Topic,” International Fish Meal and Fish Oil Organization, June 1, 2009
Slide 29: let a. ary
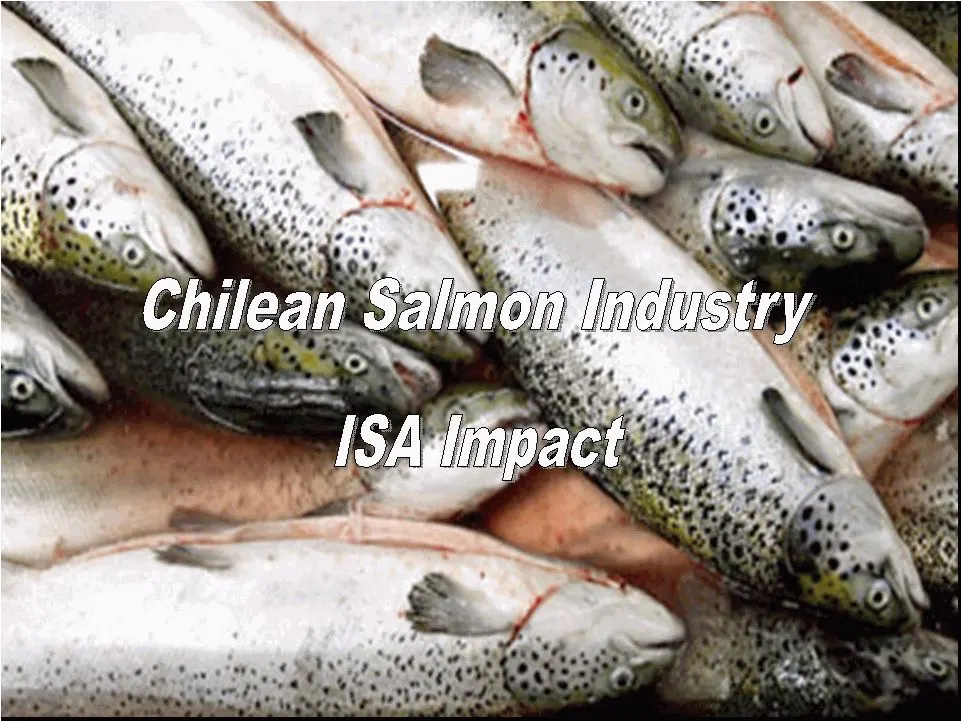
let a. ary a>
Slide 30: Chilean Salmon Disease
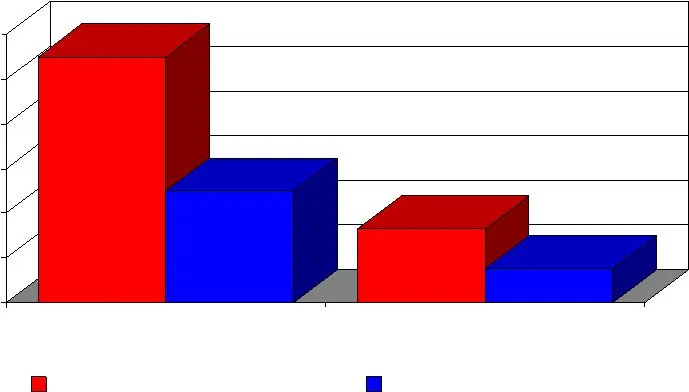
1,100,000 500,000 330,000 150,000 Chilean Salmon Disease 200,000 400,000 600,000 800,000 1,000,000 1,200,000 Feed Production Oil Consumption
Slide 31: Alfredo
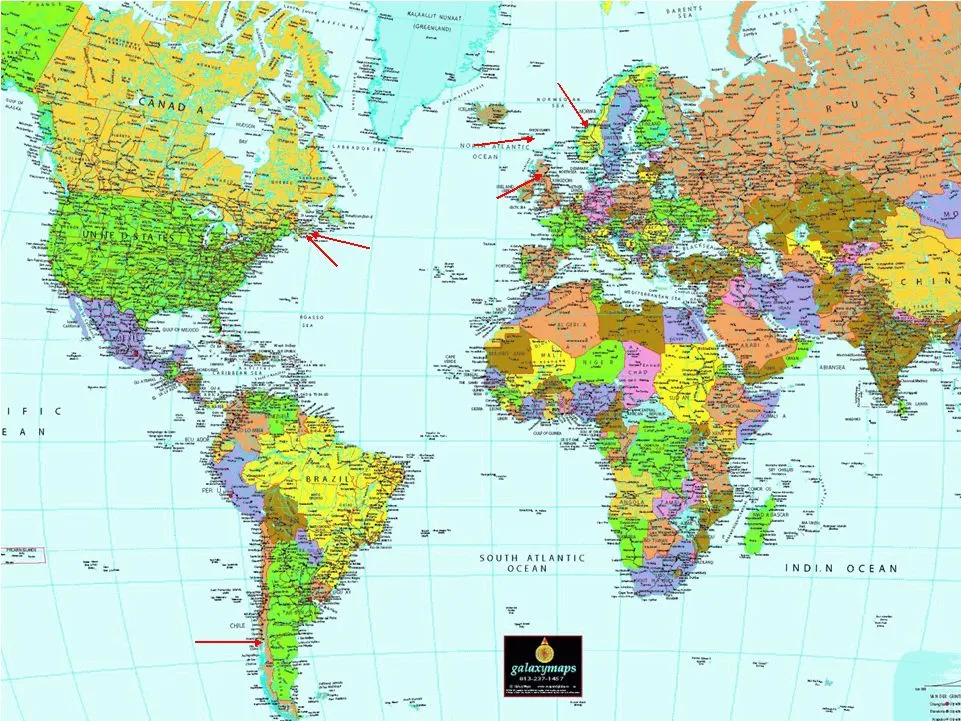
Source: Alfredo Dabancens, “Industria Salmon Efecto ISA,” EWOS Chile, April
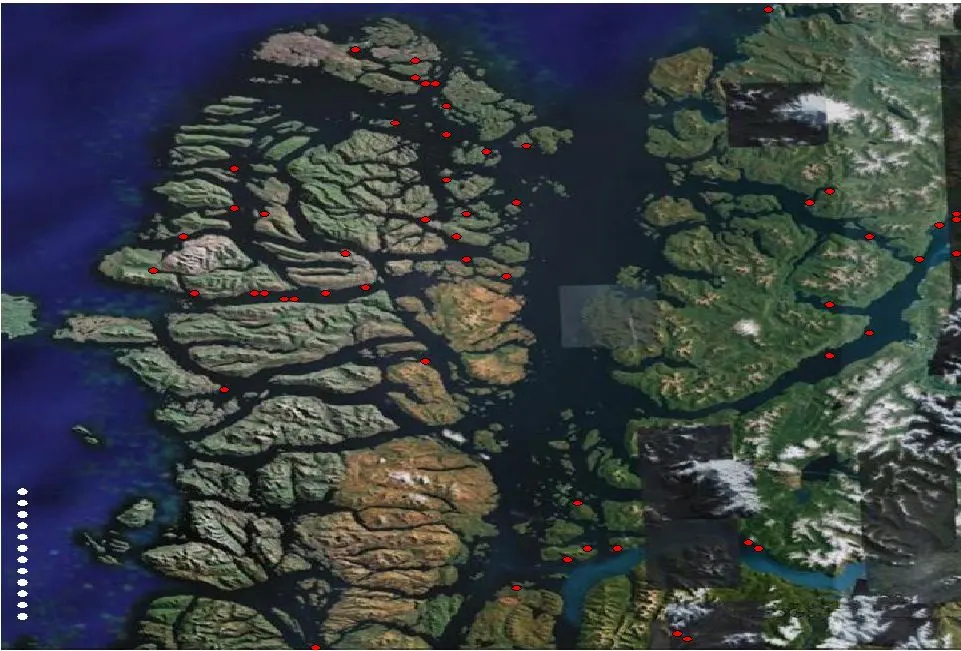
Slide 32: Chronological Distribution of the ISA Virus in Chilean Area
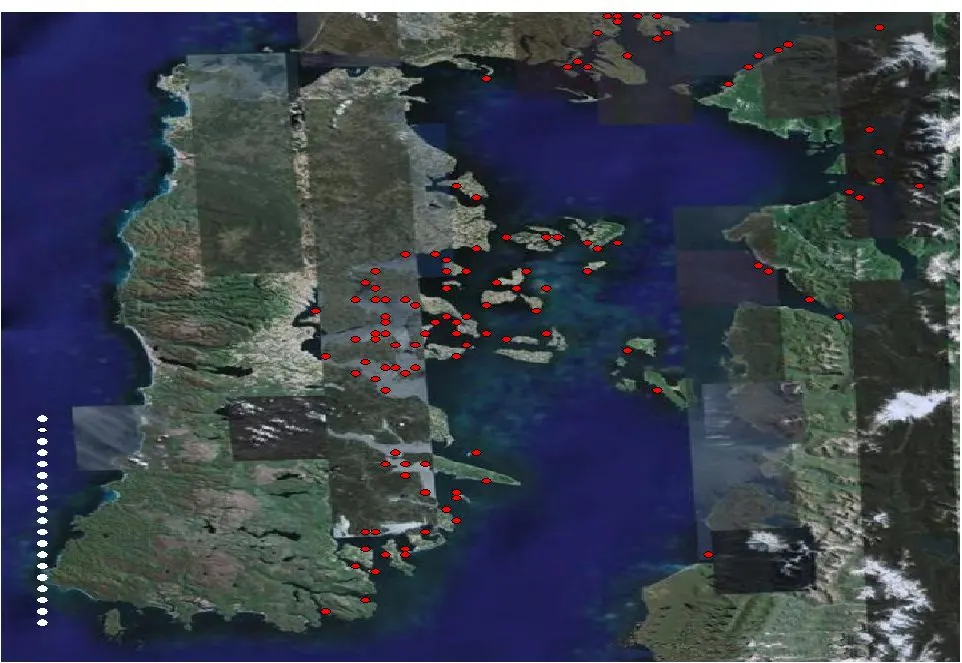
Julio 2007 Agosto 2007 Sept./ Oct 2007 Noviembre 2007 Diciembre 2007 Enero 2008 Febrero 2008 Marzo 2008 Abril 2008 Mayo 2008 Junio 2008 Julio 2008 Agosto 2008 Septiembre 2008 Octubre 2008 Noviembre 2008 Diciembre 2008 Enero 2009 Marzo 2009 Source: Alfredo Dabancens, “Industria Salmon Efecto ISA,” EW
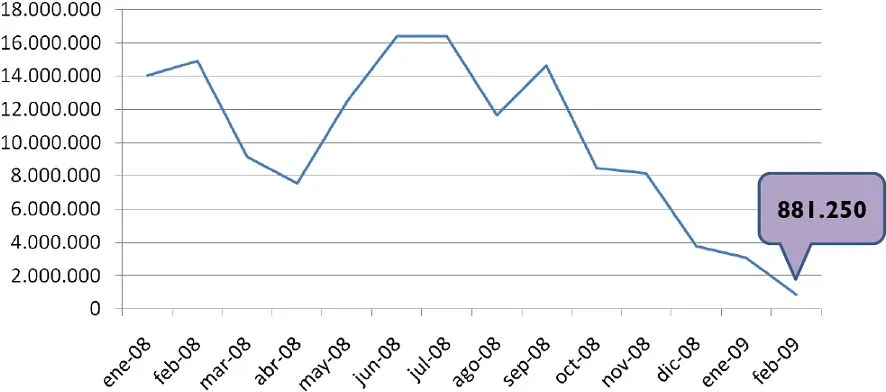
Slide 33: Chilean Salmon Industry Health Measures
Marzo 2008 Mayo 2008 Julio 2008 Agosto 2008 Diciembre 2007 Septiembre 2008 Octubre 2008 Noviembre 2008 Diciembre 2008 Enero 2009 Febrero 2009 Marzo 2009 Source: Alfredo Dabancens, “Industria Salmon Efecto ISA,” EWOS Chile, April 2009 Chronological Distribution of the ISA Virus in the Aysen Area as o
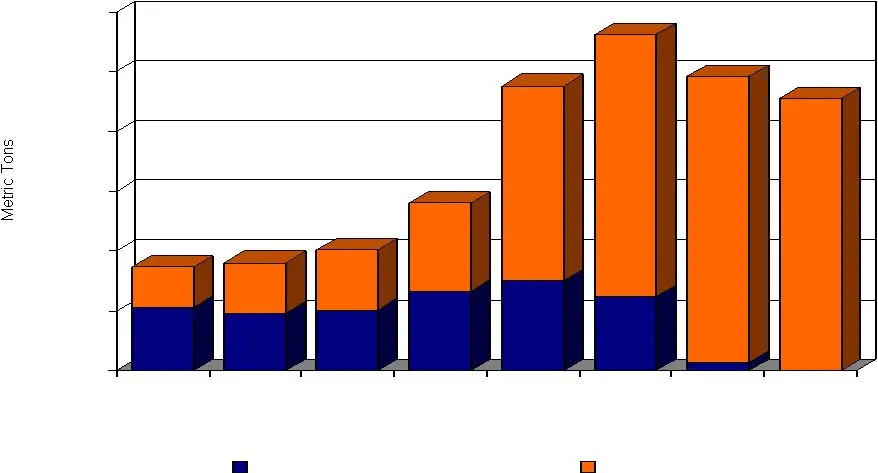
Slide 34: Monthly Stocking of Atlantic Salmon
Source: Alfredo Dabancens, “Industria Salmon Efecto ISA,” EWOS Chile, April Chilean Salmon Industry Monthly Stocking of Atlantic Salmon
Slide 35: Refined Oil Shipment History
2,000 4,000 6,000 8,000 10,000 12,000 LE Virginia Prime Silver Virginia Prime Gold Refined Oil Shipment History Source: Internal
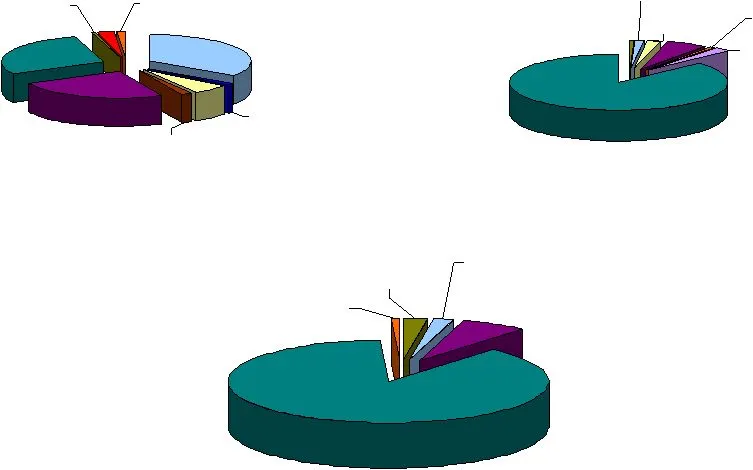
Slide 36: Refined Oil Markets
Refined Oil Markets AQUACULTURE 35% INDUSTRIAL 24% PET 28% POULTRY 1% DAIRY 6% AGRONOMY 1% BEEF 2% EQUINE 2% BAIT 1% Industrial 6% Dairy 2% Aquaculture 1% Poultry 1% Swine 2% Pet 87% Agronomy 1% Refined Oil by Specie 2005 Total Volume: 8,520 MT Refined Oil Sales by Specie 2008 Total: 9,852 MT Refine
Slide 37: Cat and Dog Food Global Competitive Landscape
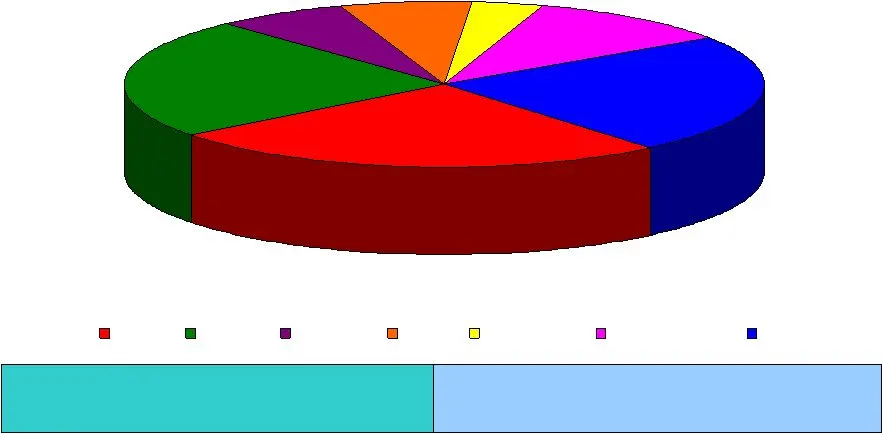
Cat and Dog Food Global Competitive Landscape Mars 25% Colgate 7% P&G 7% Del Monte 4% Private Label 11% Other 23% Nestle 23% Mars Nestle Colgate P&G Del Monte Private Label Other Top 5 Customers account for combined 66% market share With Nutro acquisition, Mars extends leadership by one share point
Slide 38: Fish Solubles
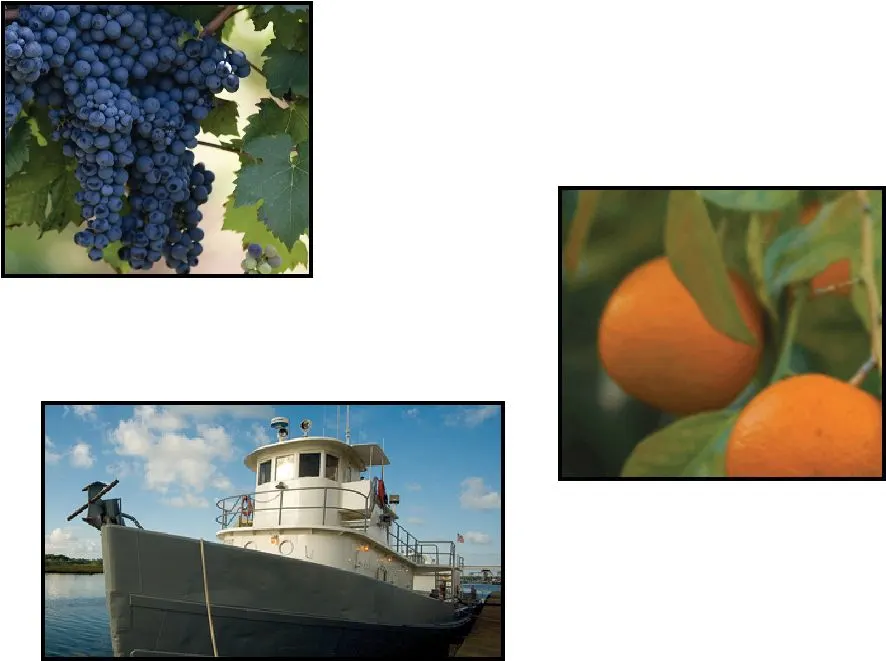
Fish Solubles
Slide 39: OPI Fish Solubles Volume
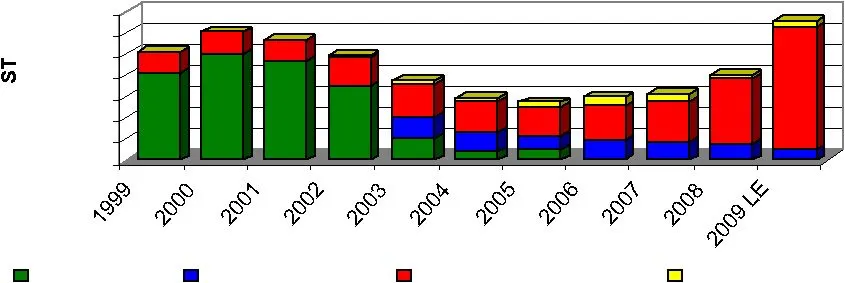
OPI Fish Solubles Volume Total Soluble Shipment History by Product 1997 to 2009 LE Source: Internal 2,000 4,000 6,000 8,000 10,000 12,000 14,000 FAQ Neptune Omega Grow Omega Grow Plus
Slide 40: OPI Fish Solubles Price
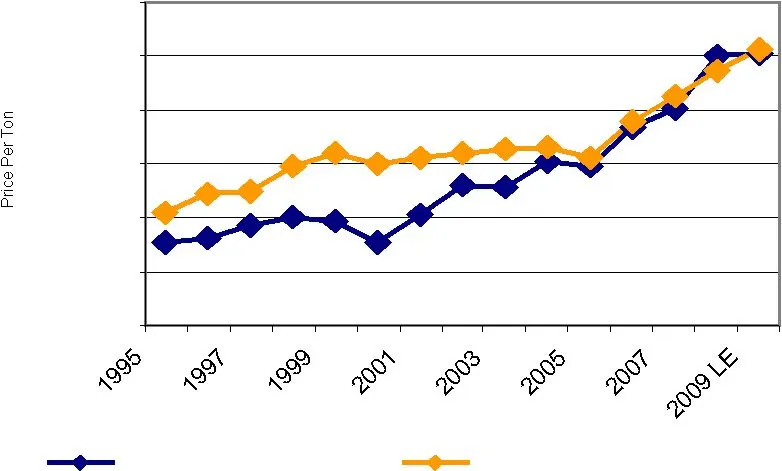
OPI Fish Solubles Price Soluble Price Per Ton History 1995-2009 LE Source: Internal $0.00 $100.00 $200.00 $300.00 $400.00 $500.00 $600.00 FAQ & Neptune OmegaGrow & OmegaGrow Year
Slide 41: OPI Fish Solubles Revenue
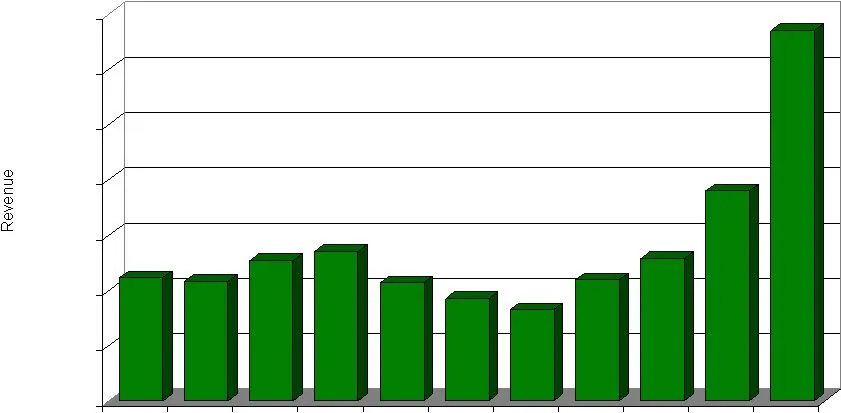
OPI Fish Solubles Revenue Source: Internal $0 $1,000,000 $2,000,000 $3,000,000 $4,000,000 $5,000,000 $6,000,000 $7,000,000 2009 LE Fish Solubles Revenue History 1999 to 2009 LE
Slide 42: World Population Growth
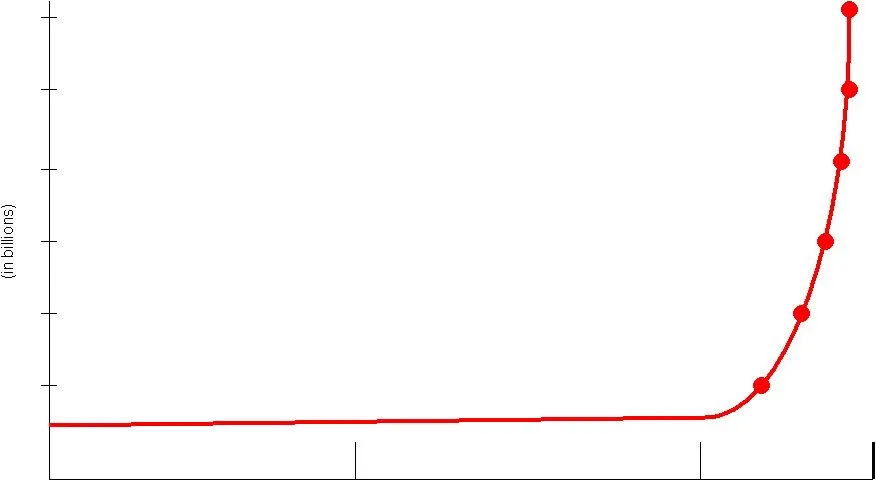
World Population Growth Industrial Agricultural Hunter-Gatherer (-4x10 years) (-10,000 years) Source: Leaf and Weber Am J Clin Nutr 1987;45:1048-1053
Slide 43: n-6/n-3 ratio
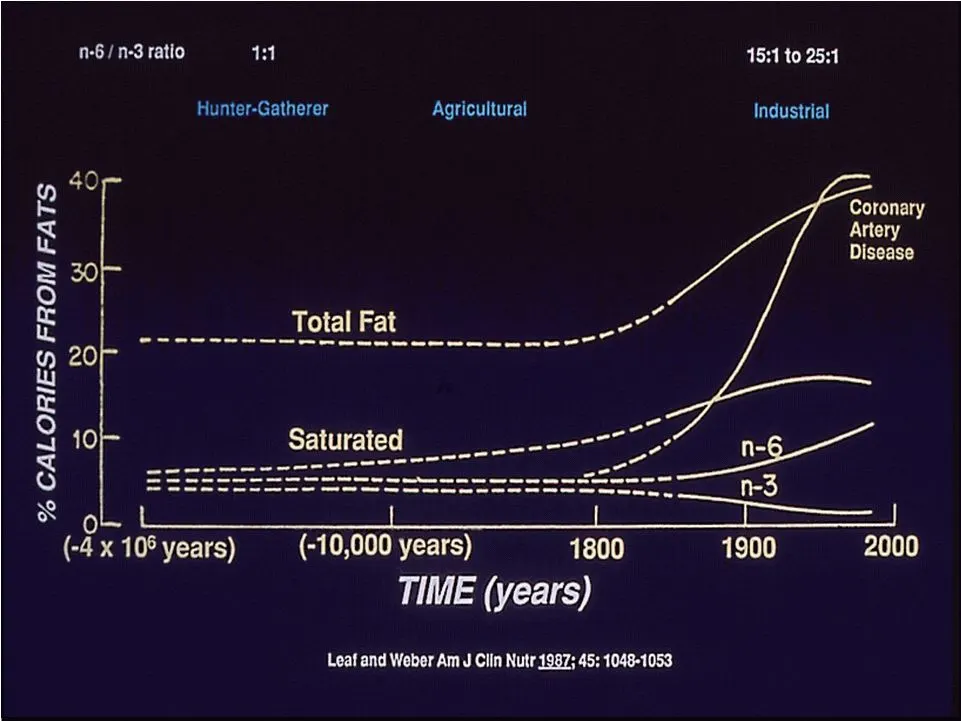
n-6/n-3 ratio 4:1 15:1 to 25:1 Hunter-Gatherer Agricultural Industrial 40 Coronary Artery Disease 30) Total Fat eae 10 Saturated aoa Cee % CALORIES FROM FATS tO ie} ) (-4 x 10° years) (-10,000 years) 1800 1900 2000 TIME (years) Leaf and Weber Am J Clin Nutr 1987; 45: 1048-1053
Slide 44: Soy oil production for food consumption
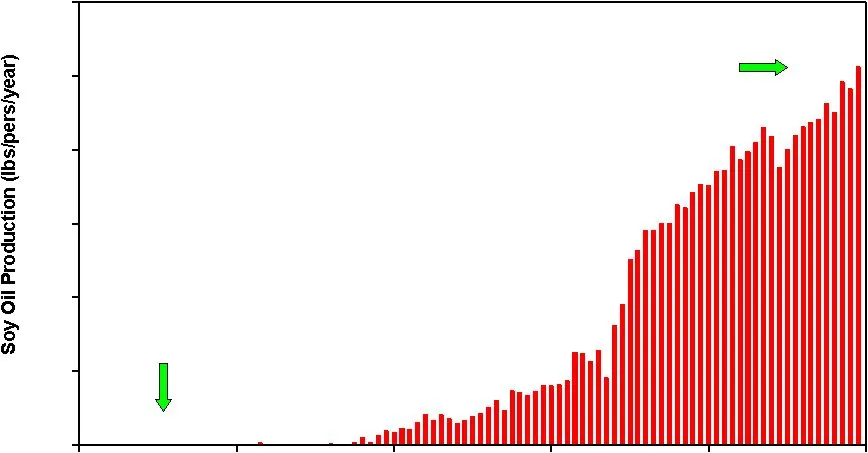
Source: J. Hibbeln, M.D., National Institute of Health, Bethesda, MD Soy oil production for food consumption USA, 1909-1999 Year 25.0 lbs/pers/year-1999 0.02 lbs/pers/year-1909
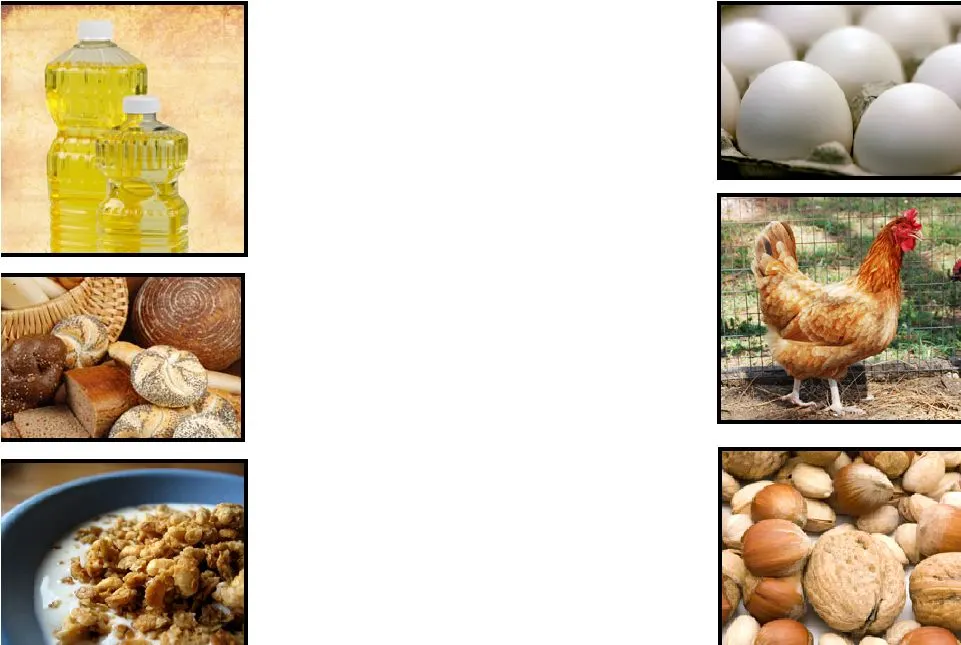
Slide 45: Foods Rich in Omega-6 Fatty Acids
• Most vegetable oils • Corn • Soy • Canola • Safflower • Sunflower • Breads and Baked Goods • Cereals • Eggs and poultry • Nuts Foods Rich in Omega-6 Fatty Acids
Slide 46: The Future of Fish Oil
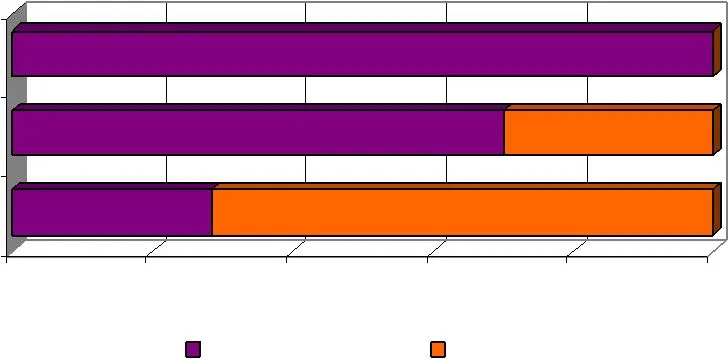
28.6% 71.4% 70.0% 30.0% 100.0% The Future of Fish Oil Source: Packaged Facts: Omega-3 Foods and the U.S. Food and Beverage Market, March 2007 0.0% 20.0% 40.0% 60.0% 80.0% 100.0% Percent Share of ALA vs DHA/EPA 2002-2011 ALA EPA and DHA
Slide 47: Catamaran Project
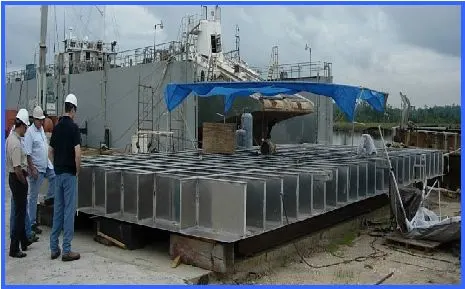
Catamaran Project • Deck construction is 90% complete • Hull sections are 55% complete • Main jet engines delivered the week of June 2 • Expect delivery of the propulsion units by the end of June • Catamaran is expected to be launched in September 2009
Slide 48: Energy Spending
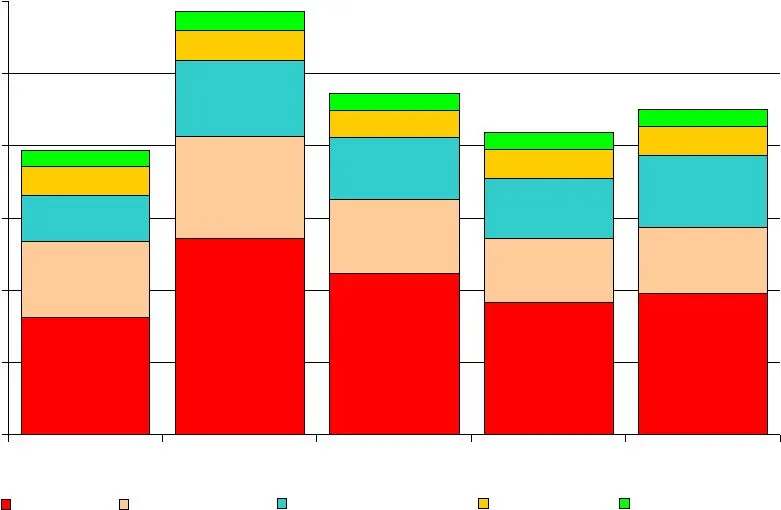
Energy Spending (in millions) $8.1 $13.5 $11.1 $9.1 $9.8 $5.2 $7.2 $5.1 $4.5 $4.6 $3.2 $5.2 $4.3 $4.1 $5.0 $2.0 $2.1 $1.9 $2.0 $2.0 $1.1 $1.3 $1.2 $1.2 $1.2 $0 $5 $10 $15 $20 $25 $30 Projected 2009 Projected 2010 Projected 2011 Diesel Natural Gas Bunker C (fuel oil) Electricity Aviation Fuel Note: -
Source: SEC EDGAR · 8-K filed Sep 28, 2009
More decks from Omega Protein Corp
 Investor Presentation (May 2017)27 slides · May 17, 2017
 Investor Presentation (January 2017)27 slides · Jan 11, 2017
 Proxy Contest (June 2016)48 slides · Jun 8, 2016
 Proxy Contest (June 2016)36 slides · Jun 7, 2016
 Investor Presentation (May 2016)29 slides · May 18, 2016
 Investor Presentation (September 2015)25 slides · Sep 17, 2015