Brandywine Realty Trust · NYSE:BDN
Brandywine Realty Trust — Prentiss Properties Trust — Merger or Acquisition (November 2005)
25 slides from Brandywine Realty Trust's merger presentation, Nov 3, 2005
Slide 1: Filed by Brandywine Realty Trust pursuant to Rule 425
Filed by Brandywine Realty Trust pursuant to Rule 425 under the Securities Act of 1933 and deemed filed pursuant to Rule 14a-12 Under the Securities Exchange Act of 1934 Subject Company: Prentiss Properties Trust Commission File No.:1-14516 This filing relates to a proposed acquisition (the “Acquisi
Slide 2: NAREIT Presentation November 2005
November 2005 NAREIT Presentation
Slide 3: Safe Harbor
Safe Harbor In addition to historical information, this presentation contains forward- looking statements under the federal securities laws. Because these statements are based on current expectations, estimates and projections about the industry and markets in which Brandywine and Prentiss operate,
Slide 4: Strategic Rationale
Strategic Rationale Pragmatic targeted market expansion combining quality assets, strong market dynamics and seasoned management Brandywine gains a focused expansion into three dynamic markets with experienced Prentiss management teams Metro Washington, D.C. Oakland, CA Austin, TX The Company’s rela
Slide 5: Why this transaction?
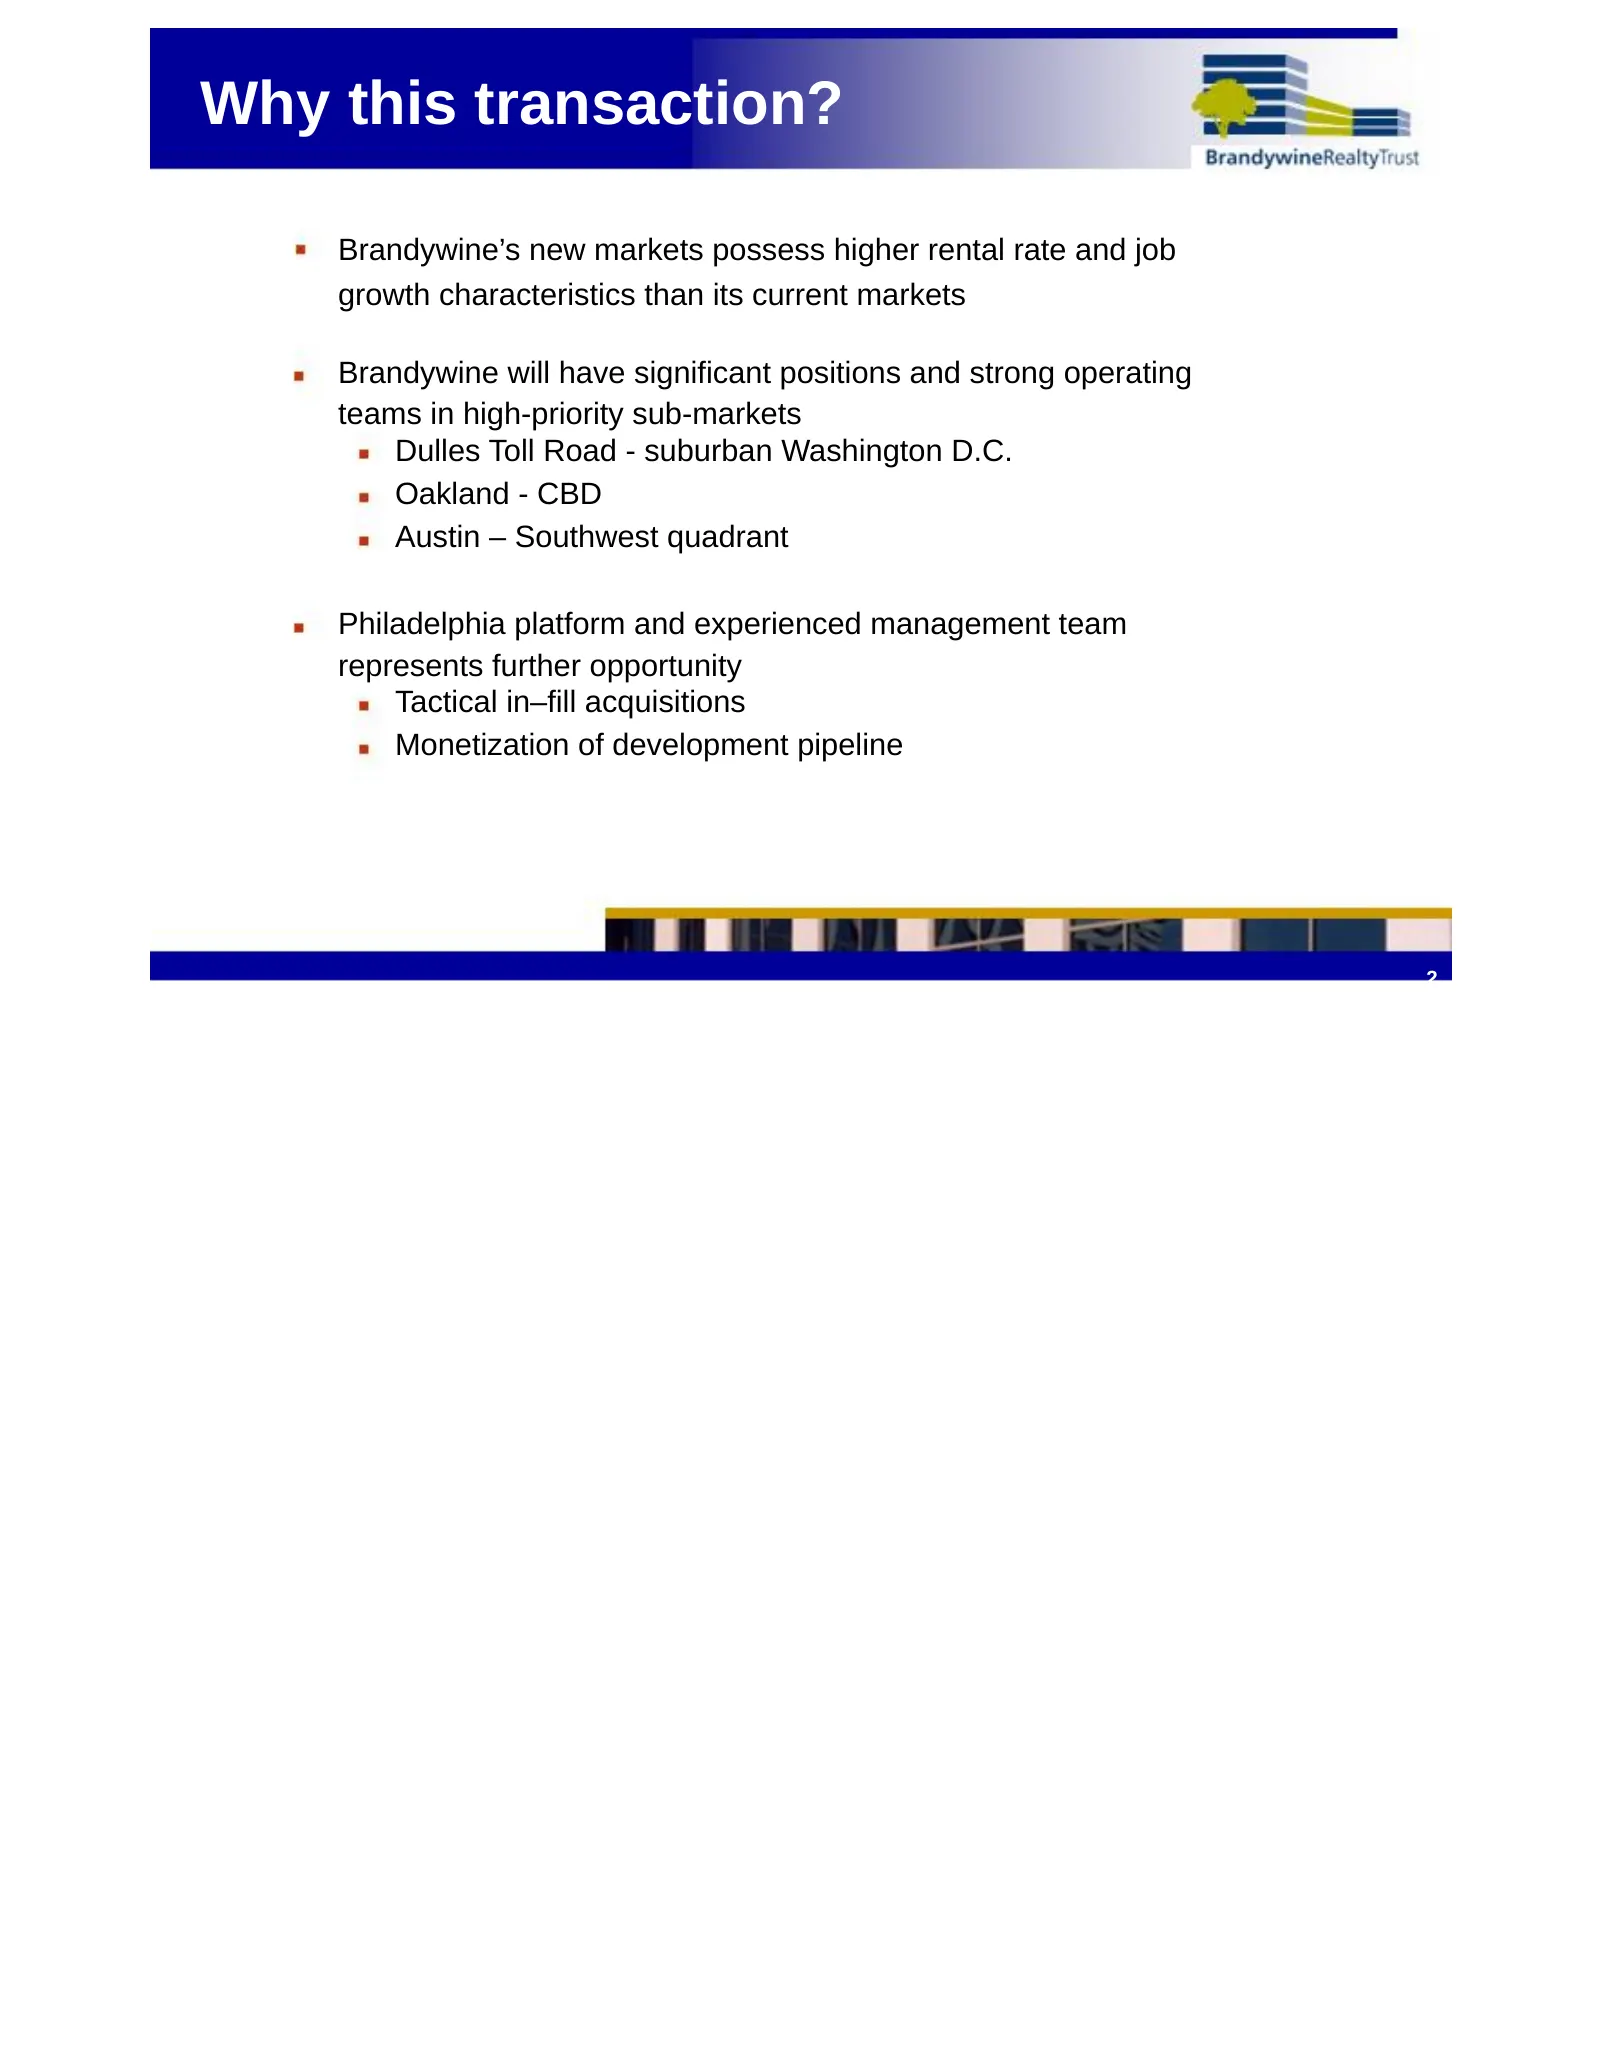
Why this transaction? Brandywine’s new markets possess higher rental rate and job growth characteristics than its current markets Brandywine will have significant positions and strong operating teams in high-priority sub-markets Dulles Toll Road - suburban Washington D.C. Oakland - CBD Austin – Sout
Slide 6: What this transaction is not
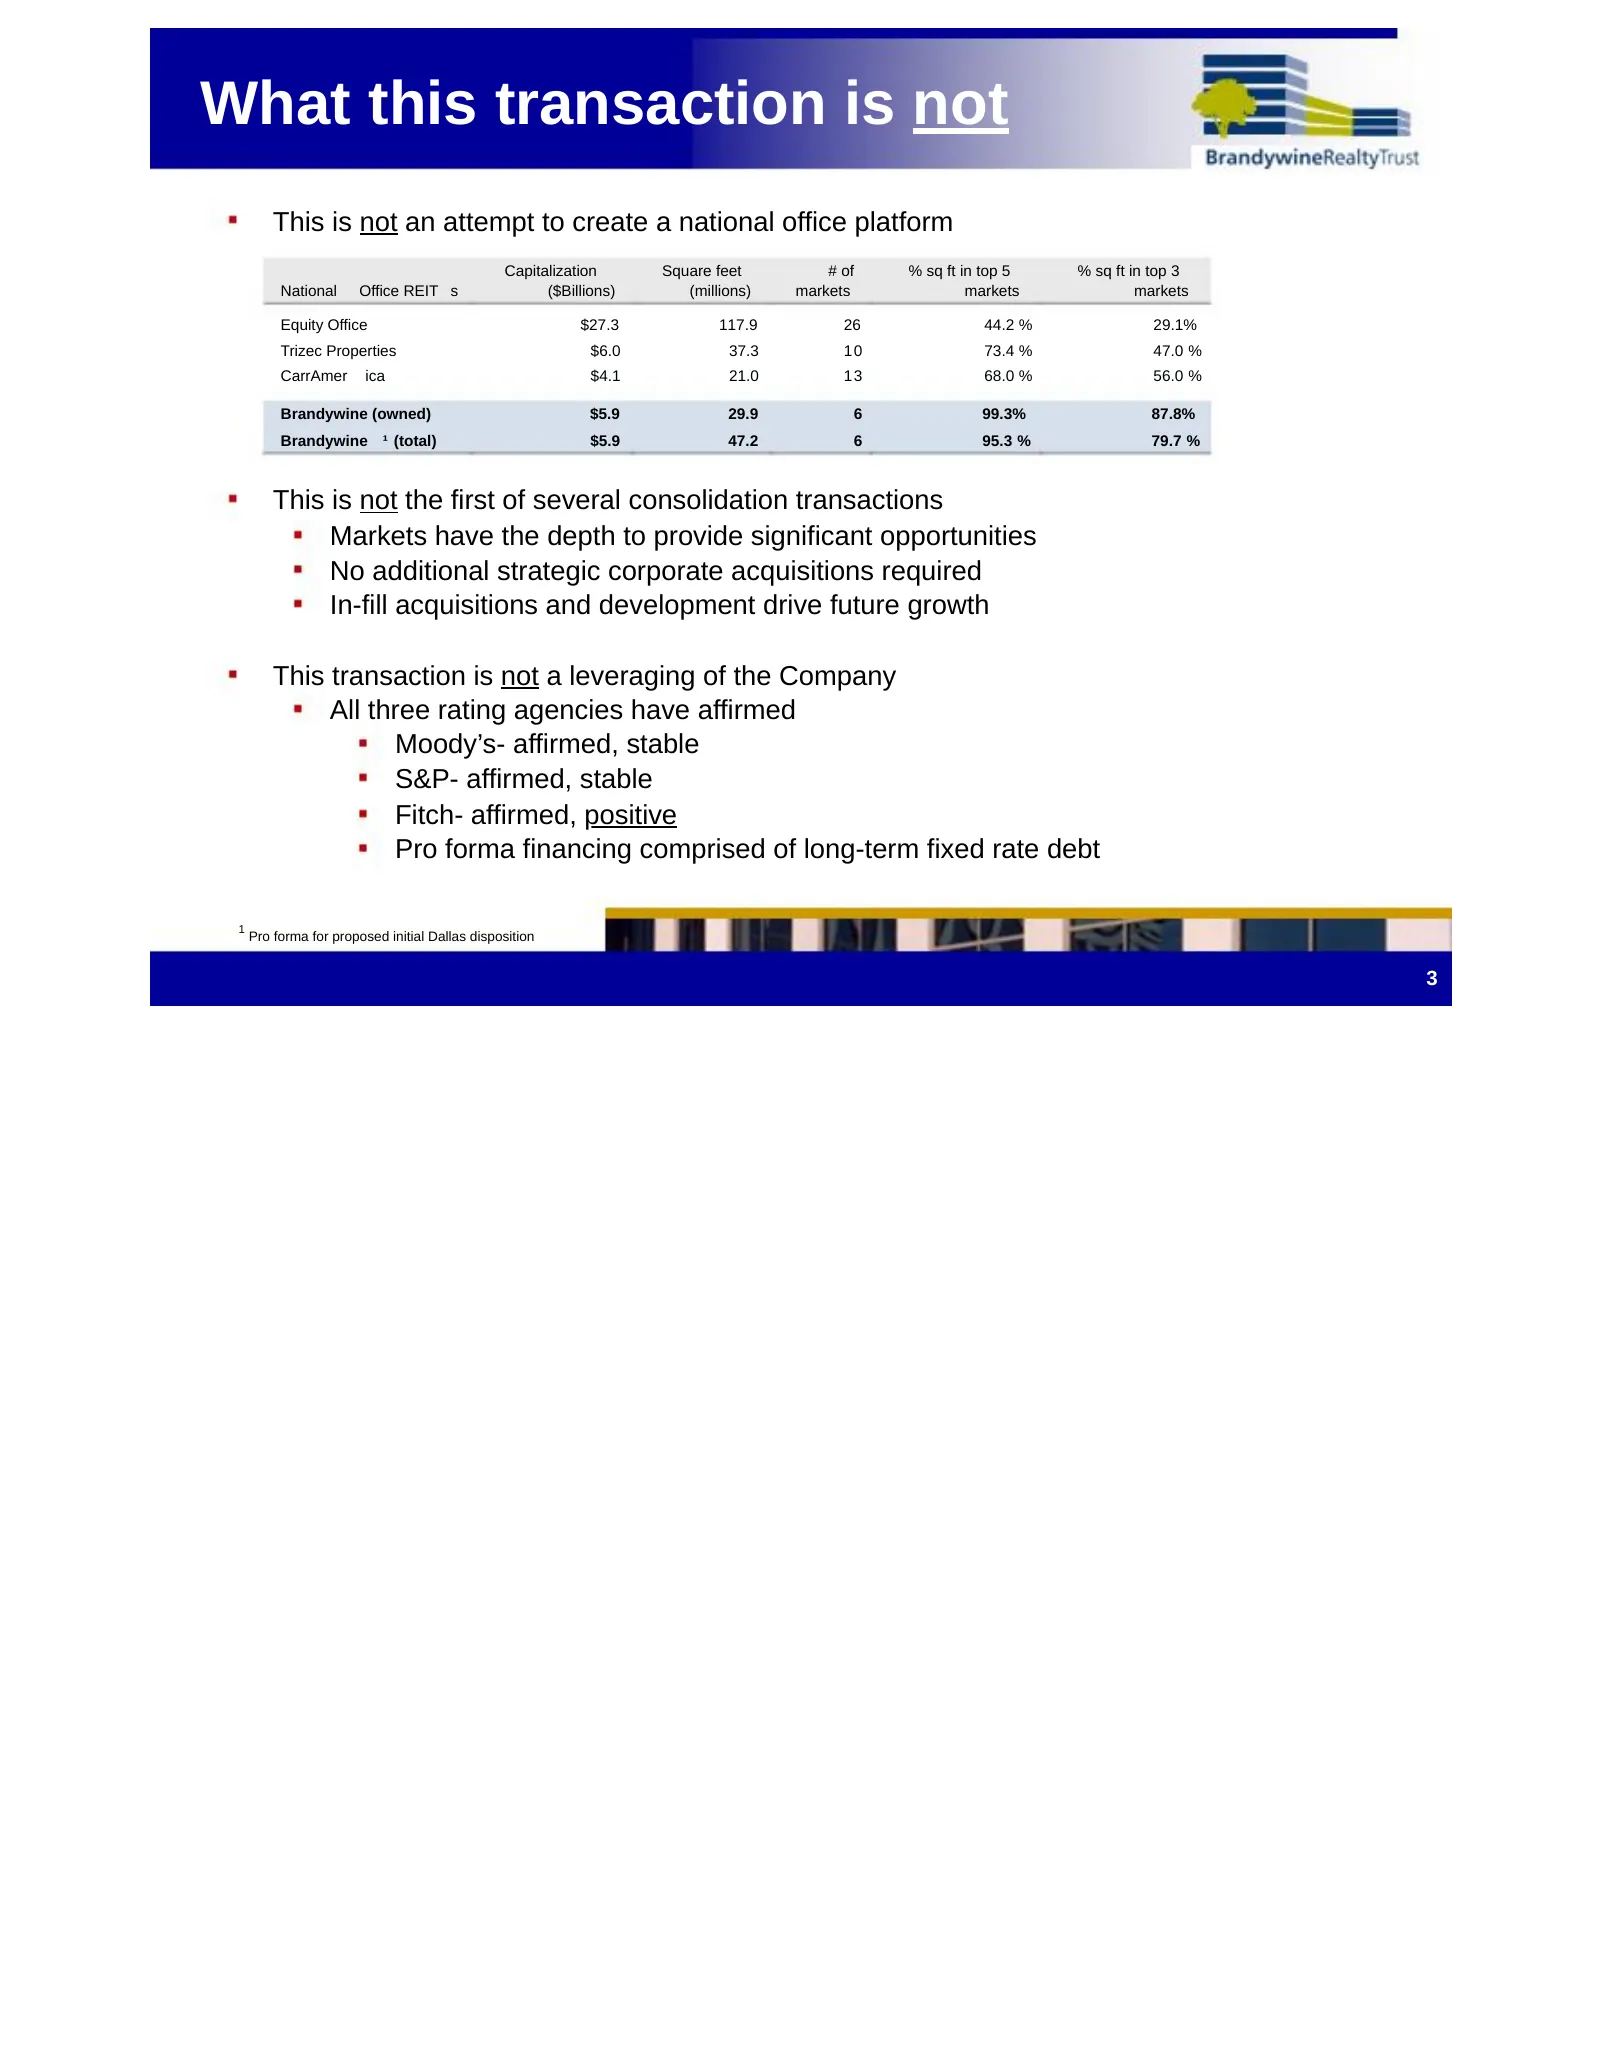
What this transaction is not This is not an attempt to create a national office platform Capitalization Square feet # of % sq ft in top 5 % sq ft in top 3 National Office REIT s ($Billions) (millions) markets markets markets Equity Office $27.3 117.9 26 44.2 % 29.1% Trizec Properties $6.0 37.3 10 73
Slide 7: Combined Company Growth Driven by Opportunities in Place at Closing
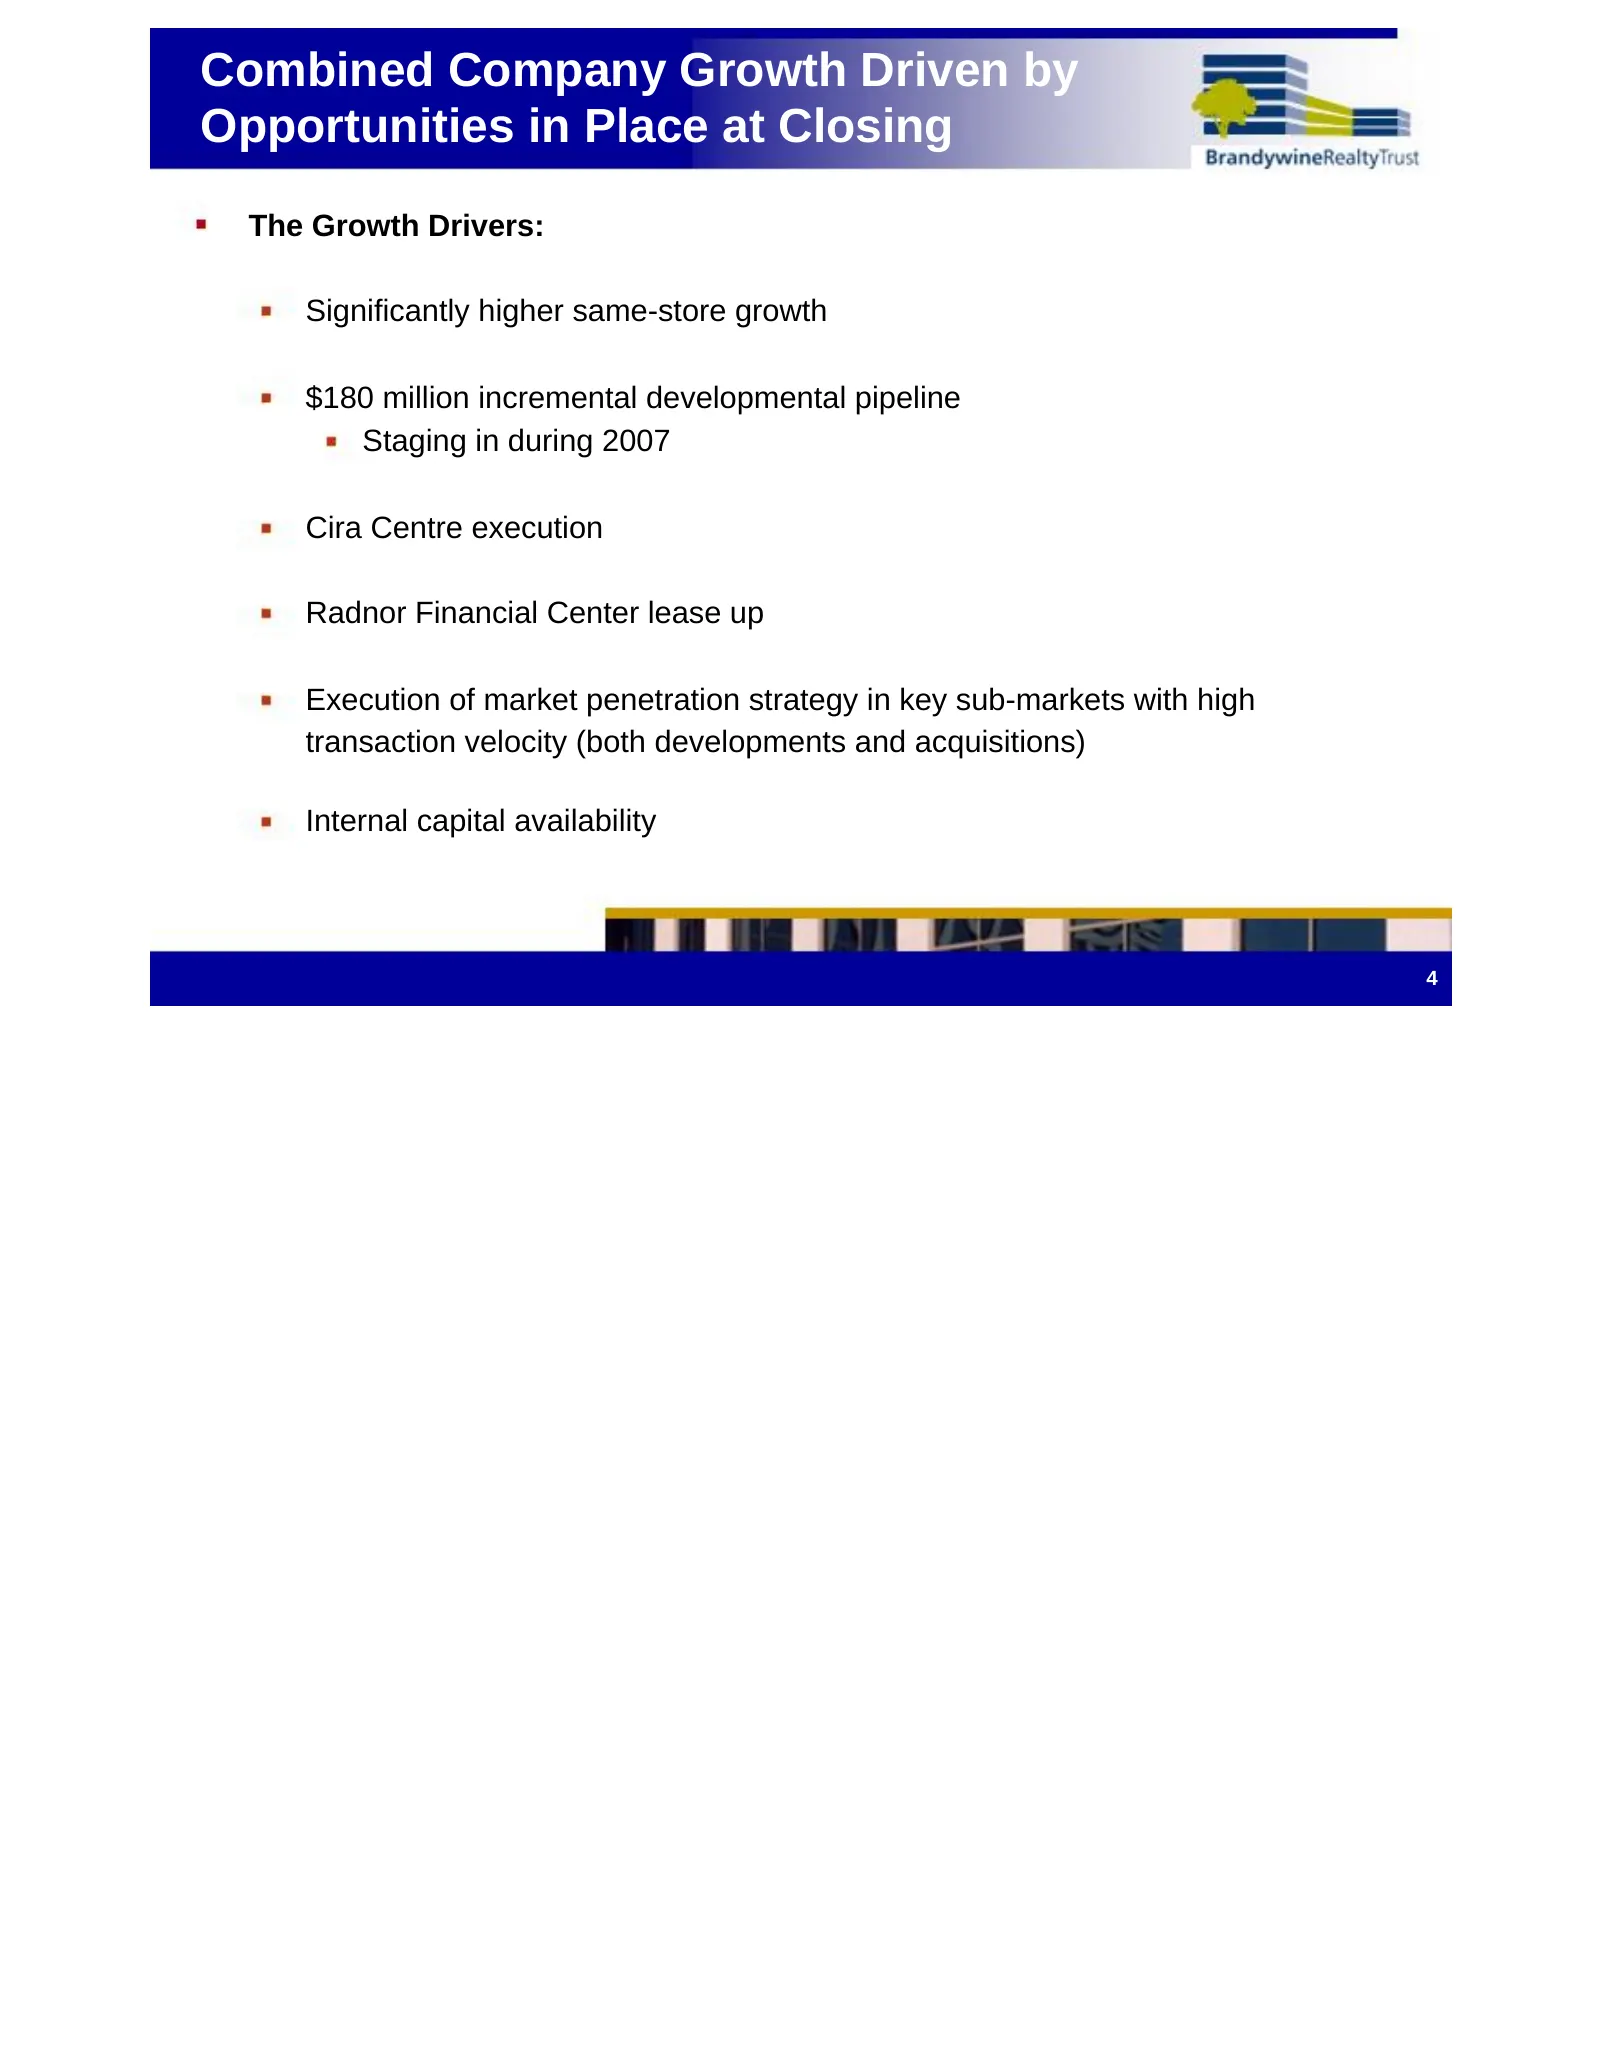
Combined Company Growth Driven by Opportunities in Place at Closing The Growth Drivers: Significantly higher same-store growth $180 million incremental developmental pipeline Staging in during 2007 Cira Centre execution Radnor Financial Center lease up Execution of market penetration strategy in key
Slide 8: Market Growth Comparisons
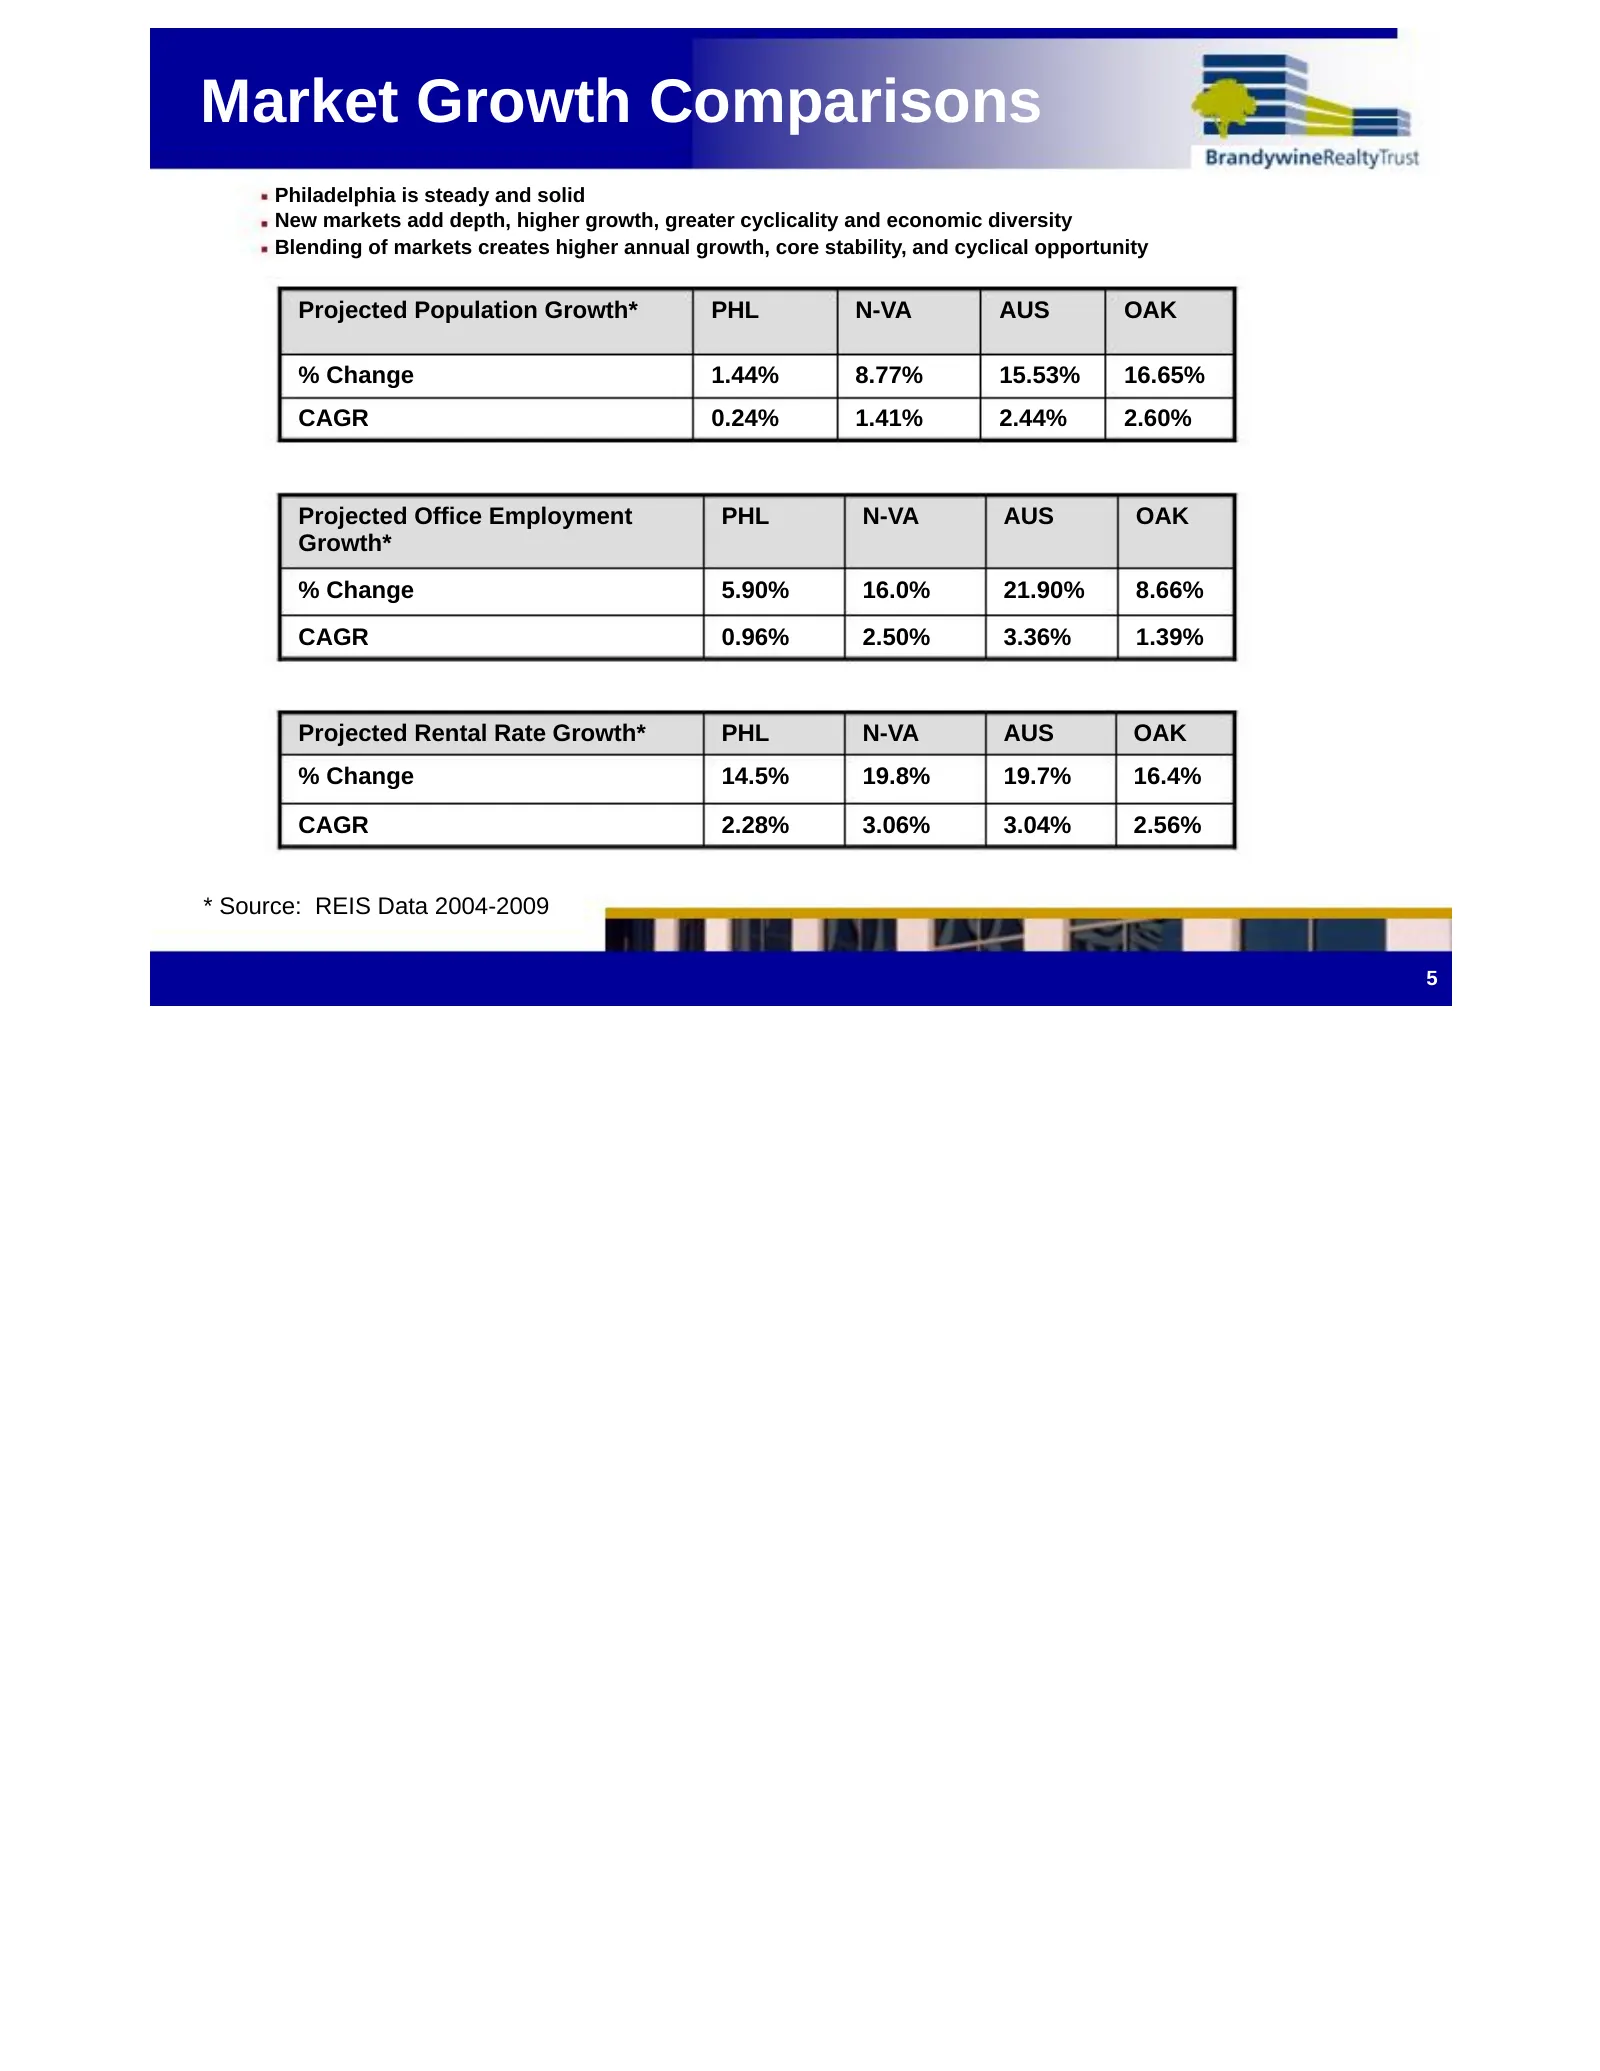
Market Growth Comparisons Philadelphia is steady and solid New markets add depth, higher growth, greater cyclicality and economic diversity Blending of markets creates higher annual growth, core stability, and cyclical opportunity Projected Population Growth* PHL N-VA AUS OAK % Change 1.44% 8.77% 15
Slide 9: Combined Company Long-term Growth Summary
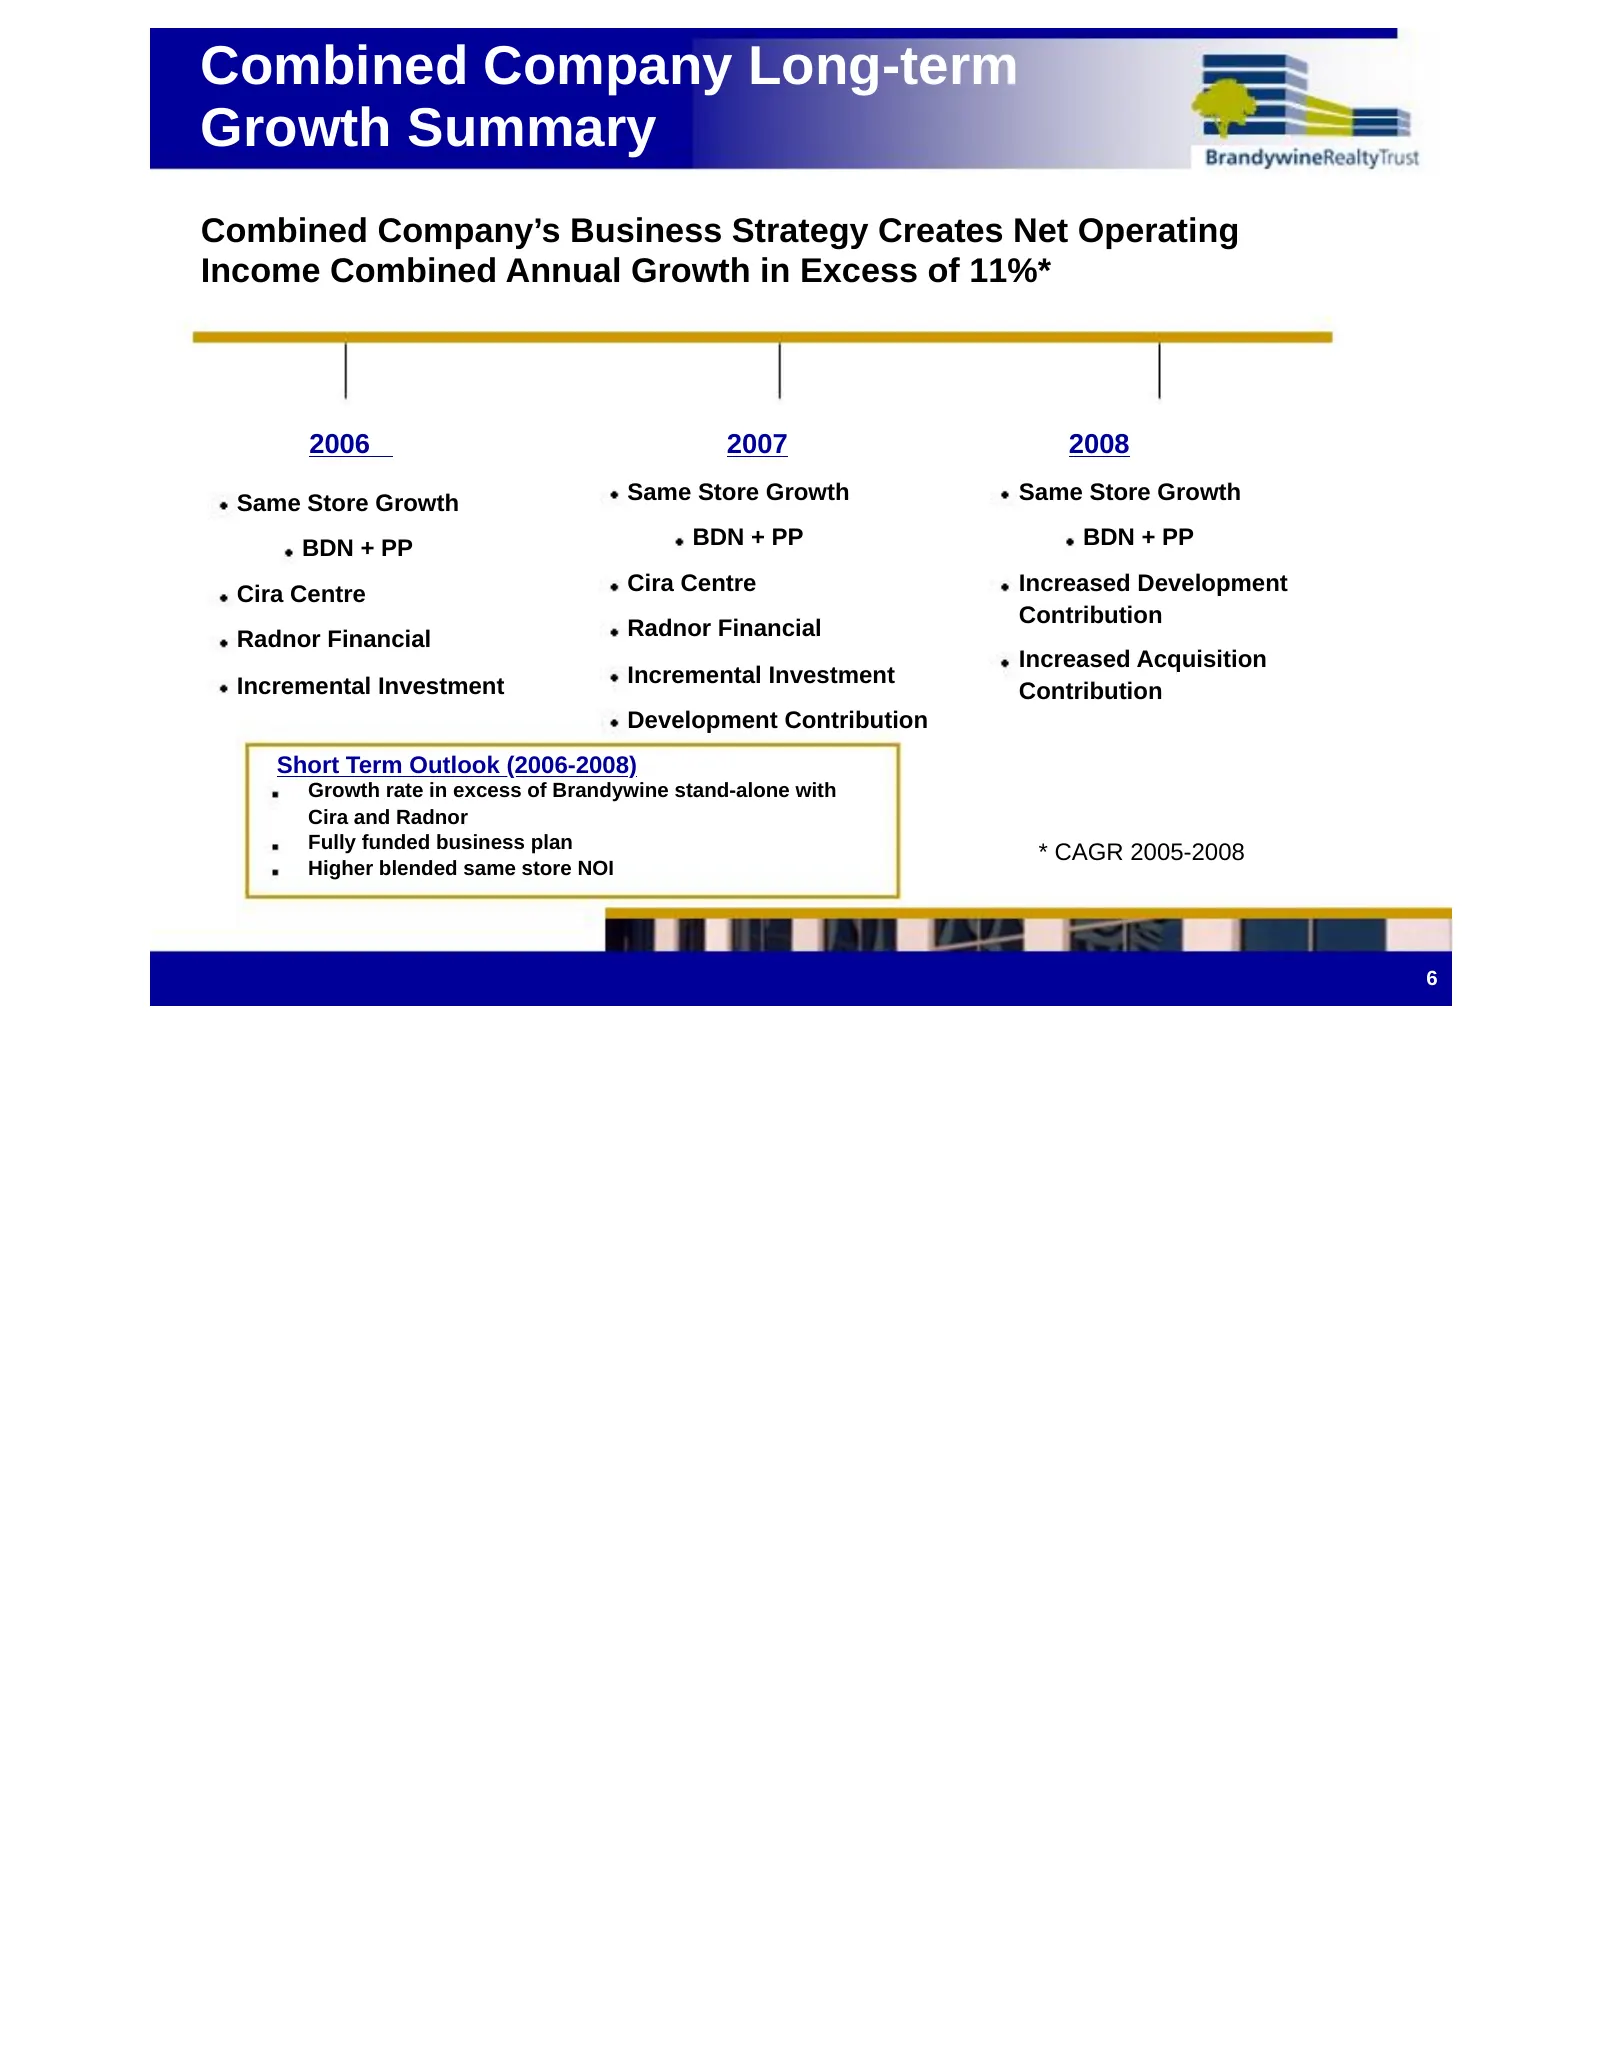
Combined Company Long-term Growth Summary Combined Company’s Business Strategy Creates Net Operating Income Combined Annual Growth in Excess of 11%* 2006 2007 2008 Same Store Growth Same Store Growth Same Store Growth BDN + PP BDN + PP BDN + PP Cira Centre Cira Centre Increased Development Contribut
Slide 10: The Same-Store Comparison
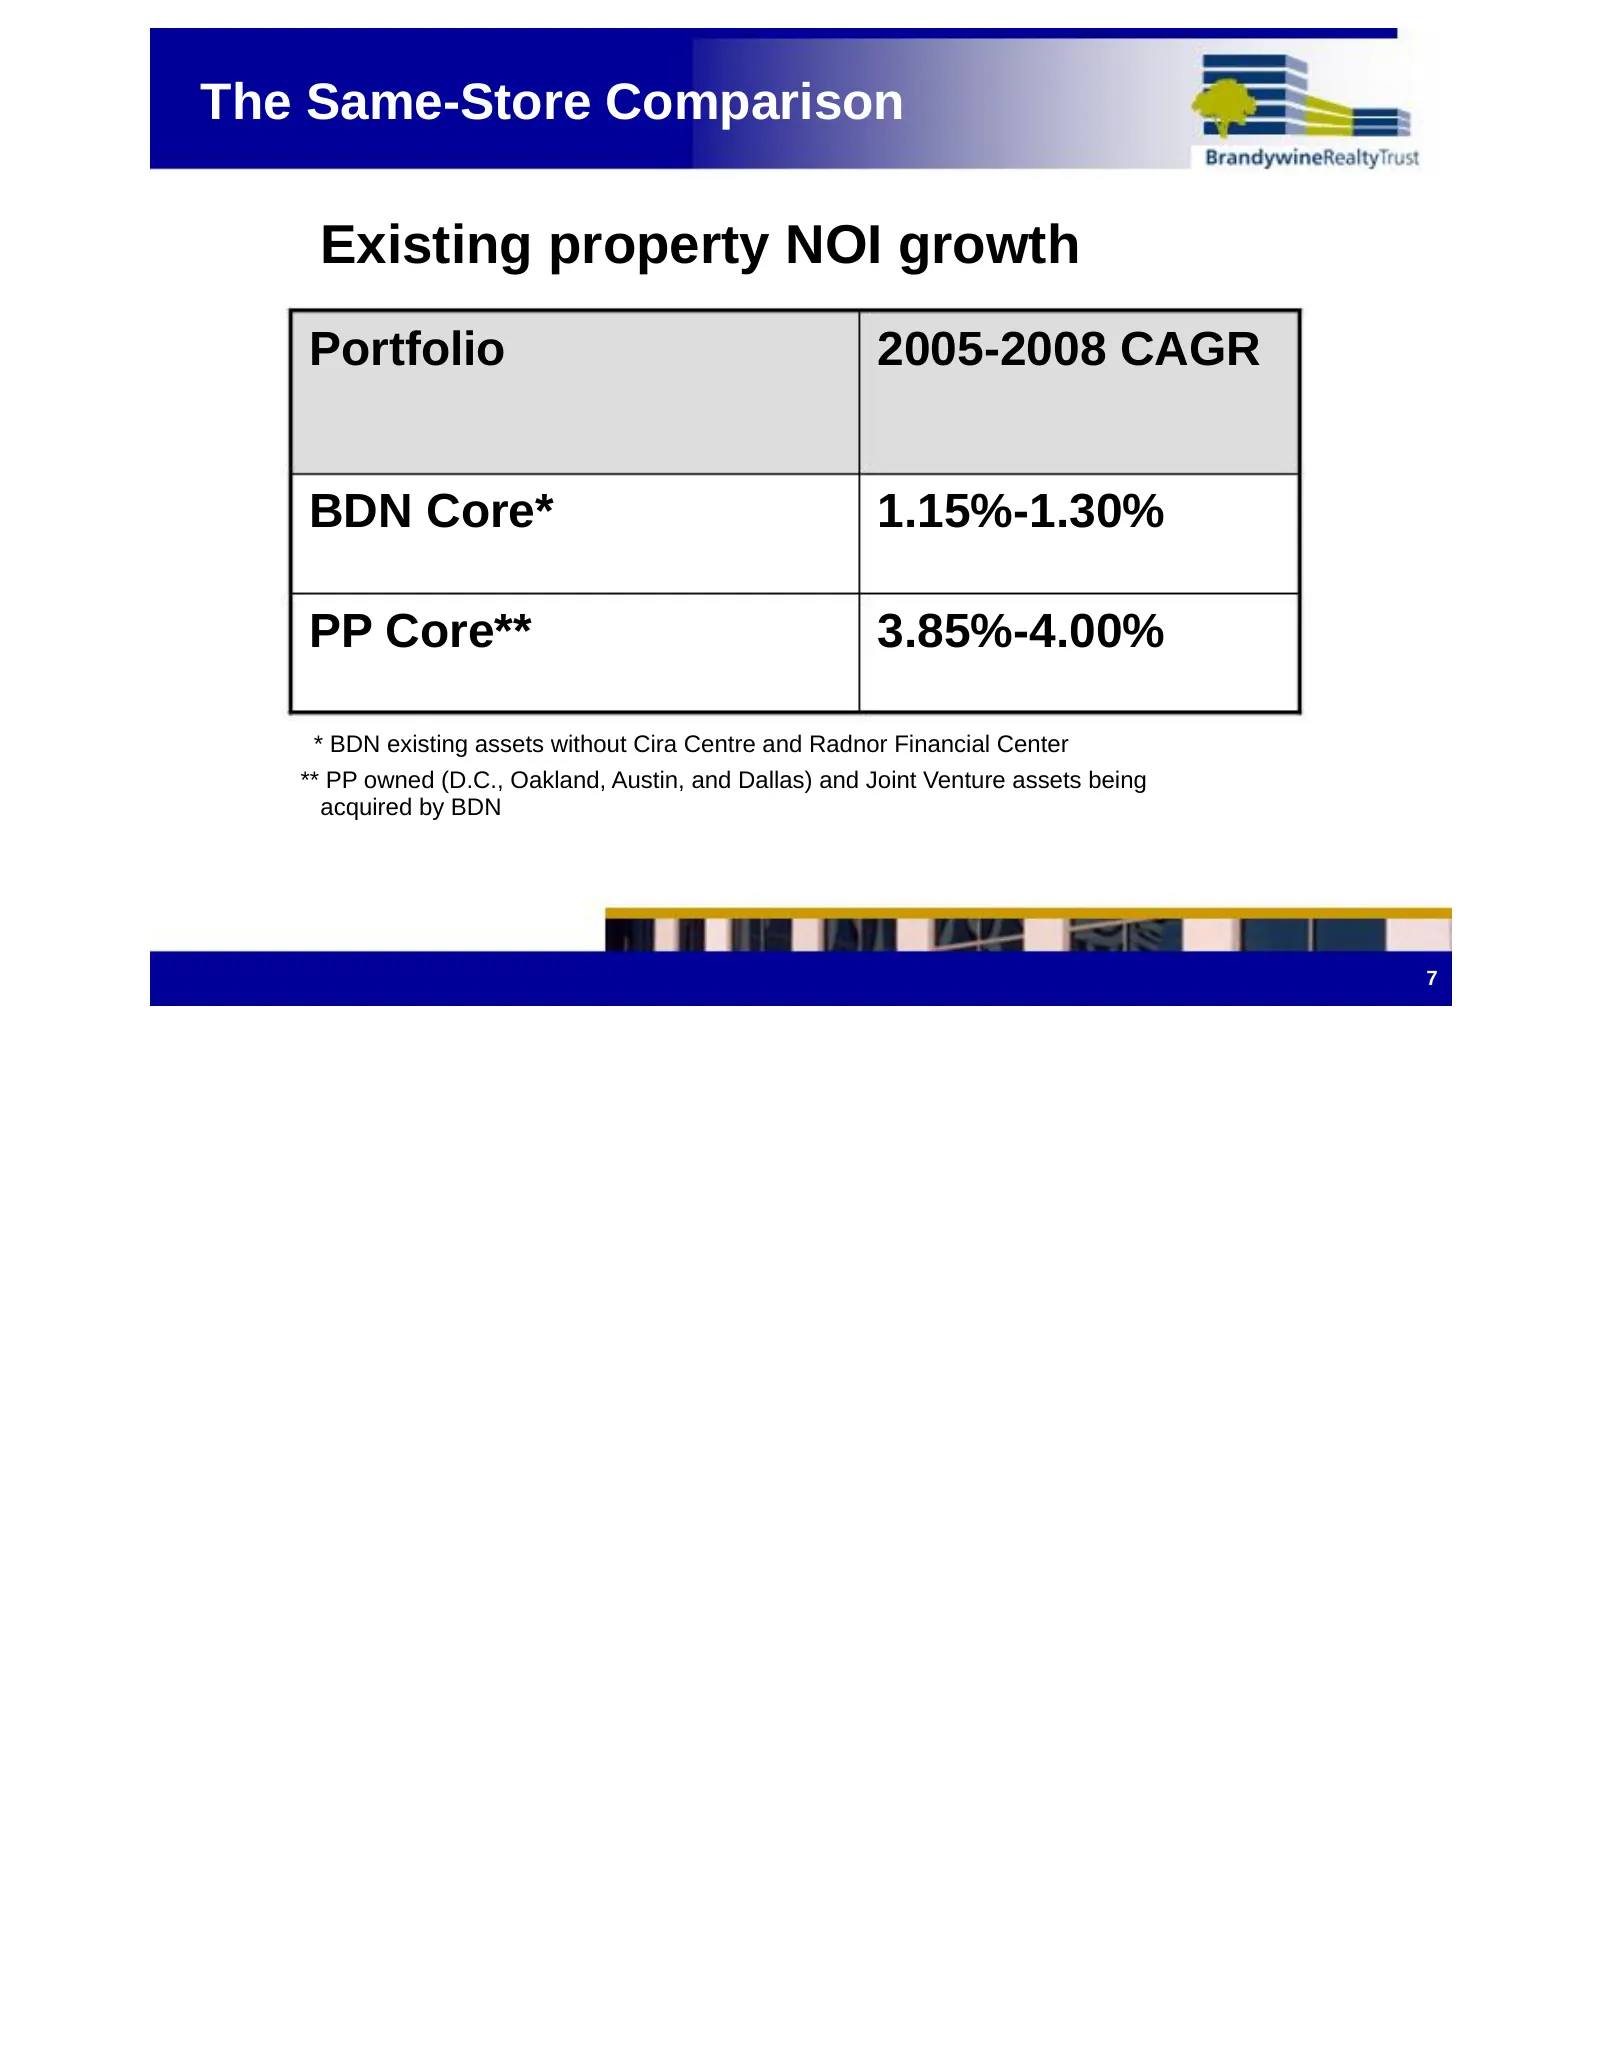
The Same-Store Comparison Existing property NOI growth Portfolio 2005-2008 CAGR BDN Core* 1.15%-1.30% PP Core** 3.85%-4.00% * BDN existing assets without Cira Centre and Radnor Financial Center ** PP owned (D.C., Oakland, Austin, and Dallas) and Joint Venture assets being acquired by BDN 7
Slide 11: The Same-Store Comparison Pro Forma for the Dallas Recycling Strategy
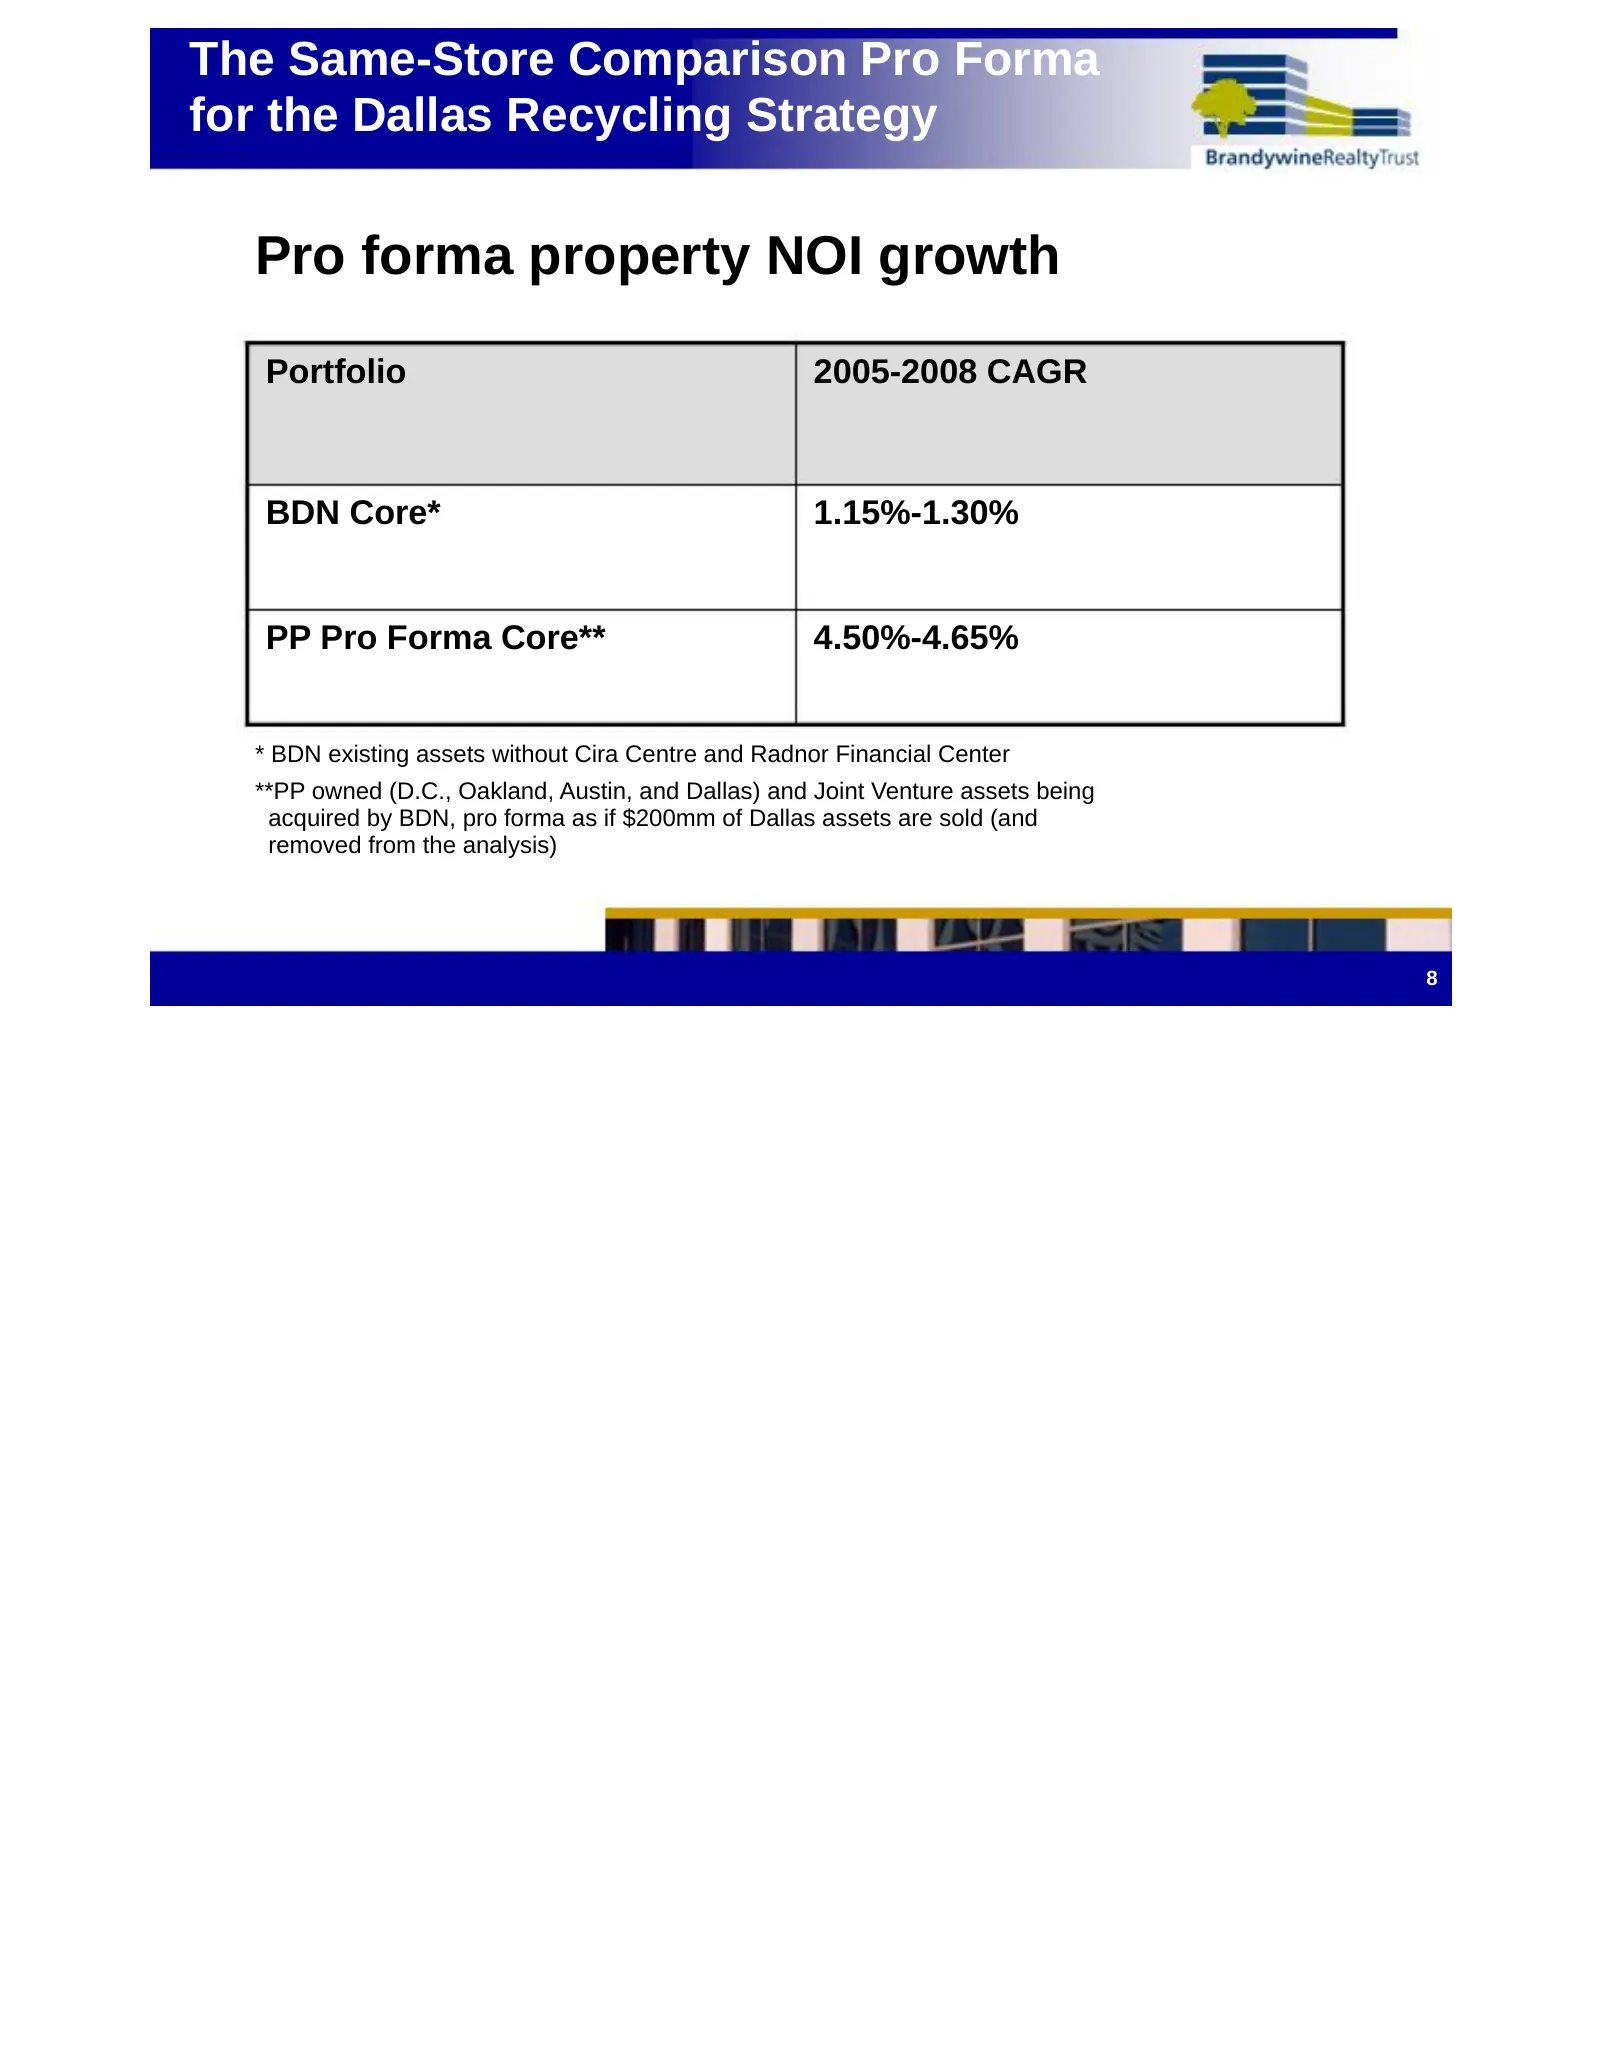
The Same-Store Comparison Pro Forma for the Dallas Recycling Strategy Pro forma property NOI growth Portfolio 2005-2008 CAGR BDN Core* 1.15%-1.30% PP Pro Forma Core** 4.50%-4.65% * BDN existing assets without Cira Centre and Radnor Financial Center **PP owned (D.C., Oakland, Austin, and Dallas) and
Slide 12: Total Portfolio NOI Growth Accelerates
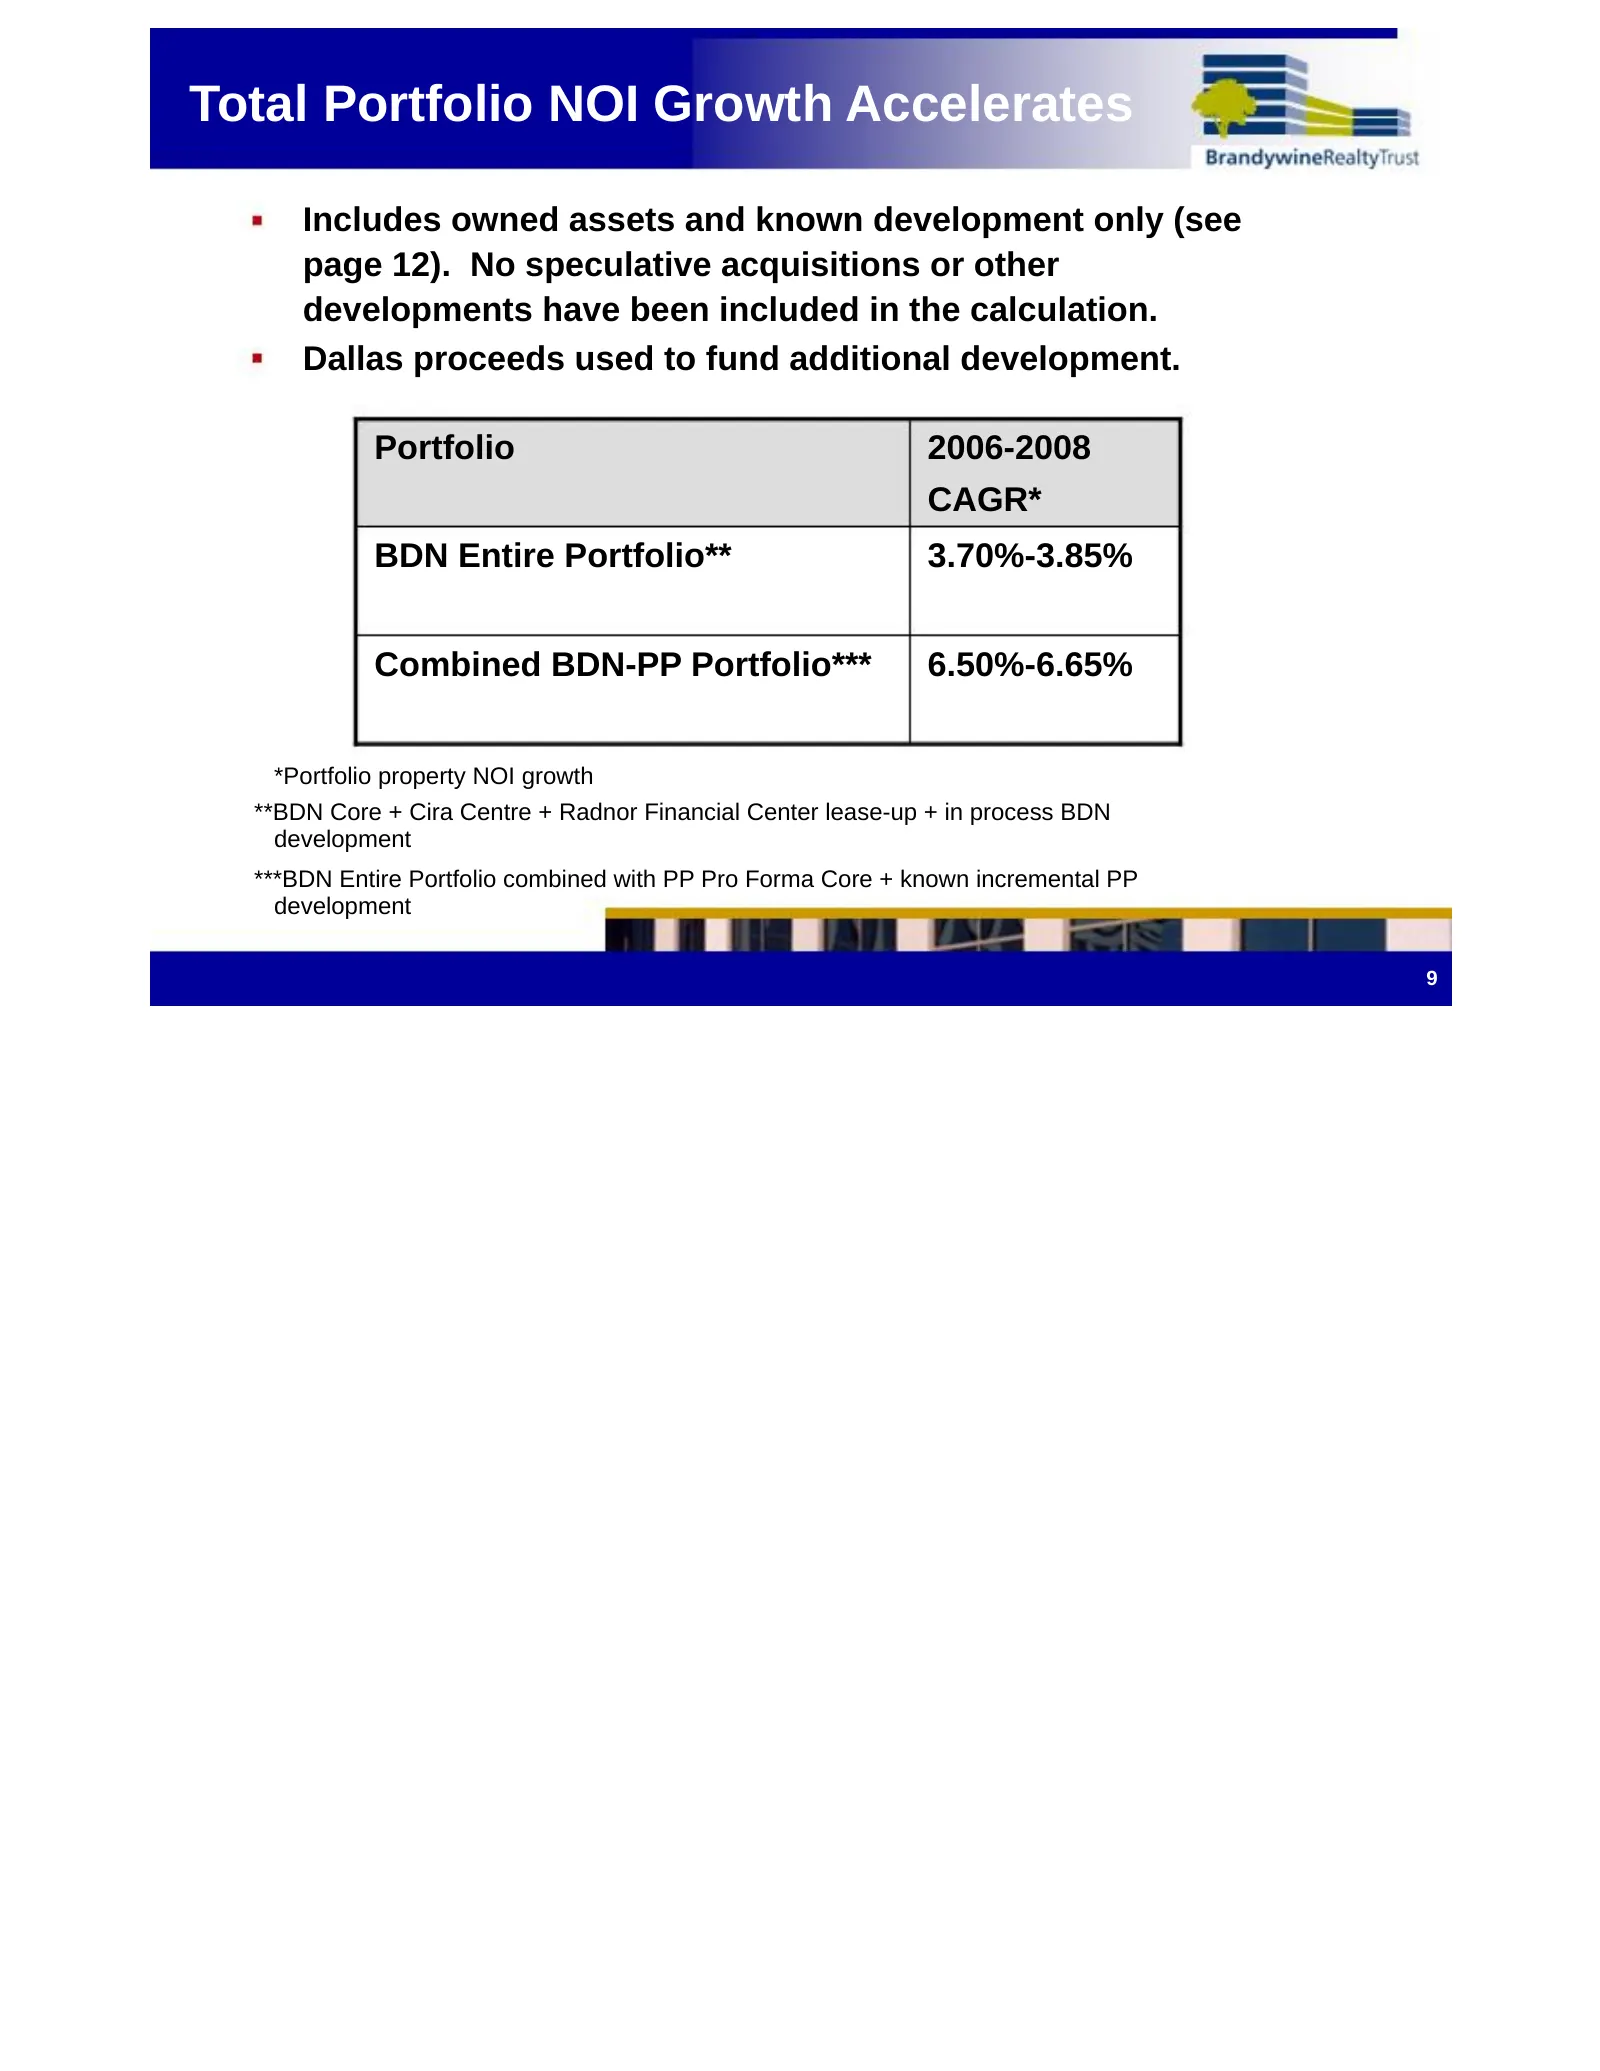
Total Portfolio NOI Growth Accelerates Includes owned assets and known development only (see page 12). No speculative acquisitions or other developments have been included in the calculation. Dallas proceeds used to fund additional development. Portfolio 2006-2008 CAGR* BDN Entire Portfolio** 3.70%-
Slide 13: New Markets Provide Enhanced Investment Opportunities
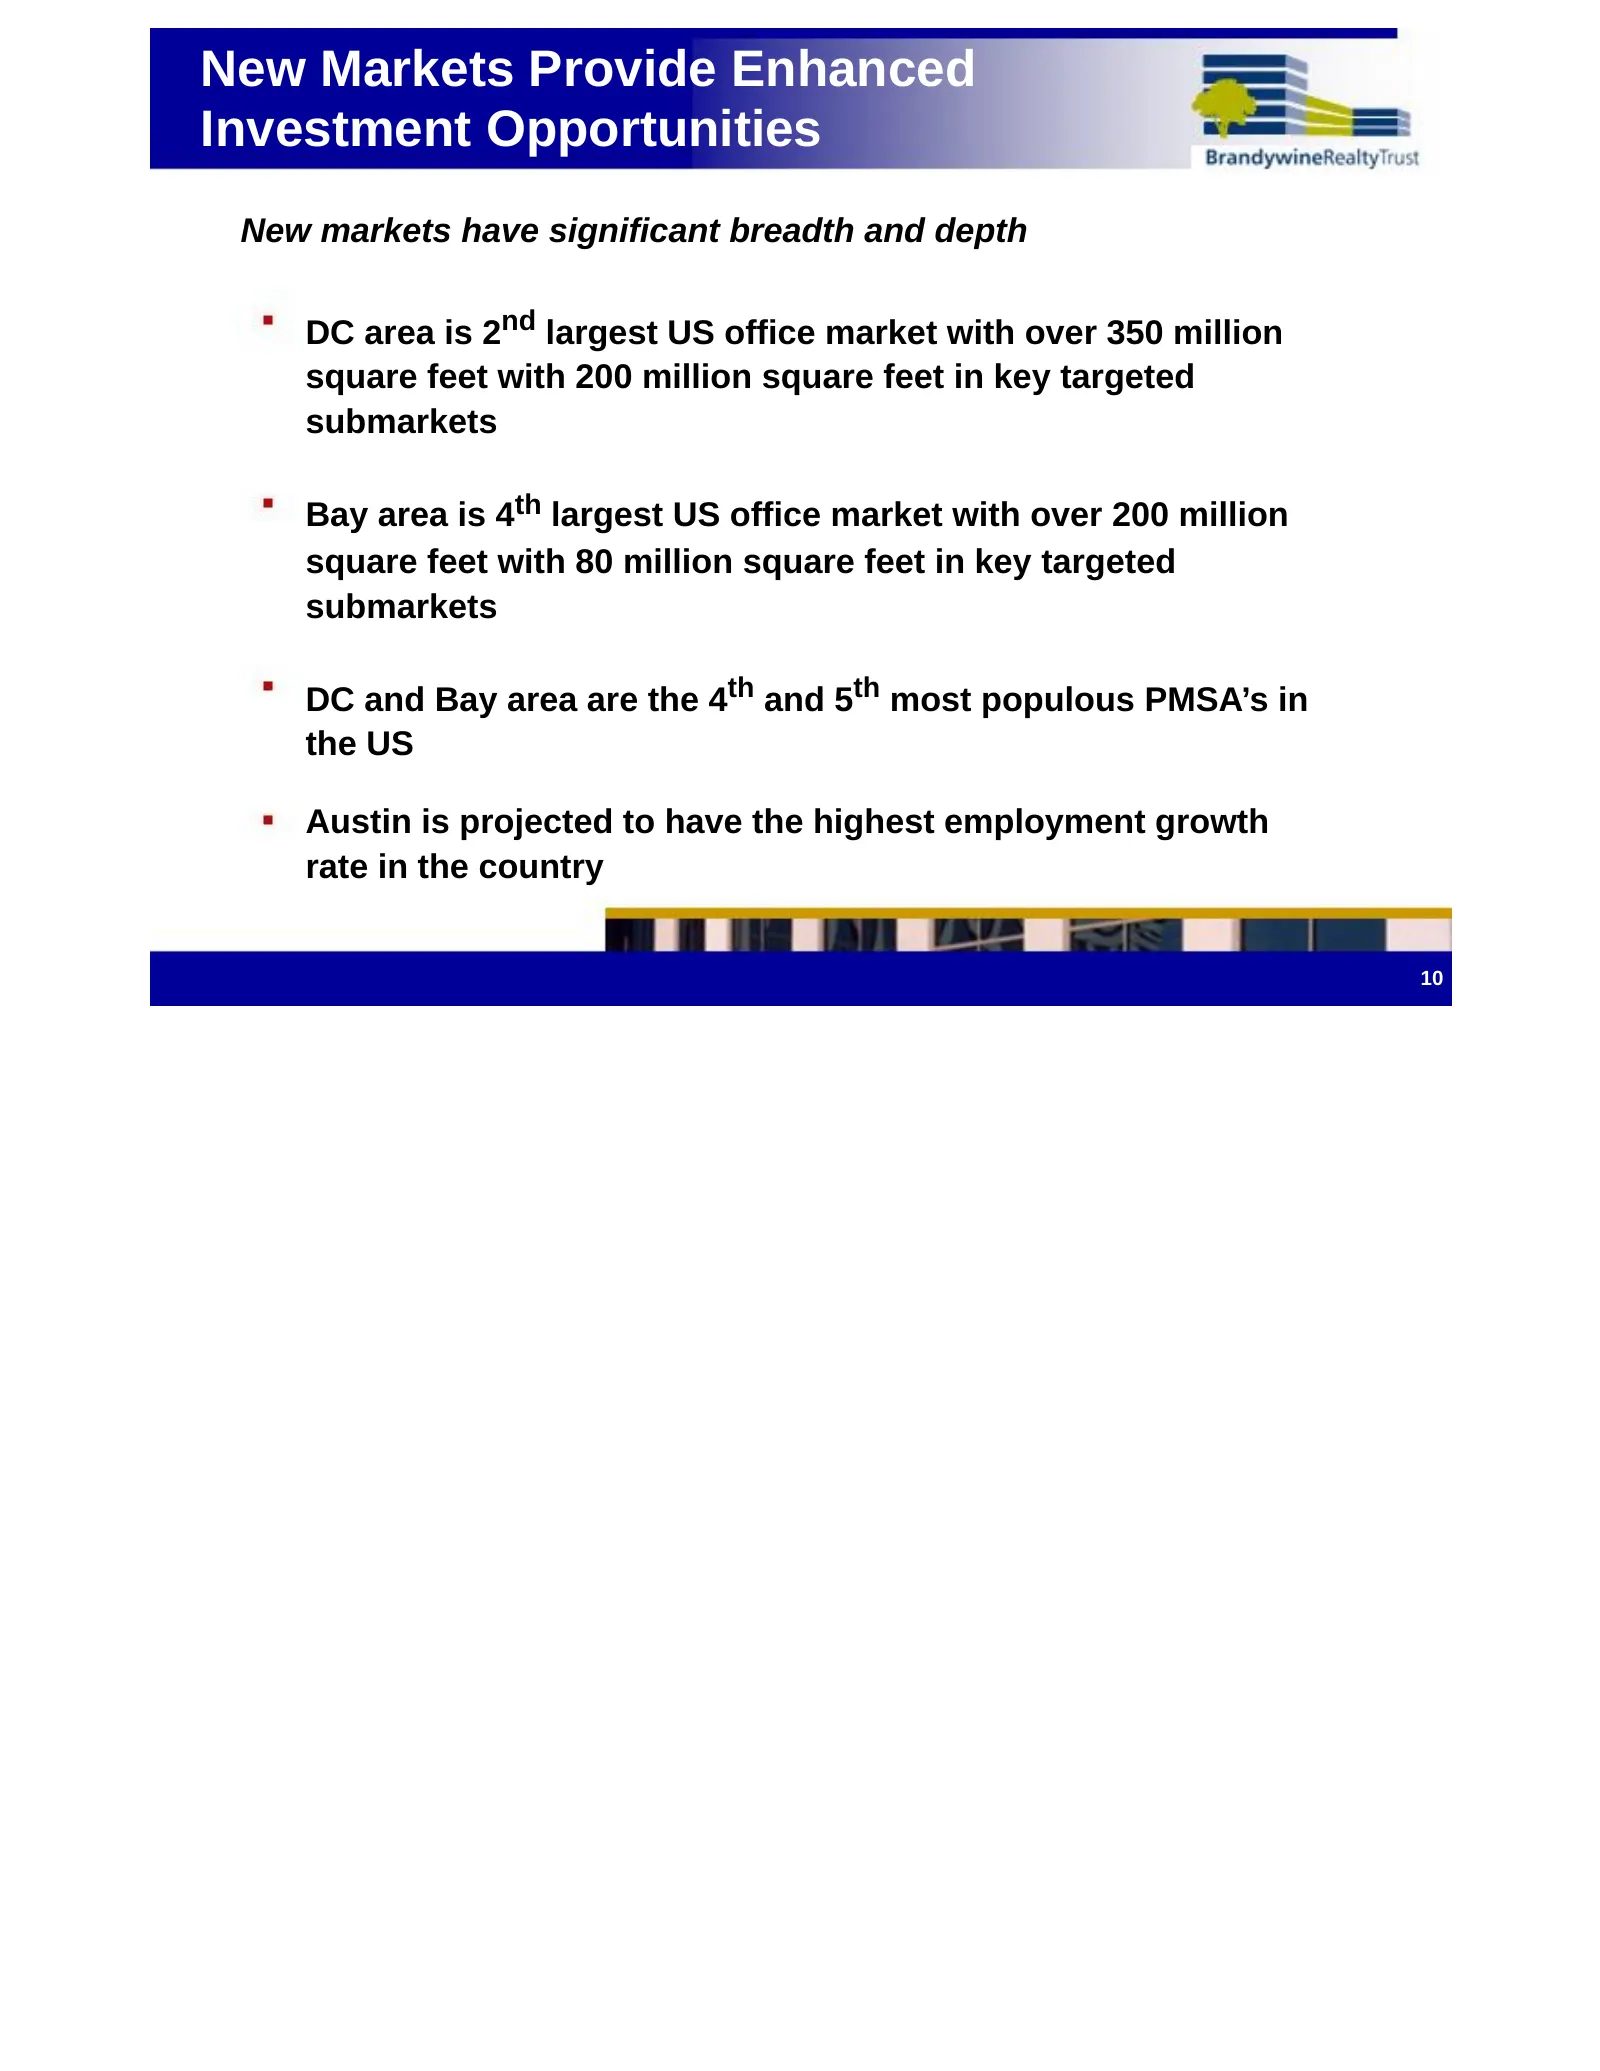
New Markets Provide Enhanced Investment Opportunities New markets have significant breadth and depth DC area is 2nd largest US office market with over 350 million square feet with 200 million square feet in key targeted submarkets Bay area is 4th largest US office market with over 200 million square
Slide 14: Beyond our Fully Funded Short-term Commitments, the Growth Potential is Dramatic
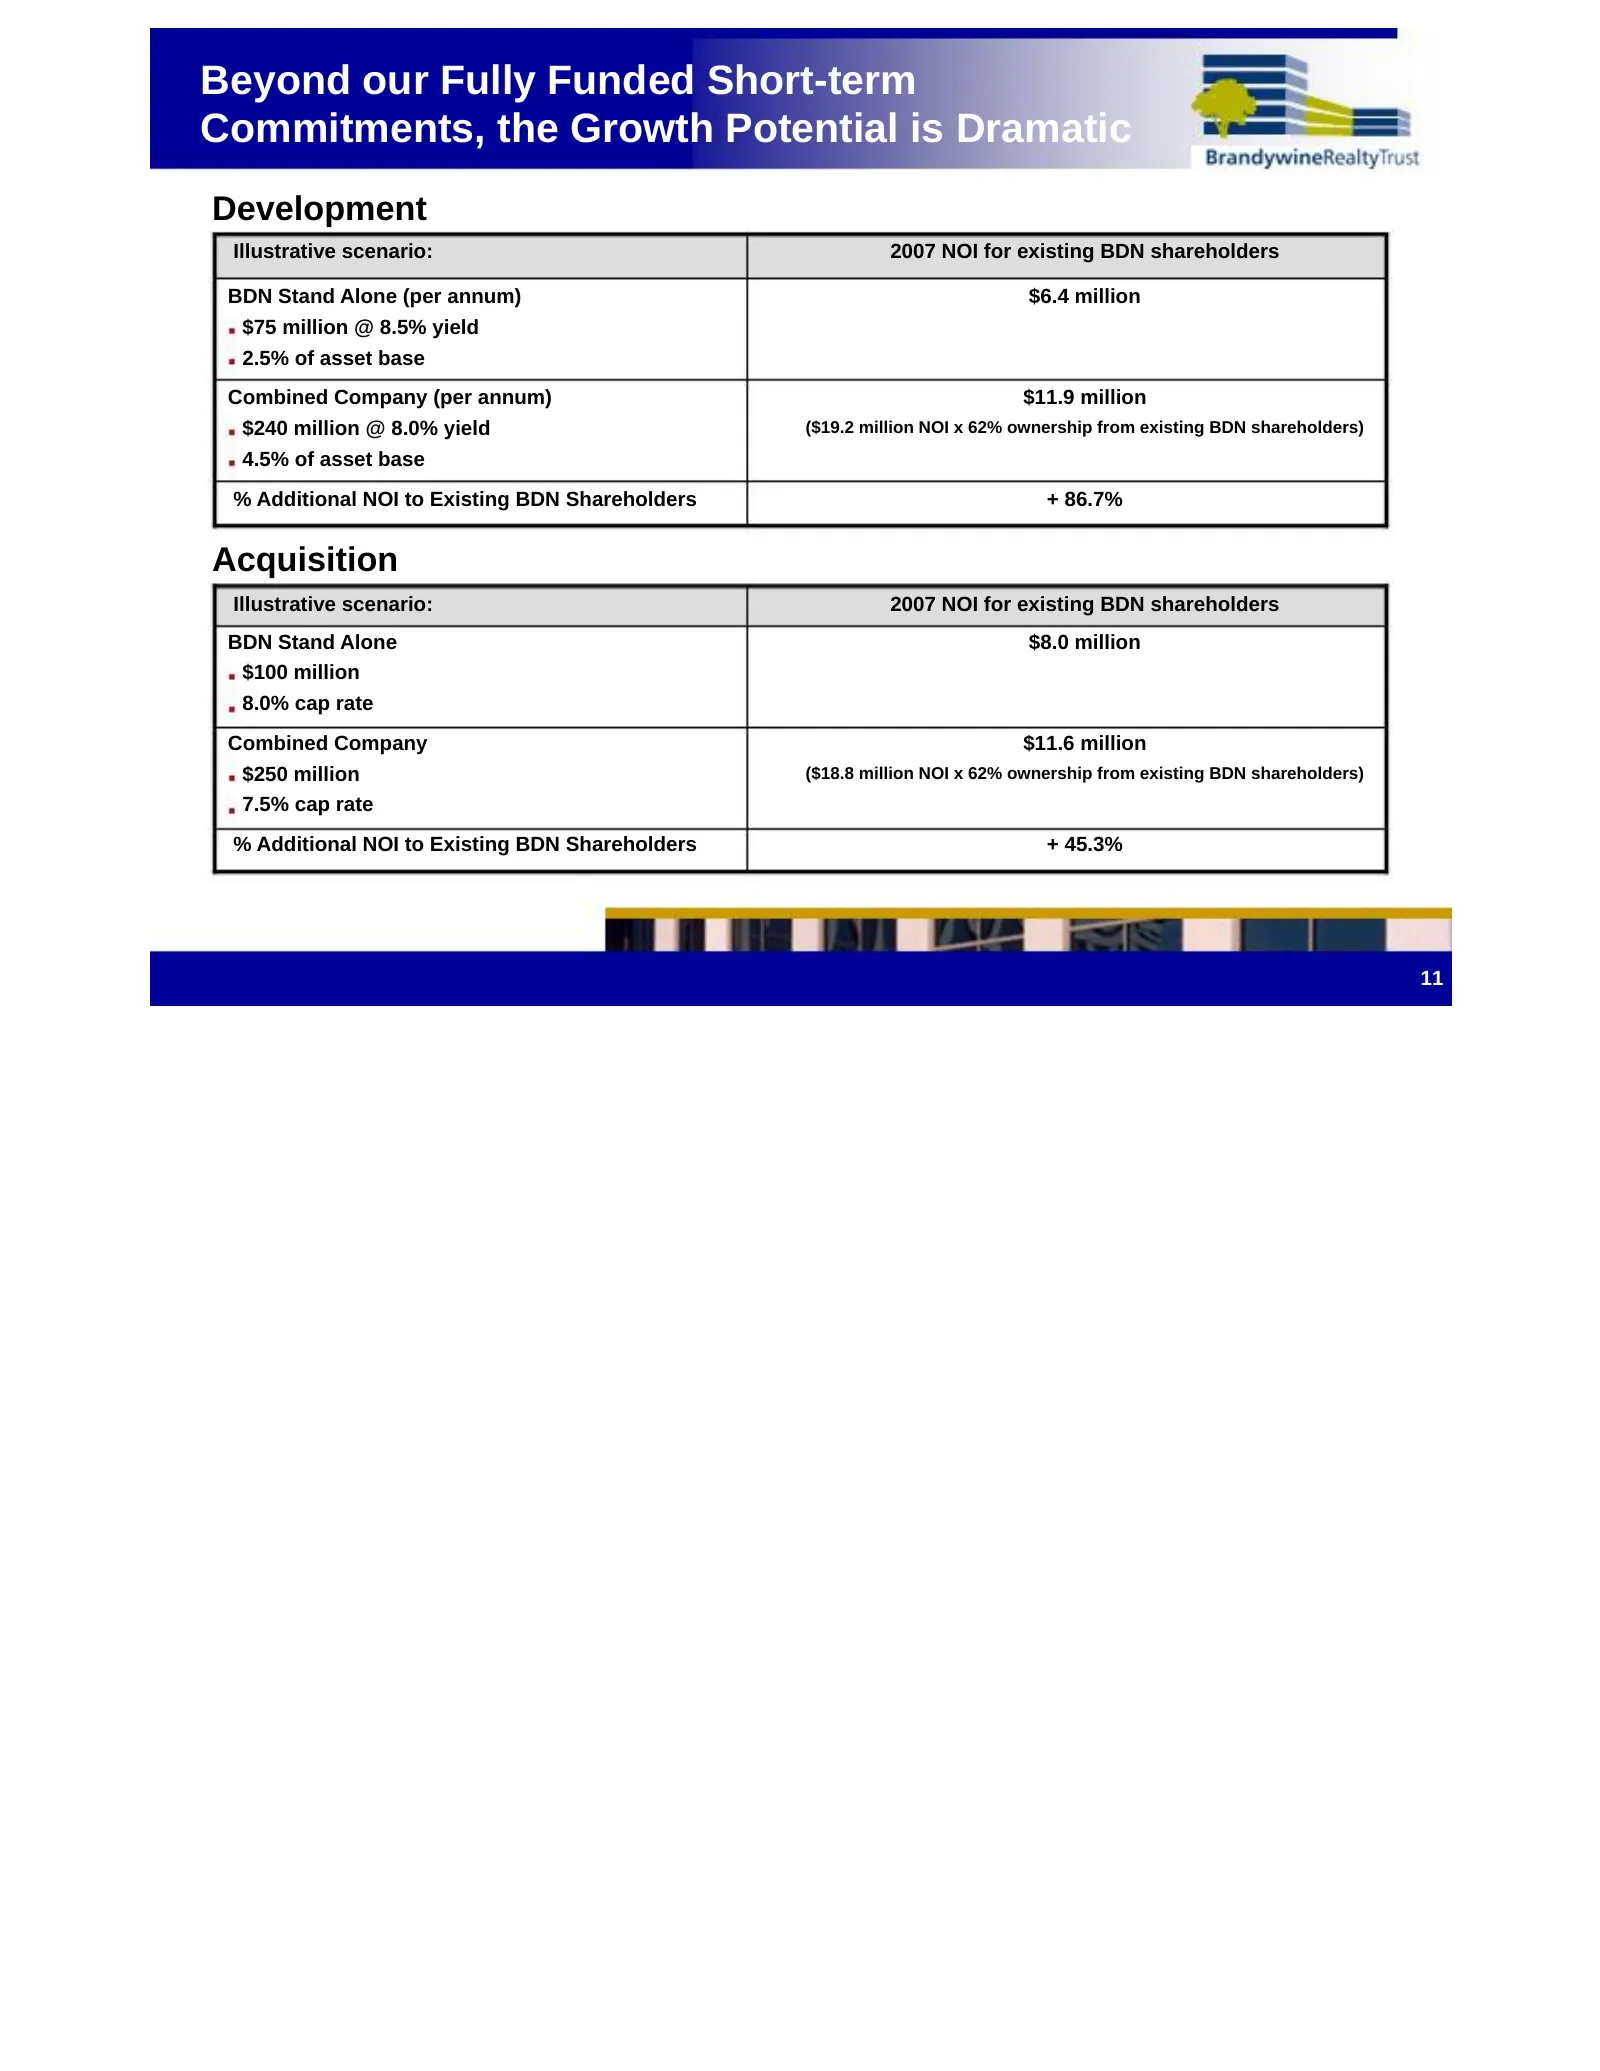
Beyond our Fully Funded Short-term Commitments, the Growth Potential is Dramatic Development Illustrative scenario: 2007 NOI for existing BDN shareholders BDN Stand Alone (per annum) $6.4 million $75 million @ 8.5% yield 2.5% of asset base Combined Company (per annum) $11.9 million $240 million @ 8.
Slide 15: Development will have a more significant impact on Brandywine going forward
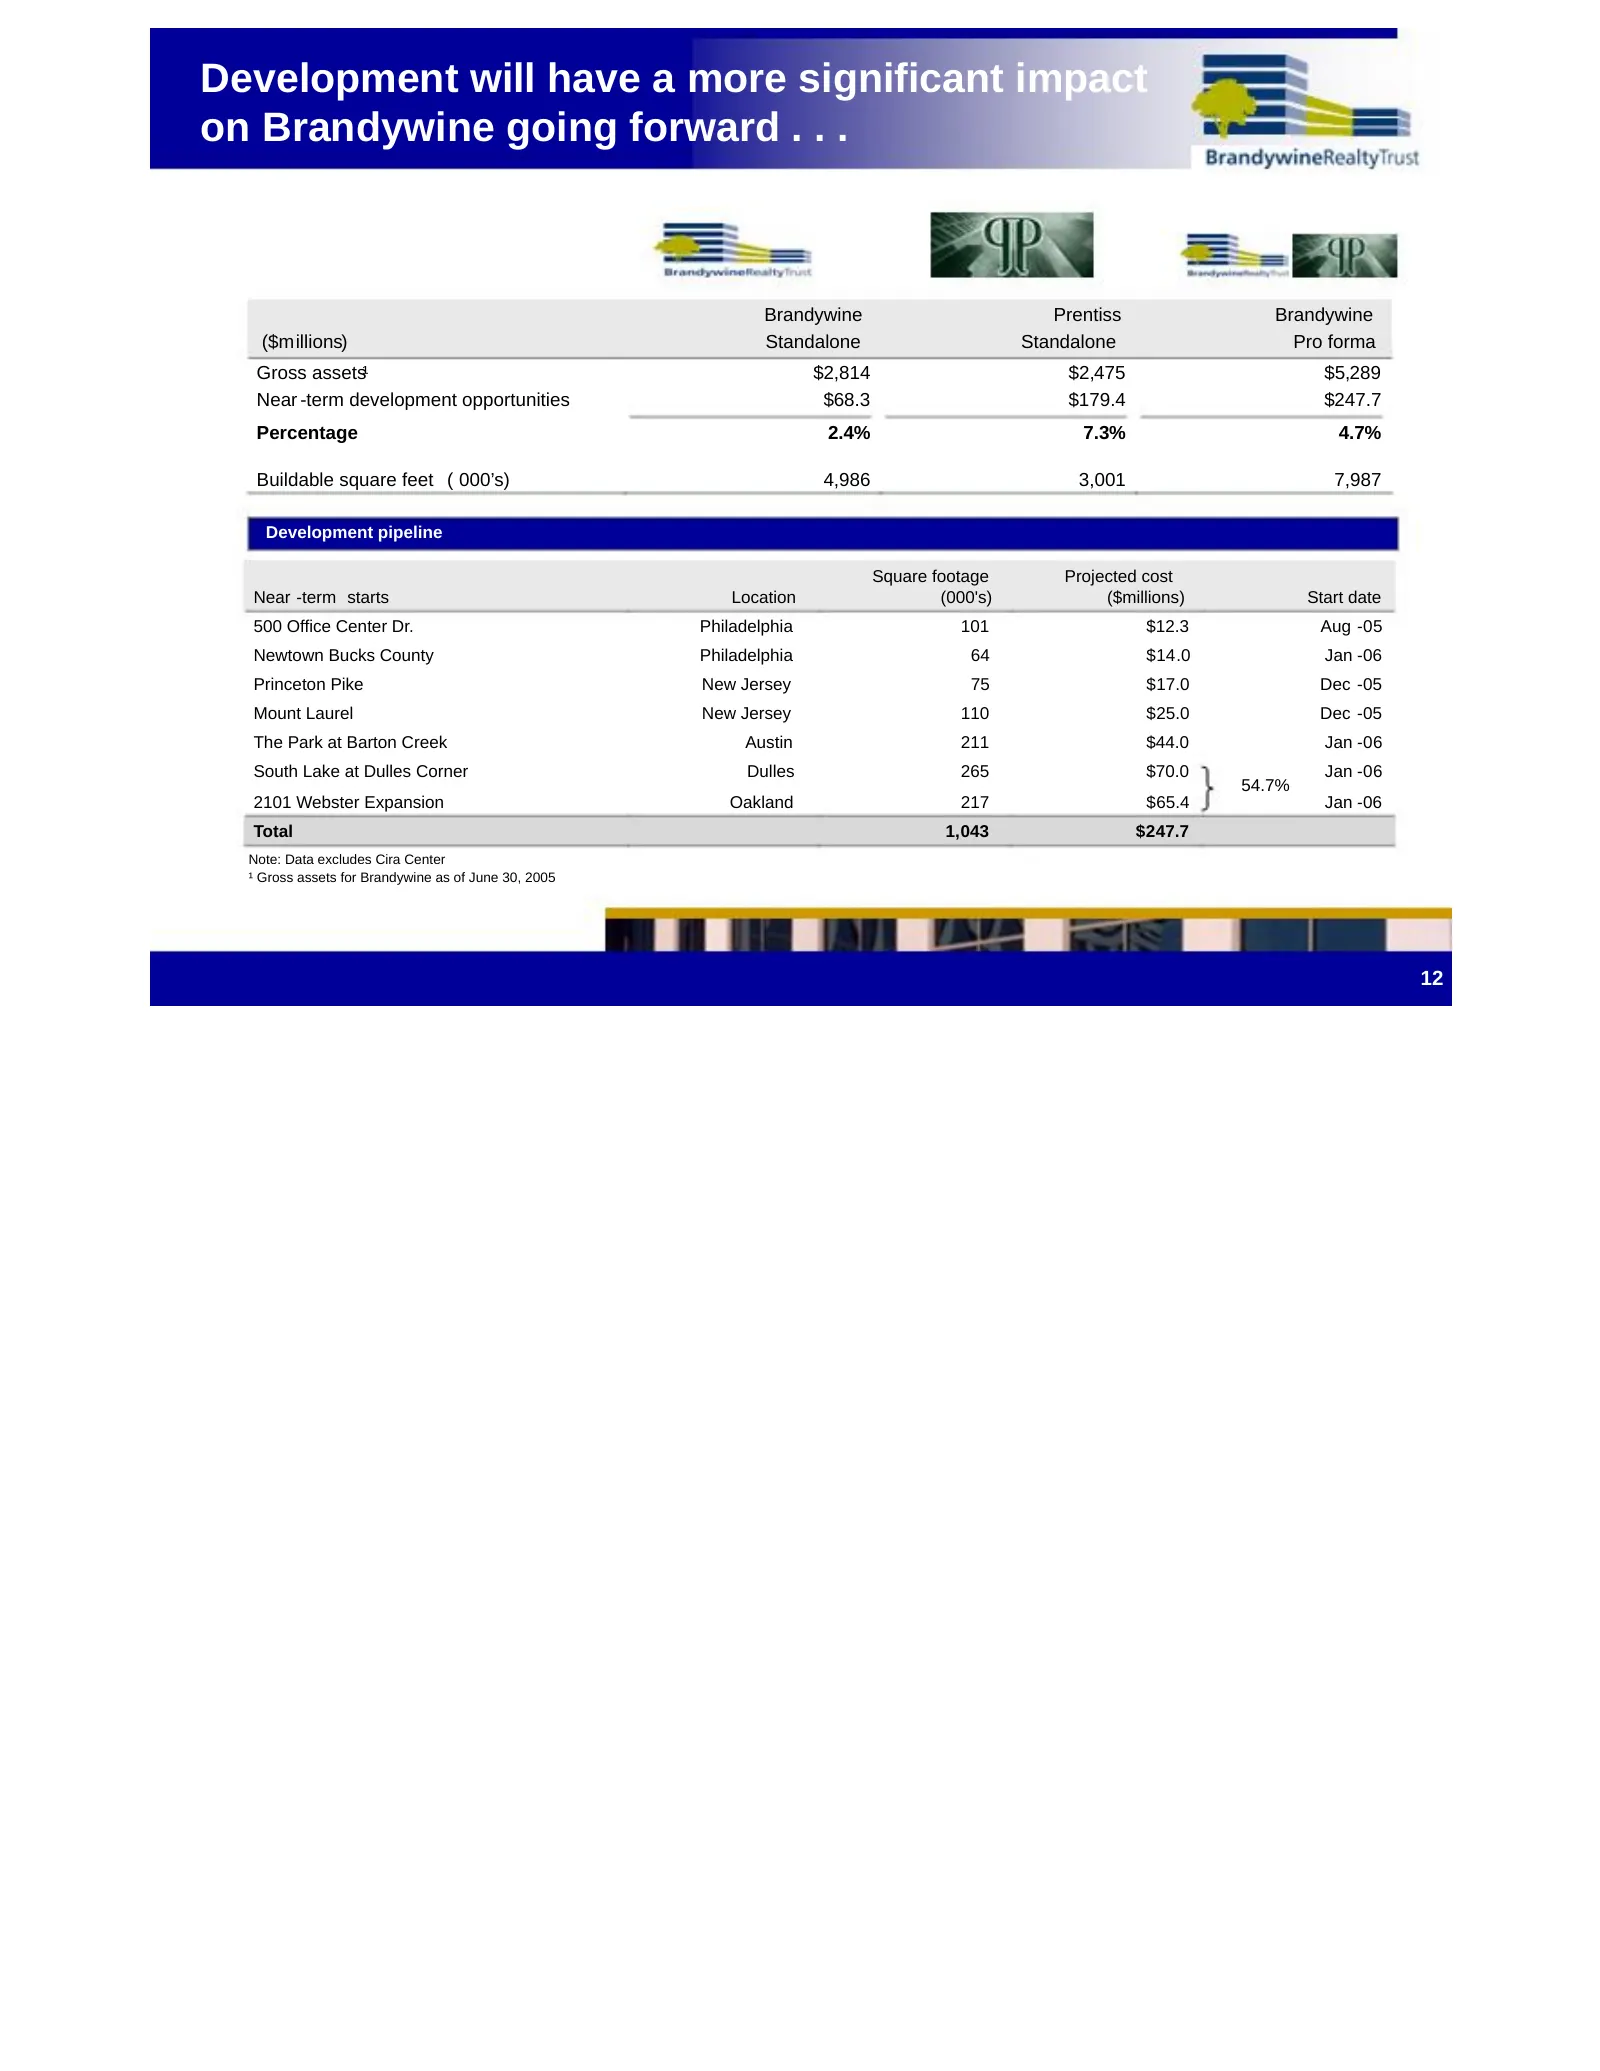
Development will have a more significant impact on Brandywine going forward . . . Brandywine Prentiss Brandywine ($m illions) Standalone Standalone Pro forma Gross assets¹ $2,814 $2,475 $5,289 Near -term development opportunities $68.3 $179.4 $247.7 Percentage 2.4% 7.3% 4.7% Buildable square feet (
Slide 16: Land held for development weighted toward Metro Washington and Oakland
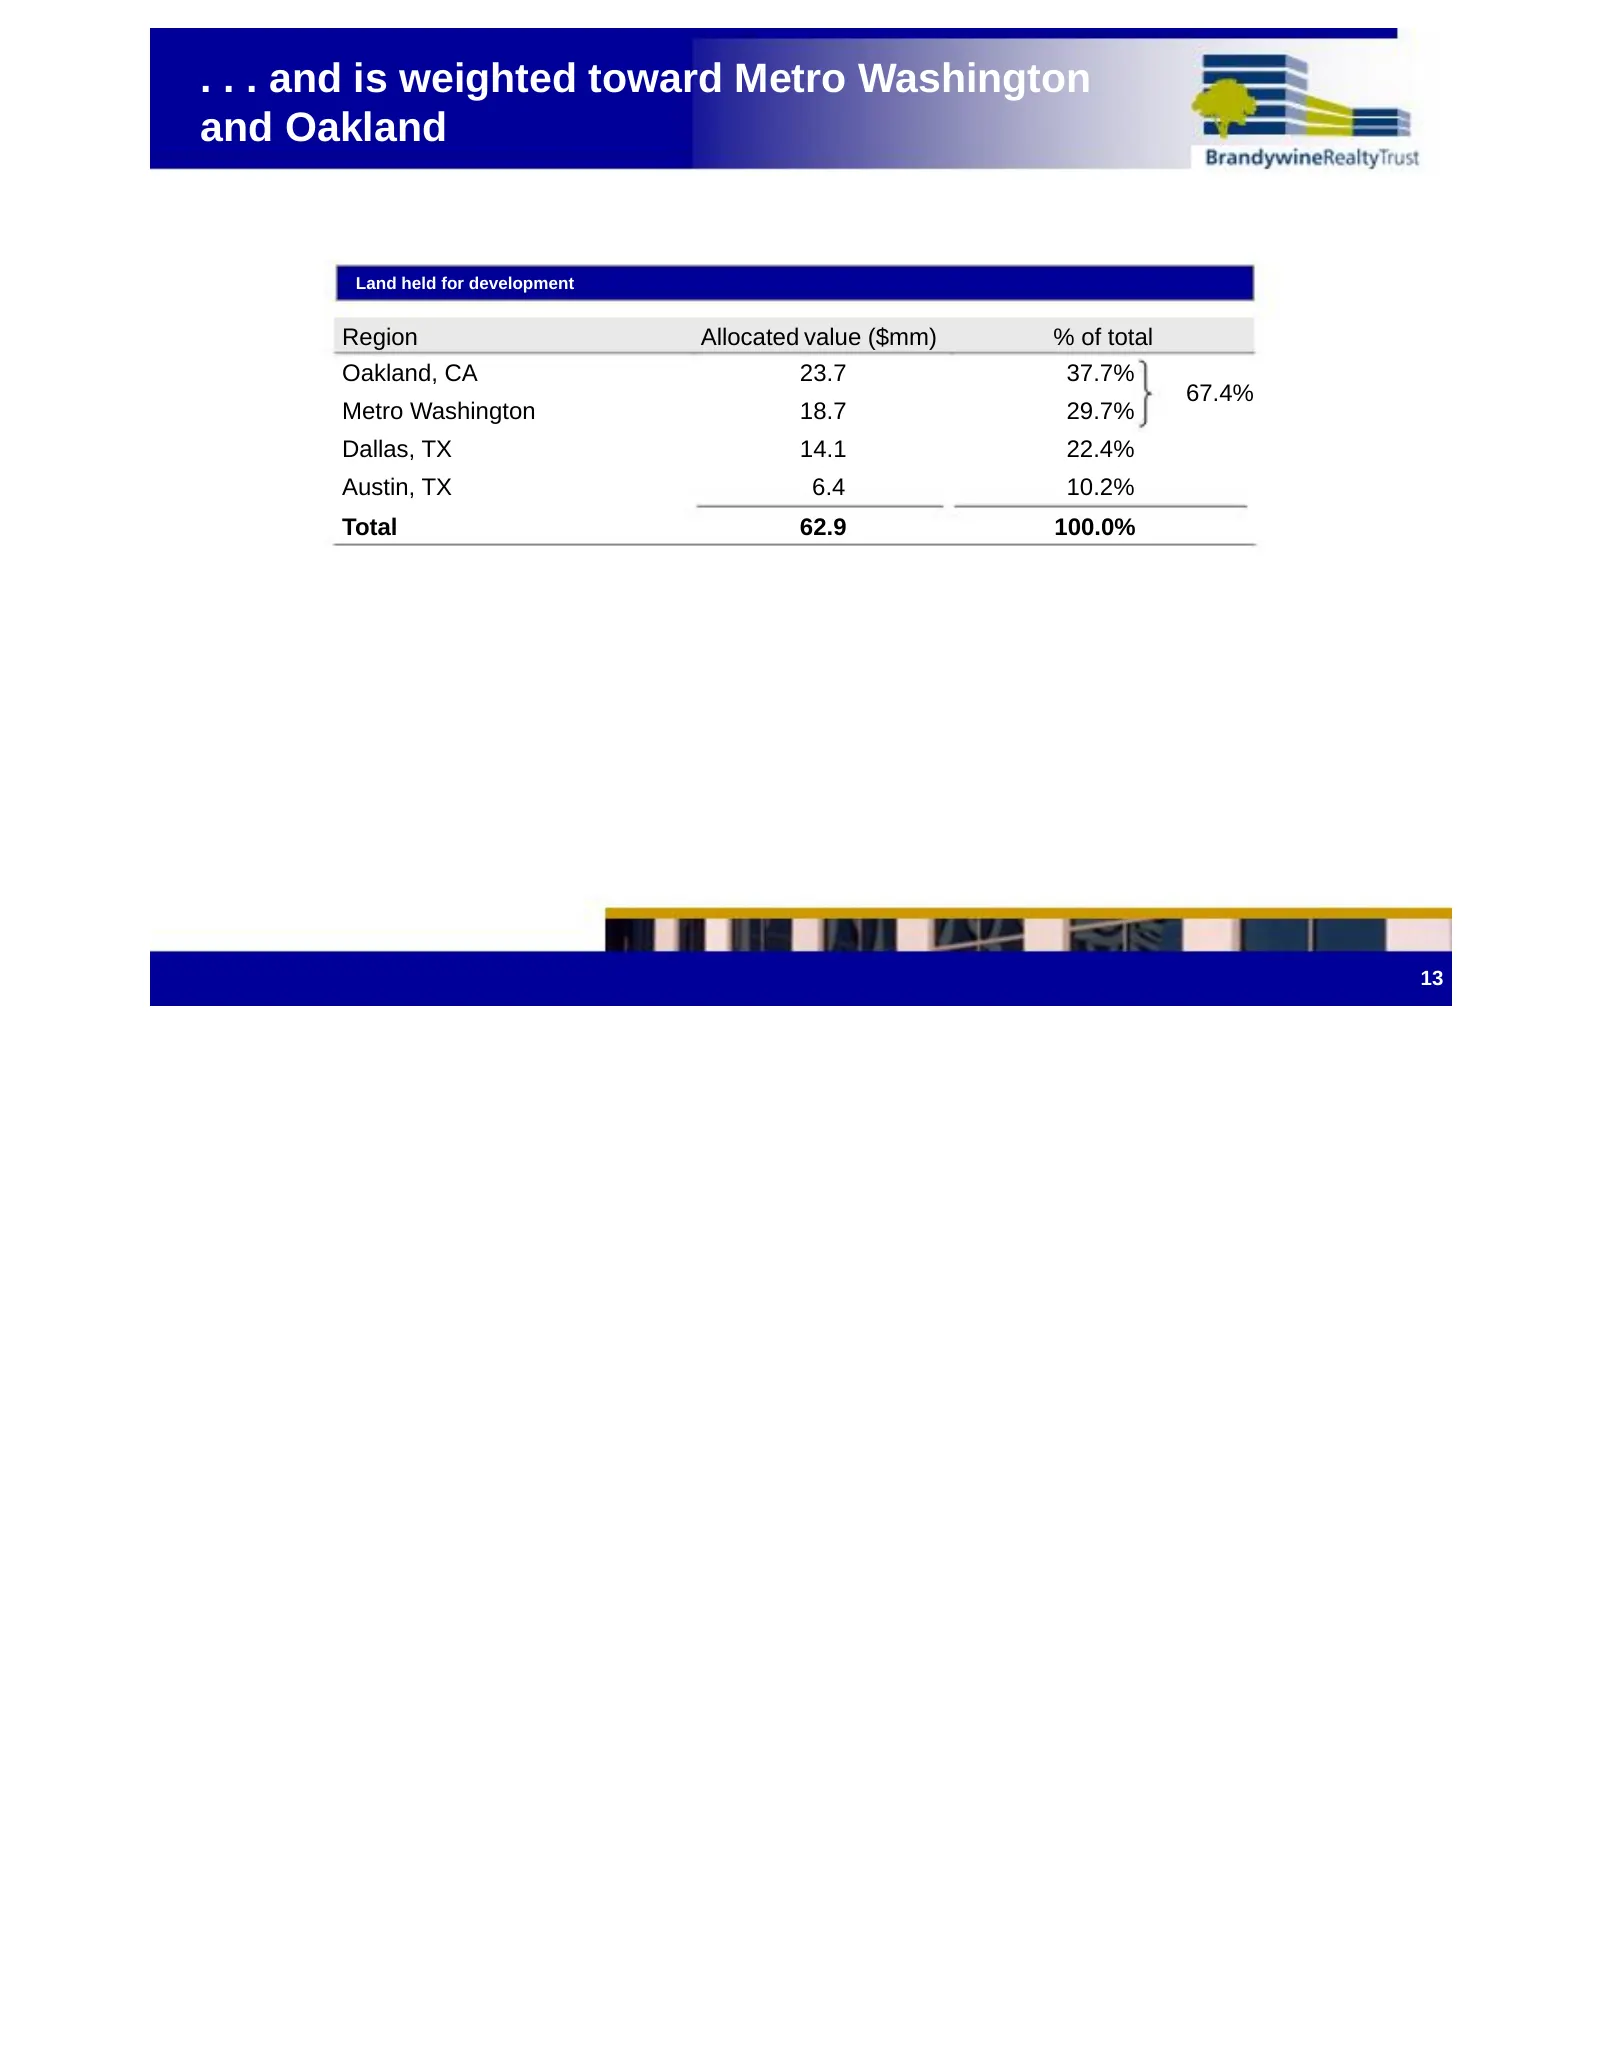
. . . and is weighted toward Metro Washington and Oakland Land held for development Region Allocated value ($mm) % of total Oakland, CA 23.7 37.7% 67.4% Metro Washington 18.7 29.7% Dallas, TX 14.1 22.4% Austin, TX 6.4 10.2% Total 62.9 100.0% 13
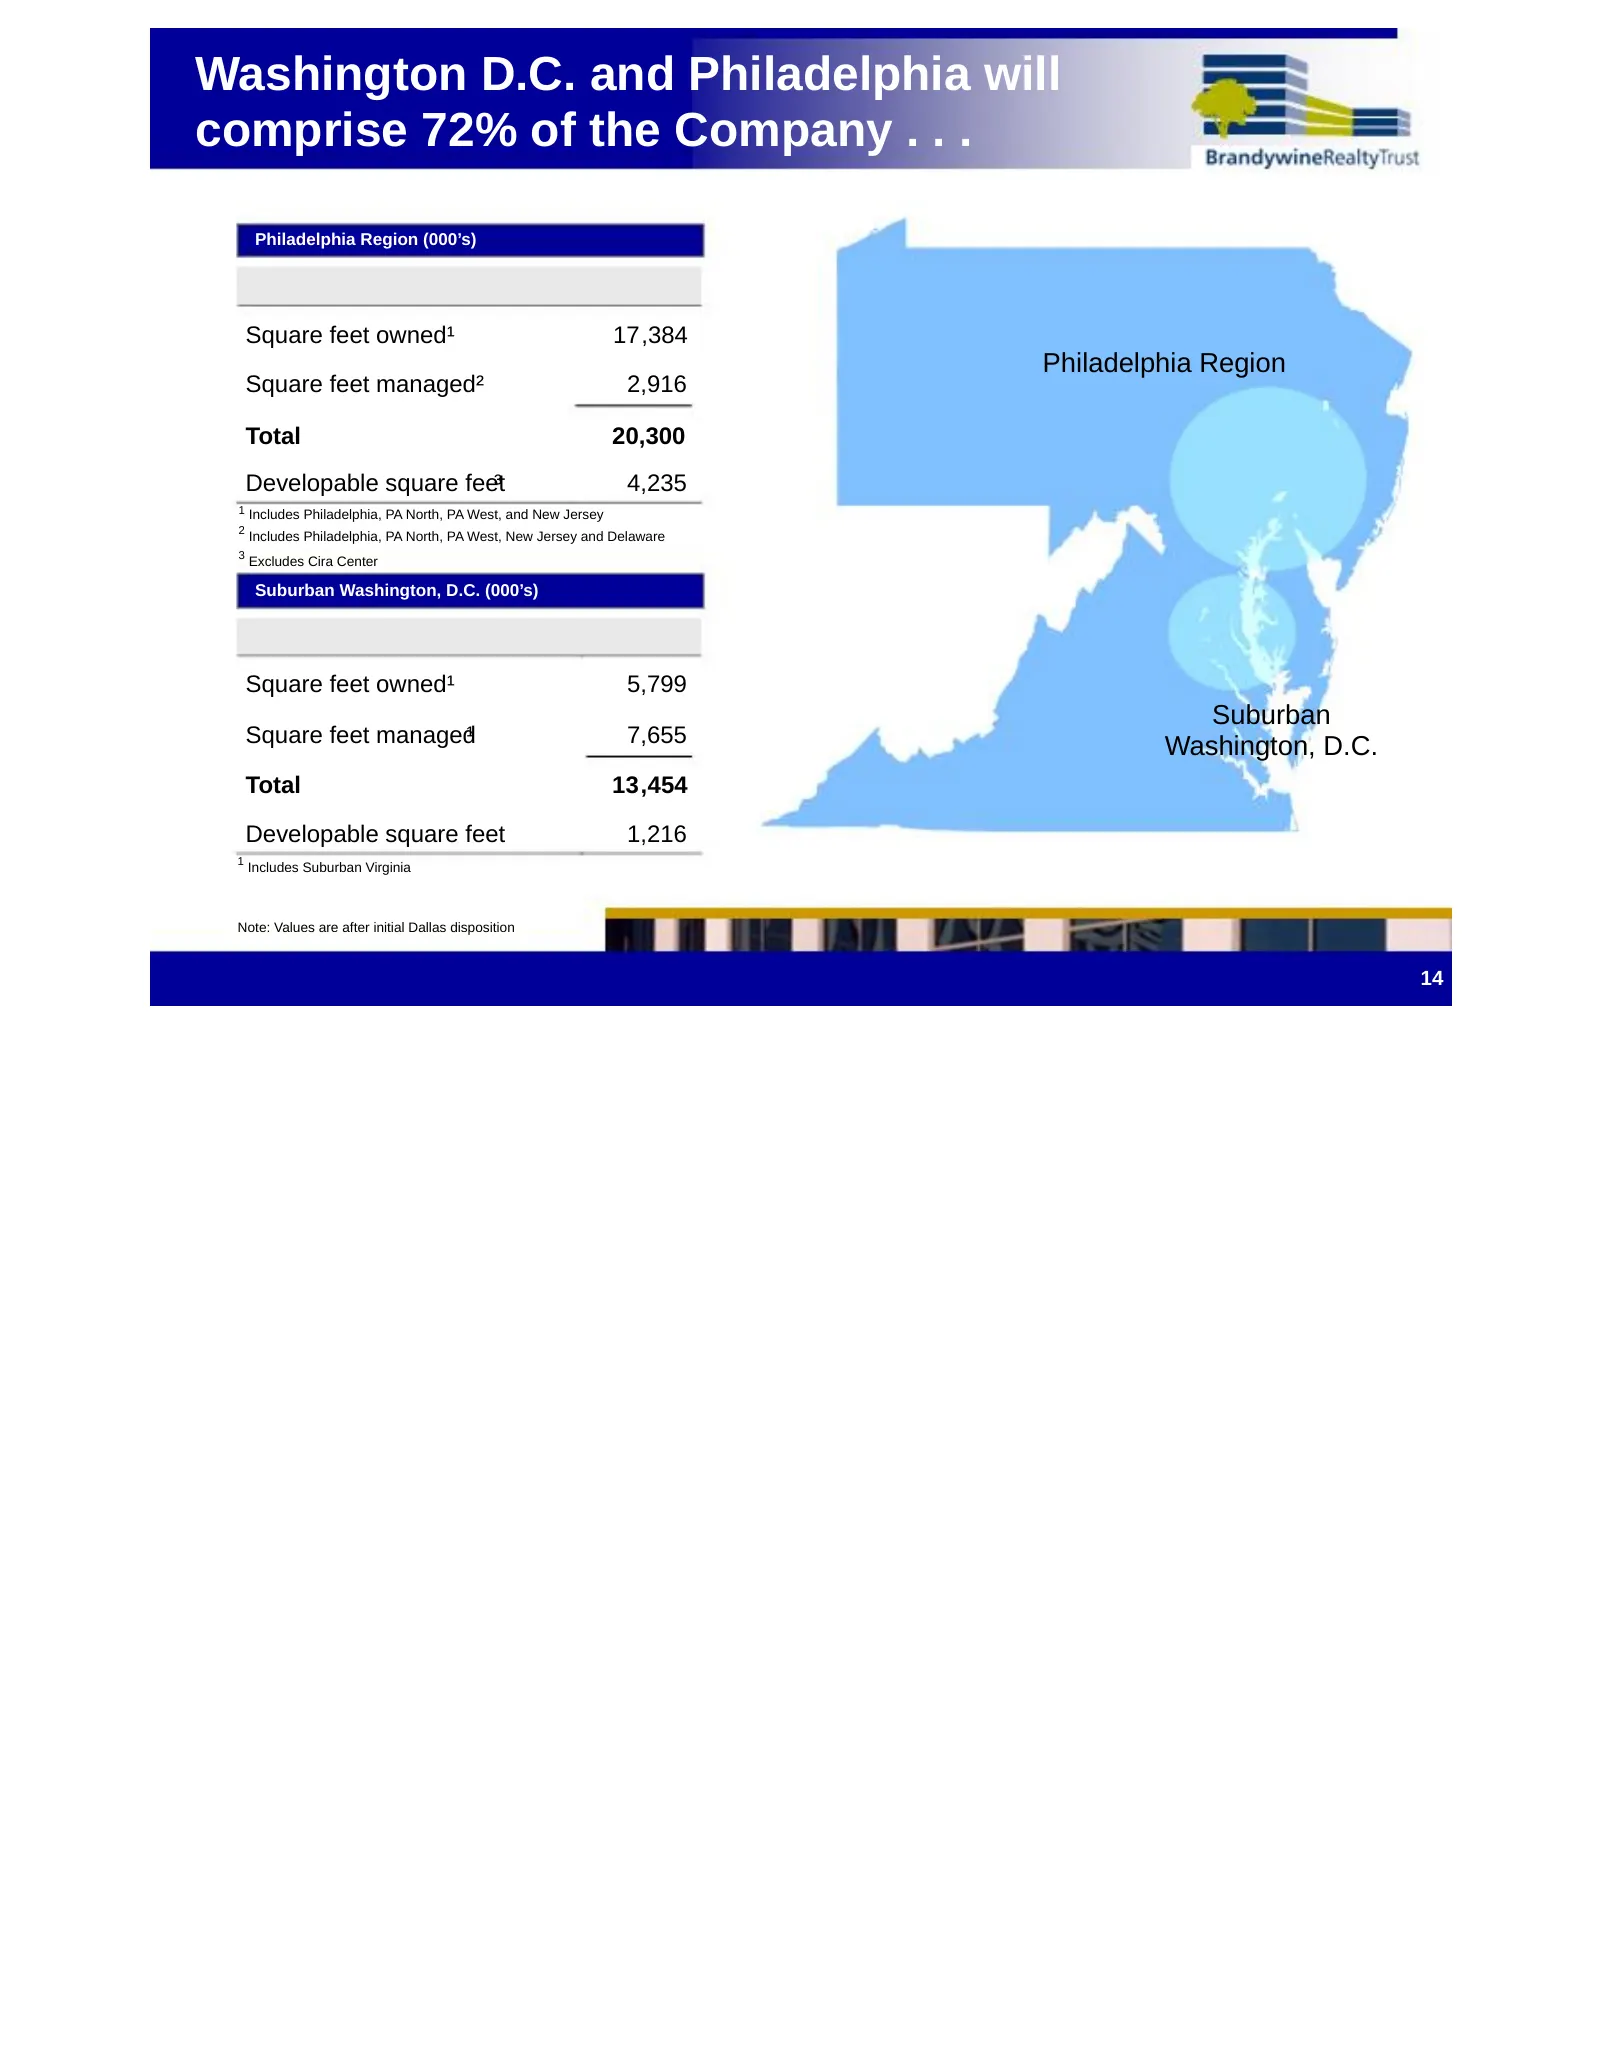
Slide 17: Washington D.C. and Philadelphia will comprise 72% of the Company
Washington D.C. and Philadelphia will comprise 72% of the Company . . . Philadelphia Region (000’s) Square feet owned¹ 17 ,384 Philadelphia Region Square feet managed² 2,916 Total 20,300 Developable square feet³ 4,235 1 Includes Philadelphia, PA North, PA West, and New Jersey 2 Includes Philadelphia
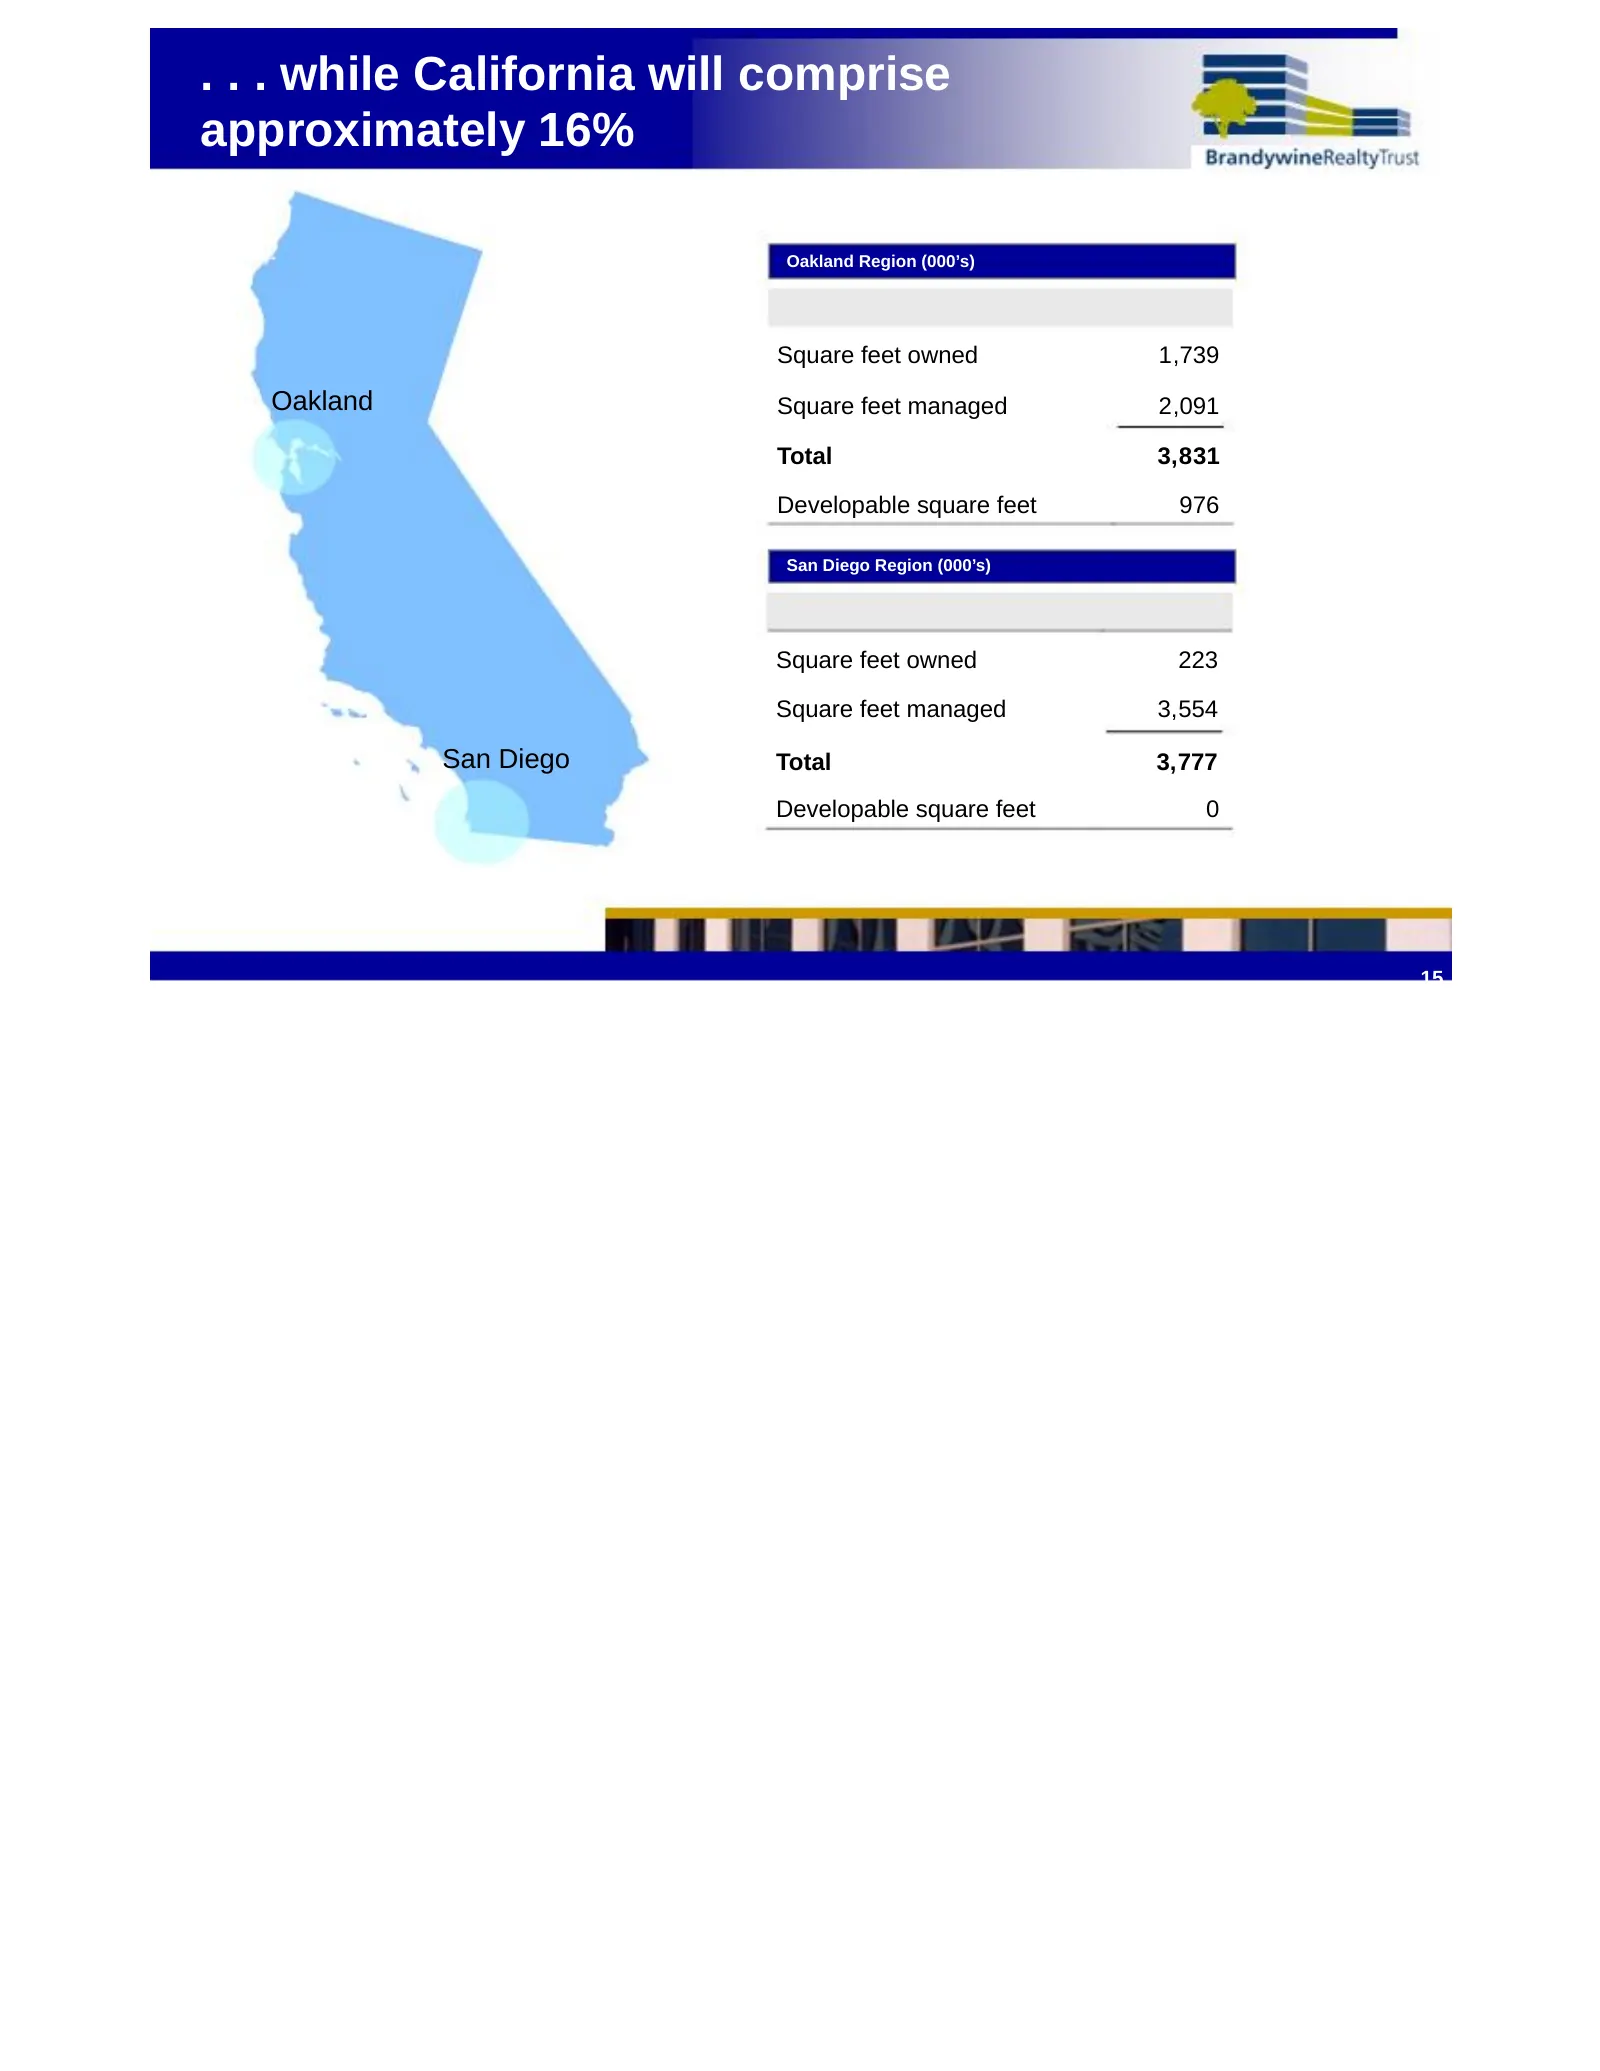
Slide 18: California will comprise approximately 16%
. . . while California will comprise approximately 16% Oakland Region (000’s) Square feet owned 1 ,739 Oakland Square feet managed 2 ,091 Total 3, 8 31 Developable square feet 976 San Diego Region (000’s) Square feet owned 223 Square feet managed 3,554 San Diego Total 3,777 Developable square feet 0
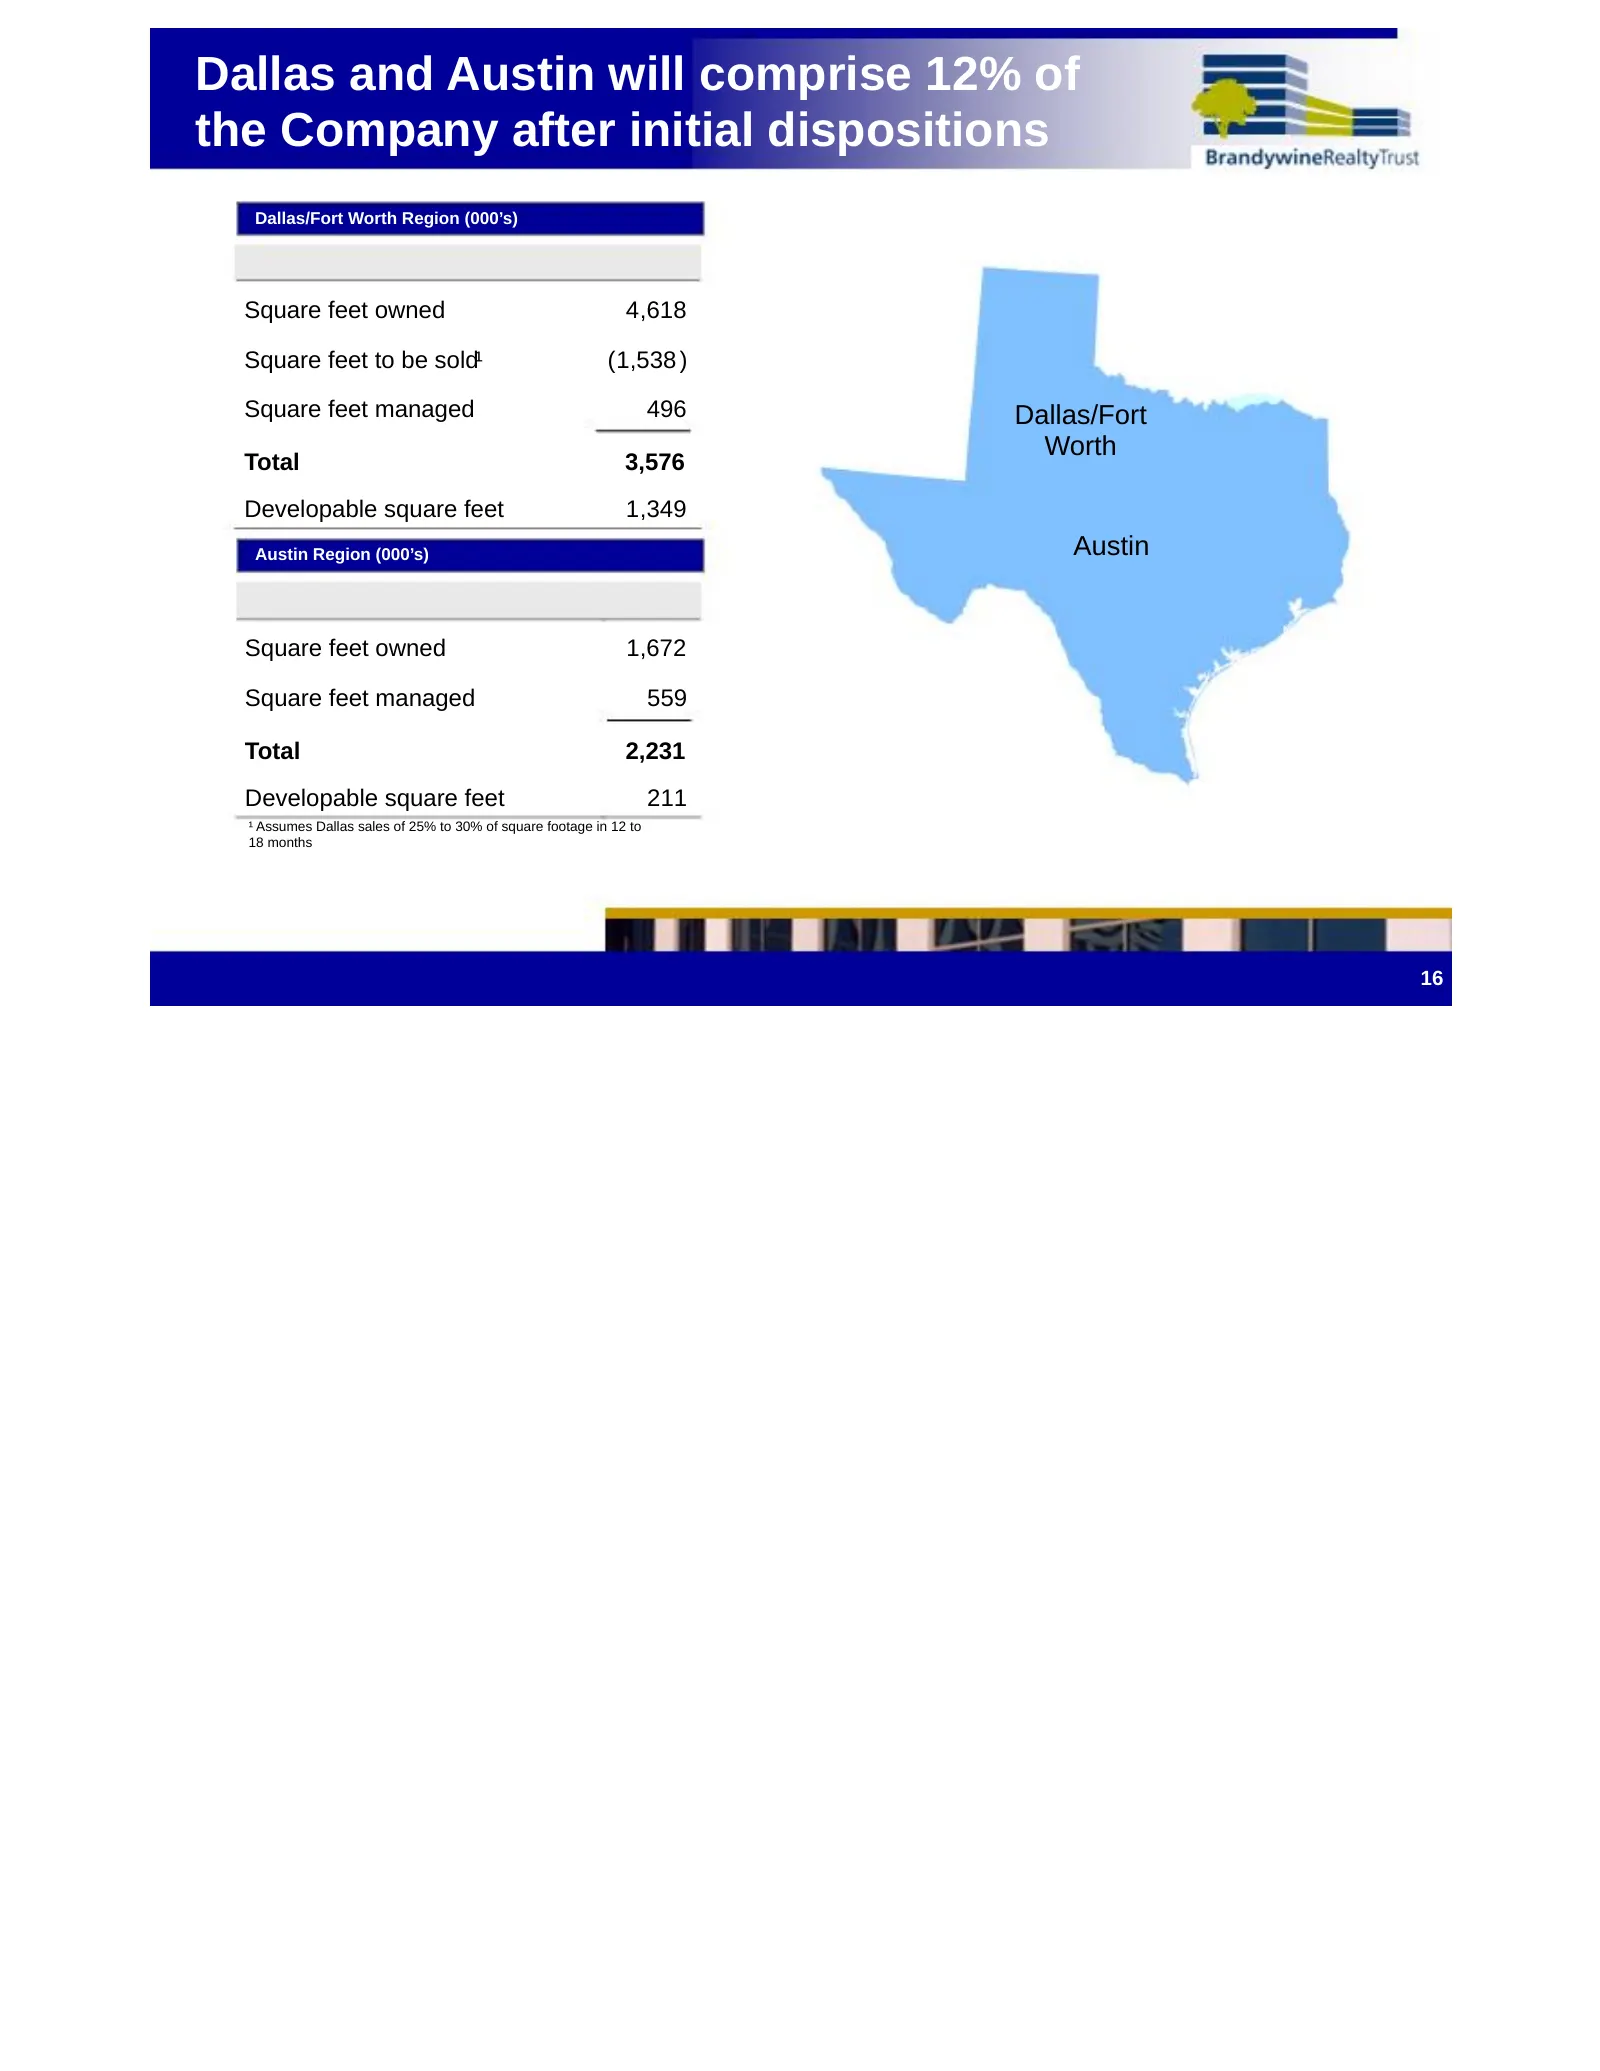
Slide 19: Dallas and Austin will comprise 12% of the Company after initial dispositions
Dallas and Austin will comprise 12% of the Company after initial dispositions Dallas/Fort Worth Region (000’s) Square feet owned 4,618 Square feet to be sold¹ ( 1,538 ) Square feet managed 496 Dallas/Fort Worth Total 3,576 Developable square feet 1,349 Austin Region (000’s) Austin Square feet owned
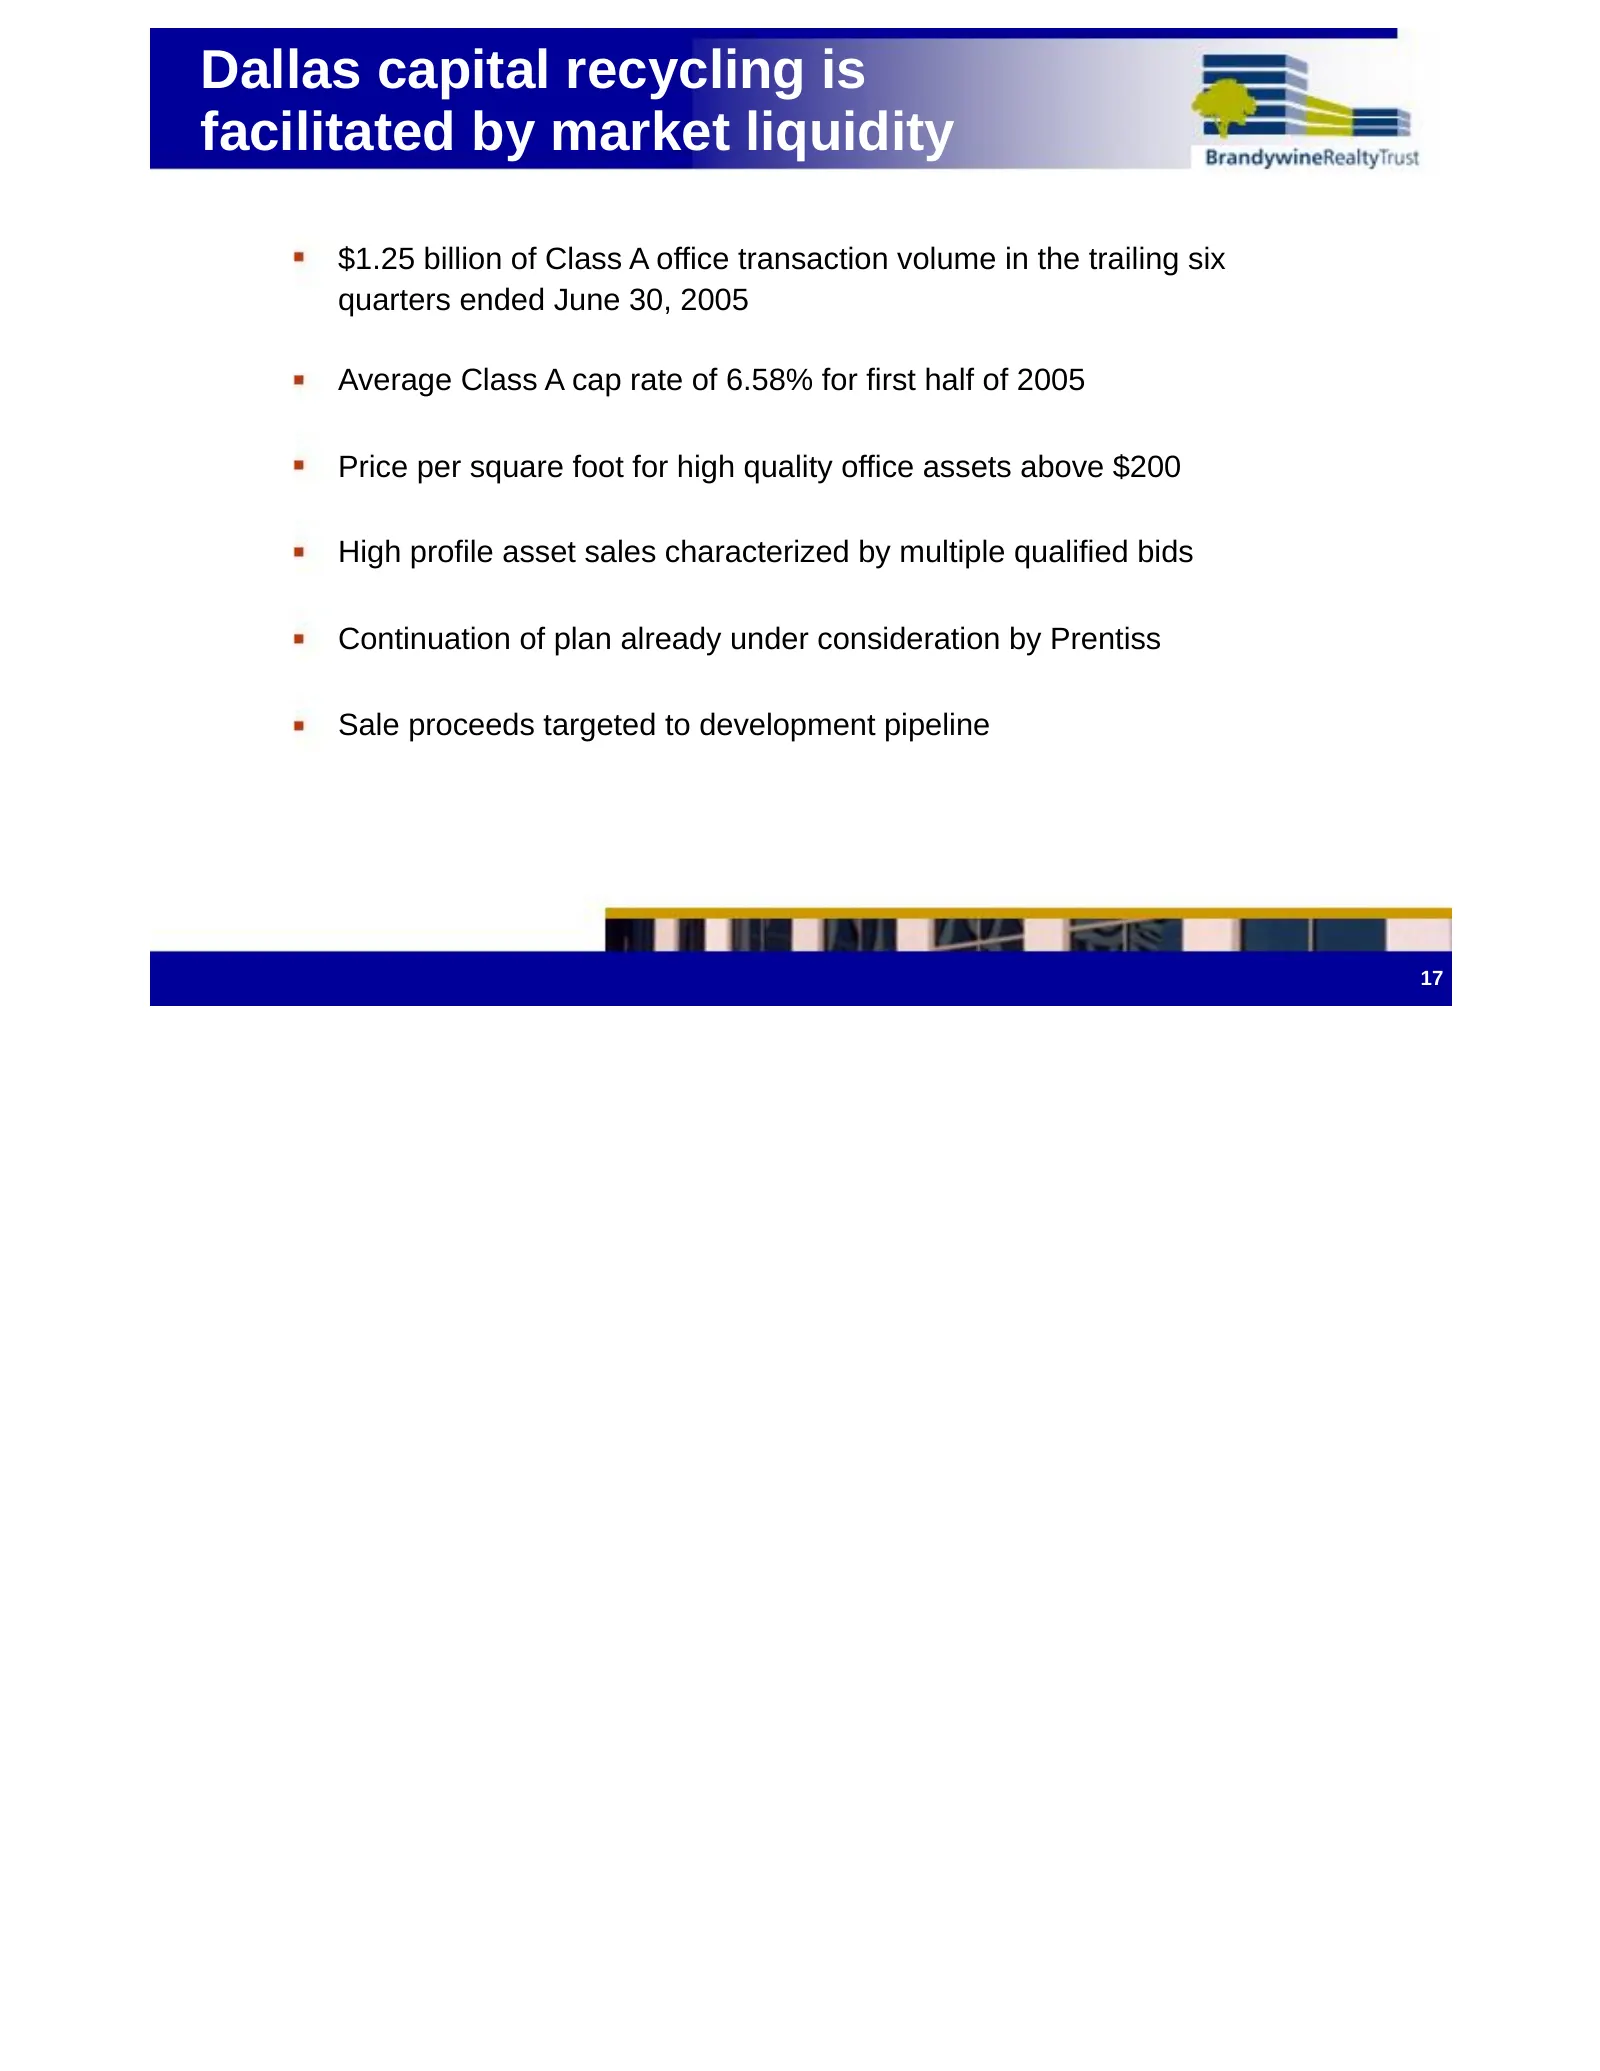
Slide 20: Dallas capital recycling is facilitated by market liquidity
Dallas capital recycling is facilitated by market liquidity $1.25 billion of Class A office transaction volume in the trailing six quarters ended June 30, 2005 Average Class A cap rate of 6.58% for first half of 2005 Price per square foot for high quality office assets above $200 High profile asset
Slide 21: Credit ratings affirmed
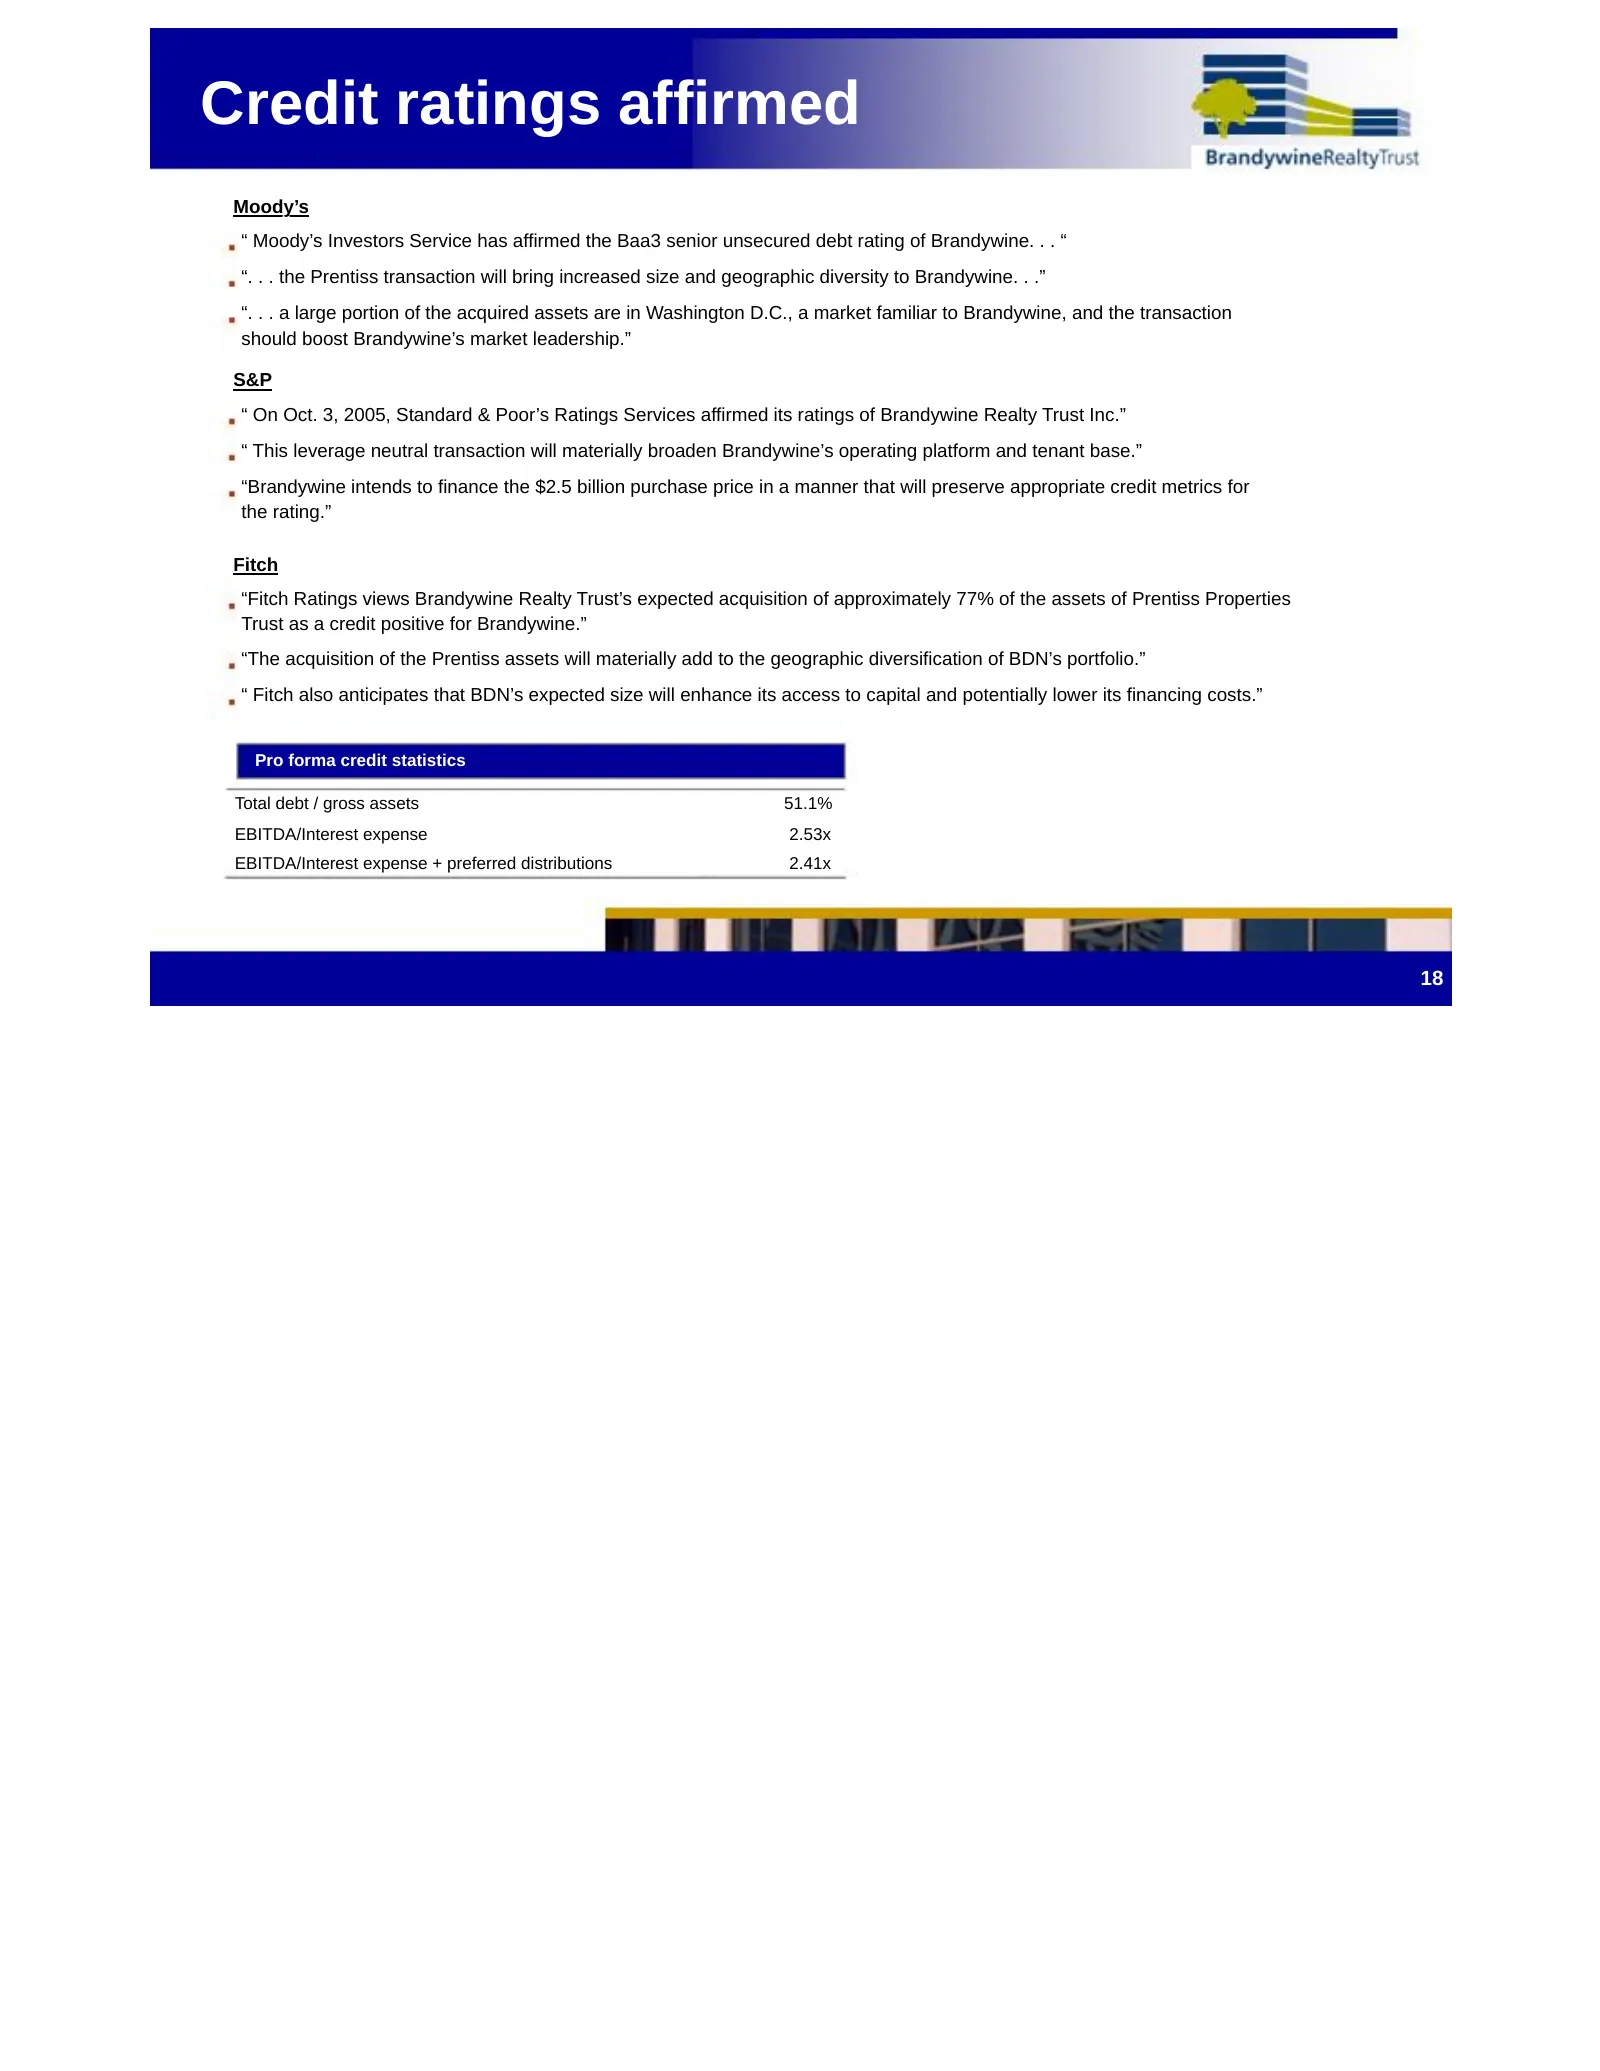
Credit ratings affirmed Moody’s “ Moody’s Investors Service has affirmed the Baa3 senior unsecured debt rating of Brandywine. . . “ “. . . the Prentiss transaction will bring increased size and geographic diversity to Brandywine. . .” “. . . a large portion of the acquired assets are in Washington D
Slide 22: Mitigating integration risk – effective capital deployment
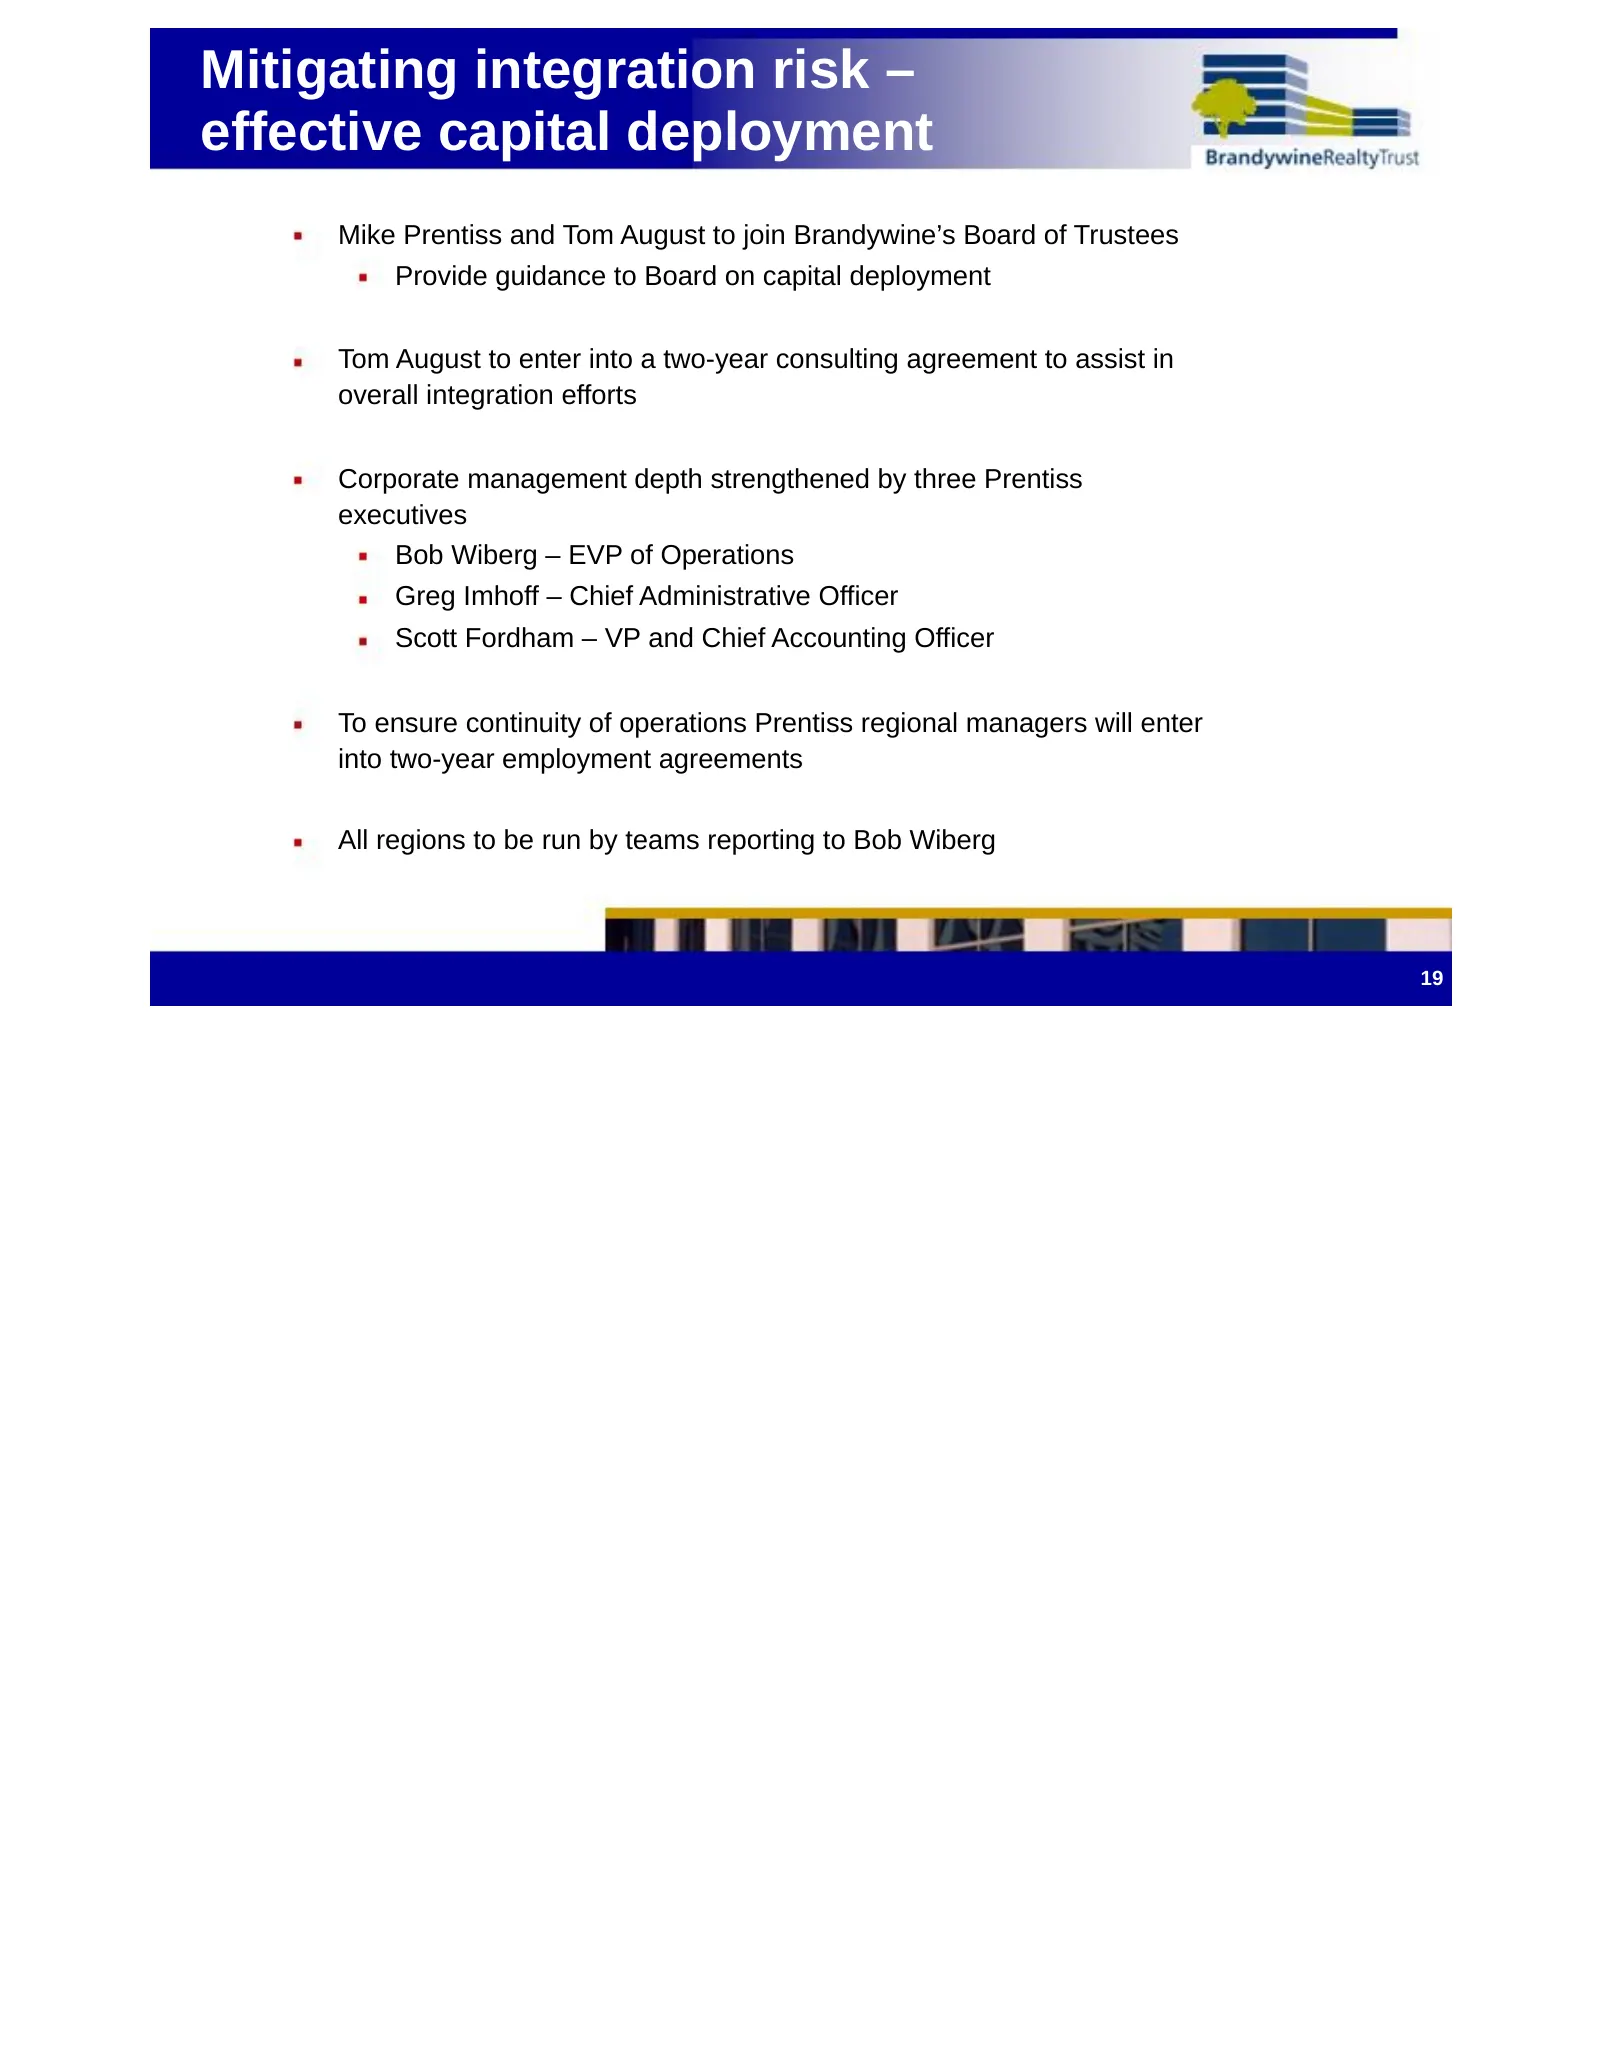
Mitigating integration risk – effective capital deployment Mike Prentiss and Tom August to join Brandywine’s Board of Trustees Provide guidance to Board on capital deployment Tom August to enter into a two-year consulting agreement to assist in overall integration efforts Corporate management depth
Slide 23: Takeaways
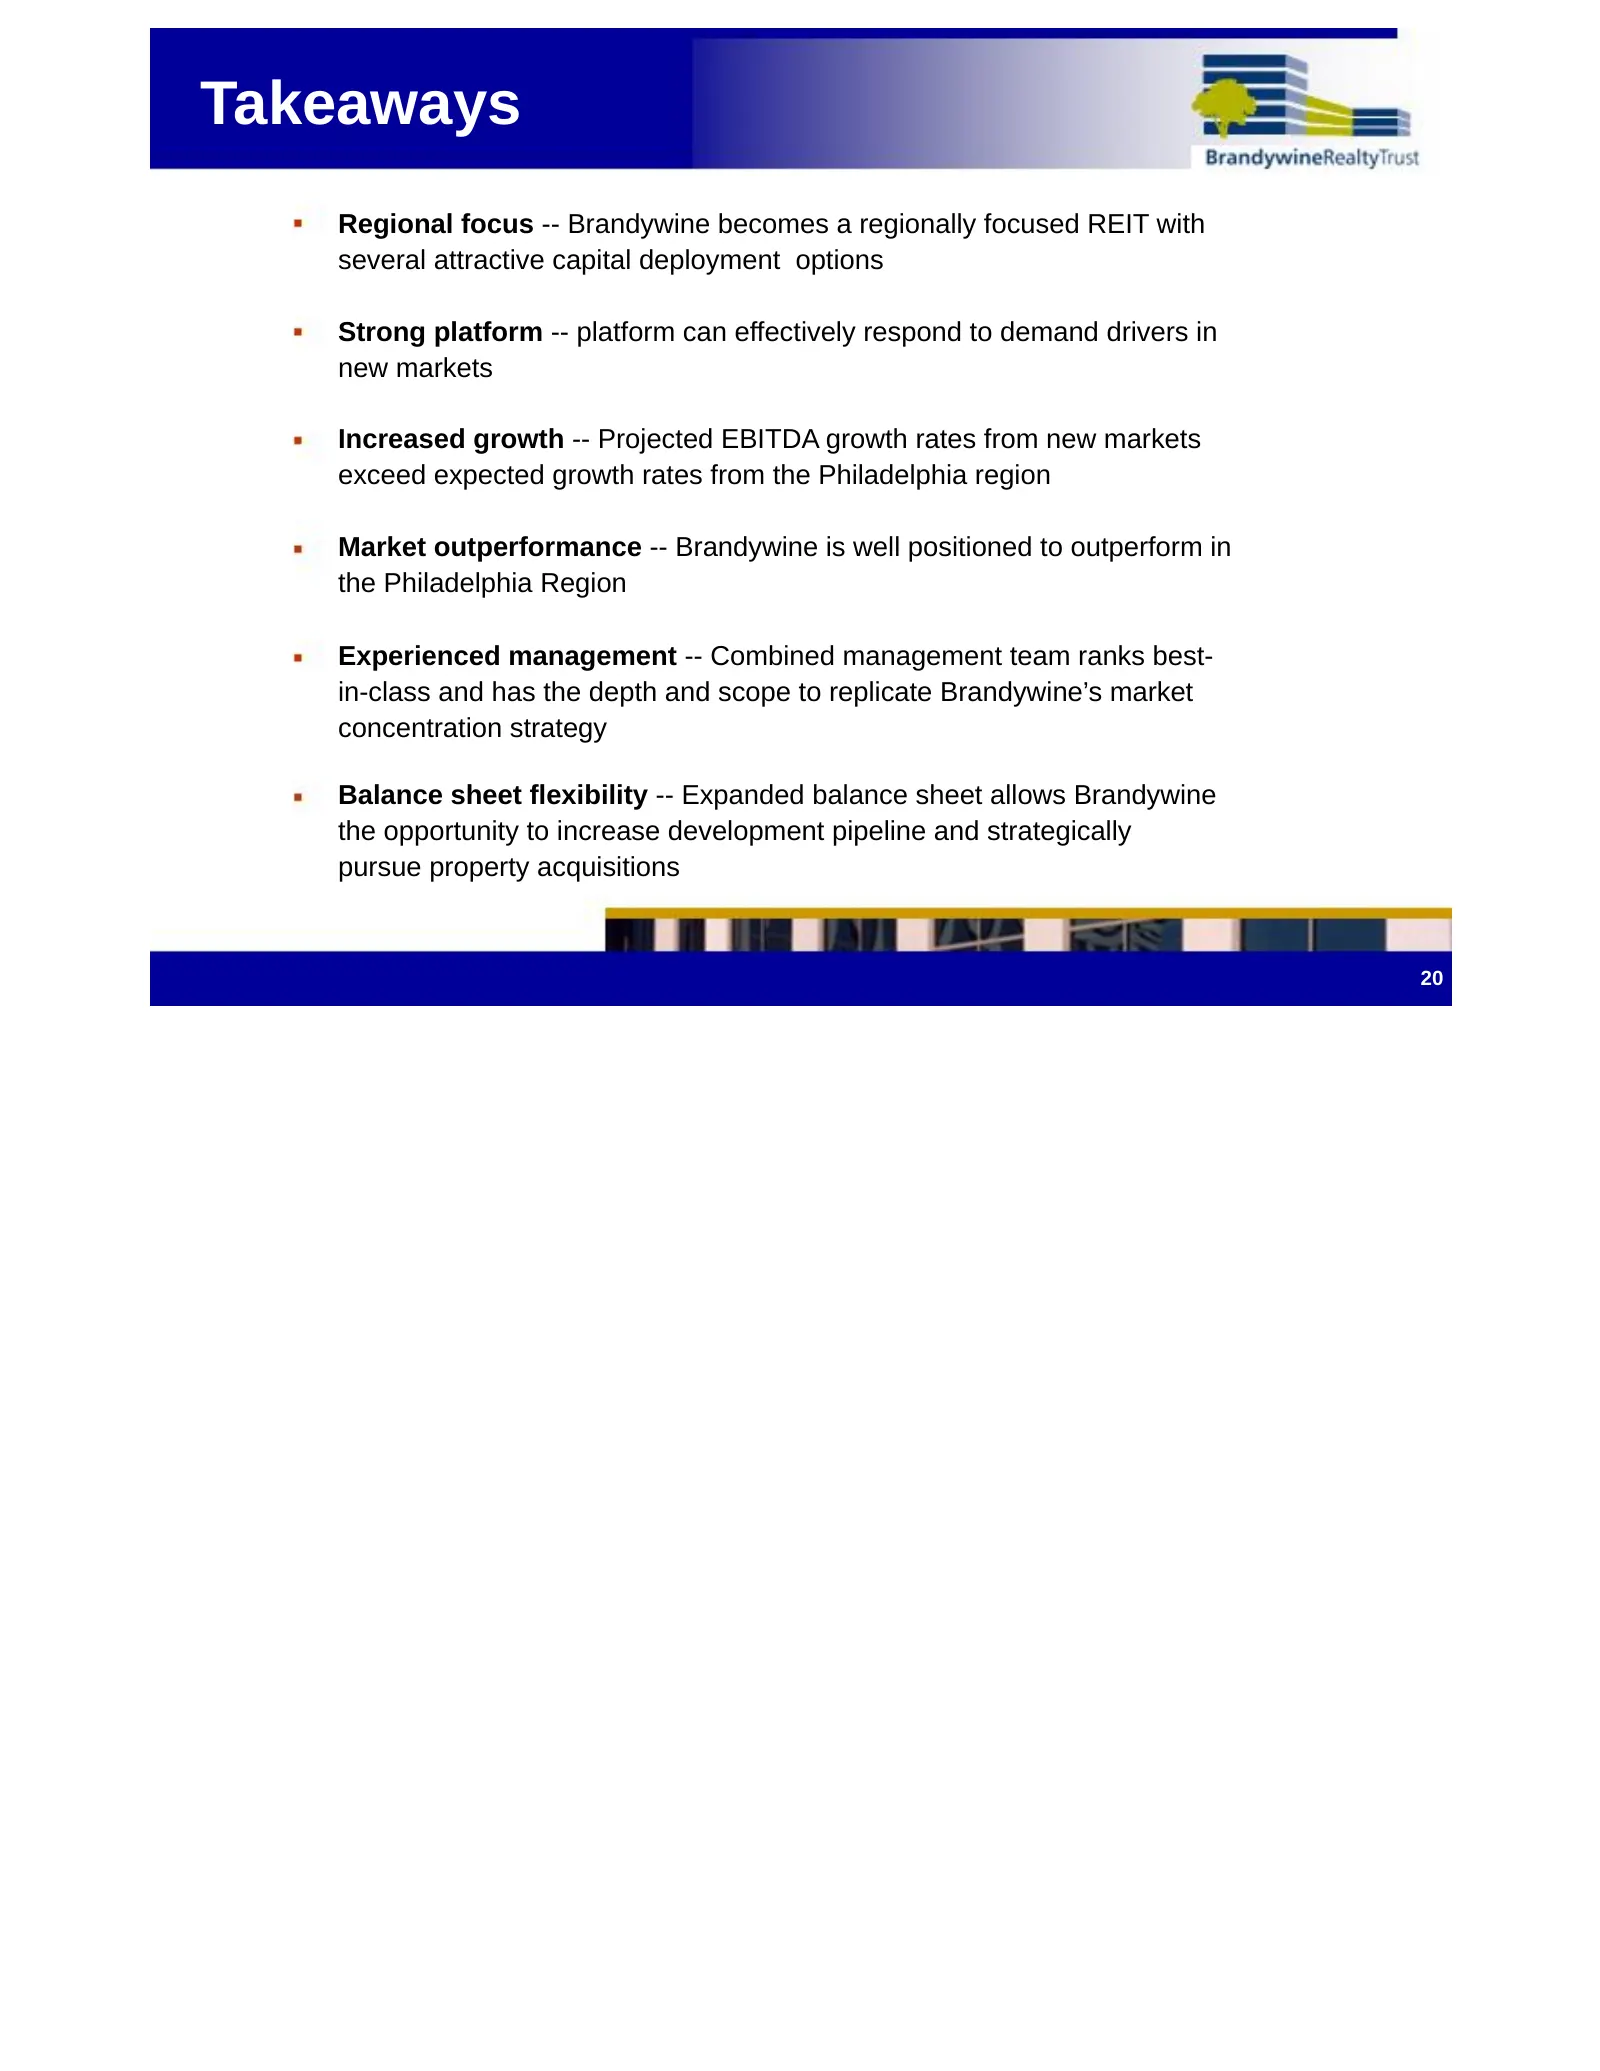
Takeaways Regional focus -- Brandywine becomes a regionally focused REIT with several attractive capital deployment options Strong platform -- platform can effectively respond to demand drivers in new markets Increased growth -- Projected EBITDA growth rates from new markets exceed expected growth r
Slide 24: Forward Looking Statements
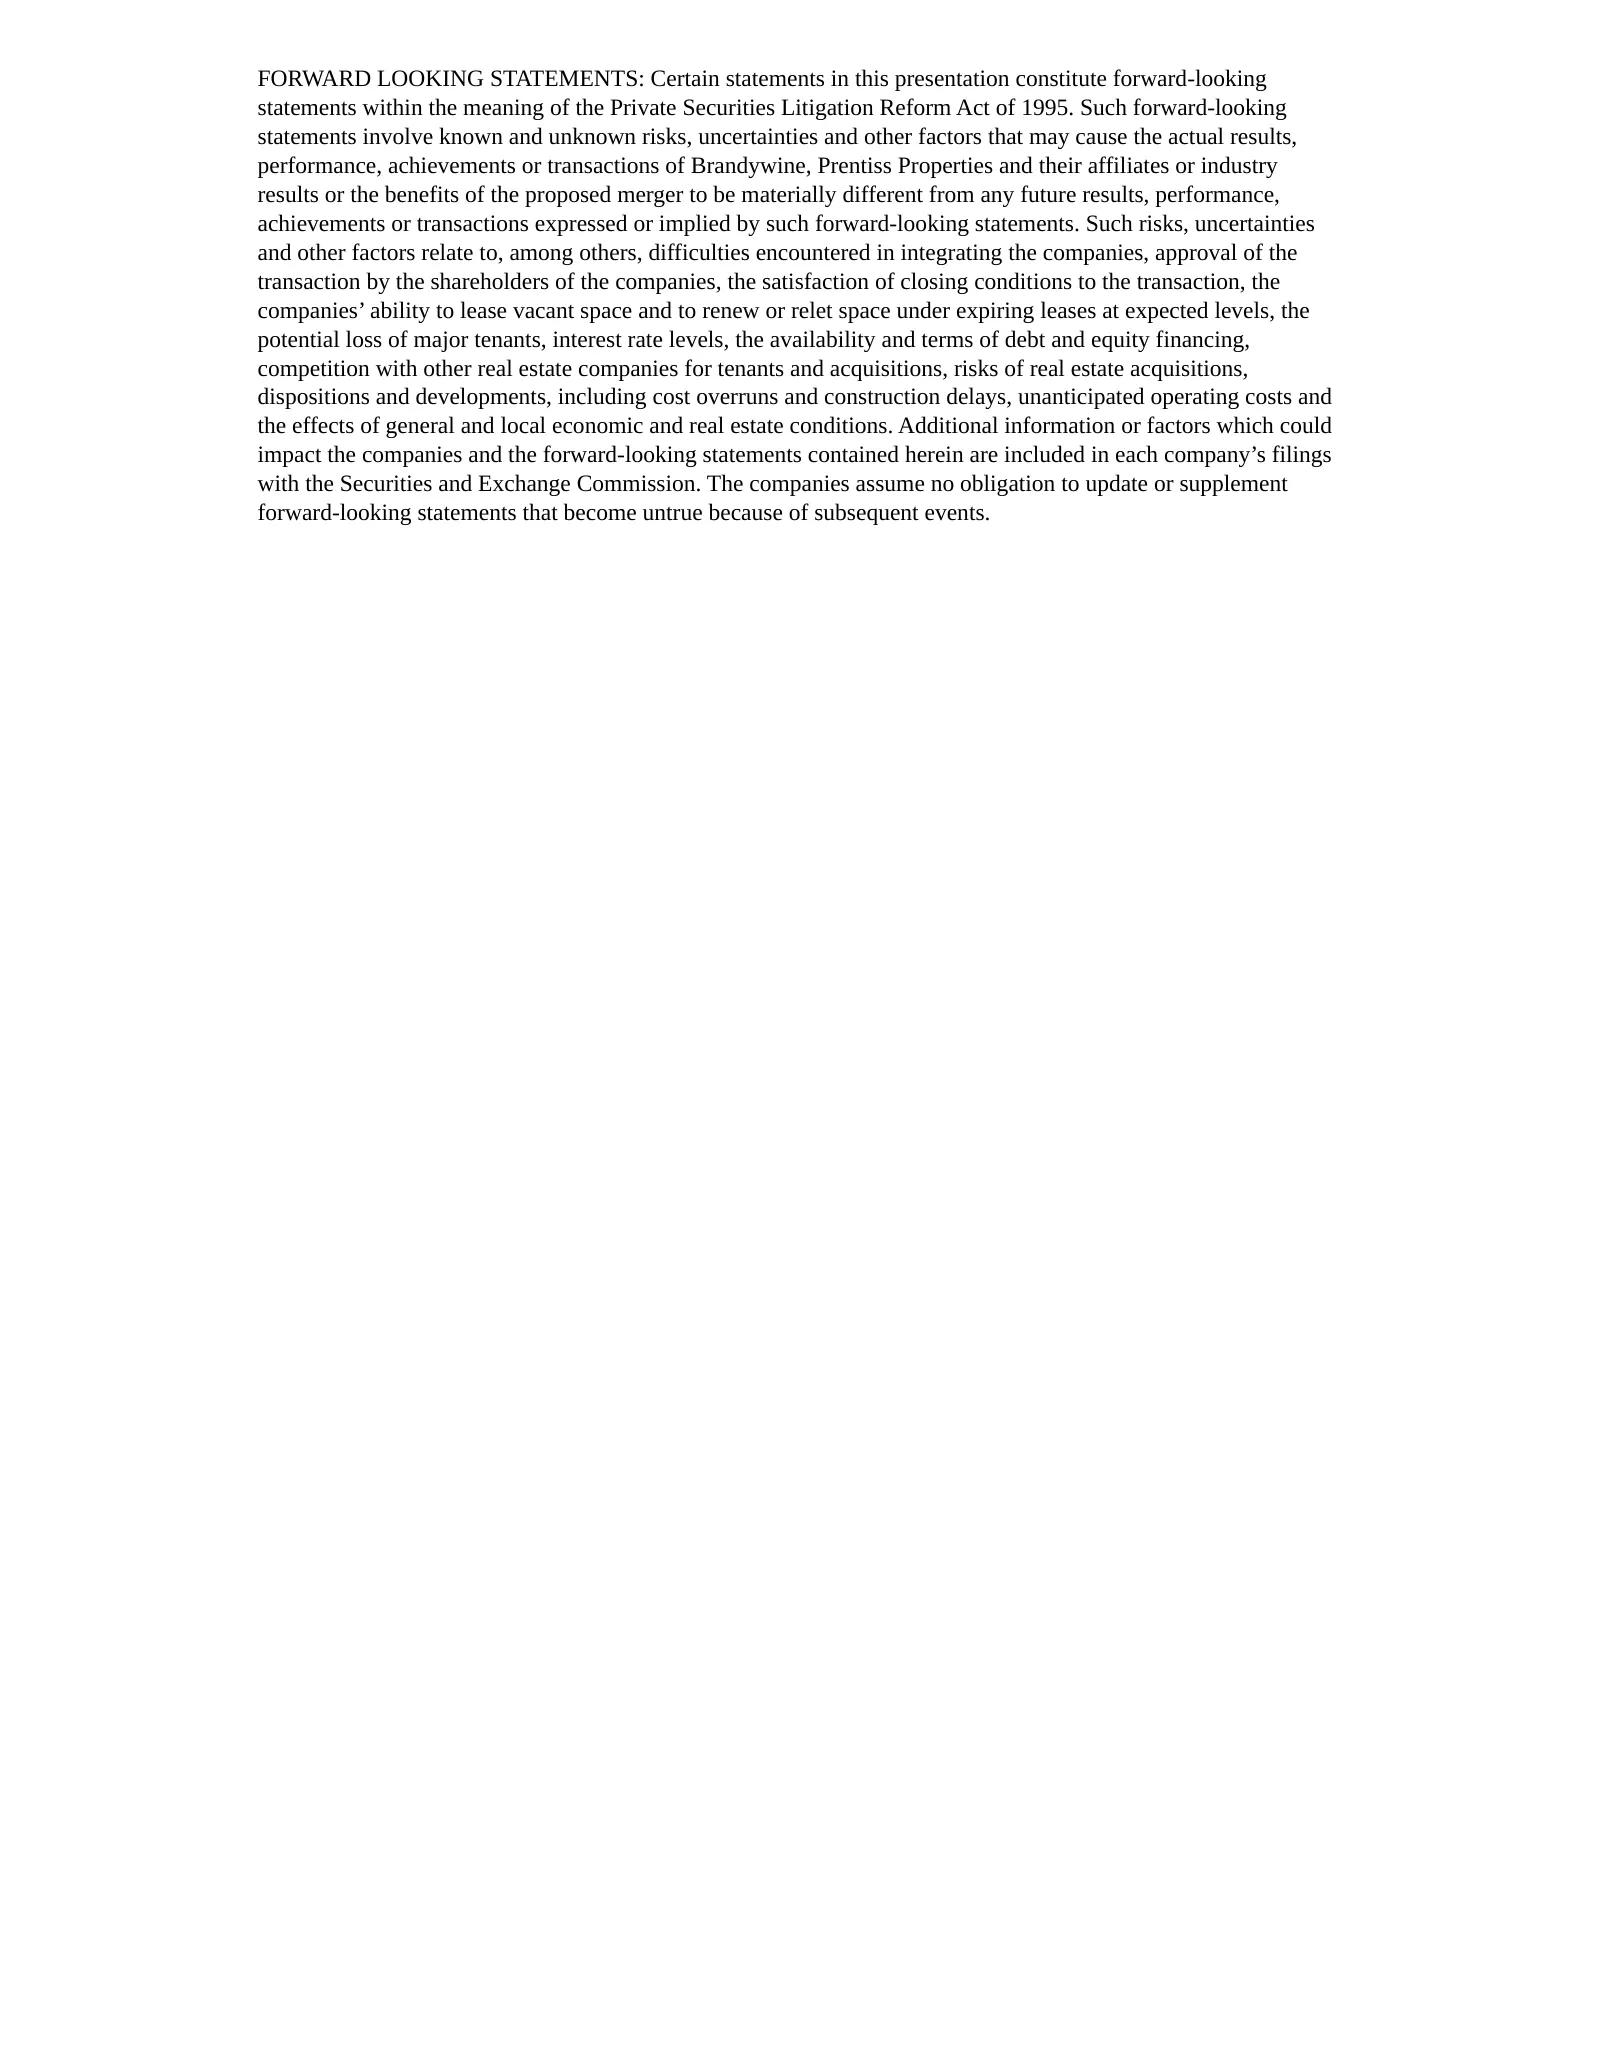
FORWARD LOOKING STATEMENTS: Certain statements in this presentation constitute forward-looking statements within the meaning of the Private Securities Litigation Reform Act of 1995. Such forward-looking statements involve known and unknown risks, uncertainties and other factors that may cause the ac
Slide 25: Additional Information about the Merger and Where to Find It
Additional Information about the Merger and Where to Find It This presentation does not constitute an offer of any securities for sale. In connection with the proposed transaction, Brandywine and Prentiss Properties filed a joint proxy statement/prospectus as part of a registration statement on Form
Source: SEC EDGAR · 425 filed Nov 3, 2005
More decks from Brandywine Realty Trust
 Q3 2026 Earnings Presentation41 slides · Oct 22, 2026
 Q1 2026 Earnings Presentation40 slides · Apr 23, 2026
 Q4 2025 Earnings Presentation44 slides · Feb 4, 2026
 Q3 2025 Earnings Presentation46 slides · Oct 23, 2025
 Q2 2025 Earnings Presentation44 slides · Jul 24, 2025
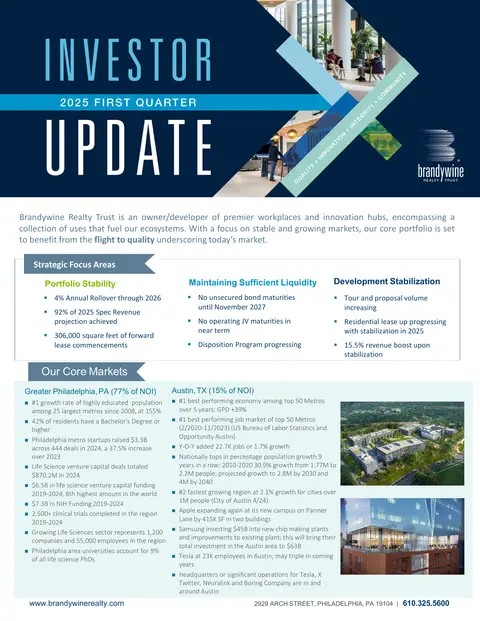 Q1 2025 Earnings Presentation8 slides · Apr 23, 2025