Encore Bancshares — Gulf South Bank Conference 2011
27 slides from Encore Bancshares's conference presentation, May 10, 2011

Slide 1: Gulf South Bank Conference
Gulf South Bank Conference May 10, 2011
Slide 2: Forward-Looking Statements
Forward-Looking Statements This presentation may include forward-looking statements. These forward-looking statements include comments with respect to assumptions relating to projected growth, earnings, earnings per share, capital levels and ratios and other financial performance measures, as well a
Slide 3: Encore Profile
Encore Profile Businesses: Community Bank, Wealth Management and Insurance Headquarters: Houston, Texas Total Assets: $1.5 billion Total Loans: $0.9 billion Total Deposits: $1.0 billion Assets Under Management: $2.9 billion Total Equity: $168 million Tier 1 Risk-Based Capital: 13.05% Private Client
Slide 4: Current Position
Current Position • Emerging profitability • Improving net interest margin • Improving asset quality • Building Houston franchise • Growing fee-based businesses • Solid capital
Slide 5: Quarterly Income Statement
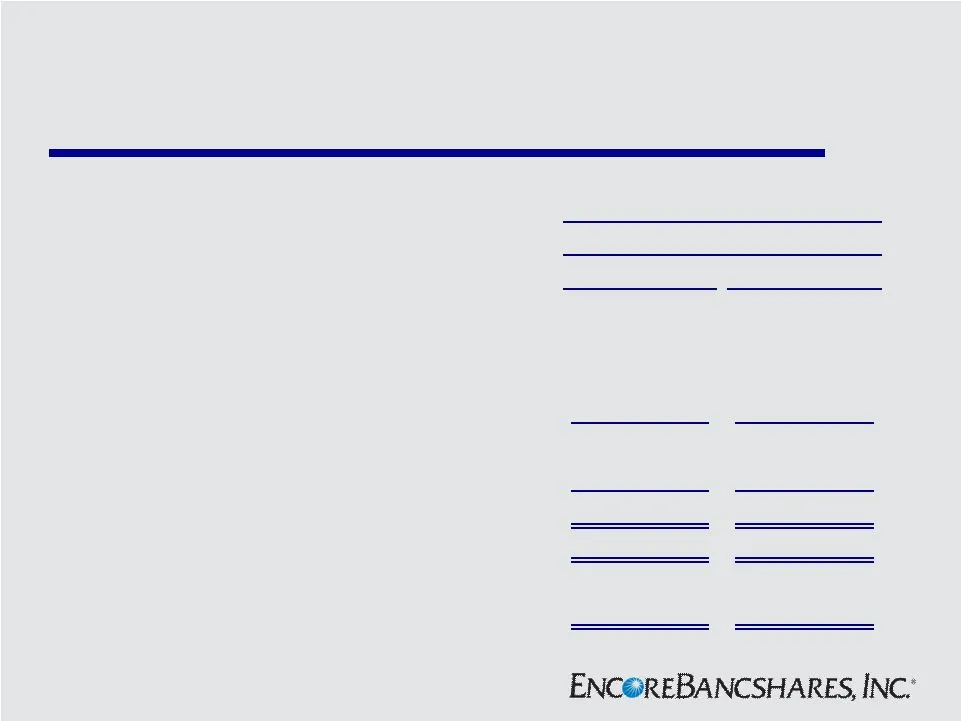
Quarterly Income Statement Three Months Ended Mar 31, Net interest income 11,095 $ 11,490 $ Provision for loan losses 2,170 4,960 Noninterest income 7,066 6,909 Noninterest expense 14,355 18,264 Net earnings (loss) before taxes 1,636 (4,825) Income taxes (2,574) Net earnings (loss) 1,152 $ (2,251) $
Slide 6: Total Revenue
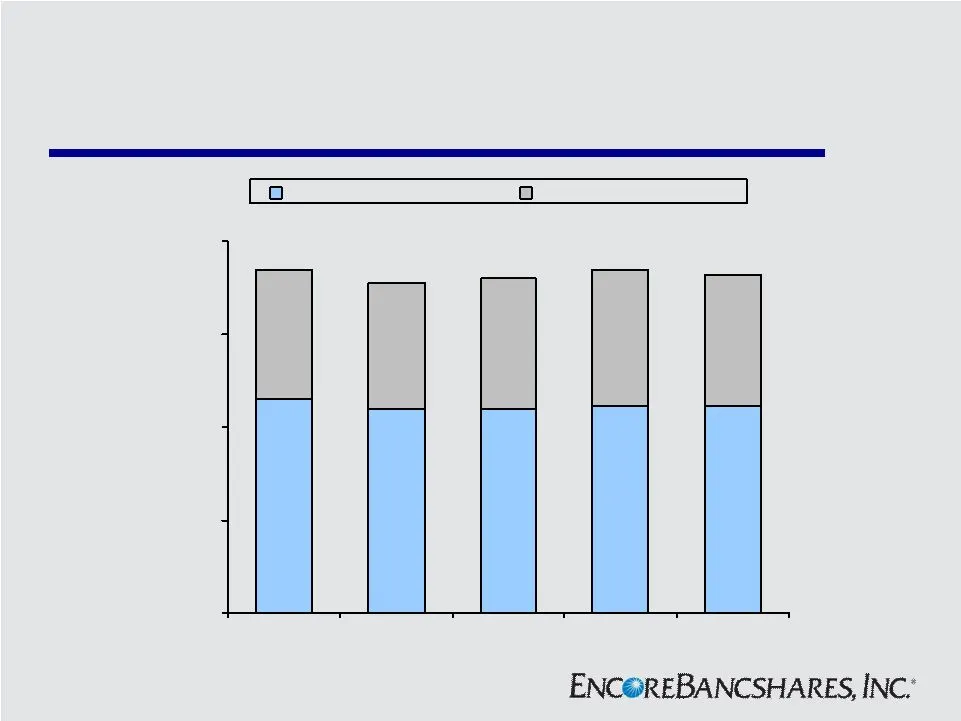
Total Revenue $ in millions * Revenue excludes gain on sale of branches. $6.9 $6.8 $7.0 $7.3 $7.1 $11.5 $10.9 $11.0 $11.1 $11.1 $0 $5 $10 $15 $20 1Q10 2Q10 * 3Q10 4Q10 * 1Q11 Net Interest Income Noninterest Income $18.4 $17.7 $18.0 $18.4 $18.2
Slide 7: Net Interest Income
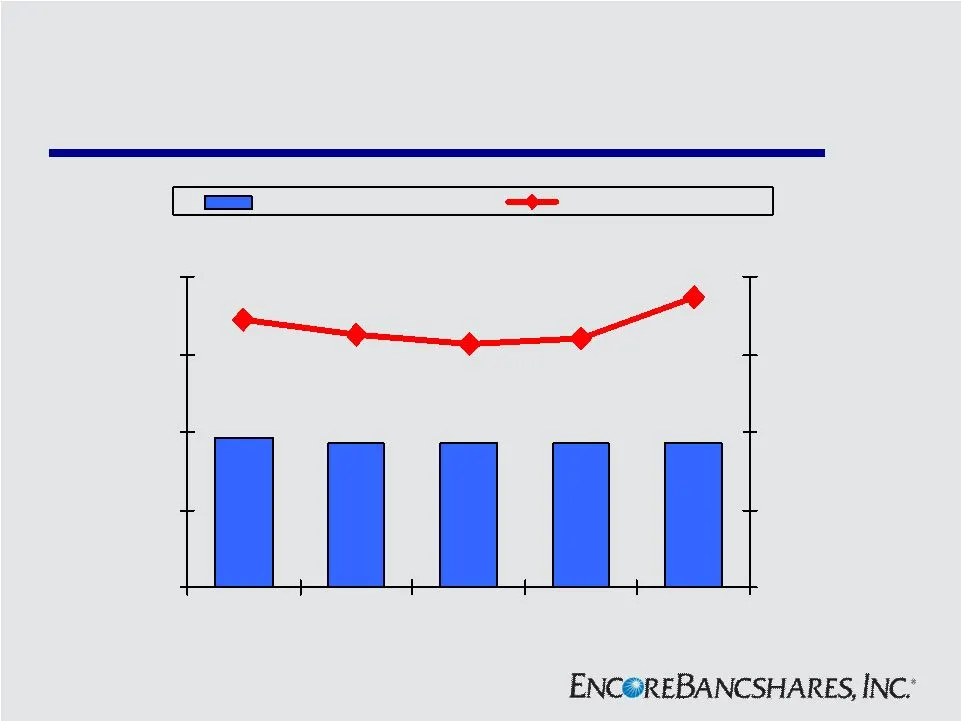
Net Interest Income * $11.2 $11.2 $11.1 $11.1 $11.6 3.37% 2.89% 2.83% 2.92% 3.11% $0 $6 $12 $18 $24 1Q10 2Q10 3Q10 4Q10 1Q11 0.0% 0.9% 1.8% 2.7% 3.6% Net Interest Income Net Interest Margin $ in millions * On taxable – equivalent basis.
Slide 8: Noninterest Expense
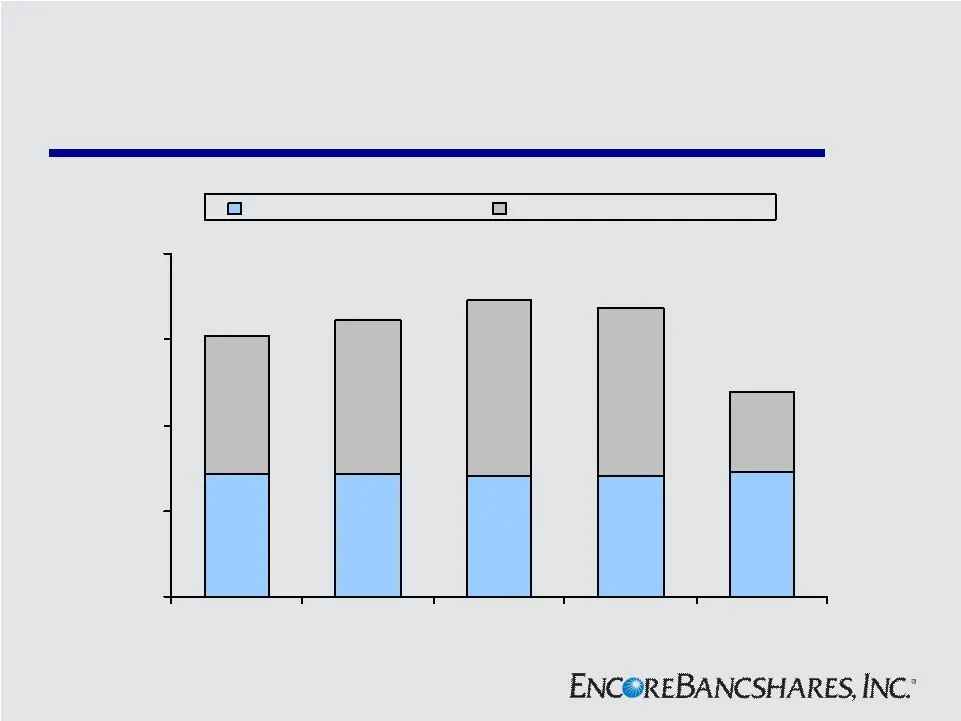
Noninterest Expense $8.7 $8.5 $8.5 $8.6 $8.6 $5.7 $11.7 $12.2 $10.8 $9.7 $0 $6 $12 $18 $24 1Q10 2Q10 3Q10 4Q10 1Q11 Personnel expense Non-personnel expense $ in millions $18.3 $19.4 $20.7 $20.2 $14.4
Slide 9: Delinquent Loans
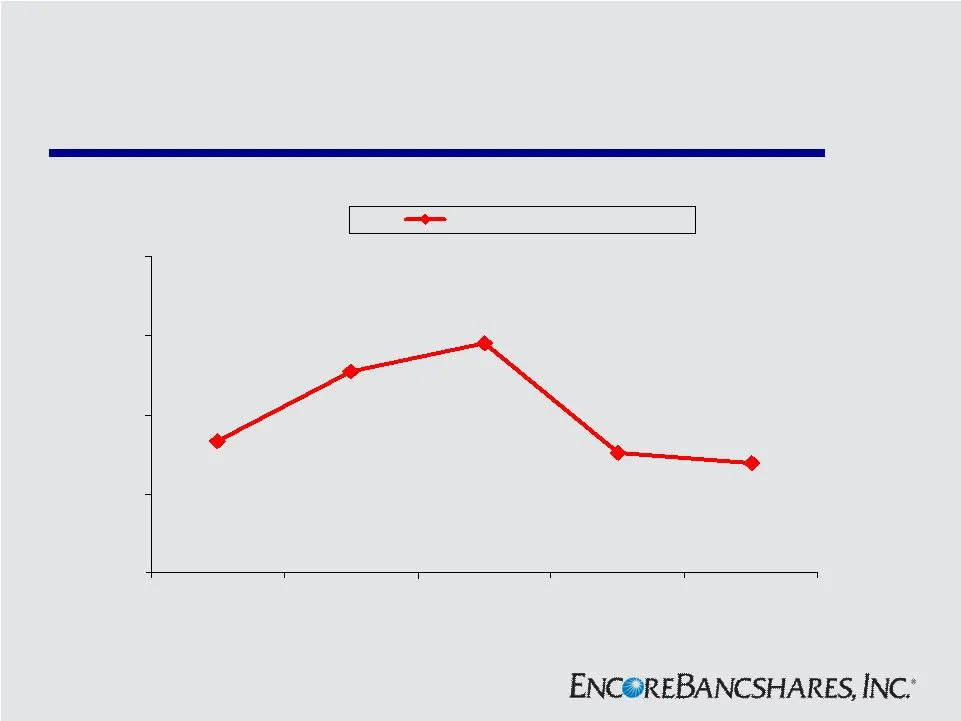
Delinquent Loans * $33.5 $51.0 $58.0 $27.8 $30.5 $0 $20 $40 $60 $80 1Q10 2Q10 3Q10 4Q10 1Q11 Total delinquent loans $ in millions * Represents the legal loan balance of loans 30 days or more past due.
Slide 10: Non-Performing Assets
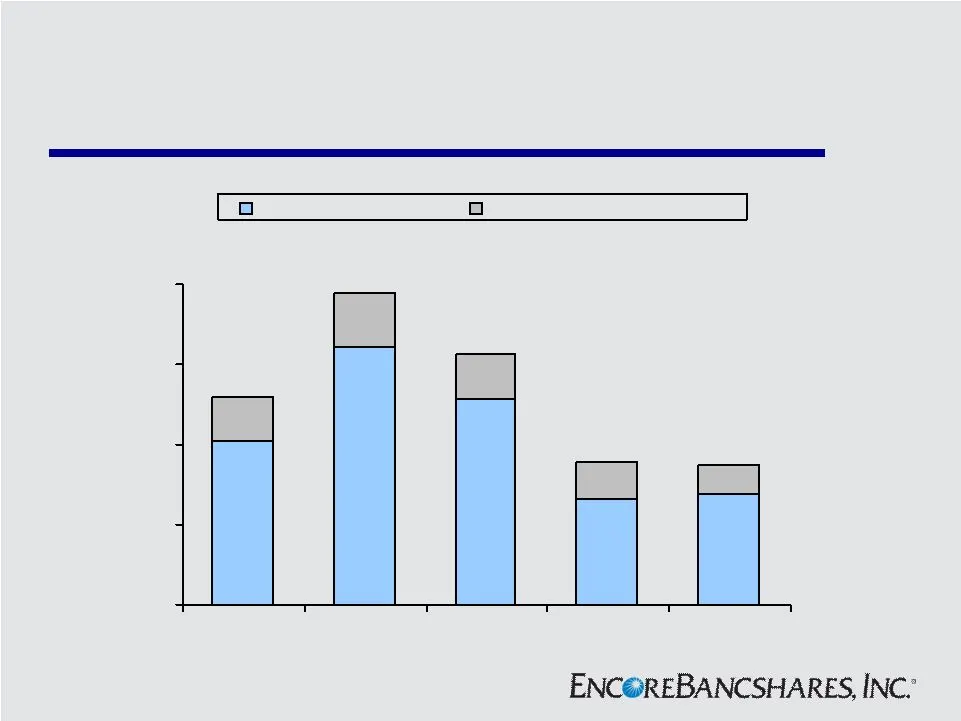
Non-Performing Assets $ in millions $11.1 $13.6 $10.8 $9.3 $7.3 $27.7 $26.5 $51.7 $64.2 $40.7 $0 $20 $40 $60 $80 1Q10 2Q10 3Q10 4Q10 1Q11 Nonaccrual loans Investment in real estate $51.8 $77.8 $62.5 $35.8 $35.0
Slide 11: Net Charge-offs
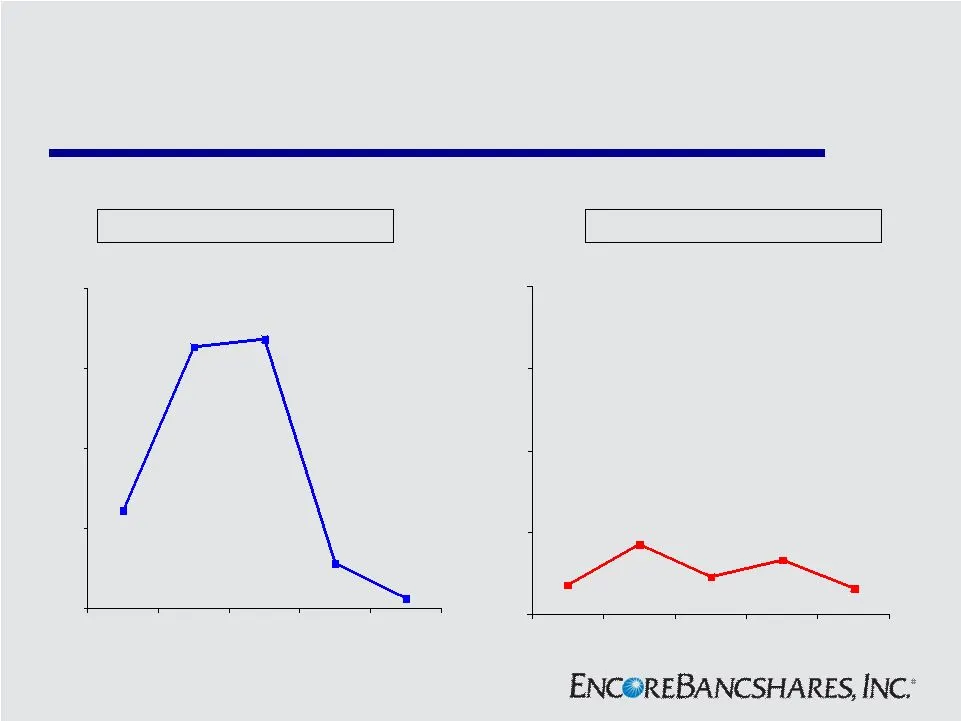
Net Charge-offs $4.9 $13.5 $0.5 $2.3 $13.1 $0 $4 $8 $12 $16 1Q10 2Q10 3Q10 4Q10 1Q11 $ in millions Commercial Net Charge-offs $1.5 $3.4 $1.8 $2.7 $1.3 $0 $4 $8 $12 $16 1Q10 2Q10 3Q10 4Q10 1Q11 Consumer Net Charge-offs
Slide 12: Building Houston Franchise
Building Houston Franchise • Take advantage of market disruptions • Utilize strong team of experienced commercial and private bankers • Leverage local decision making and local contacts • Continue to grow DDA deposits and commercial loan portfolio
Slide 13: Houston Market
Houston Market • th largest city; 6 th largest MSA • Unemployment rate of 8.3% vs. 9.2% for U.S.* • Population growth ranked 2 nd in the nation between 2000 and 2009 • Second largest U.S. port based on tonnage • Texas entered recession a year later; exiting at the same time * Not seasonally adjusted
Slide 14: Houston Deposit Market Share
Houston Deposit Market Share # of Branches $ in Millions Market Share % JP Morgan Chase (NY) 41,181 $ 30.01% Wells Fargo (CA) 14,798 10.78% Bank of America (NC) 9,755 7.11% Zions (Amegy) (UT) 8,577 6.25% BBVA (Spain) 7,831 5.71% Comerica * 4,658 3.39% Prosperity 3,039 2.21% Capital One (VA) 2,365 1.
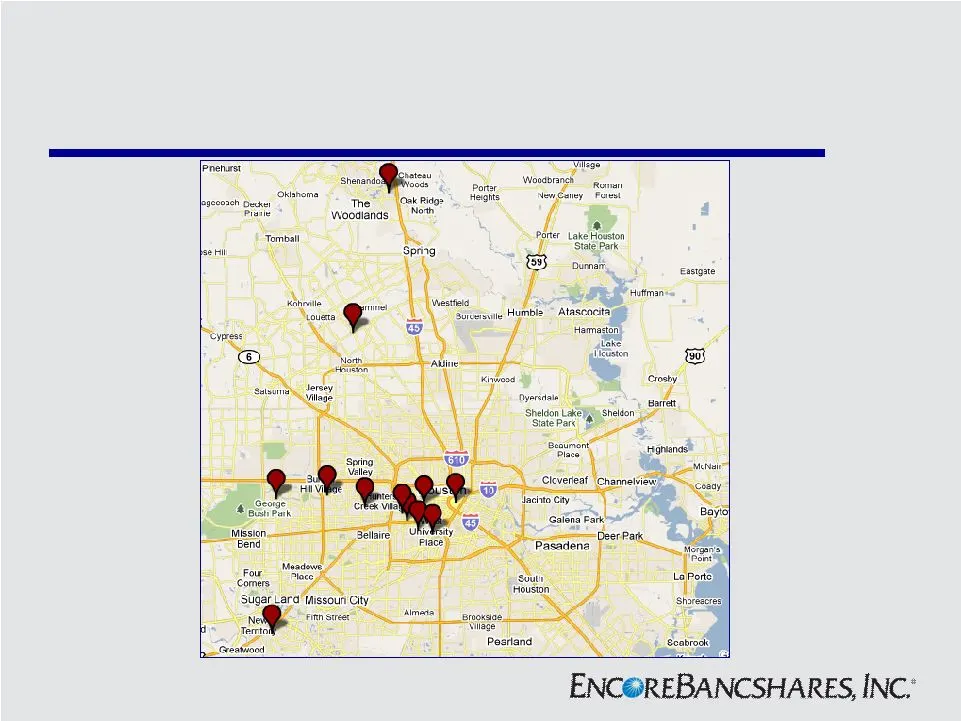
Slide 15: Houston Market
Houston Market Includes additional private client office expected to be opened Q3 2011.
Slide 16: Texas Loans
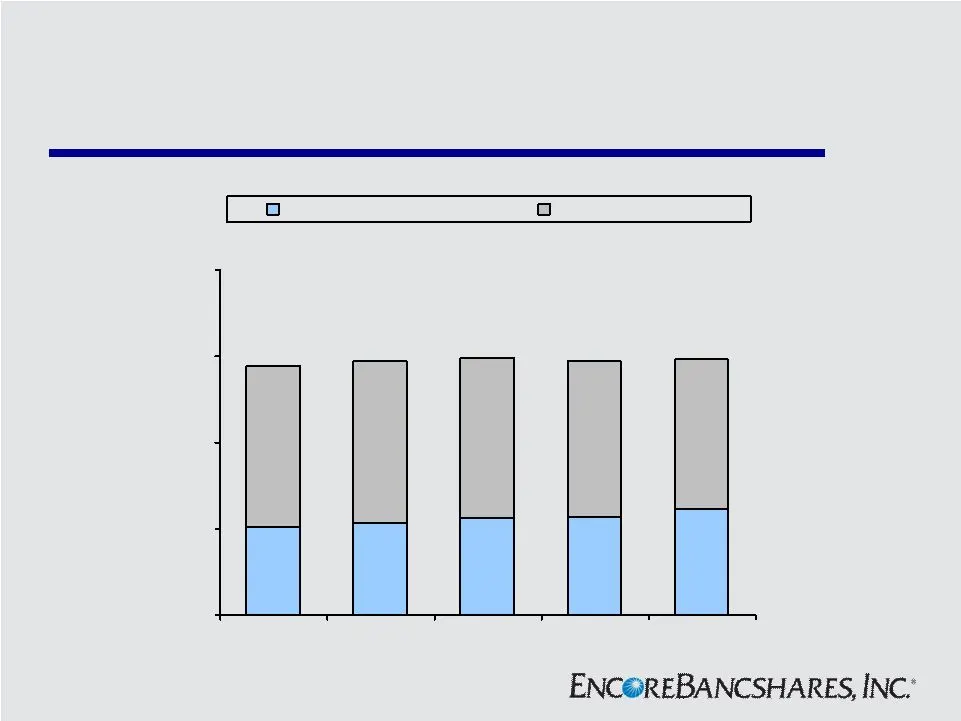
Texas Loans $ in millions $345 $367 $335 $320 $308 $537 $524 $557 $566 $560 $0 $300 $600 $900 $1,200 1Q10 2Q10 3Q10 4Q10 1Q11 Commercial loans Consumer loans $868 $886 $892 $882 $891
Slide 17: Loan Portfolio
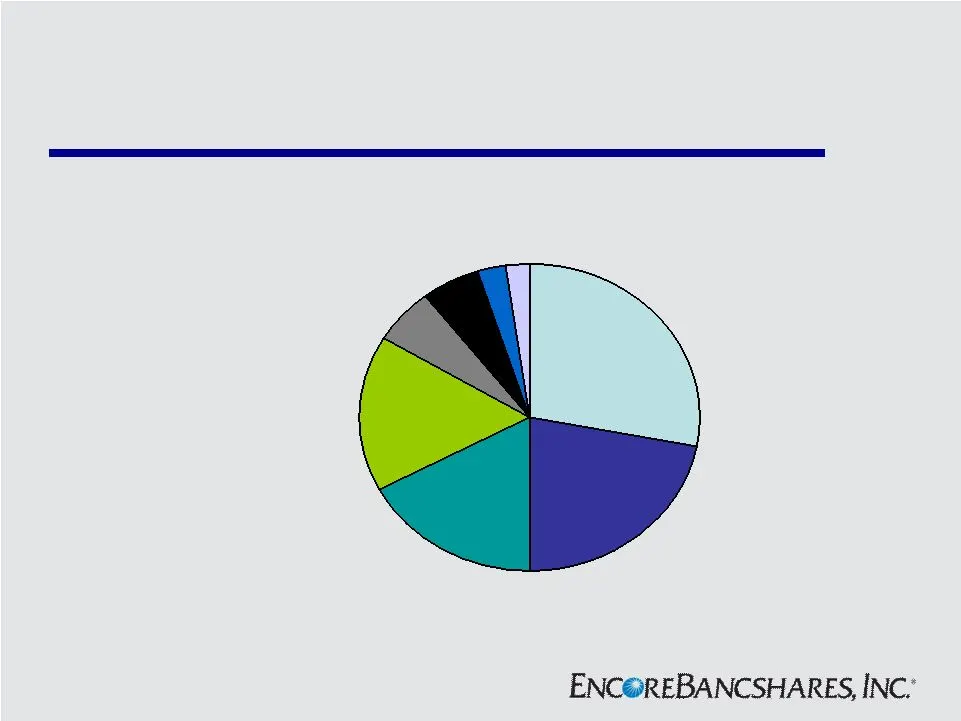
Loan Portfolio Residential 2nd lien 28.0% Home equity lines 5.9% Consumer 2.4% Construction 5.4% Commercial 17.3% Residential 1st lien 21.9% FL Retained 2.7% Commercial real estate 16.4% Excludes held-for-sale of $2.9 million .
Slide 18: Residential Loan Portfolio
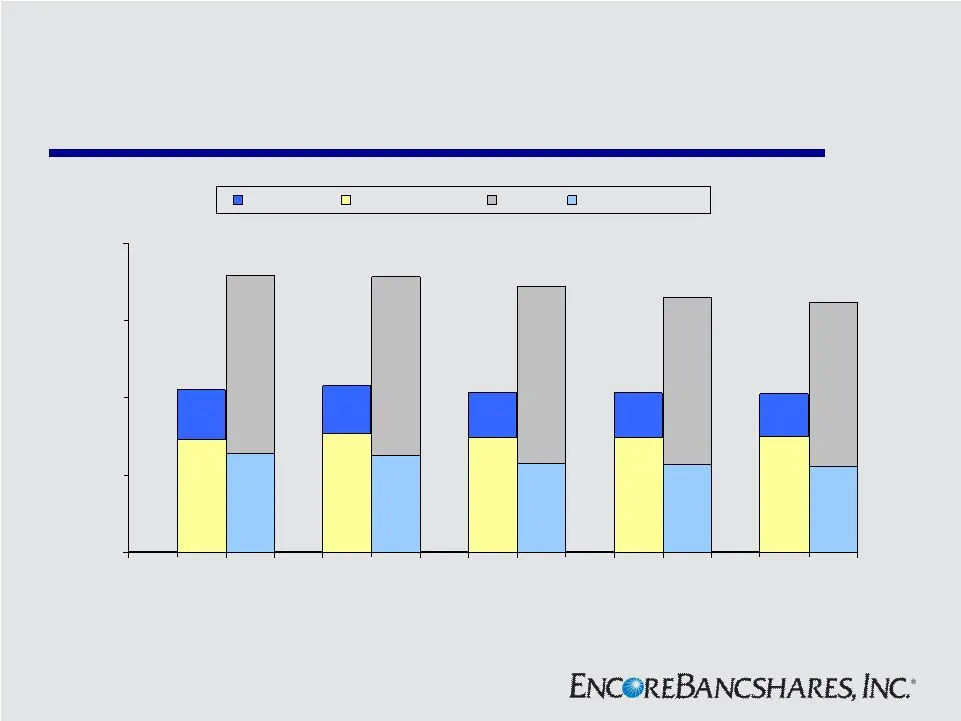
Residential Loan Portfolio $0 $100 $200 $300 $400 1Q10 2Q10 3Q10 4Q10 1Q11 1st SBO 1st Mortgage PMT HELOC/Others $211 $358 $216 $357 $207 $344 $205 $323 $ in millions $330 $206
Slide 19: Residential Loan Delinquency
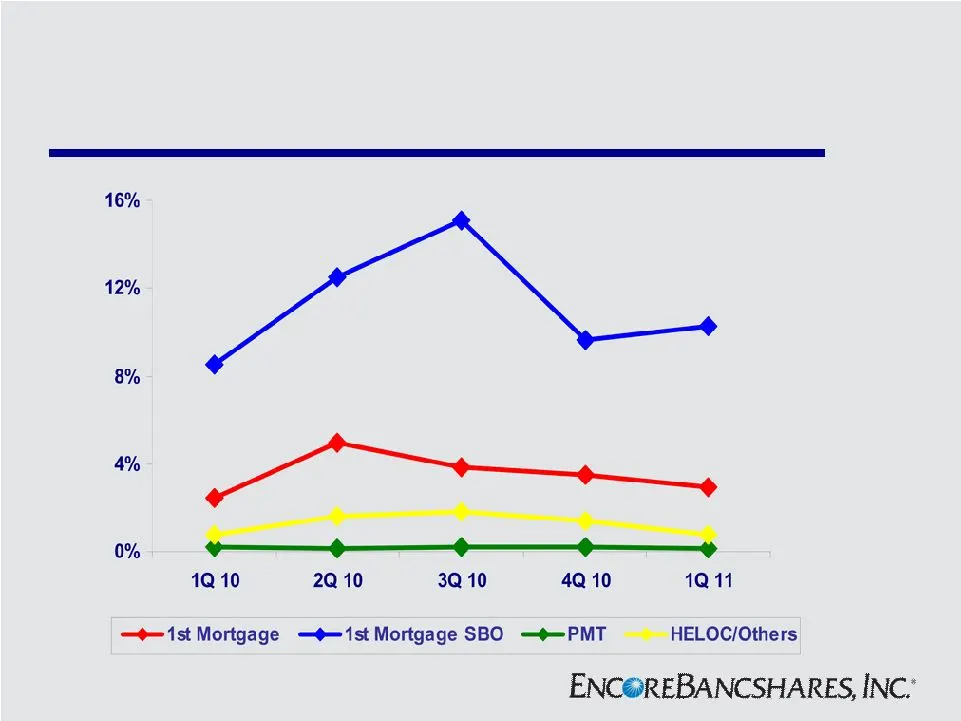
Residential Loan Delinquency
Slide 20: Texas Deposits
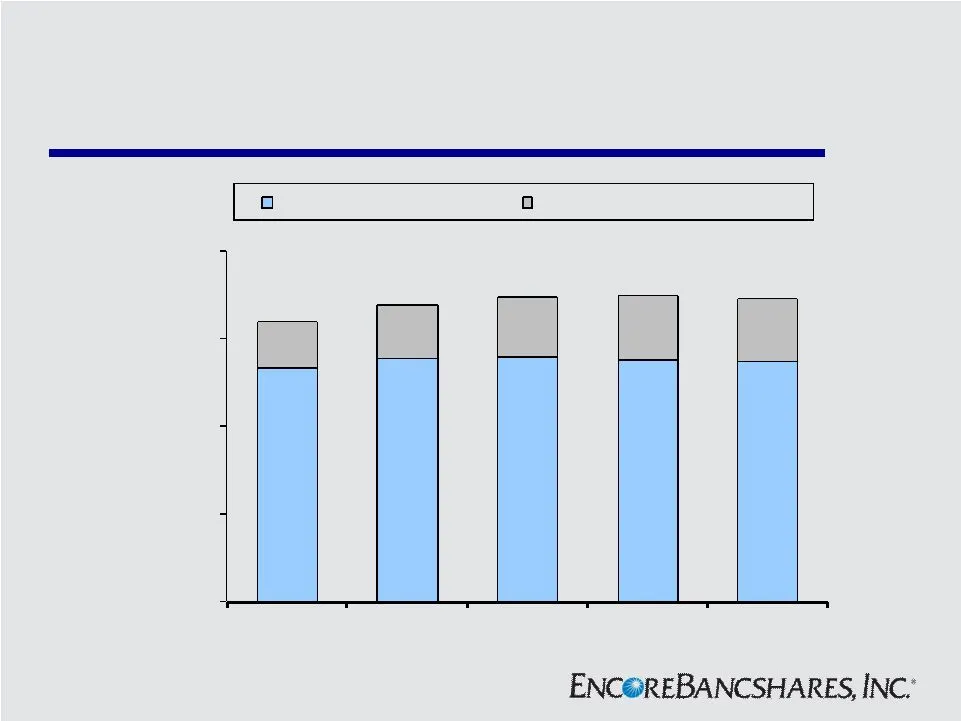
Texas Deposits $ in millions $803 $833 $838 $830 $821 $156 $183 $206 $220 $220 $0 $300 $600 $900 $1,200 1Q10 2Q10 3Q10 4Q10 1Q11 Interest-bearing deposits Noninterest-bearing deposits $959 $1,016 $1,044 $1,050 $1,041
Slide 21: Deposit Mix
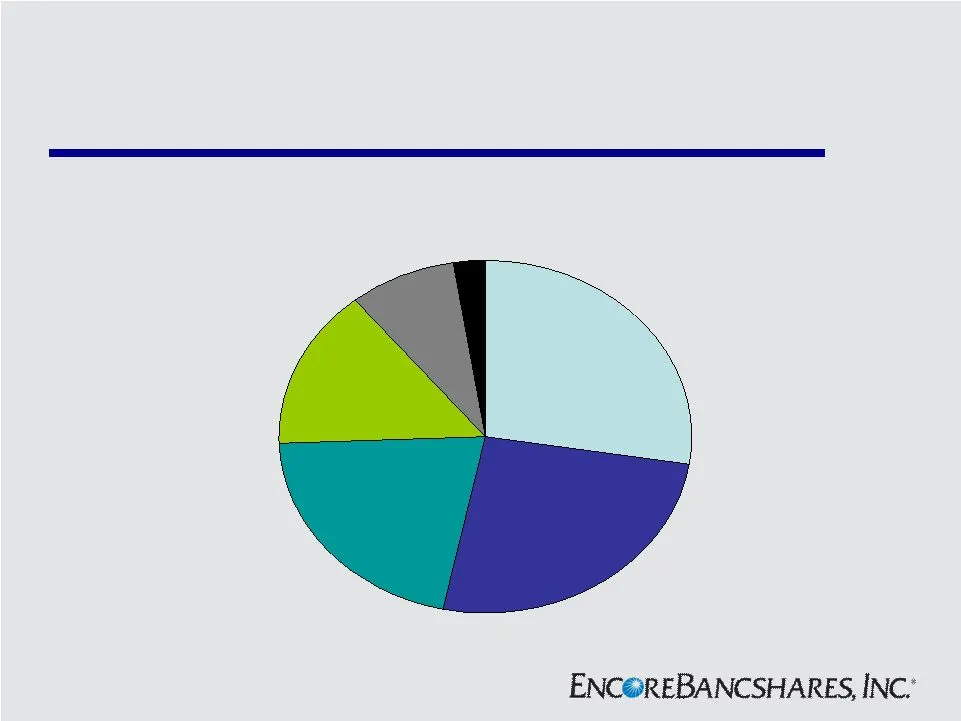
Deposit Mix Money market and savings 27.4% Noninterest- bearing deposits 21.1% Interest checking 14.9% CDs under $250,000 25.8% CDs over $250,000 8.3% Brokered deposits 2.5%
Slide 22: Wealth Management
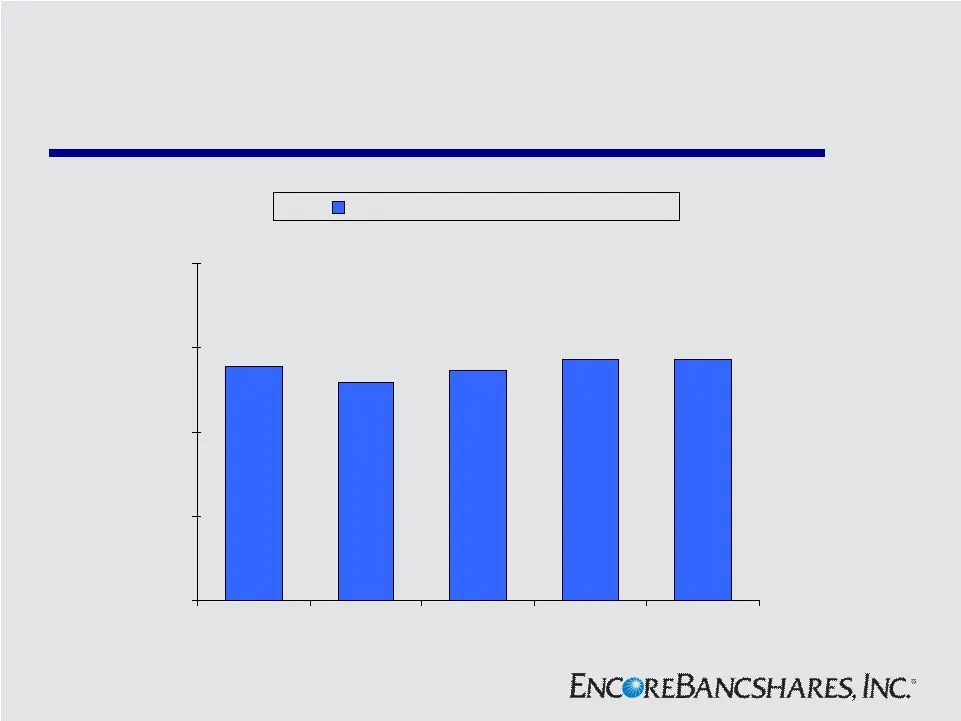
Wealth Management $2.8 $2.7 $2.9 $2.9 $2.6 $0 $1 $2 $3 $4 1Q10 2Q10 3Q10 4Q10 1Q11 Assets Under Management $ in Billions
Slide 23: Wealth Management
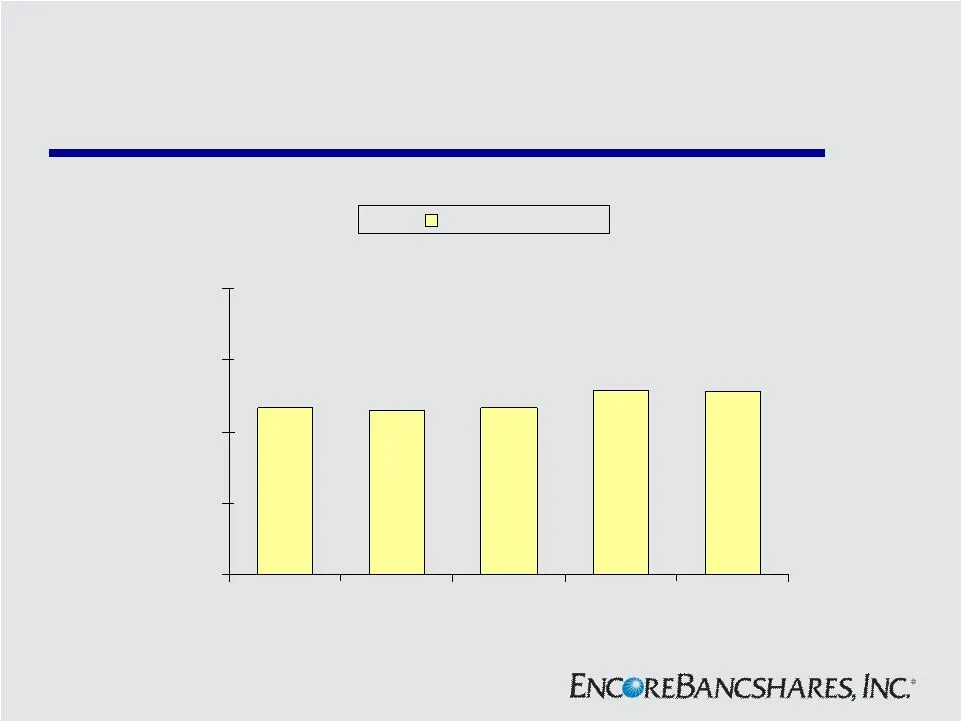
Wealth Management $4.7 $4.7 $5.2 $5.1 $4.6 $0 $2 $4 $6 $8 1Q10 2Q10 3Q10 4Q10 1Q11 Revenues $ in Millions
Slide 24: Insurance Commissions
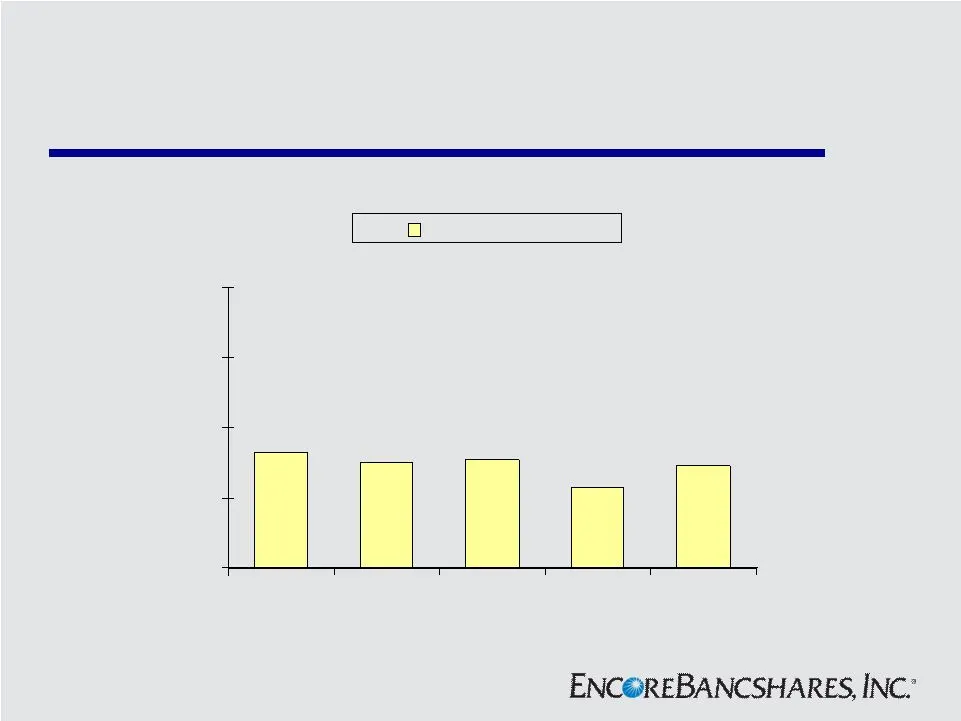
Insurance Commissions $1.6 $1.5 $1.1 $1.4 $1.5 $0 $1 $2 $3 $4 1Q10 2Q10 3Q10 4Q10 1Q11 Commissions $ in Millions
Slide 25: Solid Capital
Solid Capital 3/31/2011 TCE/ Tangible Assets 6.91% Leverage Ratio 9.29% Tier 1 RBC 13.05% Tier 1 Common RBC 8.08% Allowance for Loan Losses/ Total Loans * 2.03% * Excludes loans held-for-sale of $2.9 million.
Slide 26: Investment Considerations
Investment Considerations • Solid capital position • Improving asset quality • Capacity for loan growth • Attractive market valuation relative to peers • High margin fee-based businesses • Desirable Houston franchise
Slide 27: Non-GAAP Financial Measures
Non-GAAP Financial Measures March 31, 2011 Shareholders' equity (GAAP) 167,914 $ Less: Preferred stock 29,633 Goodwill and other intangible assets, net 40,374 Tangible common equity (1) 97,907 $ Total assets (GAAP) 1,458,181 $ Less: Goodwill and other intangible assets, net 40,374 Tangible assets 1,
Source: SEC EDGAR · 8-K filed May 10, 2011
More decks from Encore Bancshares Inc
 Investor Presentation (March 2011)24 slides · Mar 3, 2011
 KBW Texas Field Trip (February 2011)24 slides · Feb 8, 2011
 Macquarie Small & Mid Cap Conference 201021 slides · Jun 16, 2010
 Gulf South Bank Conference (May 2010)21 slides · May 5, 2010
 KBW Texas Field Trip (February 2010)26 slides · Feb 9, 2010
 Investor Presentation (November 2009)25 slides · Nov 4, 2009