Encore Bancshares — KBW Texas Field Trip (February 2010)
26 slides from Encore Bancshares's conference presentation, Feb 9, 2010

Slide 1: Investor Presentation – KBW Texas Field Trip
Investor Presentation February 9, 2010 KBW Texas Field Trip Exhibit 99.1 E NCORE B ANCSHARES , I NC .

Slide 2: Forward-Looking Statements
Forward-Looking Statements • This presentation may include forward-looking statements. These forward-looking statements include comments with respect to assumptions relating to projected growth, earnings, earnings per share and other financial performance measures, as well as management’s short-term

Slide 3: Encore Profile
• Company Type: Financial Holdin g Company and Wealth Mana g ement Or g anization • Headquarters: Houston, Texas • Total Assets: $1.6 billion • Total Loans: $1.1 billion • Total Deposits: $1.2 billion • Total Equity: $187 millions • Tier 1 Risk-Based Capital: • Assets Under Mana g ement: $2.7 billio

Slide 4: Fourth Quarter 2009 Highlights
Fourth Quarter 2009 Highlights Net earnings of $1.6 million for the fourth quarter of 2009, and $1.8 million for the twelve months ended December 31, 2009 Trust and investment management revenue rose compared with the fourth quarter of 2008, due to rising assets under management which reached $2.7 b
Slide 5: Total Loans & Deposits
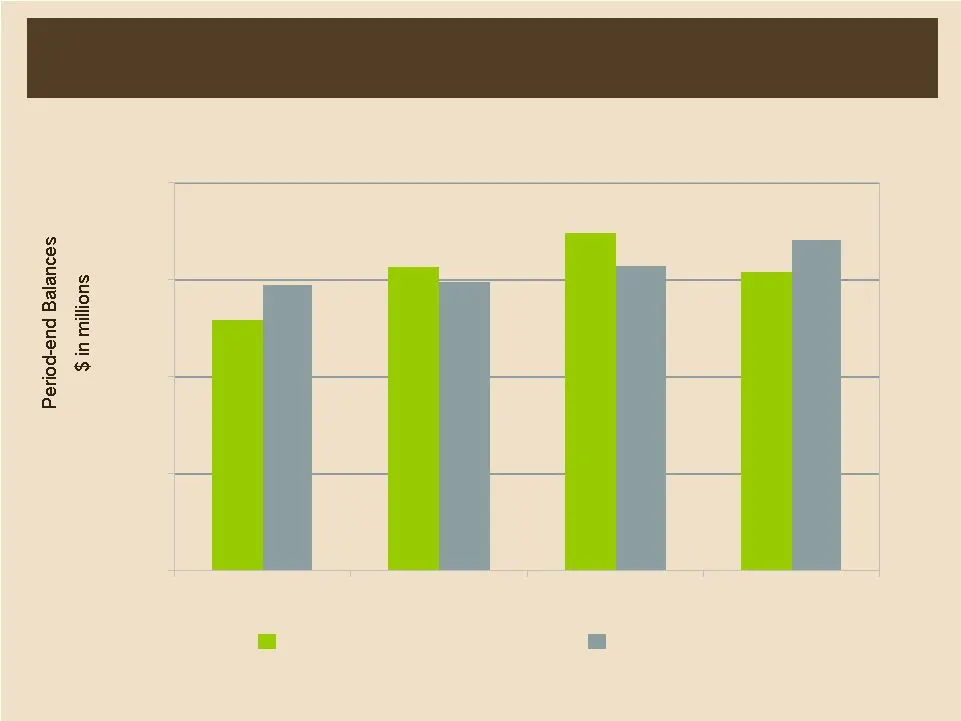
Total Loans & Deposits $1,097 $1,031 $1,078 $908 $1,218 $1,041 $1,101 $1,192 Total Loans Deposits
Slide 6: Diversified Loan Mix
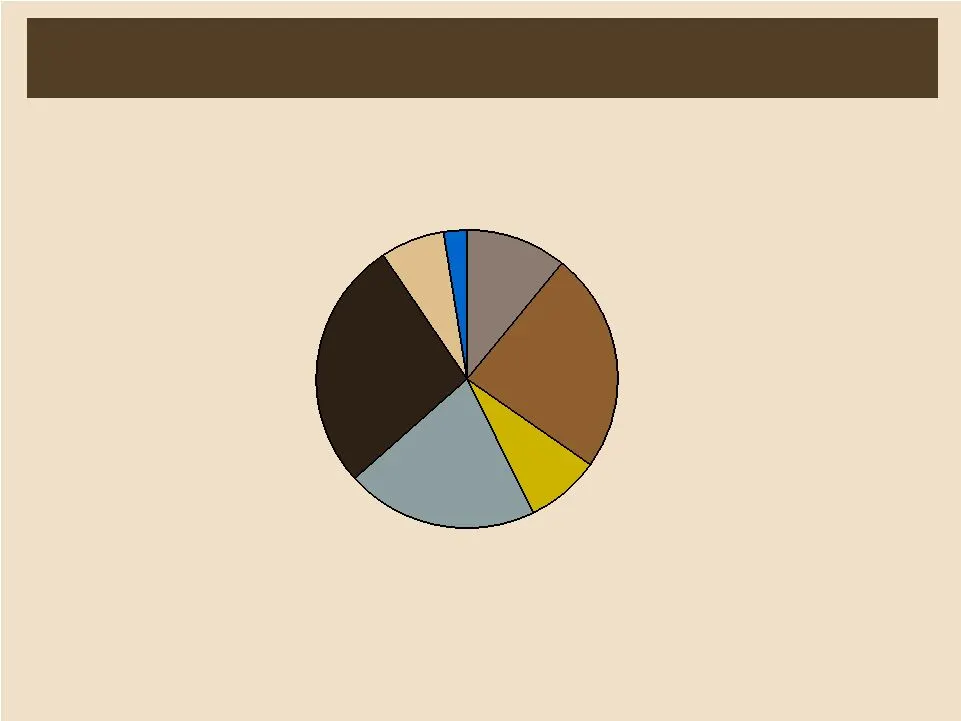
Diversified Loan Mix Consumer Residential 2nd lien Commercial Home equity lines Commercial real estate Real estate construction Residential 1st lien Total Loans: $1.1 billion December 31, 2009

Slide 7: Loan Portfolio Concentrations – Real Estate
Loan Portfolio Concentrations – Real Estate ($ in thousands) As of December 31, 2009 Residential Residential Home Percent of Mortgage- Mortgage- Equity Commercial Real Estate Total First Lien Second Lien Lines Real Estate Construction Total Loans Texas 126,413 $ 270,009 $ 30,243 $ 137,047 $ 53,484 $
Slide 8: Deposit Mix
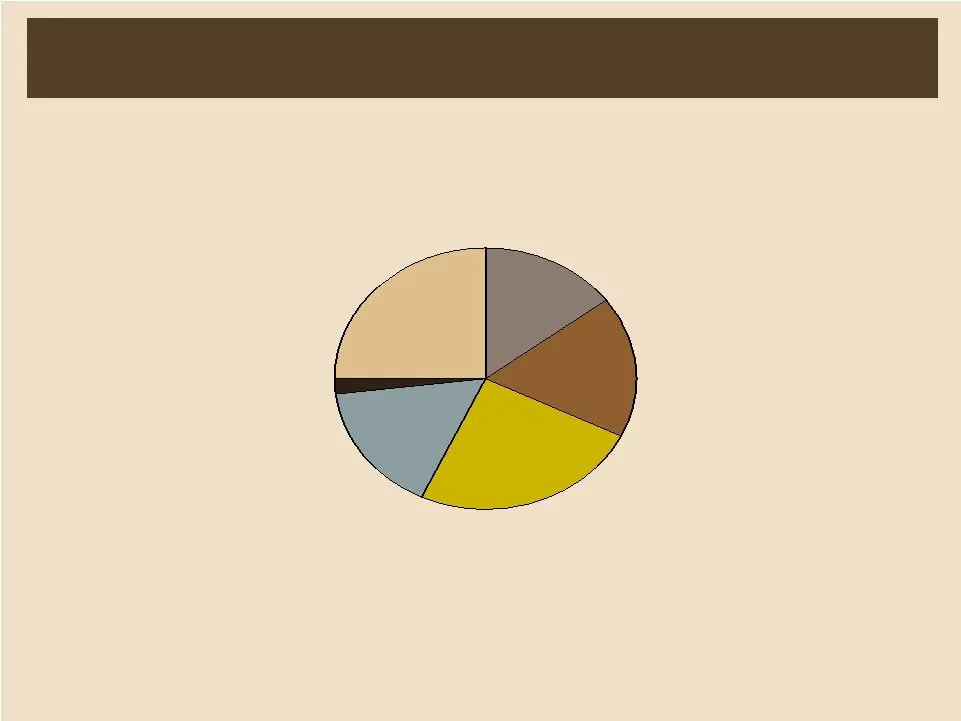
Deposit Mix Time deposits less than $100,000 Money market and savings Interest checking Time deposits $100,000 and greater Noninterest-bearing deposits Brokered deposits Total Deposits $1.2 billion December 31, 2009
Slide 9: Net Interest Margin
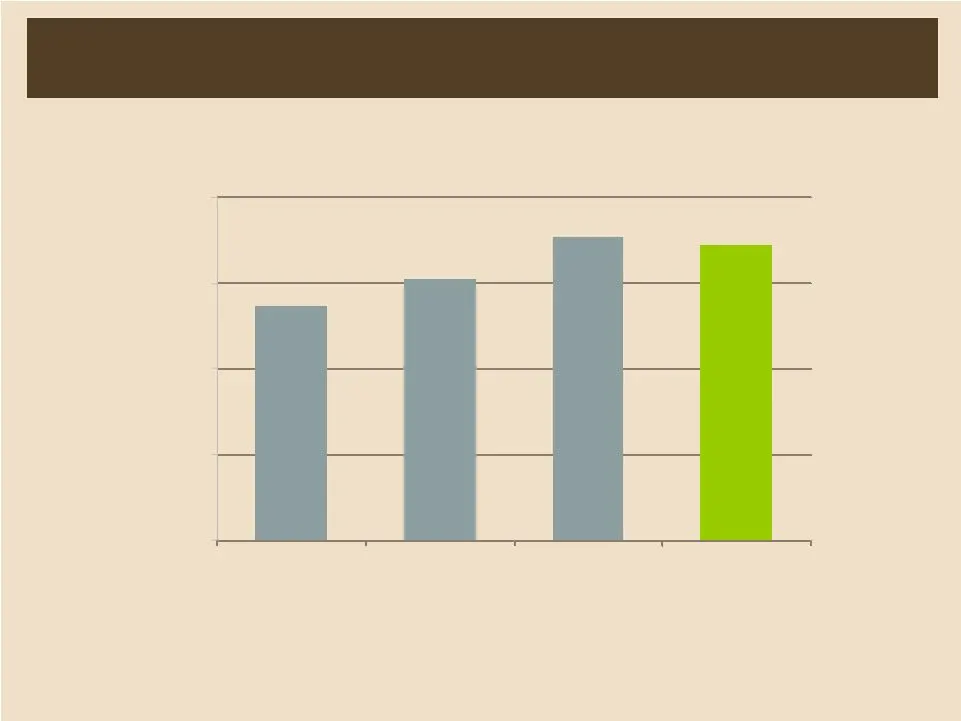
Net Interest Margin 2009 * * On a taxable-equivalent basis in 2009. Taxable-equivalent amounts in prior years were immaterial.
Slide 10: Net Interest Income
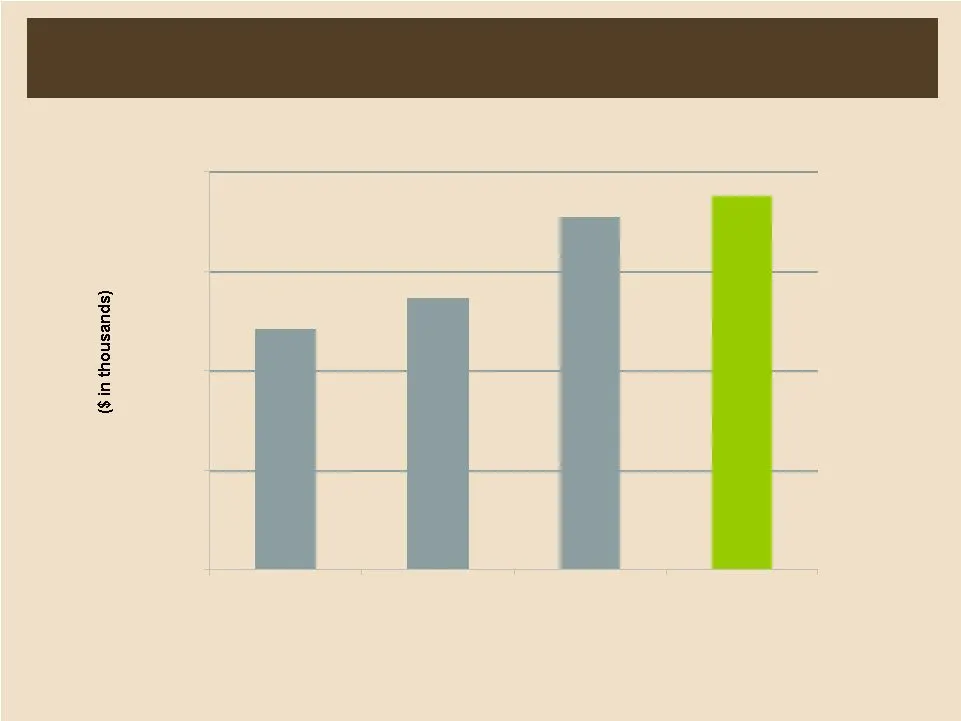
Net Interest Income $46,949 $44,274 $34,175 $30,173 12,500 25,000 37,500 50,000 2009 * * On a taxable-equivalent basis in 2009. Taxable-equivalent amounts in prior years were immaterial.
Slide 11: Wealth Management Business
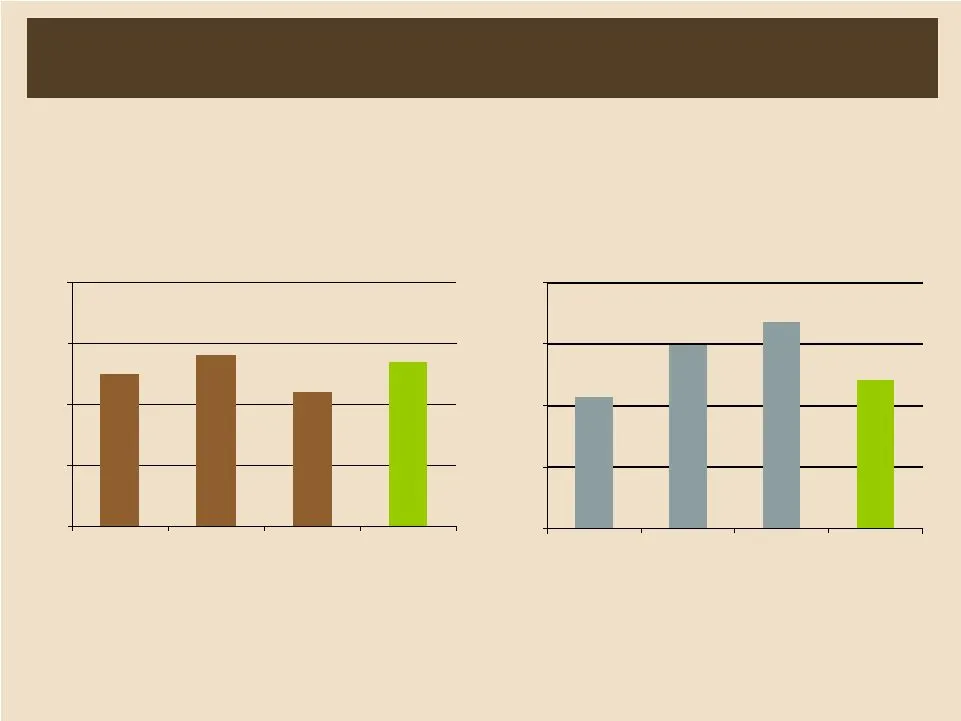
Wealth Management Business $2.7 $4.2 $3.0 $3.7 0.0 1.3 2.5 3.8 5.0 Net Earnings $ in millions $2.5 $2.7 $2.2 $2.8 0.0 1.0 2.0 3.0 4.0 $ in billions Assets Under Management
Slide 12: Non Interest Expense
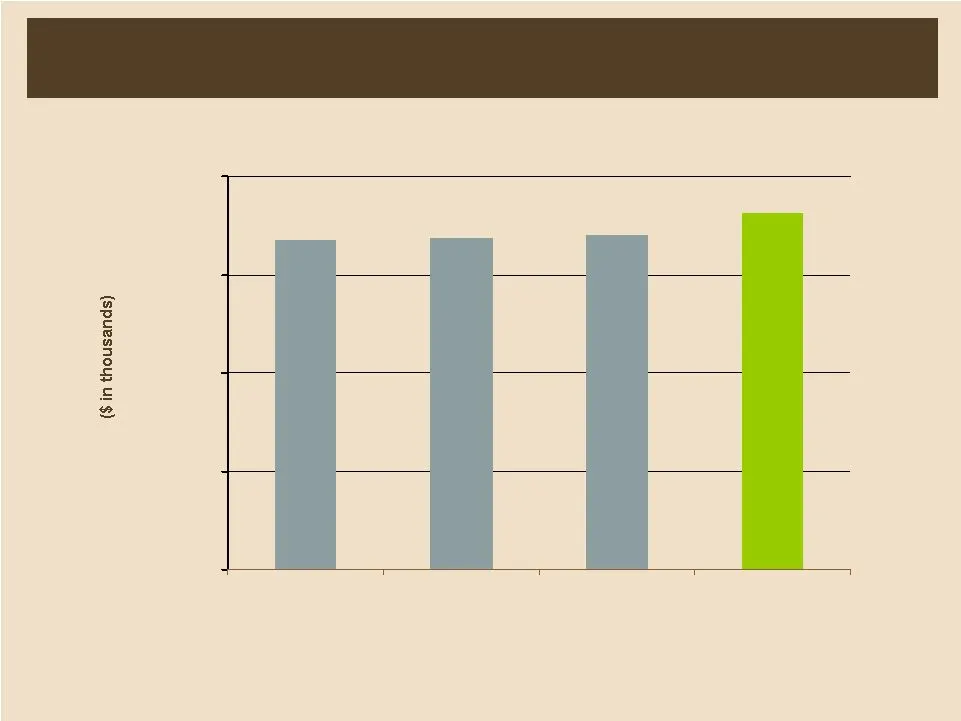
$50,181 $50,544 $51,006 $54,424 15,000 30,000 45,000 60,000 Non Interest Expense
Slide 13: Asset Quality
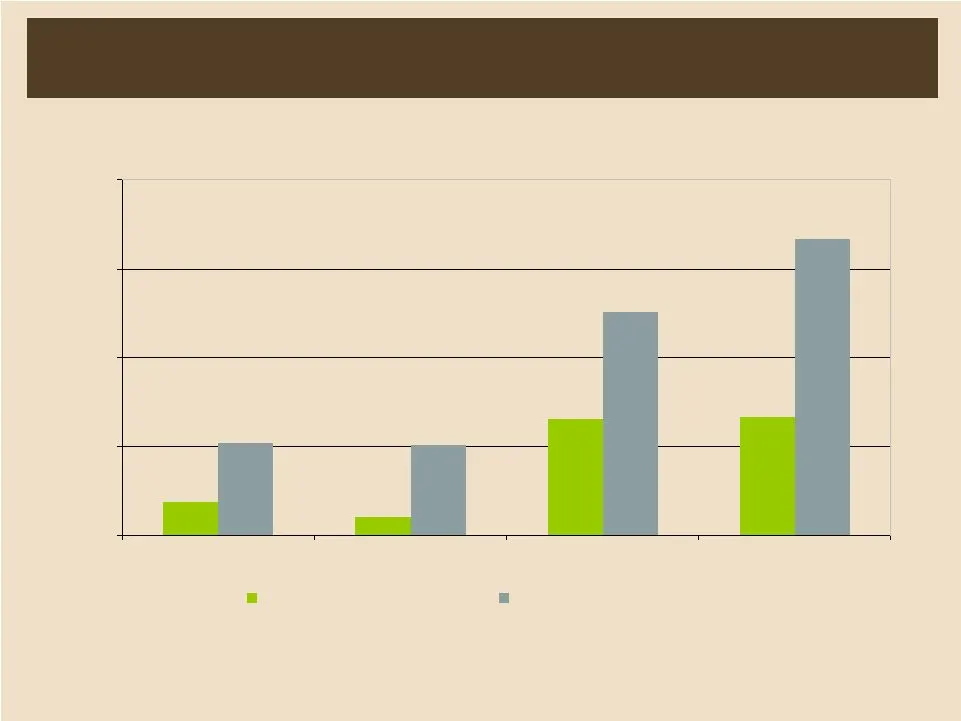
Asset Quality Net Charge-offs/ Avg Loans Non-performing Loans/ Loans * * As of December 31, 2009, accruing loans past due 90 days or more were reclassified from nonperforming loans to a separate category for all periods.
Slide 14: Non-performing Loans
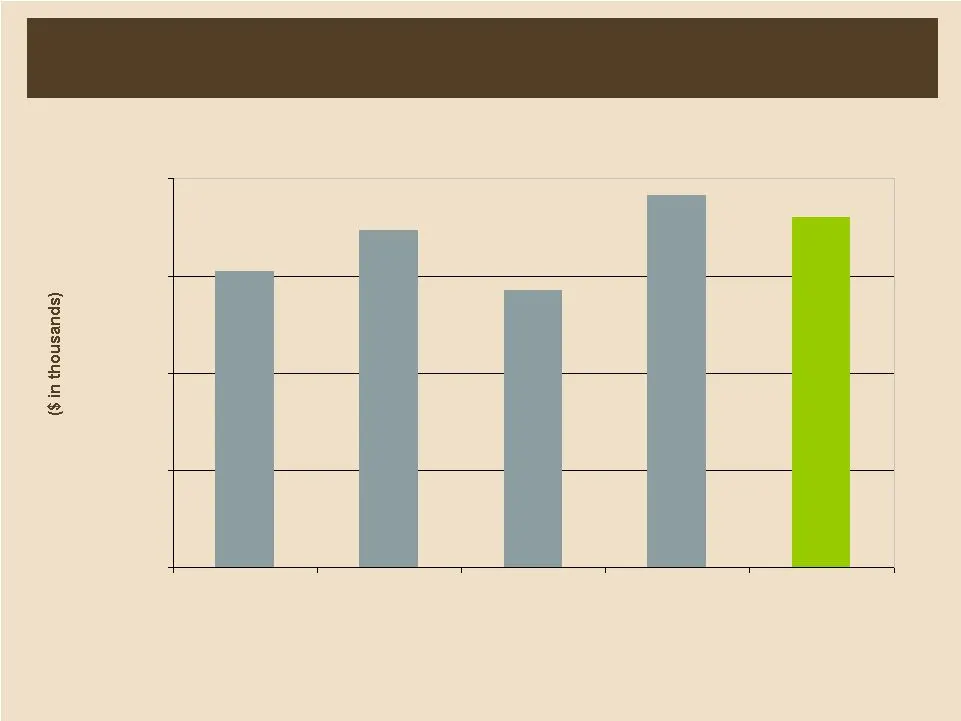
Non-performing Loans $34,698 $35,988 $28,552 $38,369 $30,531 $- $10,000 $20,000 $30,000 $40,000 Q4 08 Q1 09 Q2 09 Q3 09 Q4 09
Slide 15: Commercial Loan Delinquencies
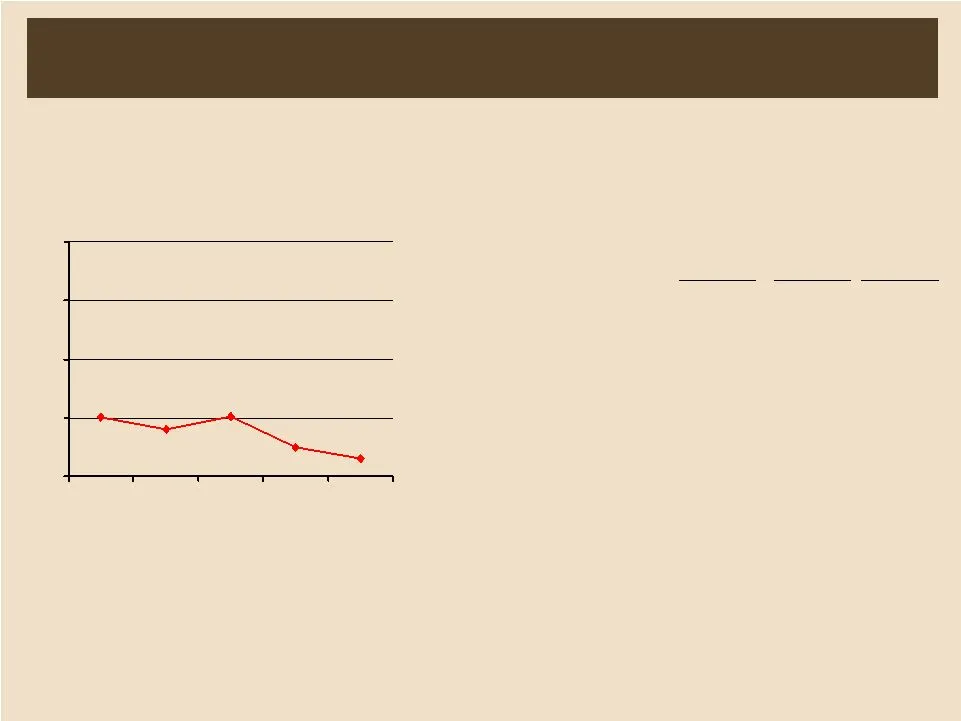
Commercial Loan Delinquencies Q4 08 Q1 09 Q2 09 Q3 09 Q4 09 30 Day + Delinquencies Trend ($ in thousands) Q4 09 Q3 09 Q4 08 EOP Portfolio 115,431 $ 107,034 $ 135,534 $ Net charge-offs/(Recoveries $) (1,943) $ $ 5,839 $ Net charge-offs (%) N/A Nonperforming ($) $ $ 5,643 $ Nonperforming (%)
Slide 16: Commercial Real Estate Loan Delinquencies
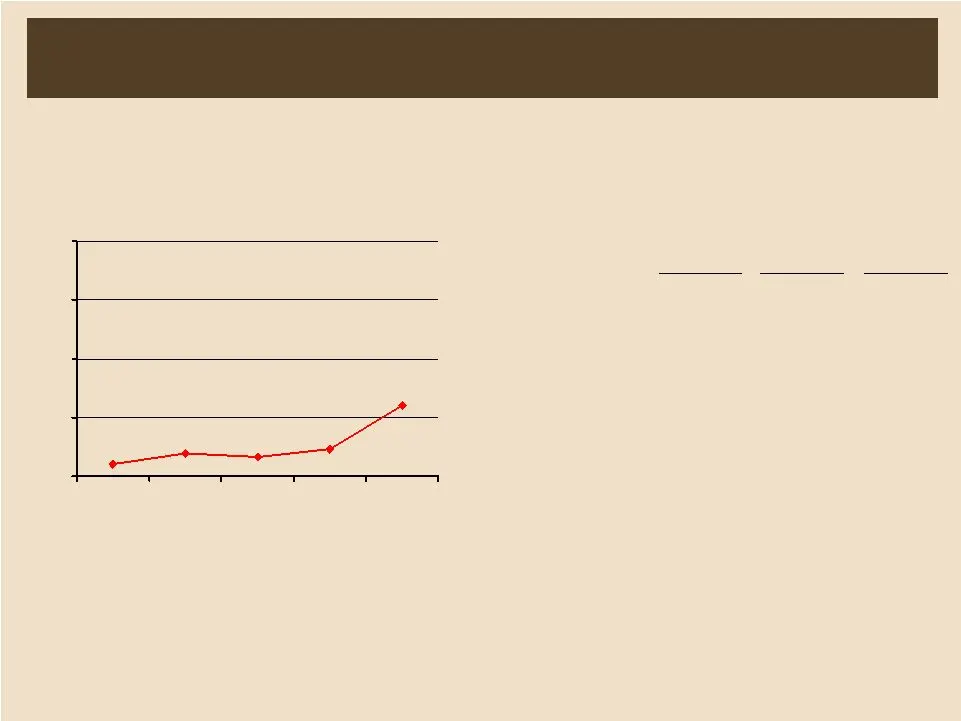
Commercial Real Estate Loan Delinquencies * Q4 08 Q1 09 Q2 09 Q3 09 Q4 09 30 Day + Delinquencies Trend ($ in thousands) * As of December 31, 2009, land loans were reclassified from commercial real estate to real estate construction for all periods. Q4 09 Q3 09 Q4 08 EOP Portfolio 259,480 $ 253,634 $
Slide 17: Construction and Land Loan Delinquencies
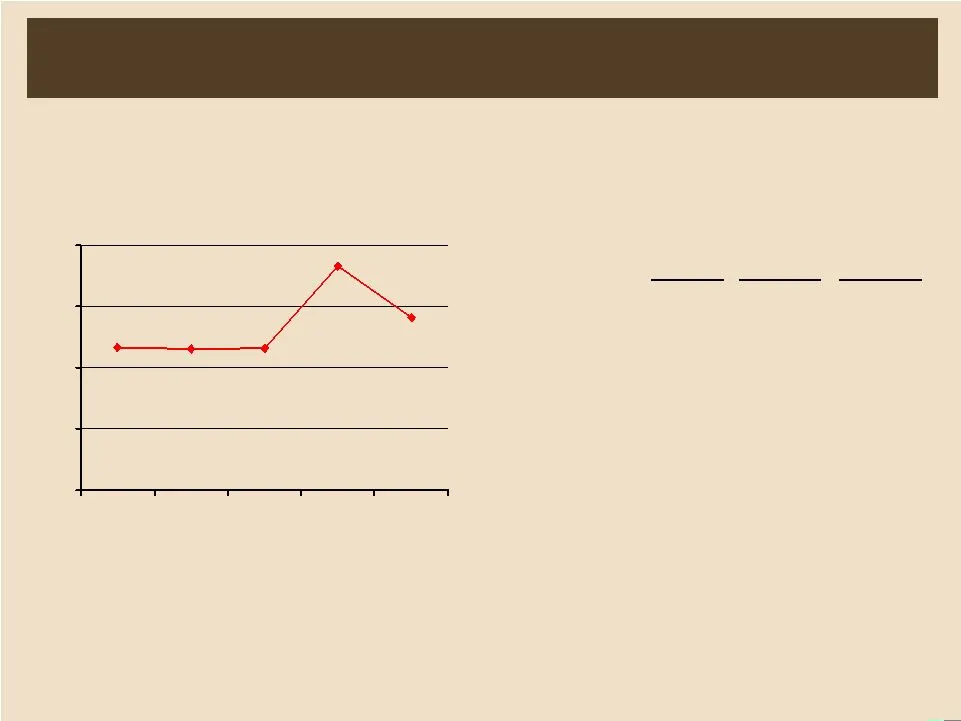
Construction and Land Loan Delinquencies * Q4 08 Q1 09 Q2 09 Q3 09 Q4 09 30 Day + Delinquencies Trend ($ in thousands) * As of December 31, 2009, land loans were reclassified from commercial real estate to real estate construction for all periods. Q4 09 Q3 09 Q4 08 EOP Portfolio 87,008 $ 118,513 $ 1
Slide 18: Residential First Mortgage Loan Delinquencies
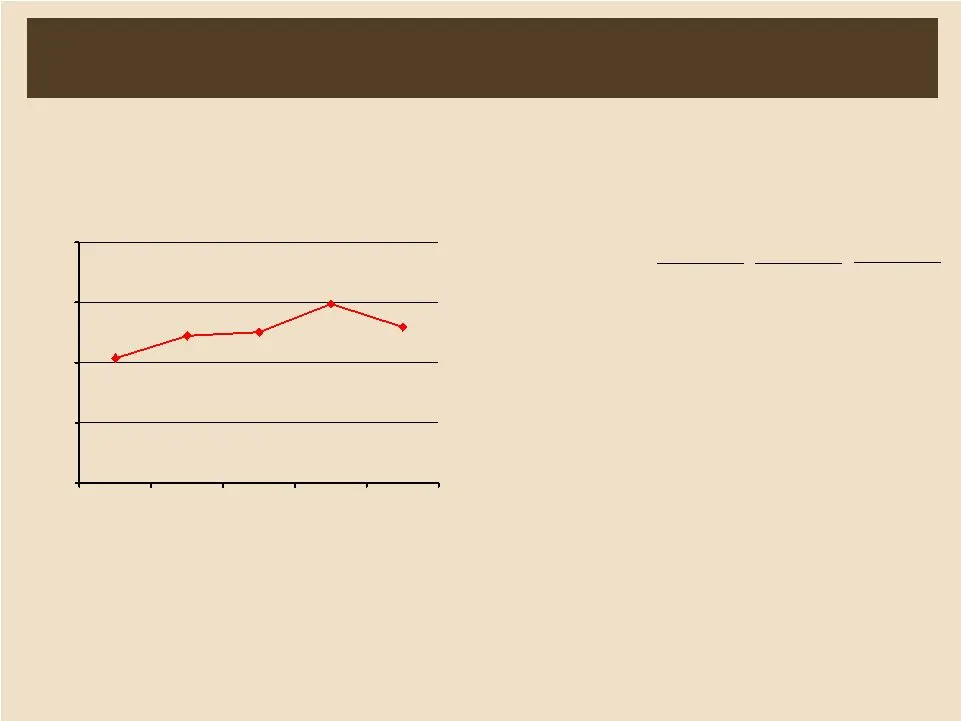
Residential First Mortgage Loan Delinquencies Q4 08 Q1 09 Q2 09 Q3 09 Q4 09 30 Day + Delinquencies Trend ($ in thousands) Q4 09 Q3 09 Q4 08 EOP Portfolio 222,337 $ 228,090 $ 241,969 $ Net charge-offs ($) $ $ $ Net charge-offs (%) Nonperforming ($) 7,437 $ 5,774 $ 3,581 $ Nonperforming (%)
Slide 19: Residential Second Mortgage Loan Delinquencies
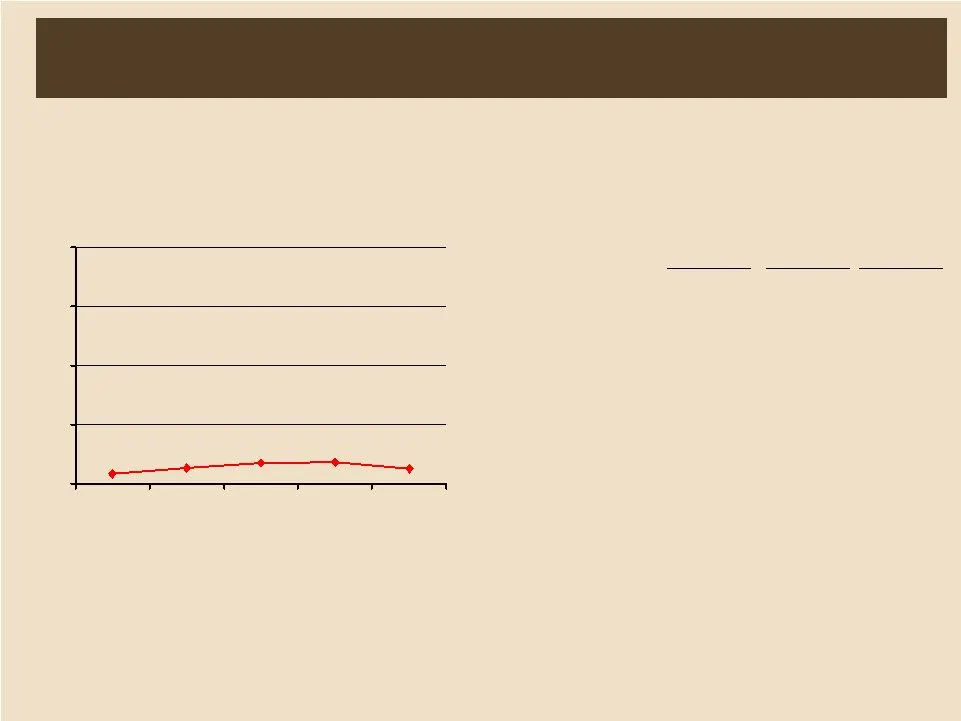
Residential Second Mortgage Loan Delinquencies Q4 08 Q1 09 Q2 09 Q3 09 Q4 09 30 Day + Delinquencies Trend ($ in thousands) Q4 09 Q3 09 Q4 08 EOP Portfolio 291,433 $ 292,265 $ 302,141 $ Net charge-offs ($) $ $ $ Net charge-offs (%) Nonperforming ($) $ $ $ Nonperforming (%)
Slide 20: Home Equity Lines of Credit Delinquencies
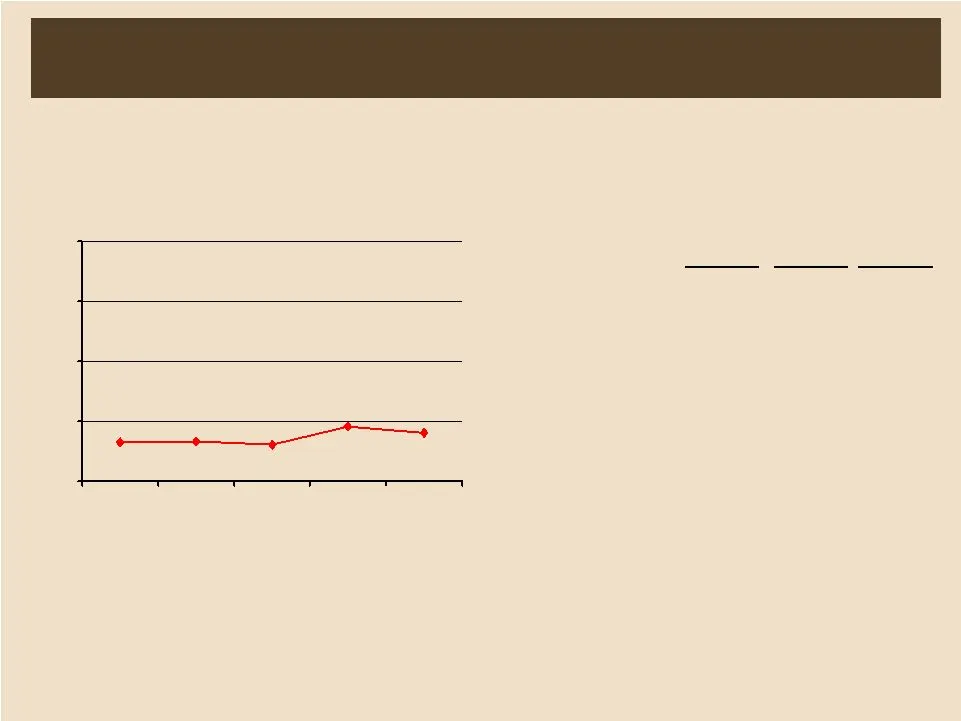
Home Equity Lines of Credit Delinquencies Q4 08 Q1 09 Q2 09 Q3 09 Q4 09 30 Day + Delinquencies Trend ($ in thousands) Q4 09 Q3 09 Q4 08 EOP Portfolio 74,356 $ 76,369 $ 82,555 $ Net charge-offs ($) $ $ $ Net charge-offs (%) Nonperforming ($) $ $ $ Nonperforming (%)
Slide 21: Allowance By Loan Category
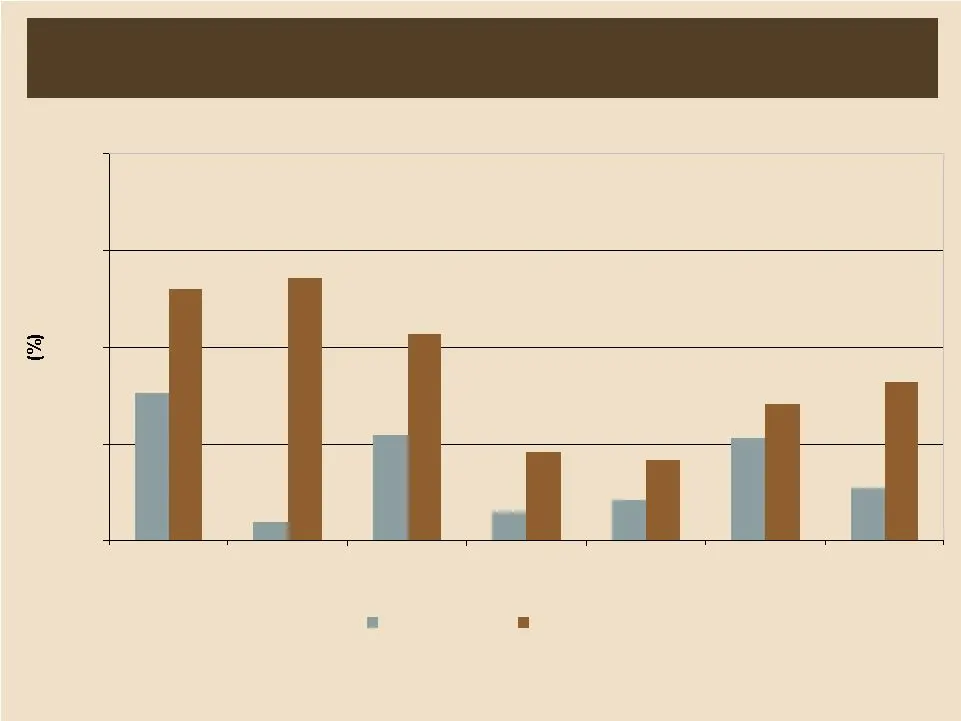
Allowance By Loan Category 1.64 0.64 1.60 0.83 0.29 0.45 2.29 4.08 1.26 2.12 2.46 3.19 1.38 3.91 0.00 1.50 3.00 4.50 6.00 Commercial Commercial RE Construction Res 1st Lien Res 2nd Lien HELOC Total 3-Yr Avg Loss Allowance/Loans December 31, 2009
Slide 22: Capital Ratios
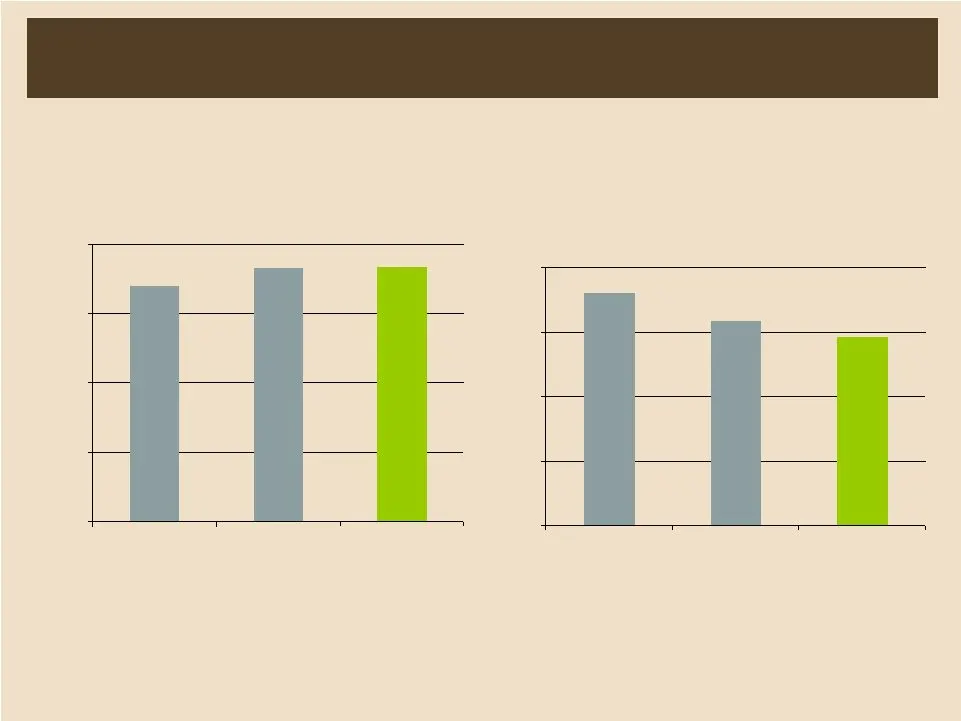
Capital Ratios Tier 1 Risk Based Capital Tangible Common Equity to Tangible Assets Tangible common equity: $116.5 million December 31, 2009

Slide 23: Encore Trust, Linscomb & Williams, Encore Country
ENCORETRUST —Linscomp & Wituiams — RWN&GQUNTRY

Slide 24: Commercial Banking Initiative
Commercial Banking Initiative • Take advanta g e of market opportunities • Attract additional experienced commercial and private bankers • Levera g e local decision makin g and local contacts • Expand mar g in and diversify portfolio

Slide 25: Investment Considerations
Investment Considerations • Relatively low market valuation • Capacity for mar g in improvement • Stron g capital position • Growin g franchise in Texas • Si g nificant revenue from wealth mana g ement and insurance • Commercial bankin g initiative
Slide 26
Source: SEC EDGAR · 8-K filed Feb 9, 2010
More decks from Encore Bancshares Inc
 Gulf South Bank Conference 201127 slides · May 10, 2011
 Investor Presentation (March 2011)24 slides · Mar 3, 2011
 KBW Texas Field Trip (February 2011)24 slides · Feb 8, 2011
 Macquarie Small & Mid Cap Conference 201021 slides · Jun 16, 2010
 Gulf South Bank Conference (May 2010)21 slides · May 5, 2010
 Investor Presentation (November 2009)25 slides · Nov 4, 2009