Teppco Partners LP — Investor Presentation (November 2005)
30 slides from Teppco Partners LP's investor presentation, Nov 3, 2005
Slide 1: TEPPCO Partners, L.P. Investor Presentation
TEPPCO Partners, L.P. Investor Presentation Ah! November 2005
Slide 2: Forward-looking Statements
Forward-looking Statements The material and information furnished in this presentation contains forward- looking statements within the meaning of certain provisions of the Federal Securities Laws. Forward-looking statements include projections, estimates, forecasts, plans, opportunities, strategies
Slide 3: TEPPCO Partners, L.P.
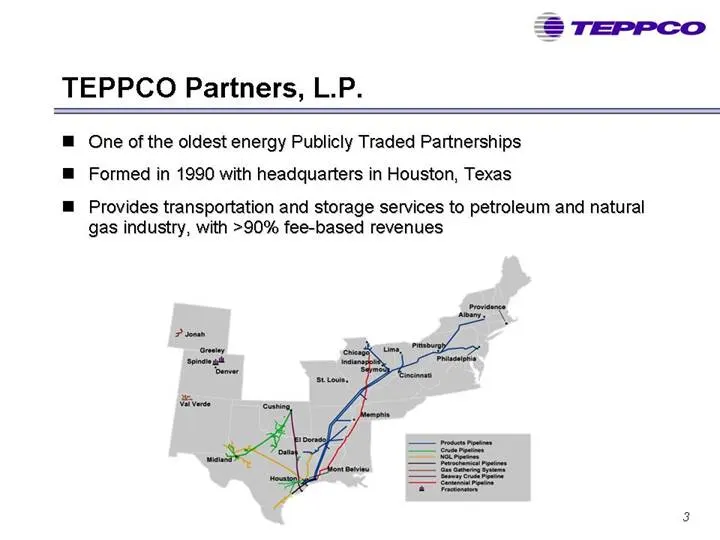
TEPPCO Partners, L.P. ™@ One of the oldest energy Publicly Traded Partnerships ™ Formed in 1990 with headquarters in Houston, Texas ™ Provides transportation and storage services to petroleum and natural gas industry, with >90% fee-based revenues
Slide 4: EPCO's purchase of the general partner
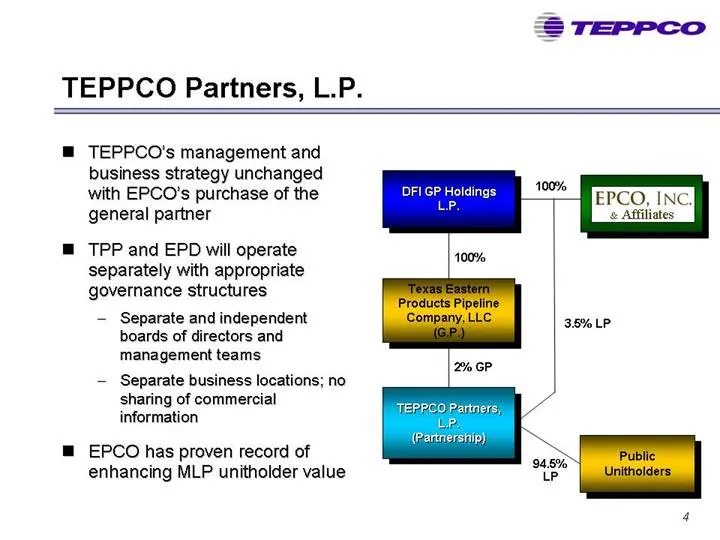
TEPPCO Partners, L.P. TEPPCO's management and business strategy unchanged with EPCO's purchase of the general partner TPP and EPD will operate separately with appropriate governance structures — Separate and independent boards of directors and management teams Separate business locations; no. sharin
Slide 5: TEPPCO Corporate Strategy
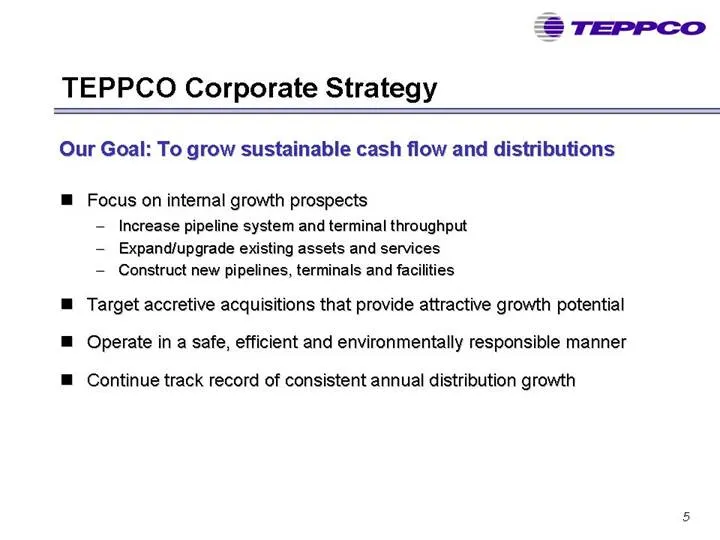
TEPPCO Corporate Strategy Our Goal: To grow sustainable cash flow and distributions ™ Focus on intemal growth prospects — Increase pipeline system and terminal throughput — Expand/upgrade existing assets and services — Construct new pipelines, terminals and facilities ™ Target accretive acquisitions
Slide 6: Volume Growth & Diversification
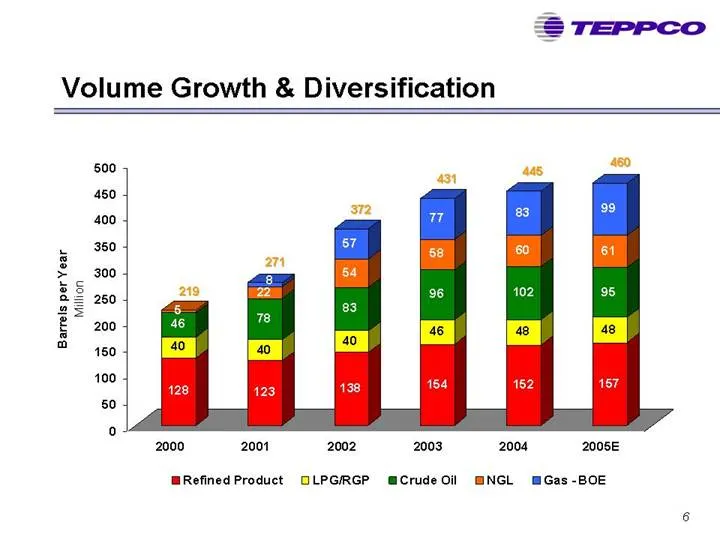
Volume Growth & Diversification Barrels per Year Million 2000 2001 2002 2003 2004 2005E Refined Product OLPGRGP @CrudeOil GNGL mGas-BOE
Slide 7: Consistent EBITDA Growth
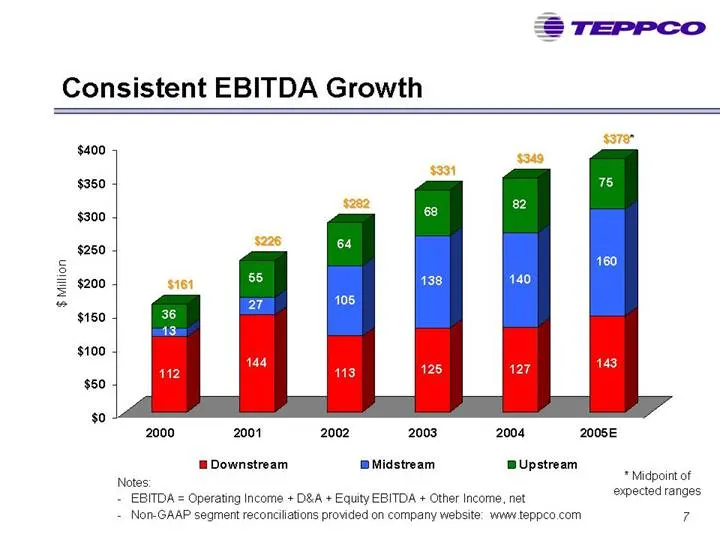
Consistent EBITDA Growth $400 $350 $300 $250 $200 $ Million $150 $100 $60 $0 2000 2001 2002 2003 2004 2008 ™ Downstream Midstream BUpstream * Midpoint of Notes: = EBITDA = Operating Income + D8A + Equity EBITDA + Other Income, net amrporedmanges Non-GAAP segment reconciliations provided on company w
Slide 8: TEPPCO's Three Business Segments
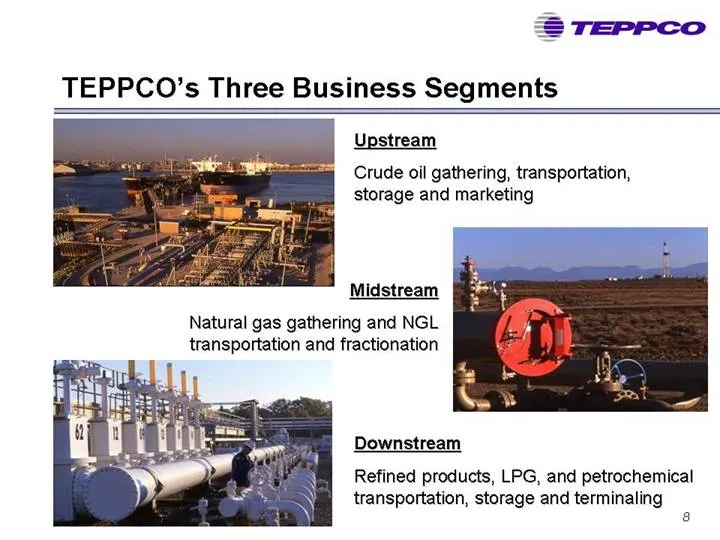
TEPPCO TEPPCO’s Three Business Segments Upstream Crude oil gathering, transportation, storage and marketing Midstream Natural gas gathering and NGL transportation and fractionation Downstream Refined products, LPG, and petrochemical transportation, storage and terminaling a
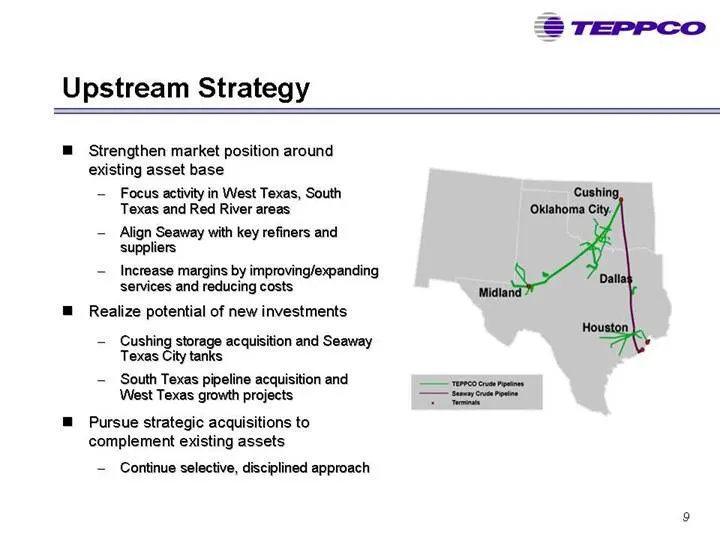
Slide 9: Upstream Strategy
Upstream Strategy ™ Strengthen market position around existing asset base — Focus activity in West Texas, South Texas and Red River areas ~ Align Seaway with key refiners and suppliers — Increase margins by improving/expanding services and reducing costs ™ Realize potential of new investments. — Cus
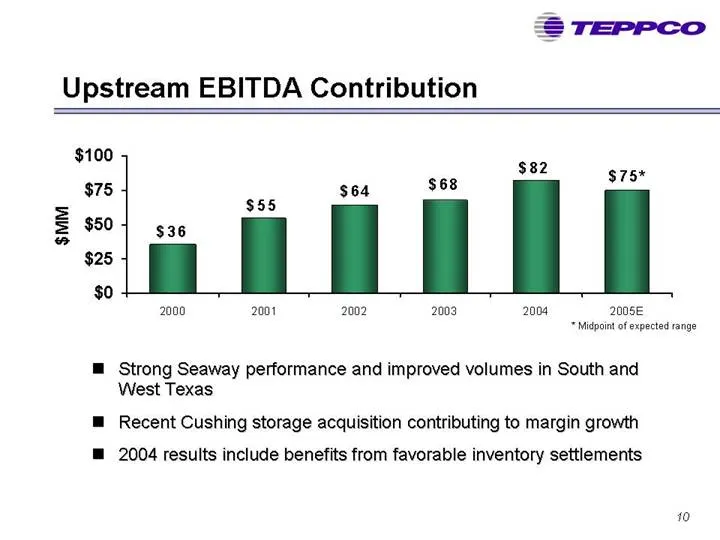
Slide 10: Upstream EBITDA Contribution
Upstream EBITDA Contribution $100 $75 $64 #68 $50 $36 =| fl $0 + 2000 2001 2002 200 2004 2008 * Midpoint of expected range $MM o o a ™ Strong Seaway performance and improved volumes in South and West Texas ™ Recent Cushing storage acquisition contributing to margin growth ™ 2004 results include bene
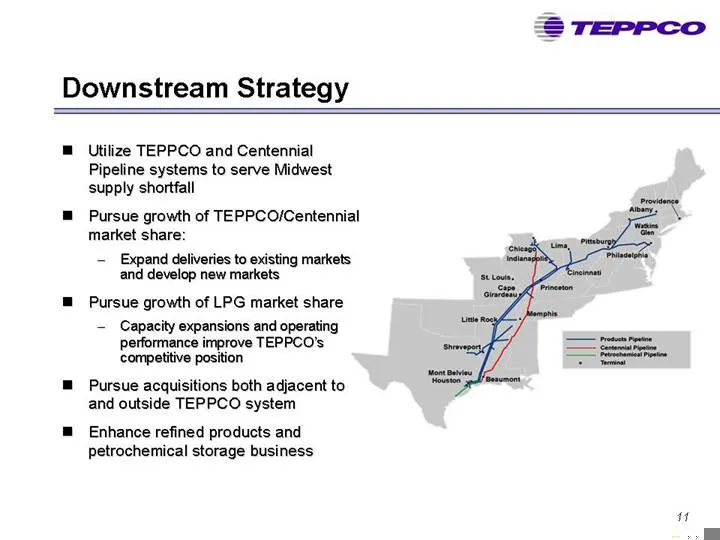
Slide 11: Downstream Strategy
Downstream Strategy ™ Utilize TEPPCO and Centennial Pipeline systems to serve Midwest supply shortfall ™ Pursue growth of TEPPCO/Centennial market share: ~ Expand deliveries to existing markets and develop new markets ™ Pursue growth of LPG market share — Capacity expansions and operating performanc
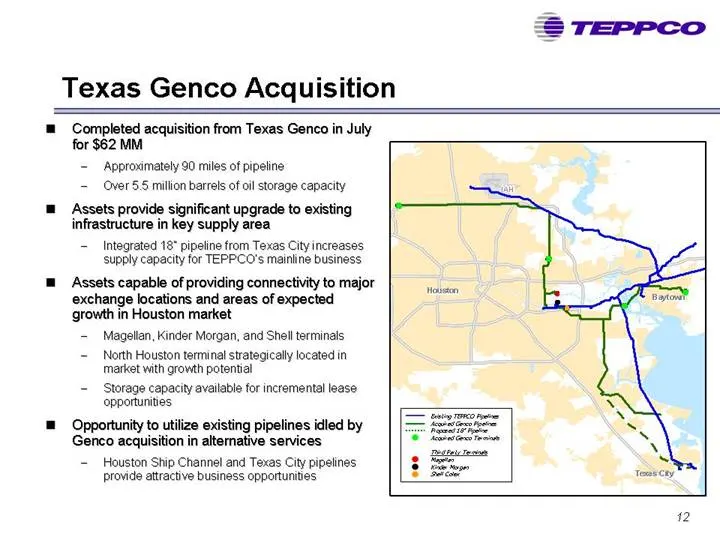
Slide 12: Texas Genco Acquisition
Texas Genco Acquisition Completed acquisition from Texas Genco in July for $62 MM = Approximately 90 miles of pipeline - Over5.5 million barrels of oil storage capacity Assets provide significant upgrade to existing infrastructure in key supply area Integrated 18* pipeline from Texas City increases
Slide 13: Downstream EBITDA Contribution
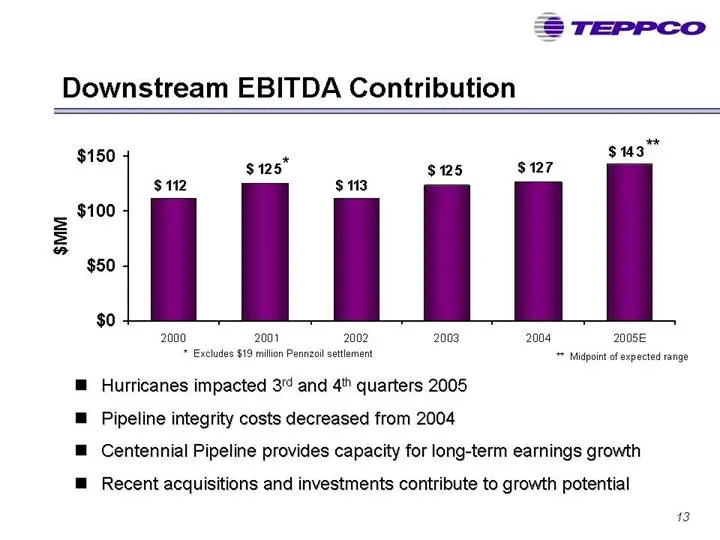
Downstream EBITDA Contribution #150 $125" $125 $127 $112 $113 s $100 = s $50 $o + 2000 2001 2002 2008 2008 2005 * Exclides $19 milion Pennzoil atlement * Midpoint of expected range ™ Hurricanes impacted 3 and 4" quarters 2005 ™ Pipeline integrity costs decreased from 2004 ™ Centennial Pipeline provi
Slide 14: Midstream Strategy
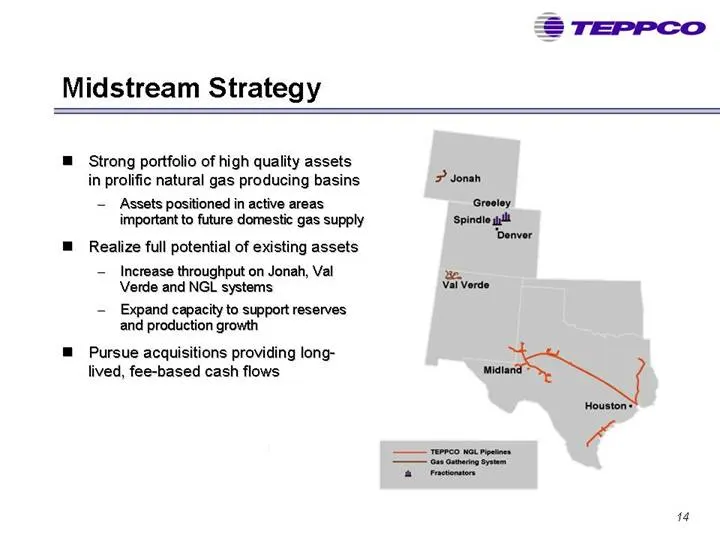
Midstream Strategy Strong portfolio of high quality assets in prolific natural gas producing basins — Assets positioned in active areas important to future domestic gas supply ™ Realize full potential of existing assets — Increase throughput on Jonah, Val Verde and NGL systems — Expand capacity to s
Slide 15: Val Verde Gas Gathering System
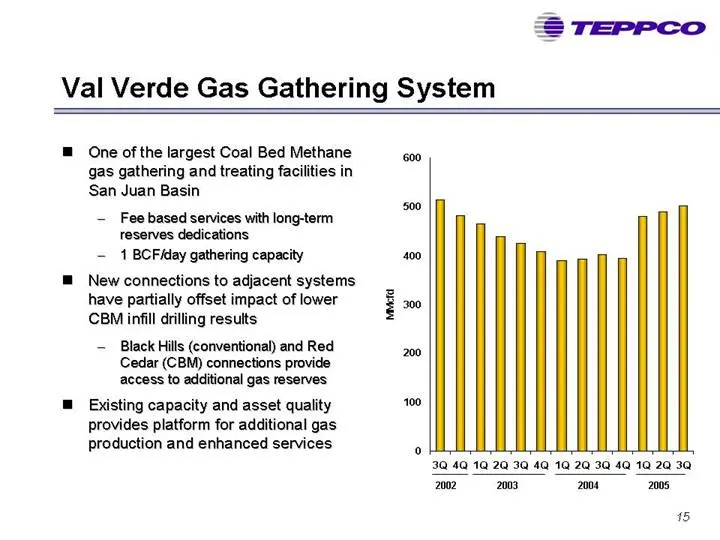
Val Verde Gas Gathering System ™ One of the largest Coal Bed Methane gas gathering and treating facilities in San Juan Basin — Fee based services with long-term reserves dedications — 1BCFiay gathering capacity ™ New connections to adjacent systems have partially offset impact of lower CBM infill dr
Slide 16: Jonah Gas Gathering System
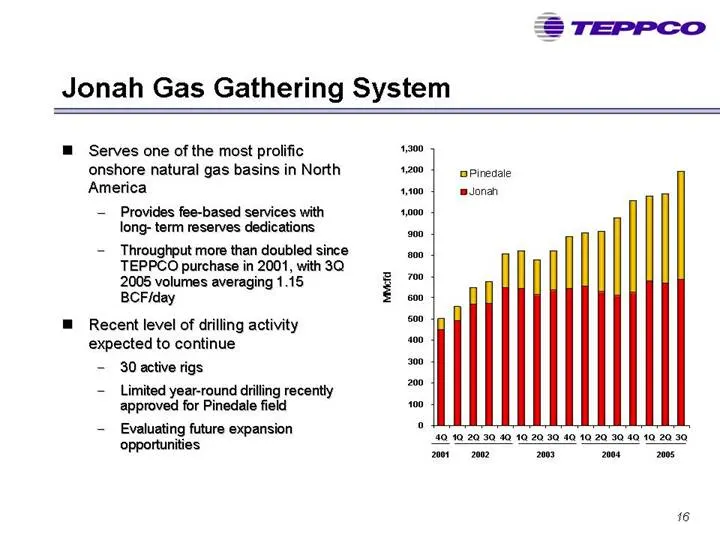
Jonah Gas Gathering System ™ Serves one of the most prolific 1900 onshore natural gas basins in North —_ Pinedale America mona — Provides fee-based services with long- term reserves dedications — Throughput more than doubled since TEPPCO purchase in 2001, with 30 2005 volumes averaging 1.15 BCFiday
Slide 17: Jonah System Phase IV Expansion Project
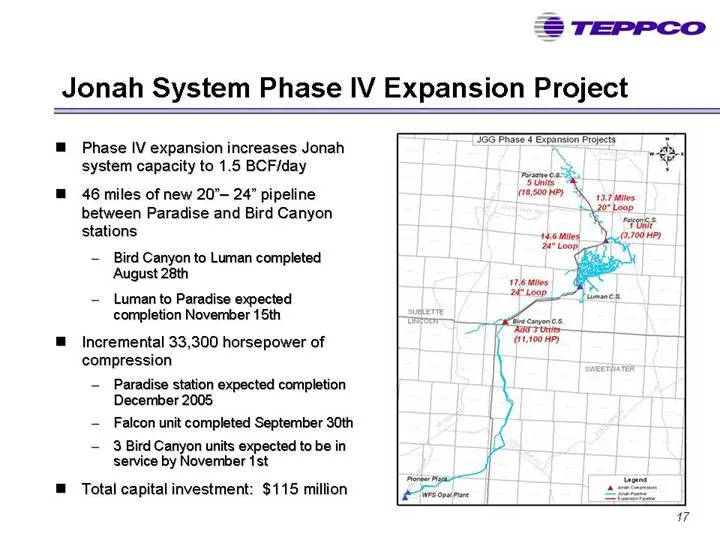
Jonah System Phase IV Expansion Project ™ Phase IV expansion increases Jonah system capacity to 1.5 BCF/day ® 46 miles of new 20"— 24” pipeline between Paradise and Bird Canyon stations ~ Bird Canyon to Luman completed August 28th — Luman to Paradise expected completion November 15th | Incremental 3
Slide 18: Midstream EBITDA Contribution
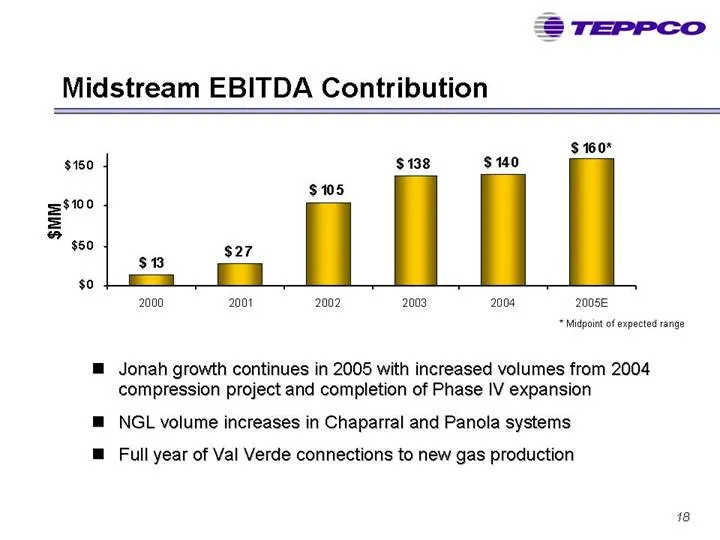
Midstream EBITDA Contribution $160" $150 $138 $140 $105 =5100 = e $50 6 $27 o La 2000 2001 2002 2003 2004 2005 * Midpoint of expected range ™@ Jonah growth continues in 2005 with increased volumes from 2004 compression project and completion of Phase IV expansion ™ NGL volume increases in Chaparral
Slide 19: Diversified Organic Growth
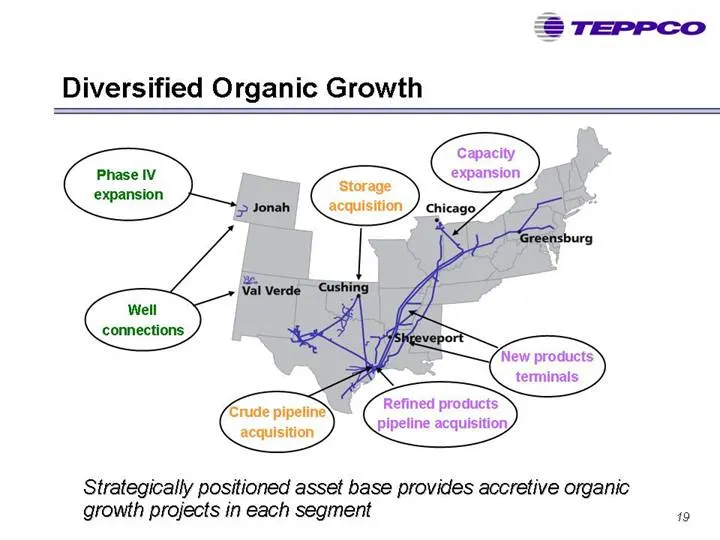
Ah Diversified Organic Growth Capacity expansion Ui, New —<— —<— Refined oe oe acquisition, Strategically positioned asset base provides accretive organic growth projects in each segment Tr €rude pipeline acquisition
Slide 20: Balance Sheet
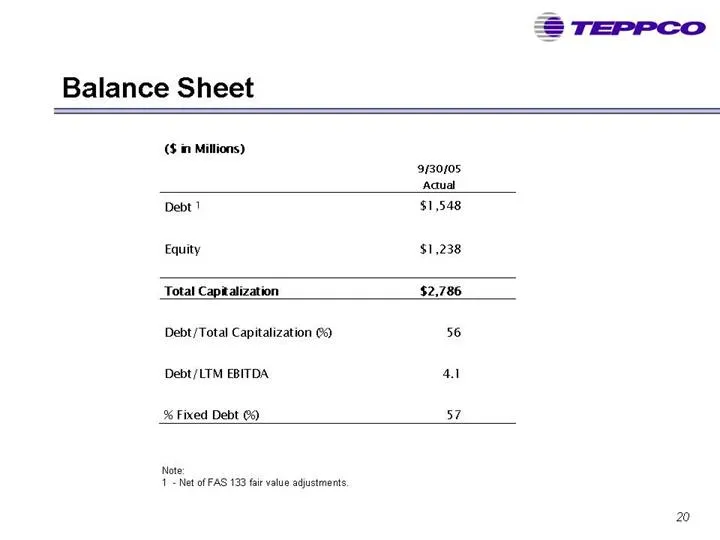
Balance Sheet Ah! 9/30/05 ‘Aaual Debt! $1,548 Equity $1,238 Total Capitalization $2,786 Debt /Total Capitalization 06) 56 Debt/LTM EBITDA, al 96 Fixed Debt ©) 57. Note 1 Net of FAS 133 fair value adjustments
Slide 21: TEPPCO: 2005 Outlook
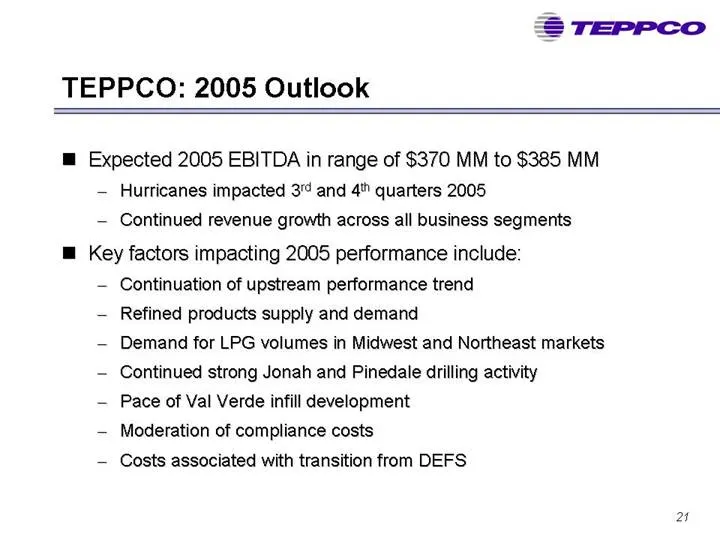
TEPPCO: 2005 Outlook m@ Expected 2005 EBITDA in range of $370 MM to $385 MM Hurricanes impacted 3” and 4" quarters 2005 Continued revenue growth across all business segments ™ Key factors impacting 2005 performance include: Continuation of upstream performance trend Refined products supply and deman
Slide 22: Consistent Distribution Growth
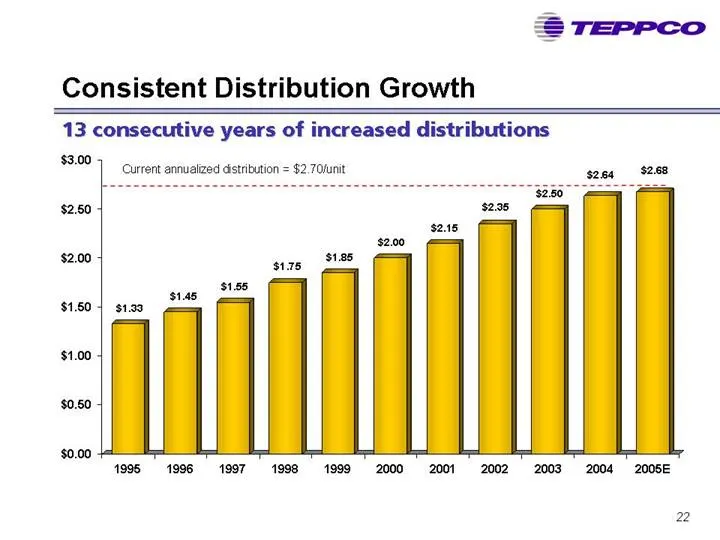
Consistent Distribution Growth 13 consecutive years of increased distributions $3.00 $2.50 $2.00 1995 1996 1997 1998 1999 2000 200120022003 2004 2005E 2
Slide 23: TEPPCO www.teppco.com
‘th TEPPCOoO NYSE: TPP www.teppco.com
Slide 24: Reconciliation of Non-GAAP Measures
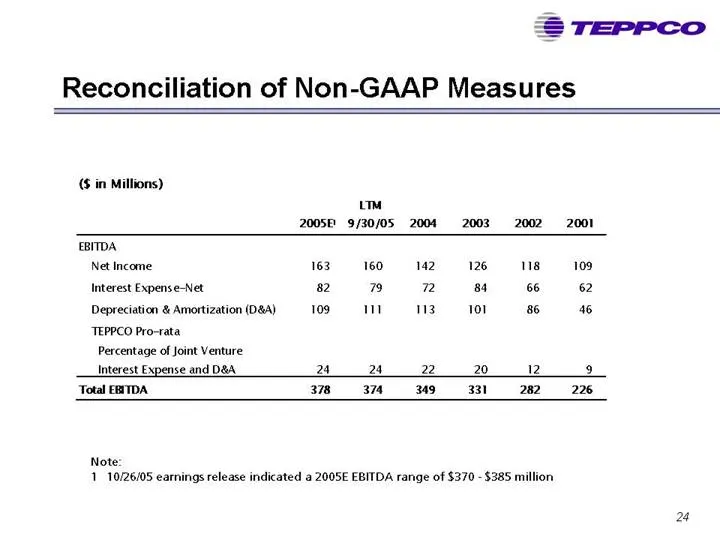
Reconciliation of Non-GAAP Measures ($ in Millions) um 20058 9/30/05 2004 200320022001 EBITDA Net Income 13-160, 42126-8109 Interest Expense-Net 82 7 R 84 66 62 Depreciation & Amortization (D&A) 109.30 86 46 TEPPCO Pro-rata Percentage of Joint Venture Interest Expense and D&A 24 2422 20 2 9 ‘Total E
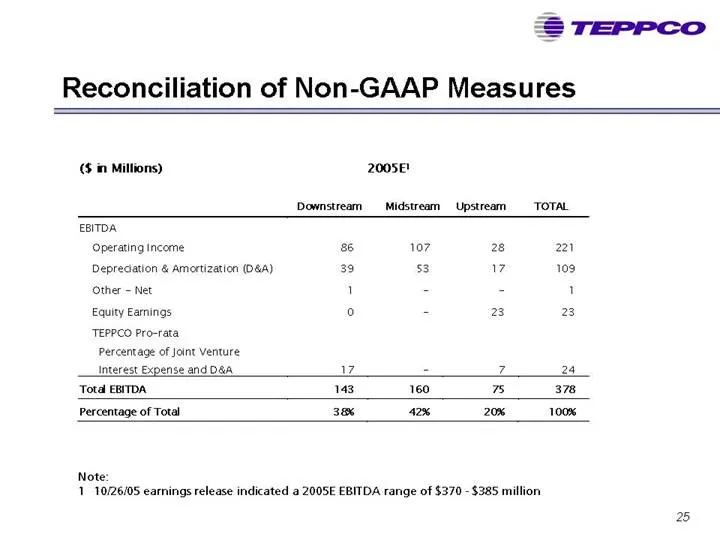
Slide 25: Reconciliation of Non-GAAP Measures
Reconciliation of Non-GAAP Measures (S in Millions) 20056! Downstream Midstream Upstream TOTAL EGITDA Operating income 86 107 28 2 Depredation & Amortization (06) 39 53 7 103 Other ~ Net 1 - # 1 Equity Earnings ° - 23 23 ‘TEPPCO Pro-rata Percentage of Joint Venture Interest Expense and D&A w = z 24
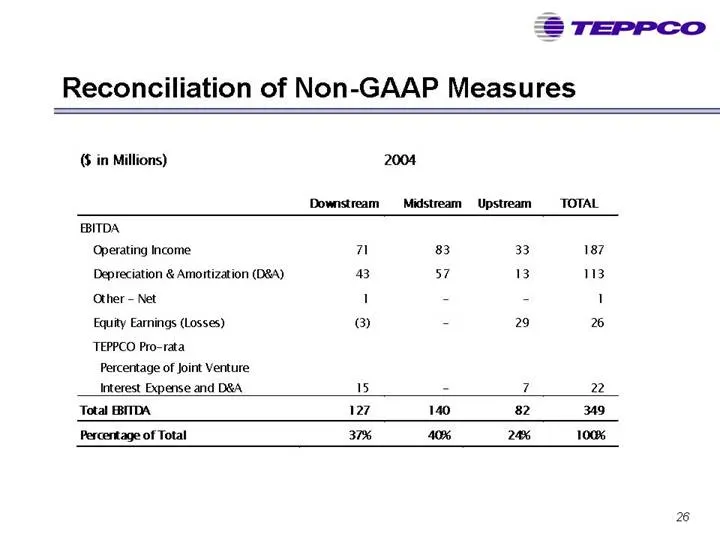
Slide 26: Reconciliation of Non-GAAP Measures 2004
Reconciliation of Non-GAAP Measures 6 in Millions) 2004 Downstream — Midstream Upstream TOTAL EBITDA Operating income a 83 33 187 Depreciation & Amortization (D&A) 43 37 13 13 Other Net 1 = 3 1 Equity Earnings (Losses) ro) = 29 26 TEPPCO Pro-rata Percentage of Joint Venture Interest Expense and D&A
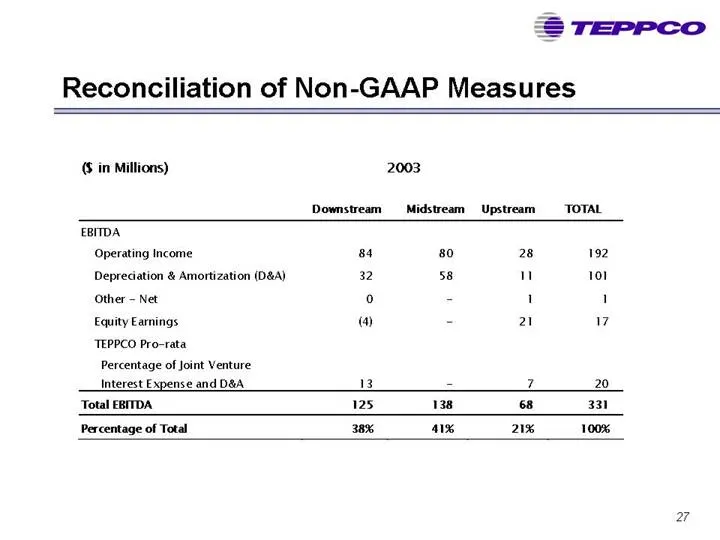
Slide 27: Reconciliation of Non-GAAP Measures 2003
Reconciliation of Non-GAAP Measures (S in Millions) 2003 Downstream Midstream Upstream TOTAL EBITDA Operating Income 84 80 28 192 Depreciation & Amortization (D&A) 32 58 n 101 Other — Net ° zs 1 1 Equity Earnings O - 21 7 TEPPCO Pro-rata Percentage of Joint Venture Interest Expense and D&A. 13 = 2 2
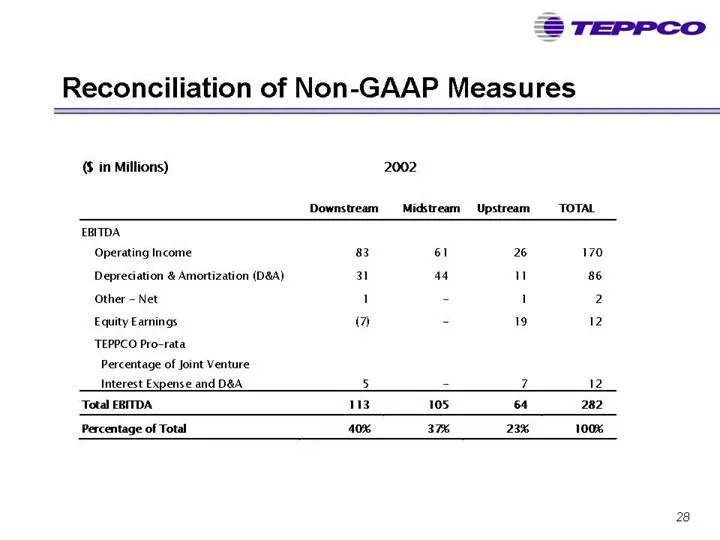
Slide 28: Reconciliation of Non-GAAP Measures 2002
Reconciliation of Non-GAAP Measures ($ in Millions) 2002 Downstream Midstream Upstream TOTAL EBITDA Operating Income 83 61 26 170 Depreciation & Amortization (D&A) 31 a4 u 86 Other ~ Net 1 = 1 2 Equity Earnings a - 19 2 TEPPCO Pro-rata Percentage of Joint Venture Interest Expense and D&A 5 = 7 2 ‘To
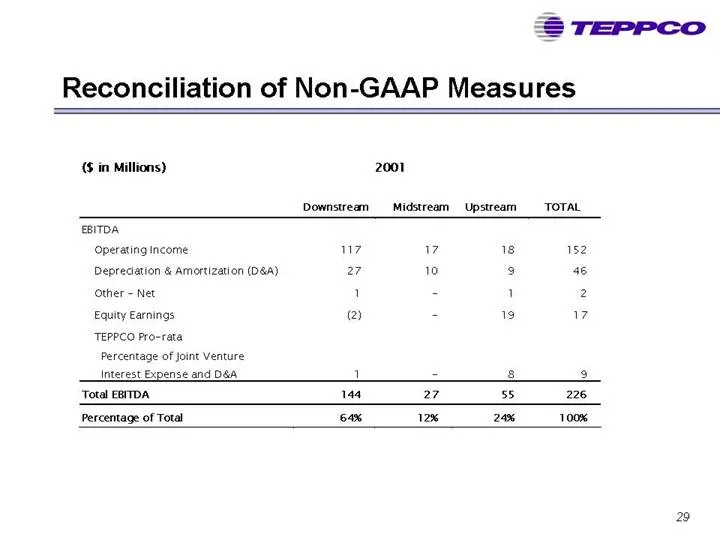
Slide 29: Reconciliation of Non-GAAP Measures 2001
Reconciliation of Non-GAAP Measures (S in Millions) 2001 Downstream Midstream Upstream TOTAL EBITDA Operating Income 7 7 18 152 Depreciation & Amortization (D&A) 7 10 9 46 other - Net 1 c 1 2 Equity Earnings @ - 19 7 TEPPCO Pro-rata Percentage of Joint Venture Interest Expense and D&A 1 = 8 2 ‘Total
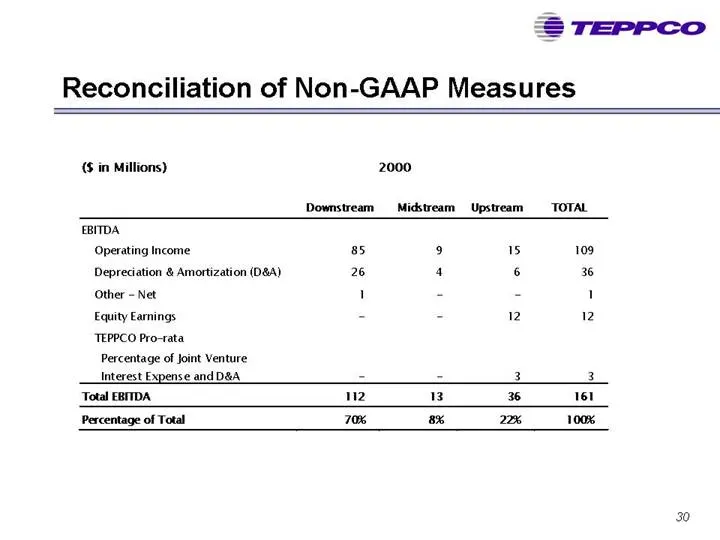
Slide 30: Searchable text section of graphics shown above
Searchable text section of graphics shown above [LOGO] TEPPCO Partners, L.P. Investor Presentation November 2005 Fo rward-looking Statements • The material and information furnished in this presentation contains forward-looking statements within the meaning of certain provisions of the Federal Secur
Source: SEC EDGAR · 8-K filed Nov 3, 2005
More decks from Teppco Partners LP
 Morgan Stanley MLP Reception (October 2009)26 slides · Oct 7, 2009
 Master Limited Partnerships Investor Conference (September 2009)27 slides · Sep 16, 2009
 Wells Fargo Retail Meeting (September 2009)27 slides · Sep 15, 2009
 Barclays Capital CEO Energy/Power Conference 200929 slides · Sep 9, 2009
 Merger or Acquisition (August 2009)29 slides · Aug 26, 2009
 Wachovia Securities Investor Presentation (June 2007)51 slides · Jun 1, 2007