Capital Bank Financial — Q4 2013 Earnings Presentation
22 slides from Capital Bank Financial's earnings presentation, Jan 23, 2014
Slide 1: 2013 Fourth Quarter Earnings
@® CAPITAL BANK FINANCIAL CORP 2013 Fourth Quarter Earnings January 23, 2014
Slide 2: Safe Harbor Statement
@© Safe Harbor Statement Forward-Looking Statements Information in this presentation contains forward-looking statements. Any statements about our expectations, beliefs, plans, predictions, forecasts, objectives, assumptions or future events or performance are not historical facts and may be forward
Slide 3: Our Path to Investor Returns
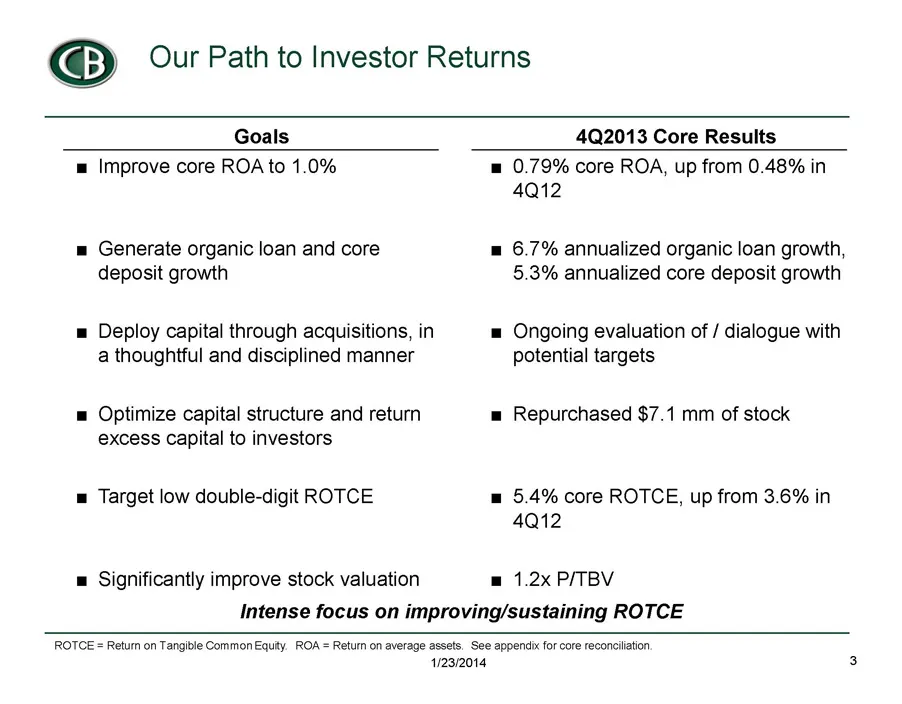
@© Our Path to Investor Returns Goals 4Q2013 Core Results m Improve core ROA to 1.0% = Generate organic loan and core deposit growth Deploy capital through acquisitions, in a thoughtful and disciplined manner = Optimize capital structure and return excess Capital to investors = Target low double-dig
Slide 4: The Capital Bank Story
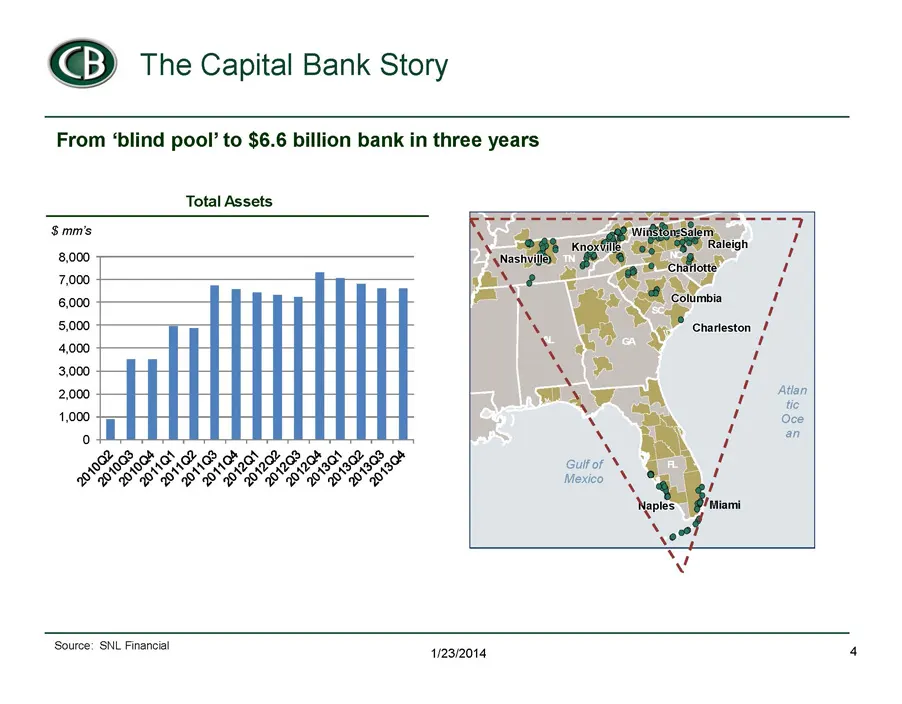
@© The Capital Bank Story From ‘blind pool’ to $6.6 billion bank in three years Total Assets sms —i(i‘séSOS™*™*;*;”;”;C;C;*C*WR Wit aN Kn leigh # 8,000 *\Nast h fs of Food 100: — < a S00 Columbia i 1 5000; > 4g Charleston 7 4,000 aN yy 3,000 : 2,000 wiw ny {Aten 1,000 os oll ar si <x GS 54 D PSSA to
Slide 5: We've Built One Bank out of Seven Acquisitions
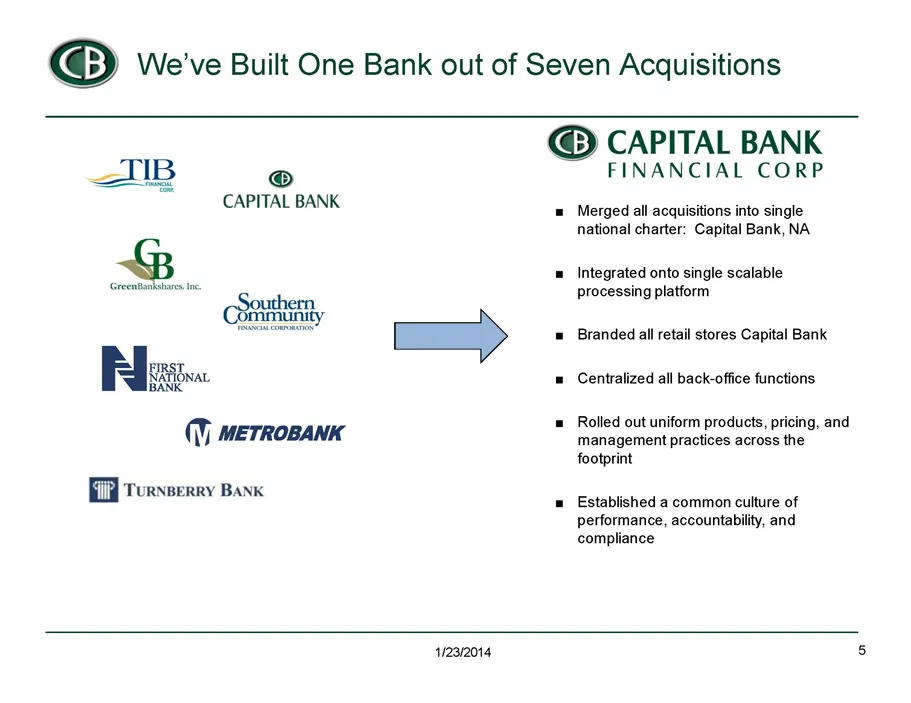
@© We've Built One Bank out of Seven Acquisitions IIB x teres Ine He b NATIONAL BANK () METROBANK © CAPITAL BANK El Terneerry Bank @© CAPITAL BANK FINANCIAL CORP Merged all acquisitions into single national charter: Capital Bank, NA Integrated onto single scalable processing platform Branded all ret
Slide 6: Fourth Quarter Highlights
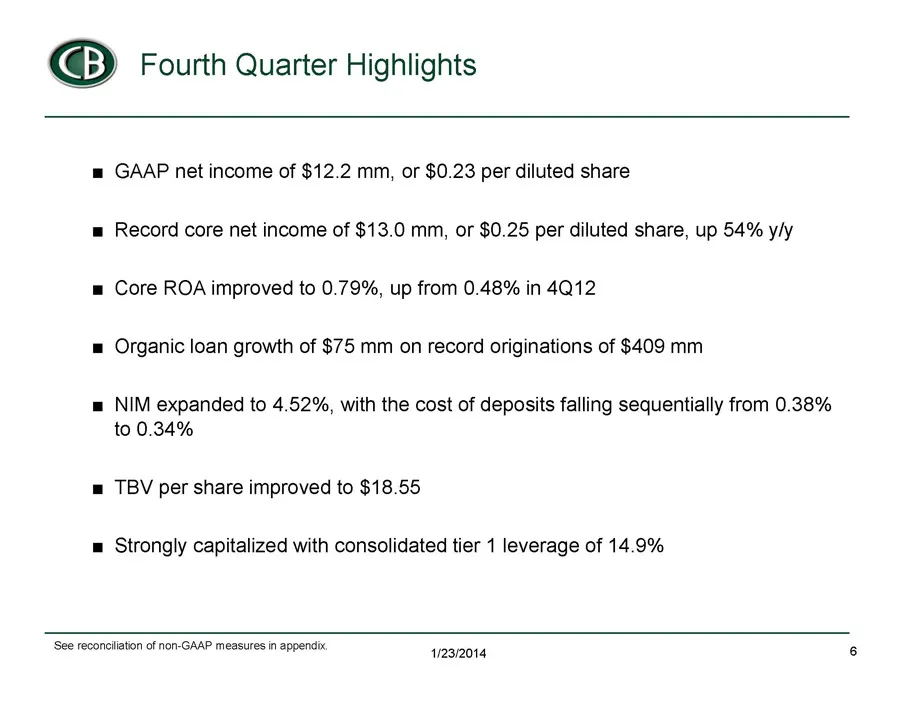
@©) Fourth quarter Highlights m GAAP net income of $12.2 mm, or $0.23 per diluted share m Record core net income of $13.0 mm, or $0.25 per diluted share, up 54% y/y = Core ROA improved to 0.79%, up from 0.48% in 4Q12 = Organic loan growth of $75 mm on record originations of $409 mm m NIM expanded to
Slide 7: Fourth Quarter Core Earnings Summary
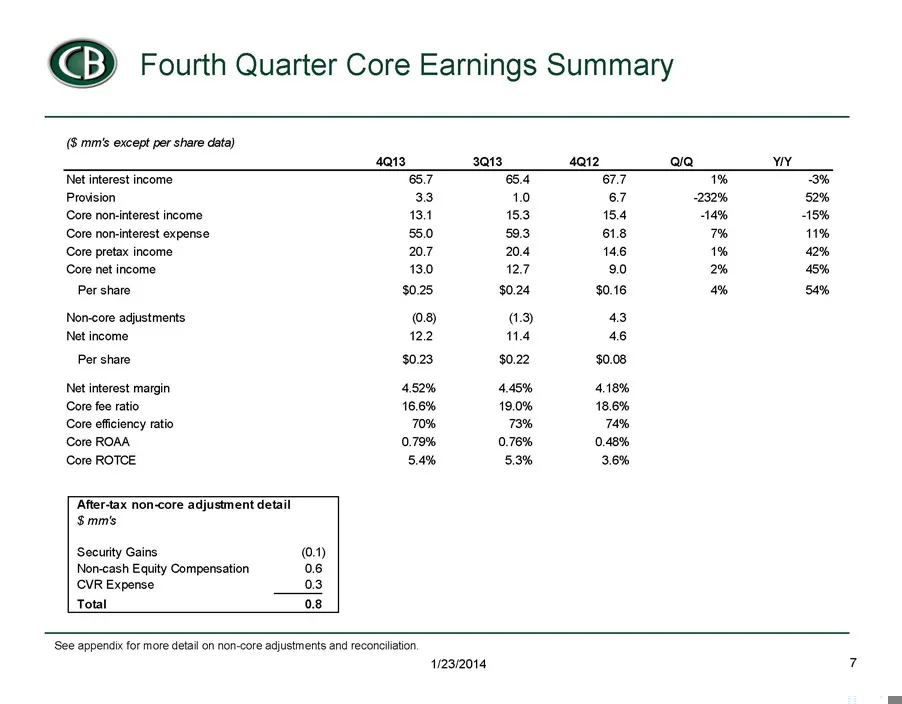
@© Fourth Quarter Core Earnings Summary (S mms except per share data) 4Q13 3013 4012 aa Net interest income 7 4 a7 1% 3% Provision 33 10 67 232% 52% Core noninterest income 13.4 153 18.4 14% 15% Core non-interest expense 55.0 59.3 618 7% 11% Core pretax income 207 204 146 1% 42% Core net income 130
Slide 8: New Loan Production +62% Y/Y
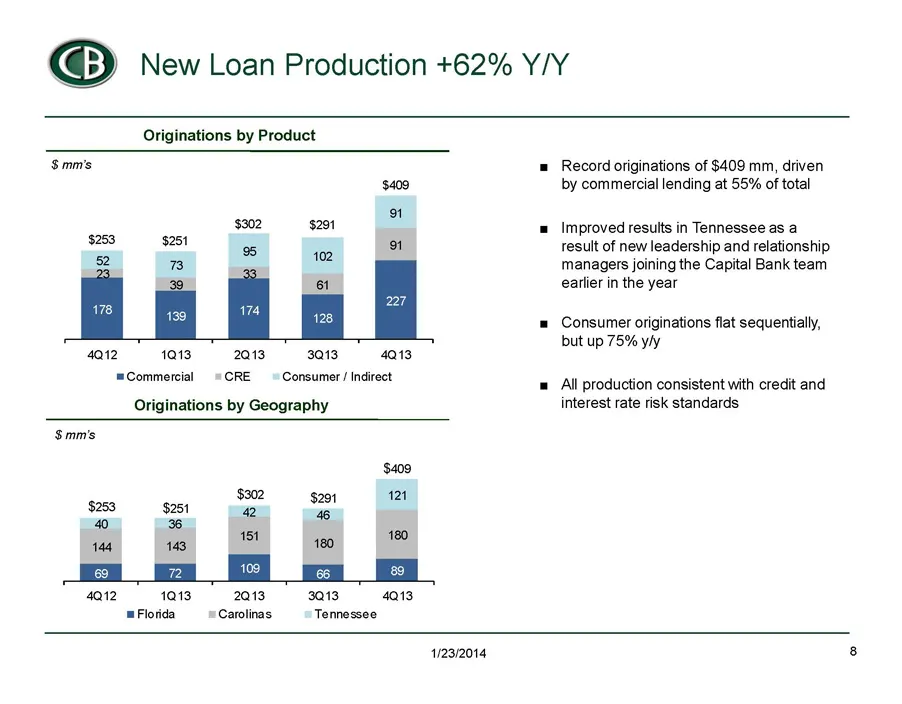
@©) ‘New Loan Production +62% Y/Y Originations by Product $mm's = Record originations of $409 mm, driven $409 by commercial lending at 55% of total a) $302 $291 = Improved results in Tennessee as a $253 $251 3 7 1 result of new leadership and relationship a 73 managers joining the Capital Bank team
Slide 9: Loan Portfolio +6.7% Annualized in 4Q
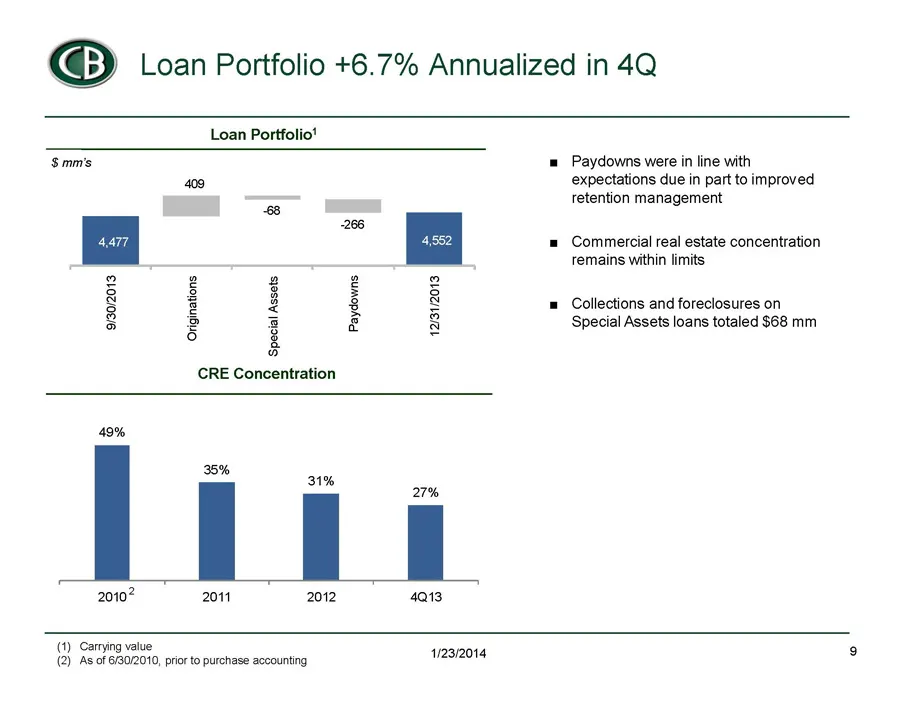
@©) (can Portfolio +6.7% Annualized in 4Q = Paydowns were in line with expectations due in part to improved retention management = Commercial real estate concentration remains within limits = Collections and foreclosures on Special Assets loans totaled $68 mm Loan Portfoliot Smm's 09 r 288 4 2 @ ¢ 8
Slide 10: Continued Improvement in Deposit Quality and Cost
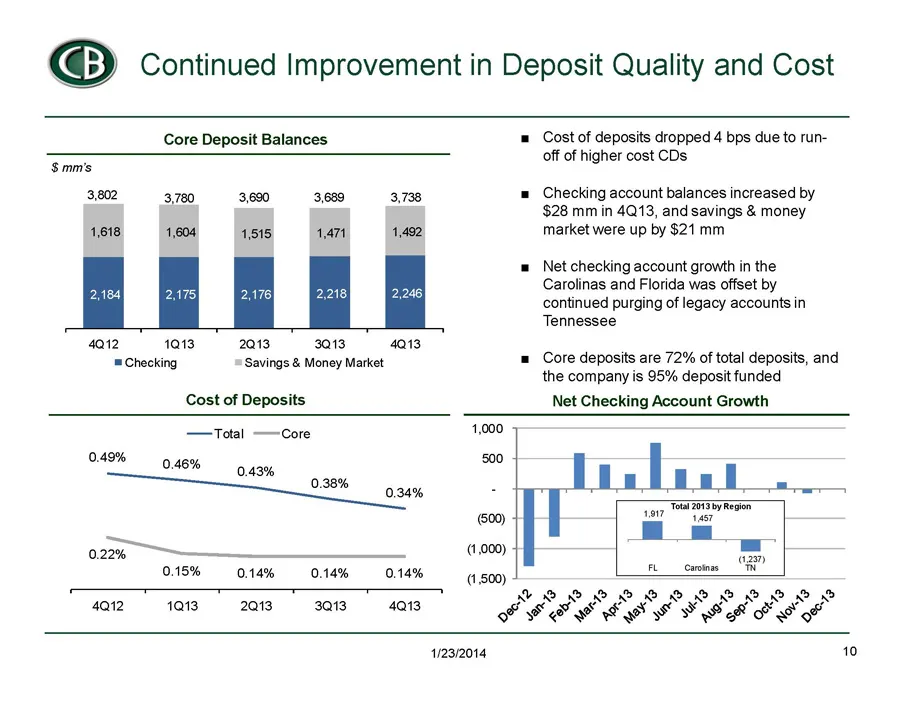
@© Continued Improvement in Deposit Quality and Cost Core Deposit Balances Simms 3,802 3,780 3,690 3,689 3,738 1,618 1,604 1.515 4.471 1,492 = Cost of deposits dropped 4 bps due to run- off of higher cost CDs = Checking account balances increased by $28 mm in 4Q13, and savings & money market were up
Slide 11: NIM Improves Despite Lower Loan Yields
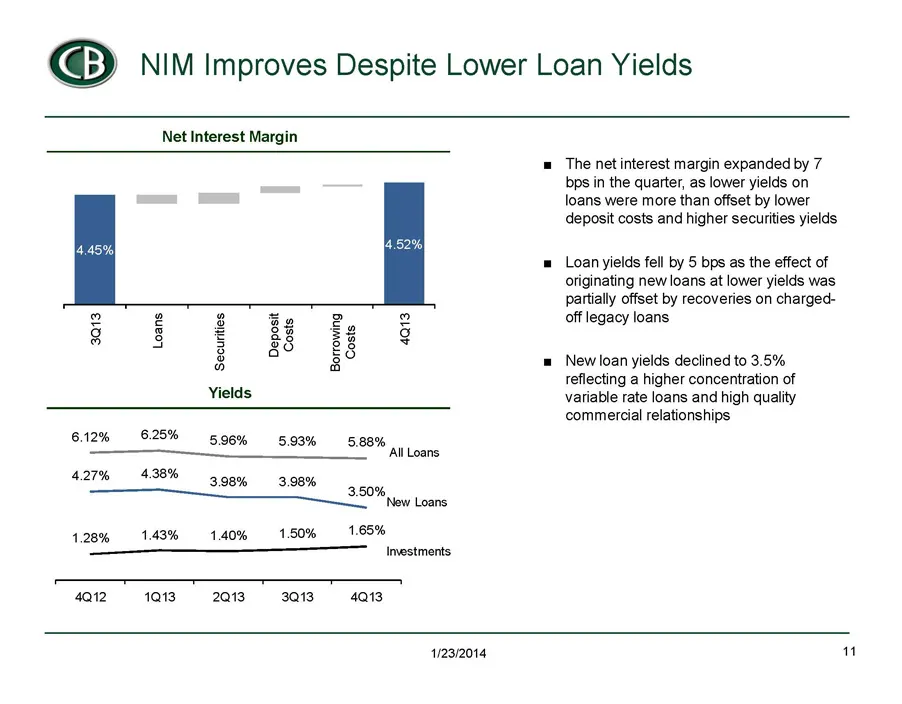
@© NIM Improves Despite Lower Loan Yields Net Interest Margin 2 2 8 = 2 2 2 2 3 Be fy - 8 § © 88 38 ¢ 3 8 ES 5 a Yields 6.12% 625% 596% 5.93% 5.88% All Loans 427% — 4.38% 398% 3.98% 5 srg ‘New Loans 1.28% 1.43% 1.40% — 1.50% 1.65% 4a2 10132013 3013 4a a The net interest margin expanded by 7 bps in t
Slide 12: Core Noninterest Income Flat Y/Y
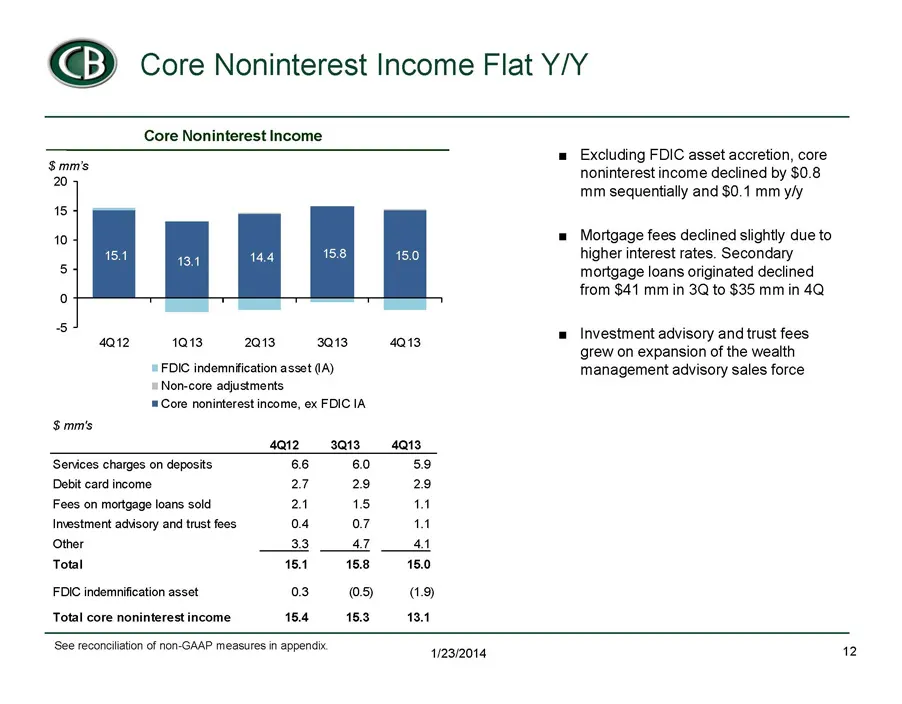
@© Core Noninterest Income Flat Y/Y Core Noninterest Income = Excluding FDIC asset accretion, core seme noninterest income declined by $0.8 mm sequentially and $0.1 mm yiy 18 40 = Mortgage fees declined slightly due to higher interest rates. Secondary 8 mortgage loans originated declined “ from $41
Slide 13: Core Noninterest Expense Flat Year-to-Date
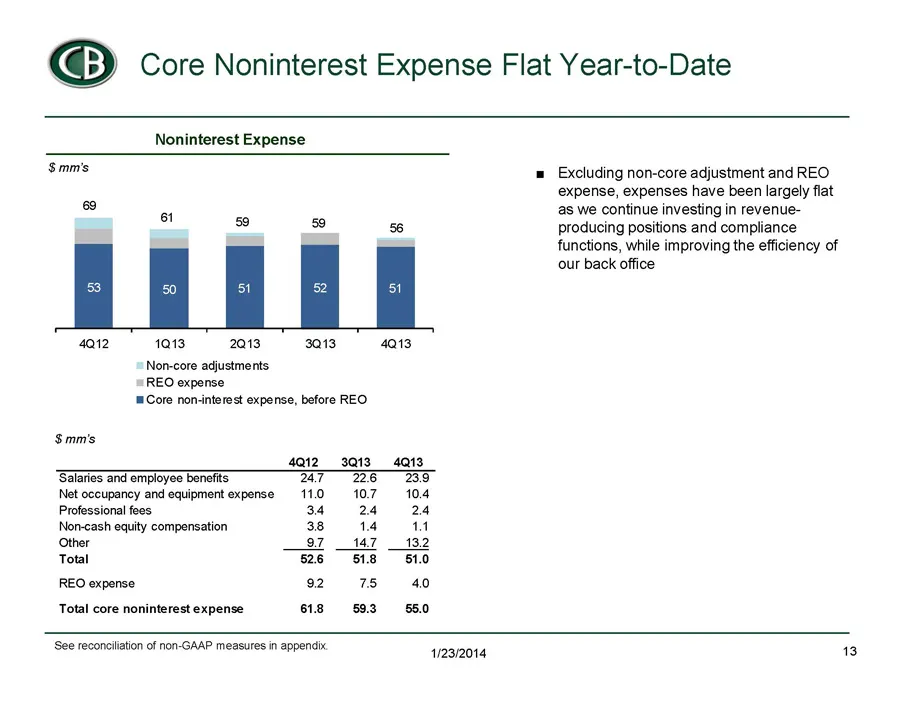
@© Core Noninterest Expense Flat Year-to-Date Noninterest Expense Smm's = Excluding non-core adjustment and REO expense, expenses have been largely flat Lo at as we continue investing in revenue- 58 59 56 producing positions and compliance functions, while improving the efficiency of our back office
Slide 14: Liquidity and Capital Ratios Remain Strong
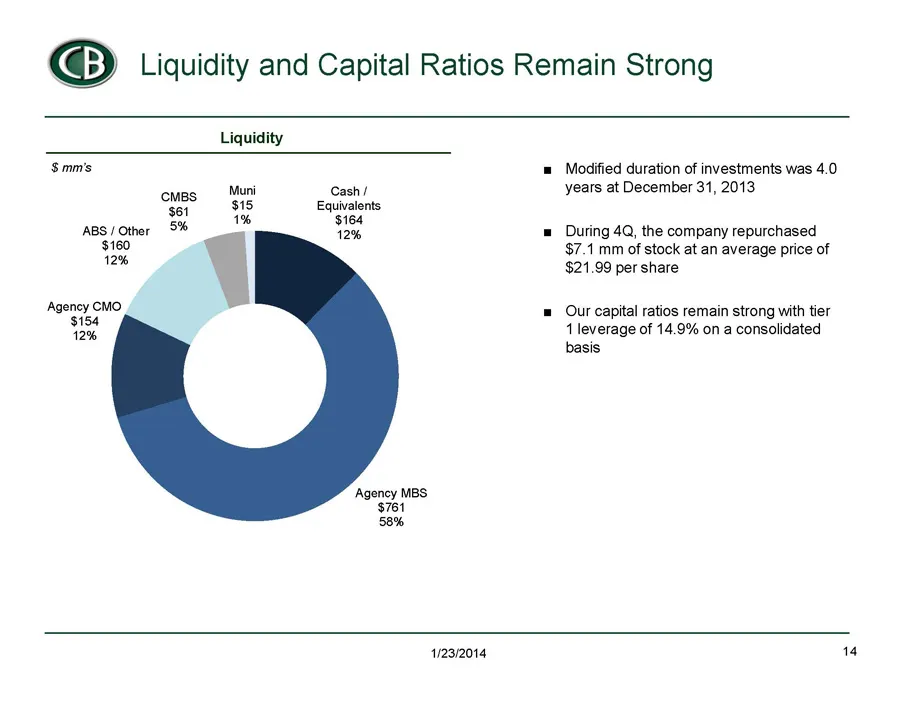
@© Liquidity and Capital Ratios Remain Strong Liquiaity Simms Muri Cash / 85 Equivalents 1 $164 ‘ge = 12% ‘Agency CMO $154 12% ‘Agency MBS $761 58% = Modified duration of investments was 4.0 years at December 31, 2013, = During 4@, the company repurchased $7.1 mm of stock at an average price of $21.
Slide 15: Originated Loan Portfolio Performing Strongly
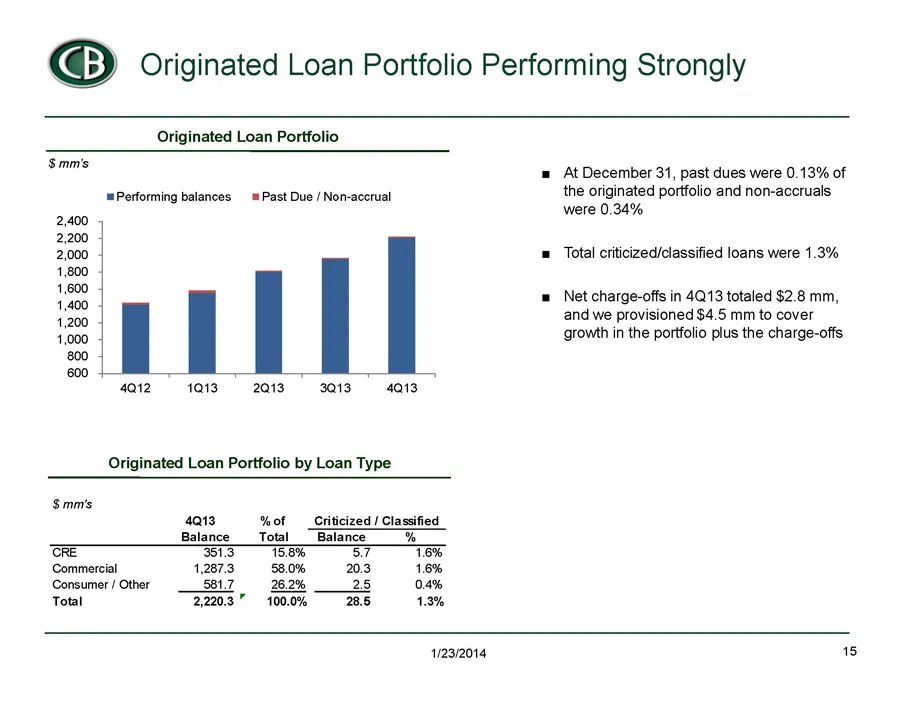
@© Originated Loan Portfolio Performing Strongly Originated Loan Portfolio Smm's Performing balances Past Due / Non-accrual 2,400 2,200 2,000 1,800 1,600 1,400 1,200 1,000 800 600 412 10132013, 3Q13 4a Originated Loan Portfolio by Loan Type $mm's 4013 %of _Criticized / Classified Balance Total“ Bala
Slide 16: Special Assets Down 33% in 2013
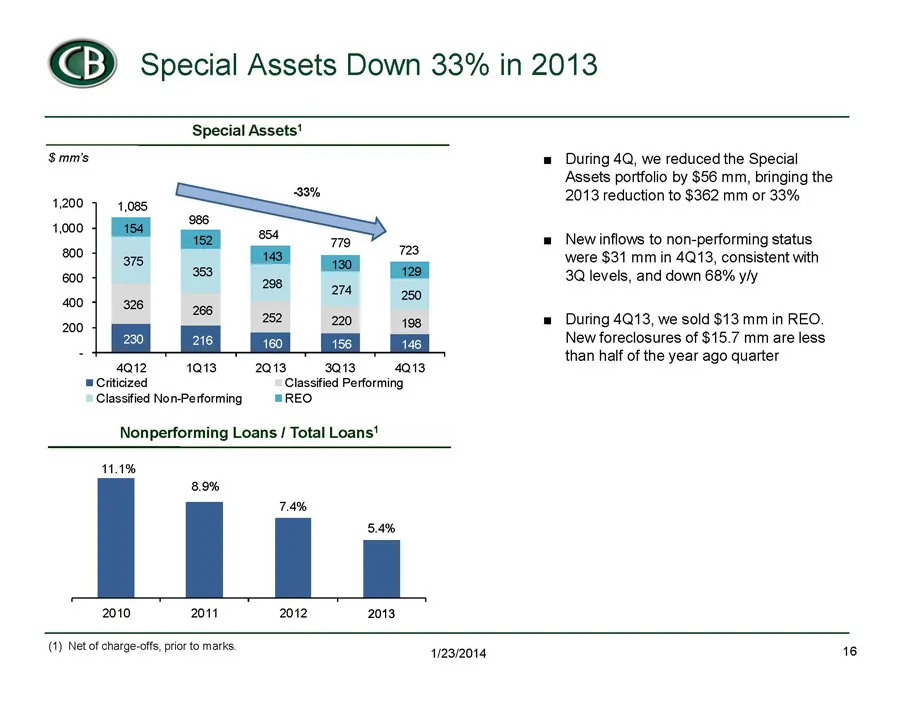
@© Special Assets Down 33% in 2013 Special Assets! 4a12 10132013, 313 ats Criticized Classified Performing Classified Non-Performing "REO Nonperforming Loans / Total Loans' 11.1% 8.9% 5.4% 2010 2011 2012 2013, During 4Q, we reduced the Special Assets portfolio by $56 mm, bringing the 2013 reduction
Slide 17: Legacy Credit Expenses Declining
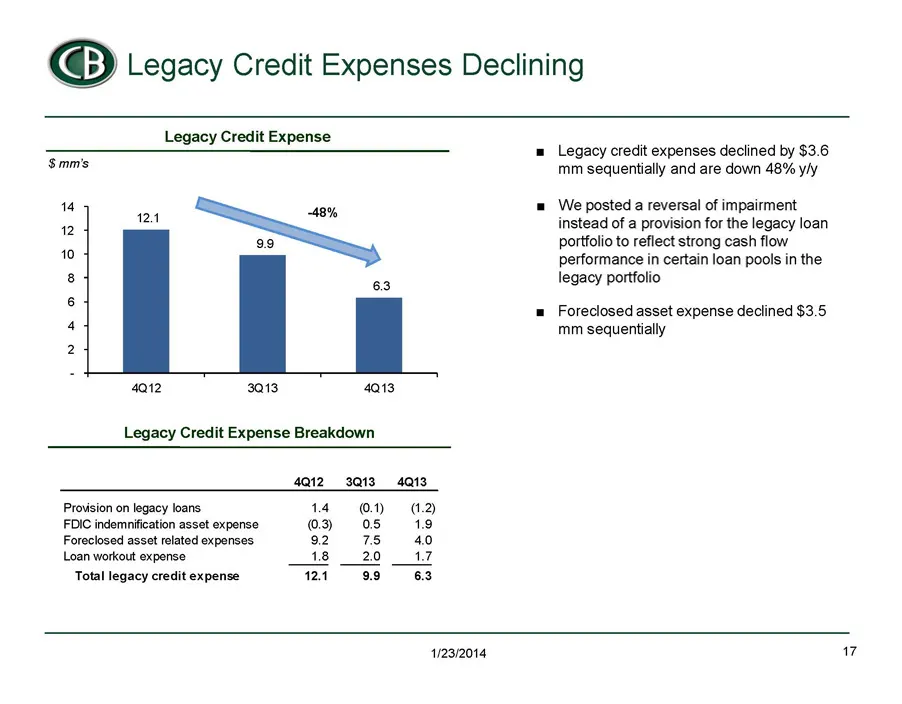
@© Legacy Credit Expenses Declining Legacy Credit Expense Smms us 124 48% 2 99 10 8 63 6 4 2 4012 3013 4013 Legacy Credit Expense Breakdown 4123013 4at3 Provision on legacy loans. 14° @1) (1.2) FDIC indemnification asset expense Foreclosed asset related expenses Loan workout expense Total legacy cre
Slide 18: Our Path to Investor Returns
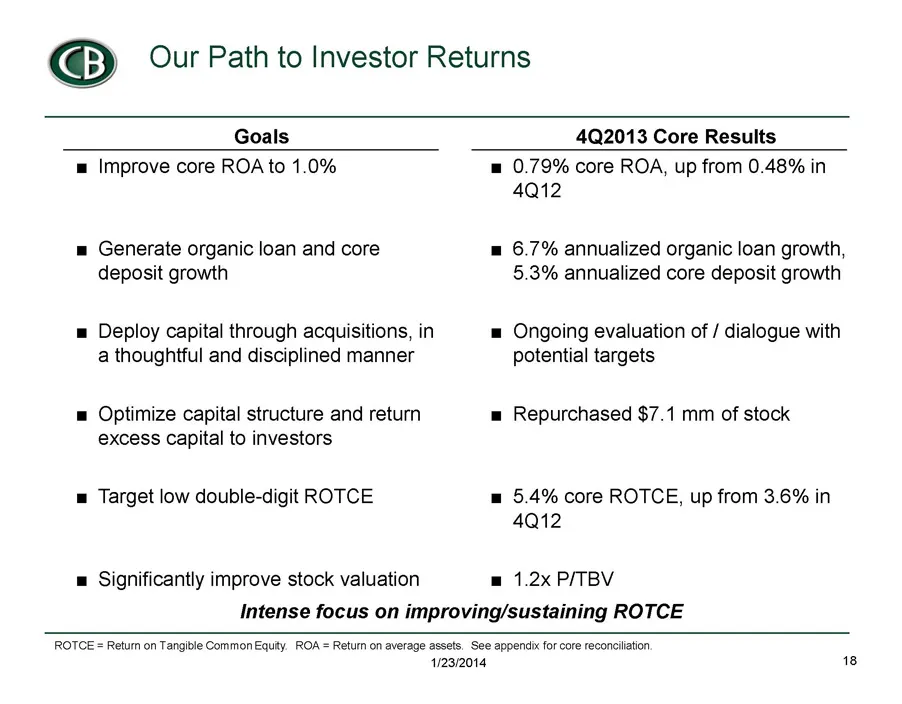
@© Our Path to Investor Returns Goals 4Q2013 Core Results m Improve core ROA to 1.0% = Generate organic loan and core deposit growth Deploy capital through acquisitions, in a thoughtful and disciplined manner = Optimize capital structure and return excess Capital to investors = Target low double-dig
Slide 19: Appendix
Appendix 1/23/2014
Slide 20: Reconciliation of Core Noninterest Income / Expense
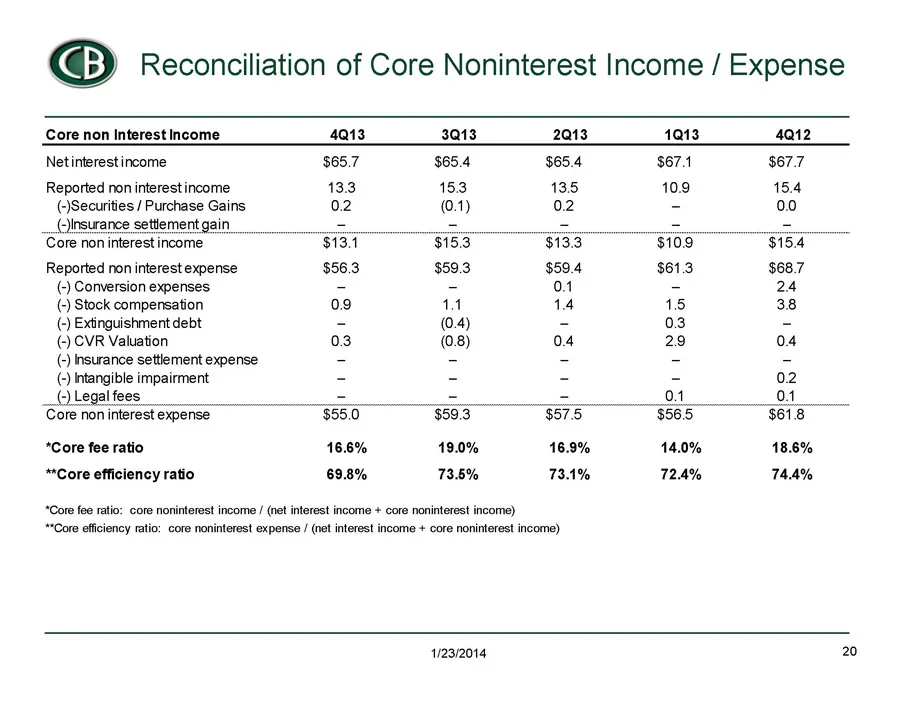
@© Reconciliation of Core Noninterest Income / Expense Core non Interest Income 4013 3013 2013 1013 4012 Netinterestincome $65.7 $65.4 $65.4 $67.1 $677 Reported non interest income 133 153 135 109 15.4 (Securities / Purchase Gains 02 (0.1) 02 - 00 (Insurance settlement gain = = = = = Gore non intere
Slide 21: Reconciliation of Core Net Income
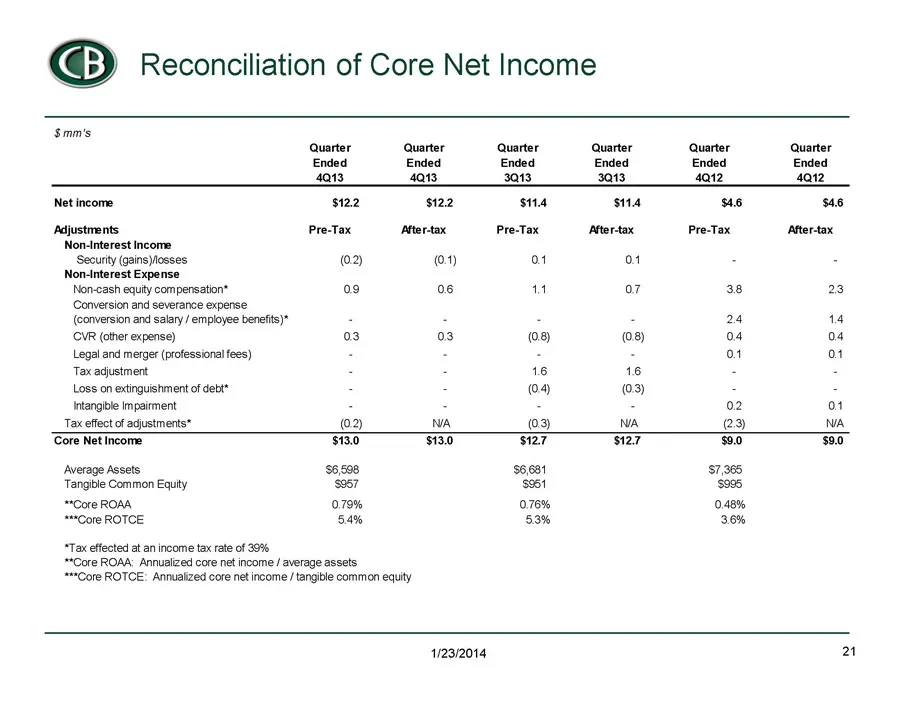
@© Reconciliation of Core Net Income $mm's Quarter Quarter Quarter Quarter Quarter Quarter Ended Ended Ended Ended Ended Ended 4013, 4013, 3013 3013, 4012. 4012. Net income $122 $122 sit st 46 $46 Pre-Tax Atter-tax Pre-Tax Ater-tax Pre-Tax After-tax (02) (01) on on - ‘ Non-cash equity compensation*
Slide 22: Tangible Book Value
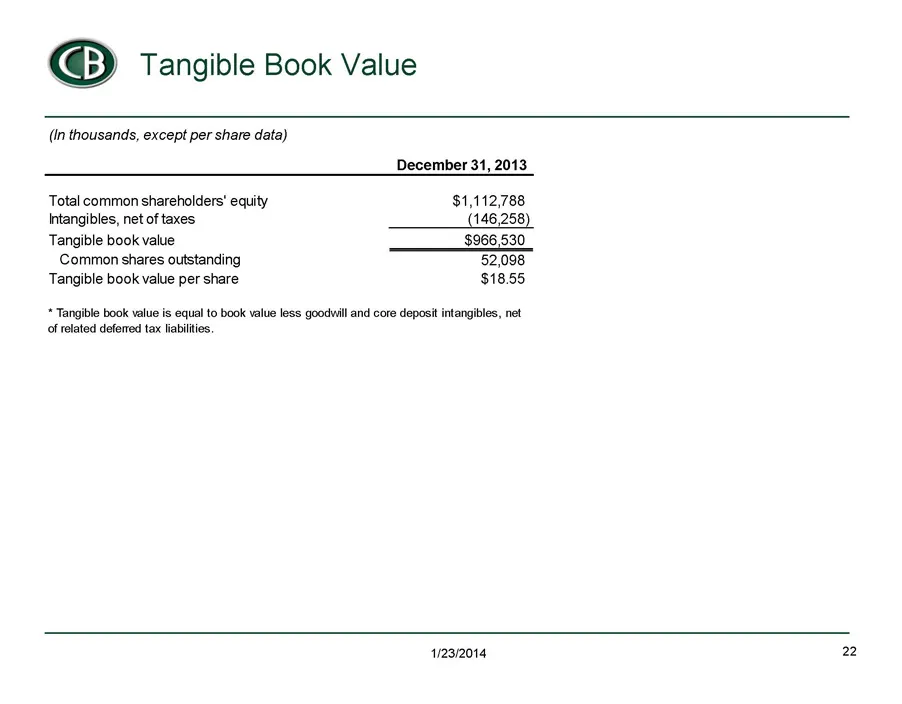
@® Tangible Book Value (in thousands, except per share data) December 31, 2013, Total common shareholders’ equity $1,112,788 Intangibles, net of taxes (146,258) Tangible book value $966,530 Common shares outstanding 52,098 Tangible book value per share $18.55 * Tangible book value is equal to book v
Source: SEC EDGAR · 8-K filed Jan 23, 2014
More decks from Capital Bank Financial Corp
 Q2 2017 Earnings Presentation22 slides · Jul 14, 2017
 Morgan Stanley Financial Services Conference 201715 slides · Jun 13, 2017
 Merger or Acquisition (June 2017)27 slides · Jun 6, 2017
 Merger or Acquisition (May 2017)17 slides · May 4, 2017
 Q1 2017 Earnings Presentation21 slides · Apr 21, 2017
 Q4 2016 Earnings Presentation25 slides · Jan 26, 2017