Strategic Hotels and Resorts Inc
Strategic Hotels and Resorts — Investor Presentation (May 2007)
10 slides from Strategic Hotels and Resorts's investor presentation, May 11, 2007

Slide 1: Strategic Hotels & Resorts
STRATEGIC Hotels &° Resorts
Slide 2: Investment Highlights
Investment Highlights High quality hotel portfolio Embedded internal growth opportunities Deep management team focused on execution “Life cycle” driven capital recycling program Building Long-Term Earnings Growth
Slide 3: Portfolio Overview
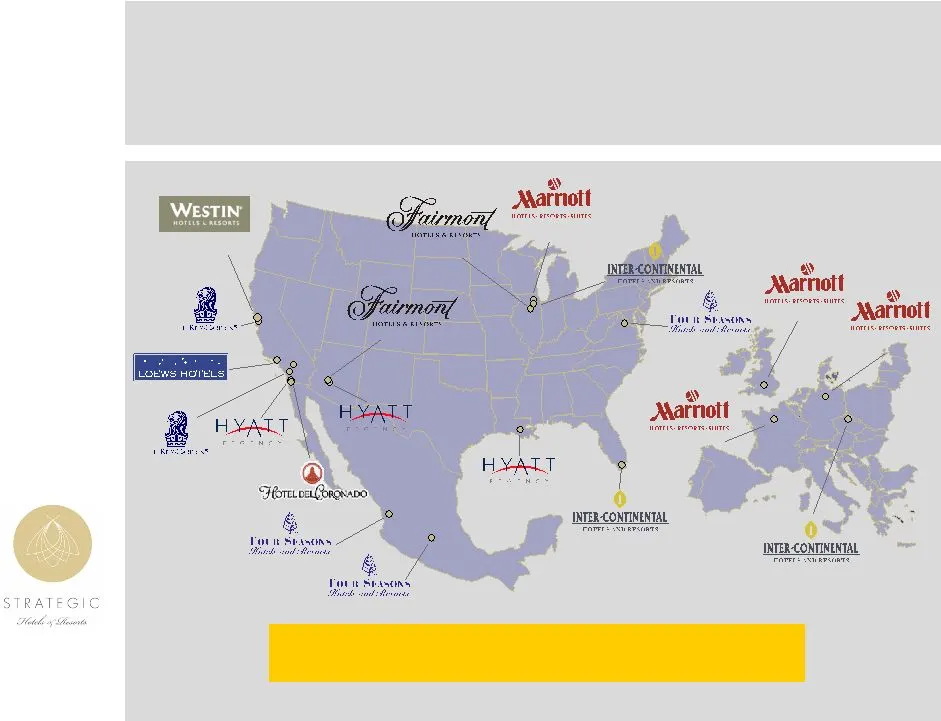
Portfolio Overview 20 Hotels and Resorts 10,005 Rooms Paris, France Hamburg, Germany Prague, Czech Republic Chicago Mexico City Punta Mita Resort New Orleans Phoenix at Civic Plaza Lincolnshire Resort Miami Half Moon Bay Mexico City Punta Mita Resort New Orleans Miami Half Moon Bay Mexico City Punta
Slide 4: Portfolio Metrics
Portfolio Metrics Q1 2006 Q1 2007 RevPAR $150 22.7% $184 Total RevPAR $268 28.0% $343 ADR $203 23.2% $250 GOP/room $8,709 28.9% $11,227
Slide 5: 2007 Completions
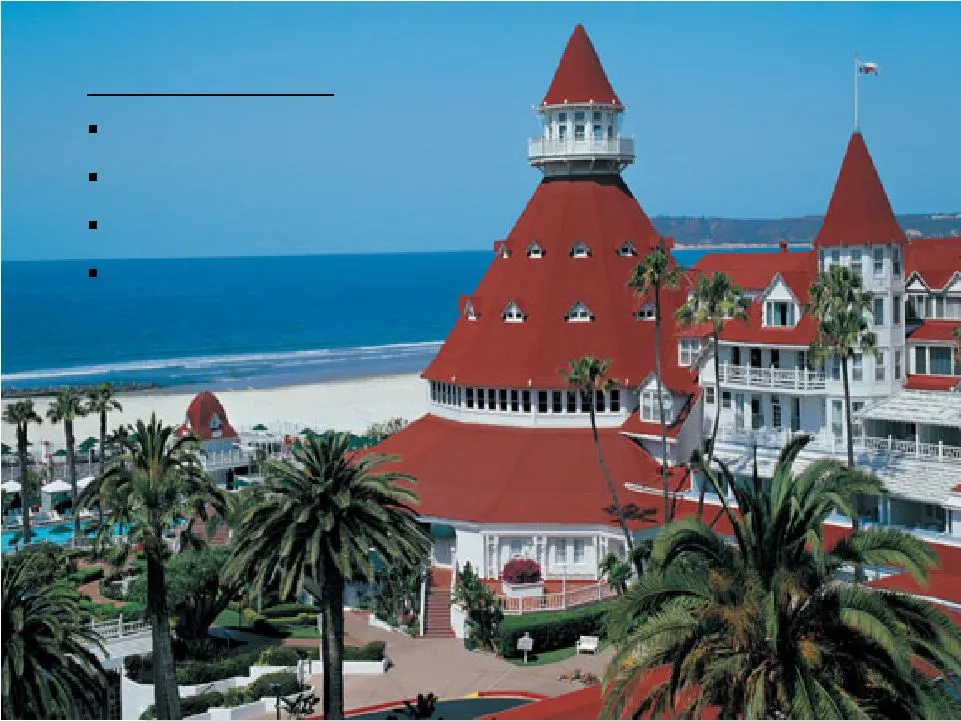
2007 Completions Hotel del Coronado 213 room renovation 35 unit / 78 room addition Retail reconfiguration New restaurant
Slide 6: 2007 Completions
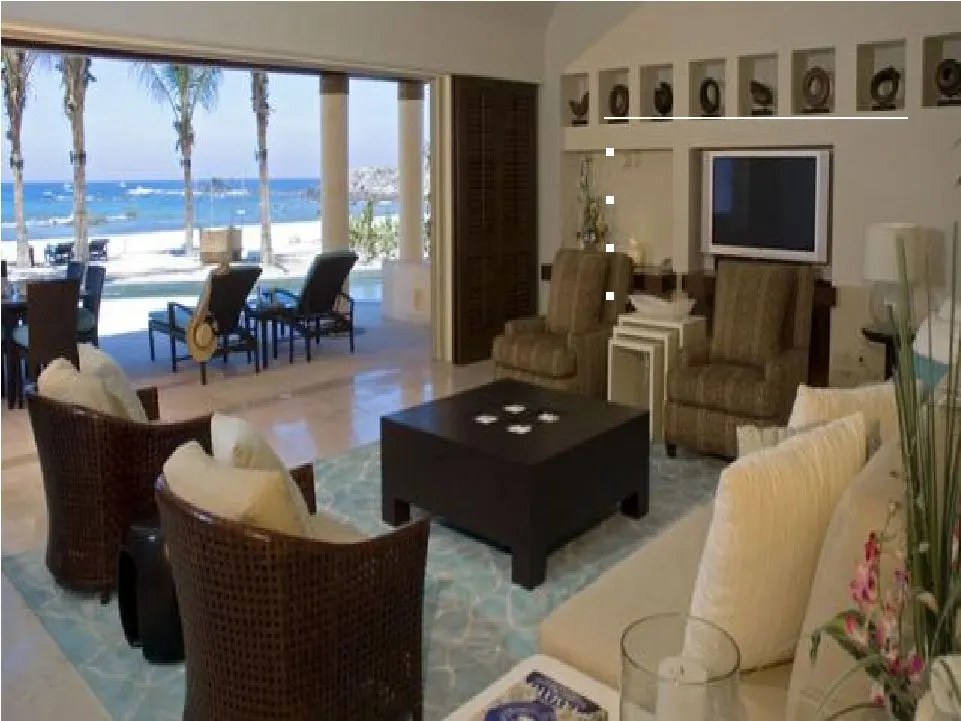
2007 Completions Four Season Punta Mita 5 room suite 23 rooms and river pool Retail expansion New restaurant
Slide 7: Capital Projects
Capital Projects 2007 Completions Ritz-Carlton Laguna Niguel – 3 room addition – Wine room InterContinental Chicago – Wine room – Starbucks Fairmont Chicago – Gold lounge InterContinental Miami – Starbucks Fairmont Scottsdale – 79 Gold rooms – Michael Mina restaurant – Gerber bar

Slide 8: Components of Value
Components of Value Non-Income Producing Assets Meetings & Business Hotels: 45% of EBITDA Ocean Front Resorts: 34% of EBITDA European Hotels: 12% of EBITDA Non-Core Assets: 9% of EBITDA

Slide 9: Summary
Summary Newly acquired high growth portfolio Early success in capital investment activities Programmed three year investment strategy Conversion of non-income producing assets into value Accelerating earnings growth Underpinning real estate values
Slide 10: Strategic Hotels & Resorts
STRATEGIC Hotels &° Resorts
Source: SEC EDGAR · 8-K filed May 11, 2007
More decks from Strategic Hotels and Resorts Inc
 Investor Presentation (June 2015)43 slides · Jun 1, 2015
 Investor Presentation (February 2015)43 slides · Feb 24, 2015
 Investor Presentation (January 2015)44 slides · Jan 26, 2015
 Investor Presentation (November 2014)50 slides · Nov 5, 2014
 Investor Presentation (October 2014)50 slides · Oct 3, 2014
 Investor Day (September 2014)67 slides · Sep 22, 2014