Bryn Mawr Bank — Investor Presentation (January 2012)
35 slides from Bryn Mawr Bank's investor presentation, Jan 31, 2012
Slide 1: Year End 2011 Update
Year End 2011 Update December 31, 2011 Bryn Mawr Bank Corporation NASDAQ: BMTC Strong - Stable - Secure Exhibit 99.2

Slide 2: Safe Harbor
Safe Harbor This presentation contains statements which, to the extent that they are not recitations of historical fact may constitute forward-looking statements for purposes of the Securities Act of 1933, as amended, and the Securities Exchange Act of 1934, as amended. Please see the section titled

Slide 3: Bryn Mawr Bank Corporation Profile
Bryn Mawr Bank Corporation Profile Founded in 1889 – 121 year history A unique business model with a traditional commercial bank ($1.8 billion) and a trust company ($4.8 billion) under one roof at December 31, 2011 Wholly owned subsidiary – The Bryn Mawr Trust Company Largest community bank in Phila
Slide 4: Southeast PA Footprint
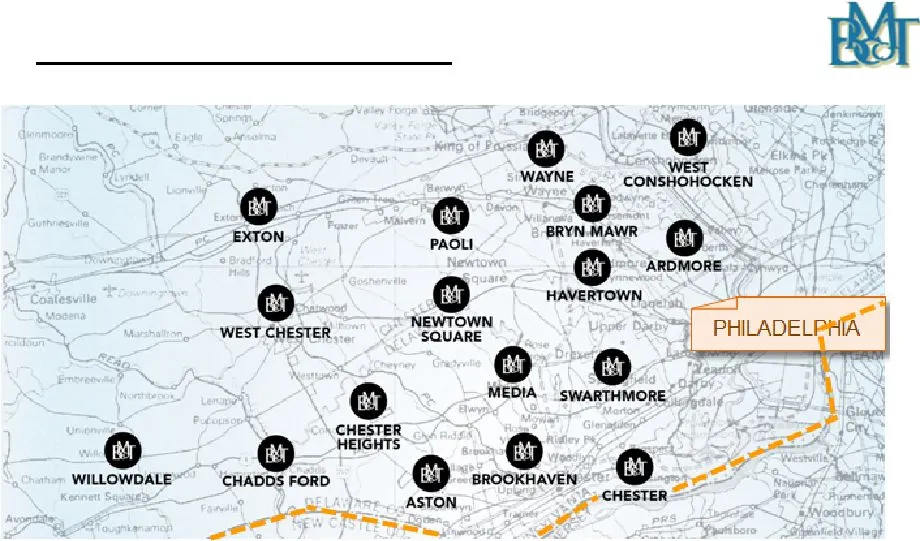
Southeast PA Footprint • 17 BMTC Full Service Branch Locations

Slide 5: Investment Considerations
Investment Considerations Quarterly dividend increased 6.7% to $0.16, declared January 26, Year to Date at December 31, 2011: Return on Average Assets (ROA): 1.14% Return on Average Equity (ROE): 11.08% Solid financial fundamentals and well capitalized New business initiatives driving growth $4.8 bi
Slide 6: 2011 BMTC Stock Performance
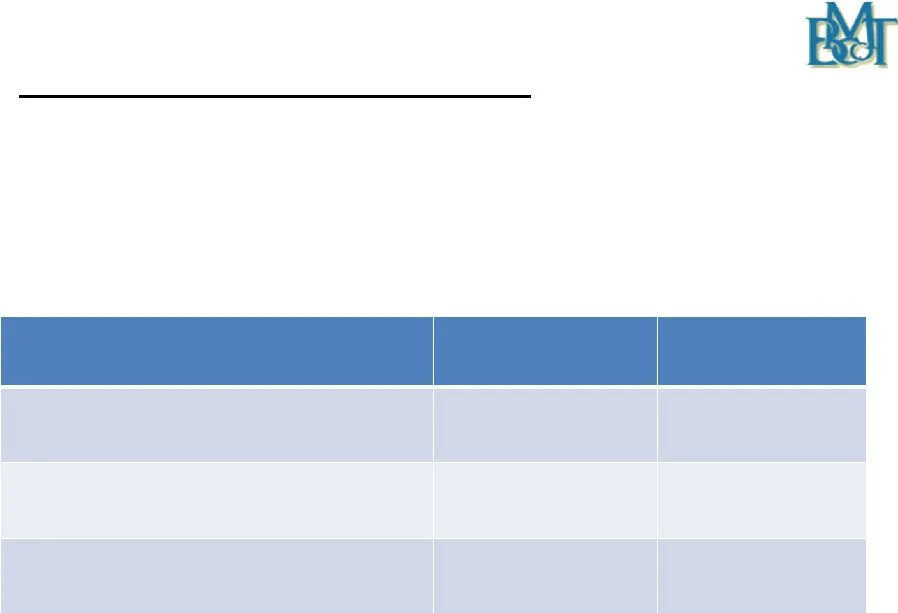
Security or Index 2011 Return Dividend Yield** 2011 BMTC Stock Performance Closing price on December 31, 2010: $17.45 Closing price on December 30, 2011: $19.49 Dividends declared per share in 2011: $0.60 BMTC* 15.13% 3.08% NASDAQ Bank Index* -10.47% 2.21% KBW Bank Index* -23.02% 2.00% * Source: Blo
Slide 7: Consistent BMTC Dividend
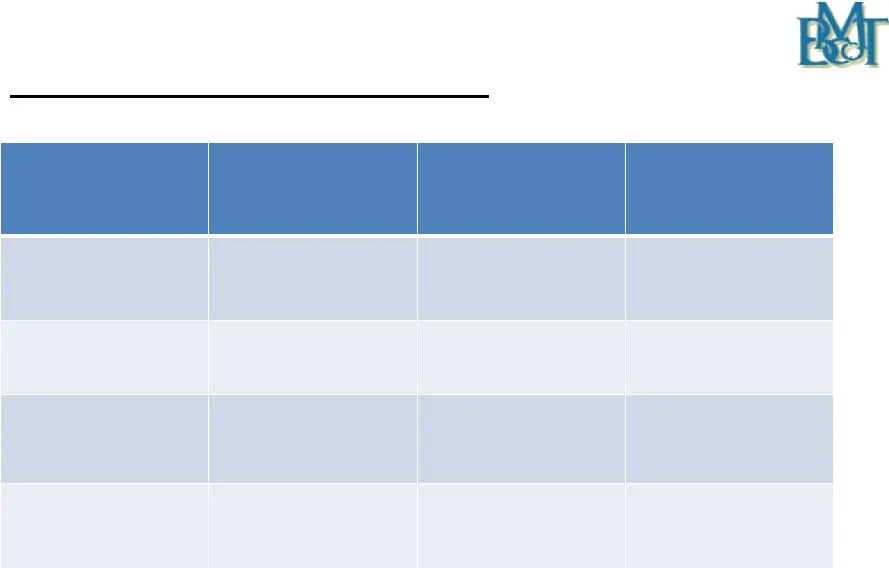
Year Annual Dividend Dividend Yield Year-End Dividend Payout Ratio Consistent BMTC Dividend $0.54 2.69% 50.0% $0.56 3.71% 47.5% $0.56 3.21% 65.9%* $0.60 3.08% 39.0% * Excluding the $5.7 million of merger related and due diligence e xpense, the dividend payout ratio was 46.0%.

Slide 8: Growth Initiatives
Growth Initiatives

Slide 9: 2012 Strategic Initiatives
2012 Strategic Initiatives 3-5-3 Strategic Plan $3 billion in banking assets - $5 billion in wealth assets – 3 years (Spring 2013) Organic growth – opportunistic expansion Inorganic growth: Additional acquisitions accretive to earnings per share in first 12 months (excluding merger costs)

Slide 10: 2012 Strategic Initiatives - continued
2012 Strategic Initiatives - continued Focus on the net interest margin Continued emphasis on strong credit quality Integrate, streamline and assimilate recent acquisitions into more effective and efficient wealth operations Lower the efficiency ratio

Slide 11: Financial Review
Financial Review
Slide 12: Financial Highlights
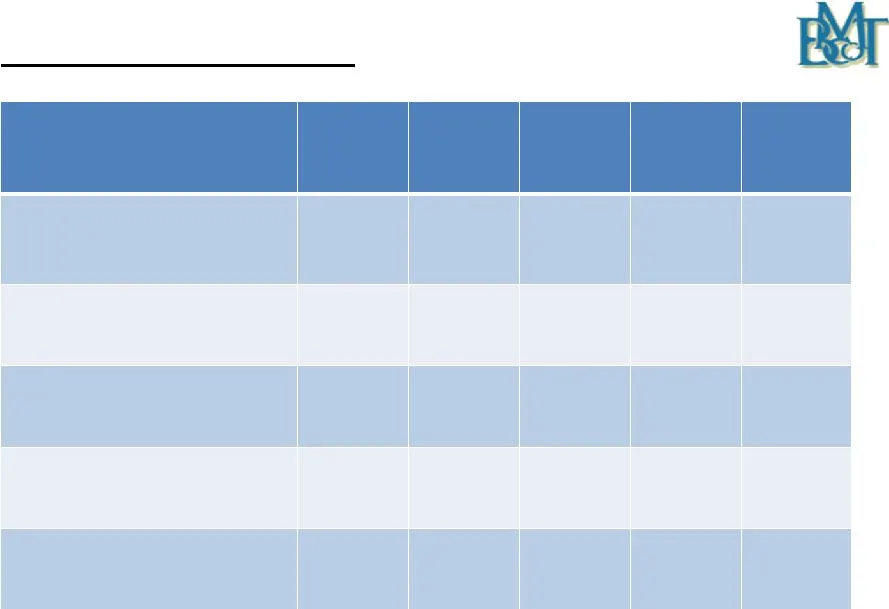
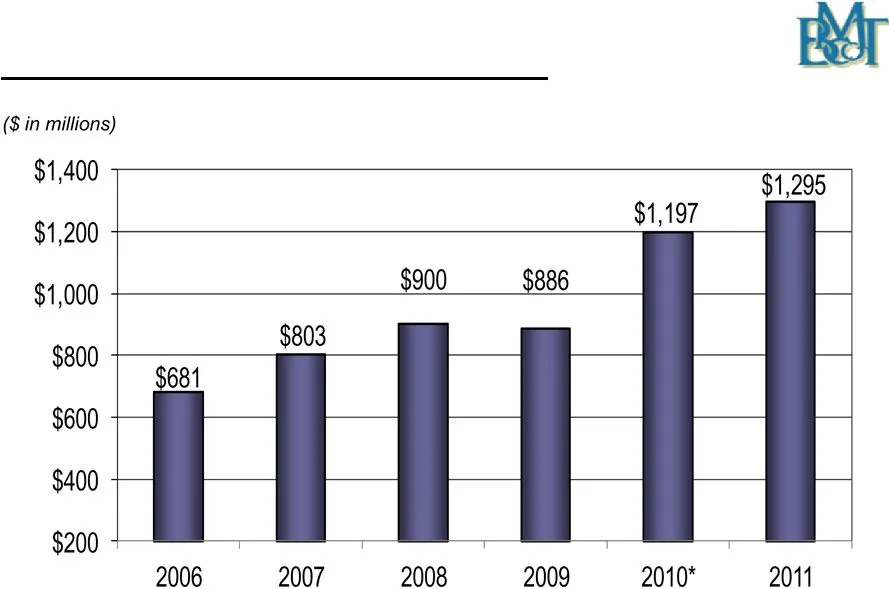
4 th Qtr 2011 3 rd Qtr 2011 2 nd Qtr 2011 1 st Qtr 2011 4 th Qtr 2010 Financial Highlights Portfolio Loans & Leases ($ in millions) $1,295 $1,278 $1,253 $1,219 $1,197 Total Deposits ($ in millions) $1,382 $1,351 $1,337 $1,316 $1,341 Total Wealth Assets ($ in billions) $4.83 $4.50 $4.83 $3.60 $3.41 M
Slide 13: Financial Highlights - continued
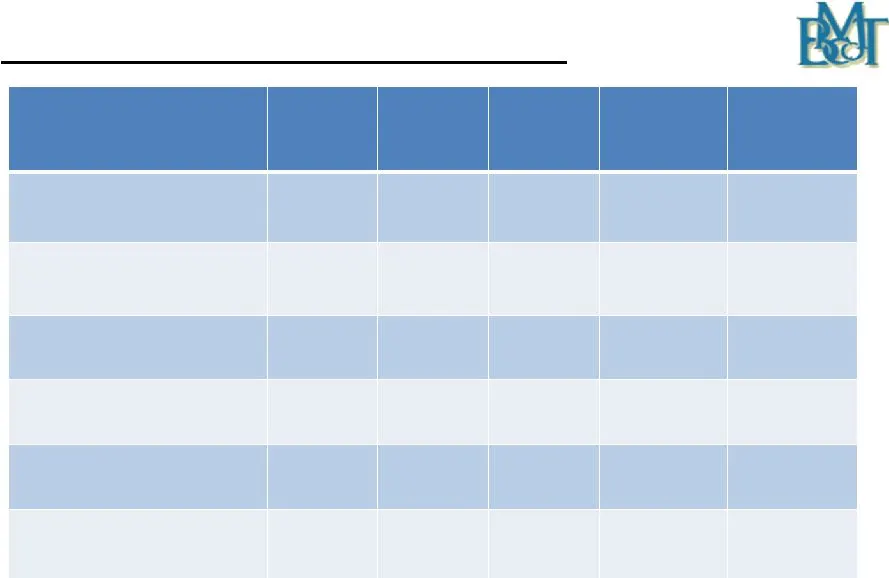
4 th Qtr 2011 3 rd Qtr 2011 2 nd Qtr 2011 1 st Qtr 2011 4 th Qtr 2010 Financial Highlights - continued Net Income ($ in millions) $5.17 $5.02 $4.81 $4.72 $5.57 Diluted Earnings Per Common Share $0.40 $0.39 $0.38 $0.38 $0.46 Dividends Declared $0.15 $0.15 $0.15 $0.15 $0.14 Book Value Per Share $14.09
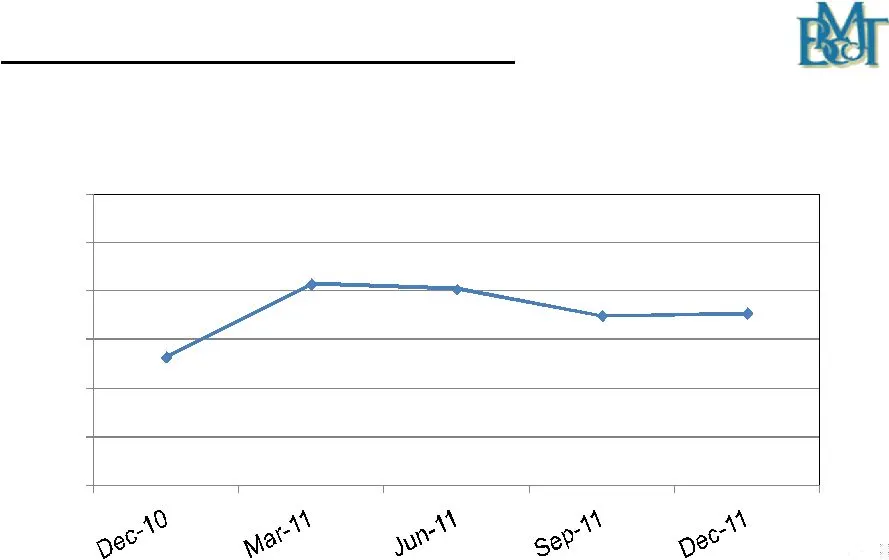
Slide 14: Quarterly Net Interest Margin
3.73% 4.03% 4.01% 3.90% 3.91% 3.2% 3.4% 3.6% 3.8% 4.0% 4.2% 4.4% Quarterly Net Interest Margin On a tax-equivalent basis
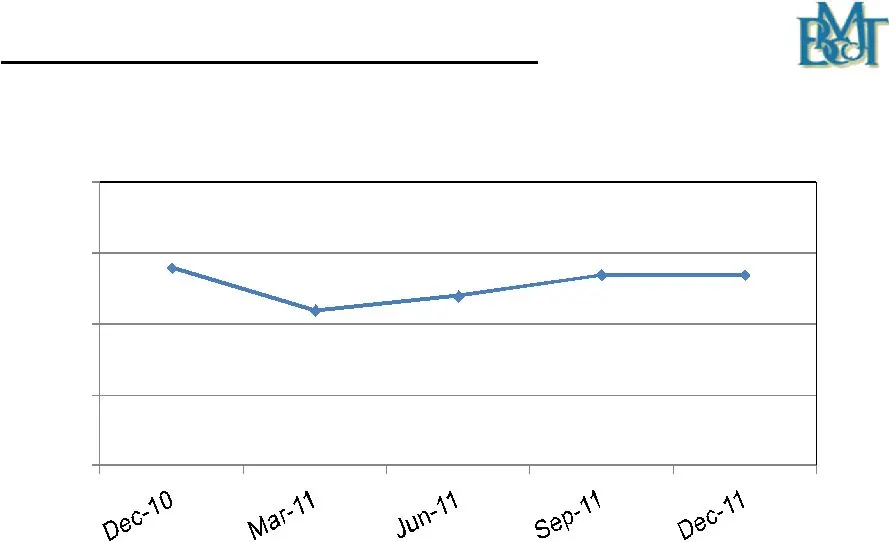
Slide 15: Quarterly Non-Interest Income
38% 32% 34% 37% 37% 10% 20% 30% 40% 50% Quarterly Non-Interest Income (As a % of Total Revenue)

Slide 16: Capital Considerations
Capital Considerations Maintain a “well capitalized” capital position including a target tangible common equity to tangible asset ratio of 8.00% Selectively add capital as needed to maintain capital levels and fund asset growth and acquisitions. Place more emphasis on retained earnings. Active Divid
Slide 17: Capital Position - Bryn Mawr Bank Corporation
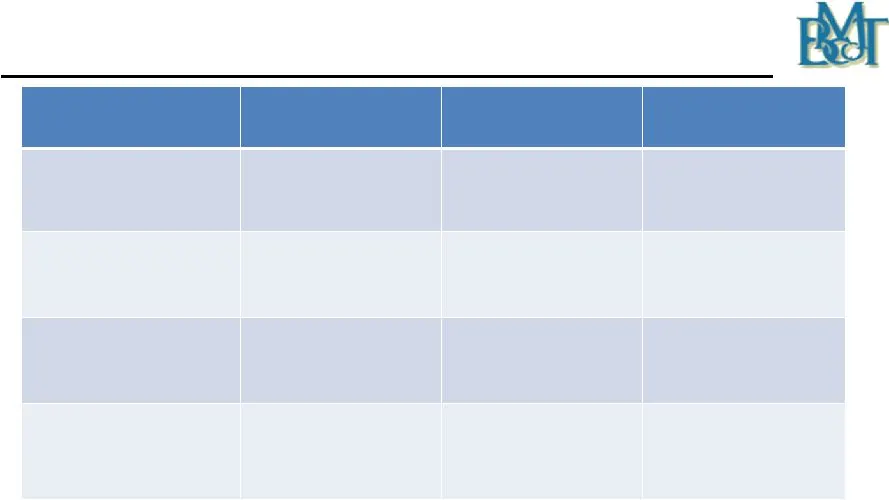
12/31/2011 6/30/2011 12/31/2010 Capital Position - Bryn Mawr Bank Corporation Tier I 11.23%* 11.55% 11.30% Total (Tier II) 13.81%* 14.05% 13.71% Tier I Leverage 8.94%* 9.36% 8.85% Tangible Common Equity 8.25% 8.31% 8.01% *On 12/19/2011 the Corporation prepaid $12 million of junior subordinated debt
Slide 18: Return on Average Equity and Average Tangible Equity
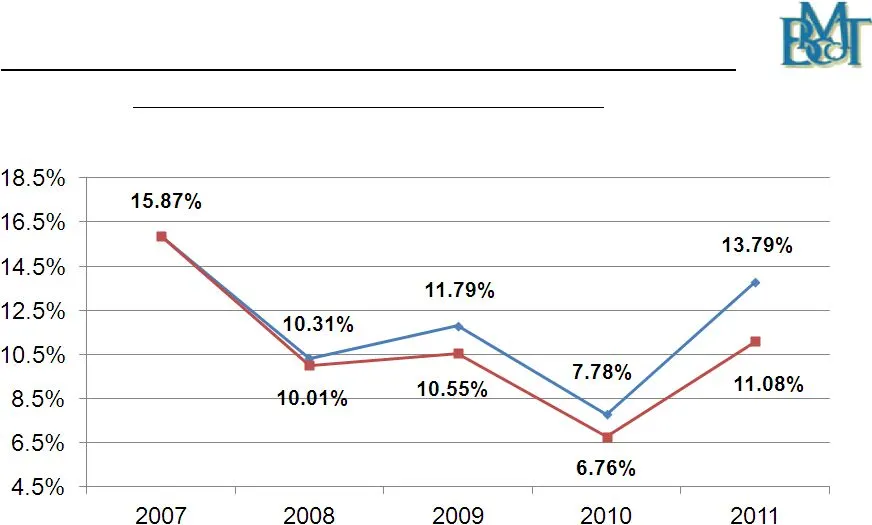
Return on Average Equity and Average Tangible Equity (a Non-GAAP Measure*) ----- Return on Average Tangible Equity ----- Return on Average Equity *T angible equity equals equity minus goodwill and other intangible assets
Slide 19: Return on Average Equity and Tangible Equity Excluding Merger Expenses
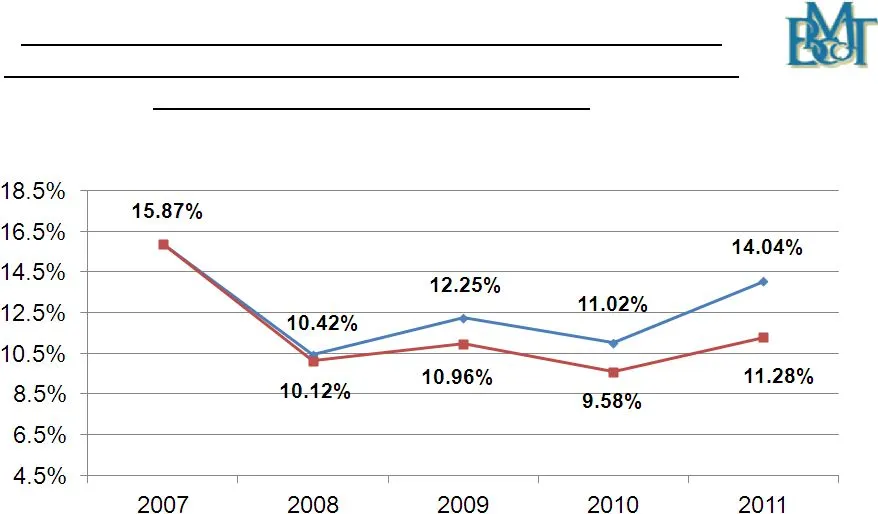
Return on Average Equity and Average Tangible Equity Excluding Tax-Effected Due Diligence and Merger-Related Expenses (a Non-GAAP Measure*) *The returns on average tangible equity and average equity were calculated by adding back to reported net income (a GAAP measure), the tax-effected due diligenc

Slide 20: Wealth Division Review
Wealth Division Review
Slide 21: Wealth Assets Under Management, Administration, Supervision and Brokerage
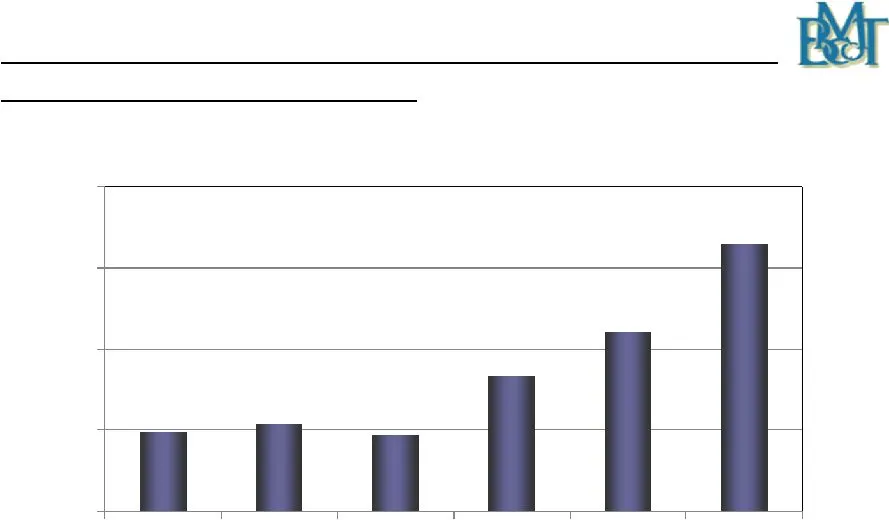
$2.18 $2.28 $2.15 $2.87 $3.41 $4.83 $1.2 $2.2 $3.2 $4.2 $5.2 Wealth Assets Under Management, Administration, Supervision and Brokerage ($ in billions) Excludes Community Bank’s assets from 2006 -
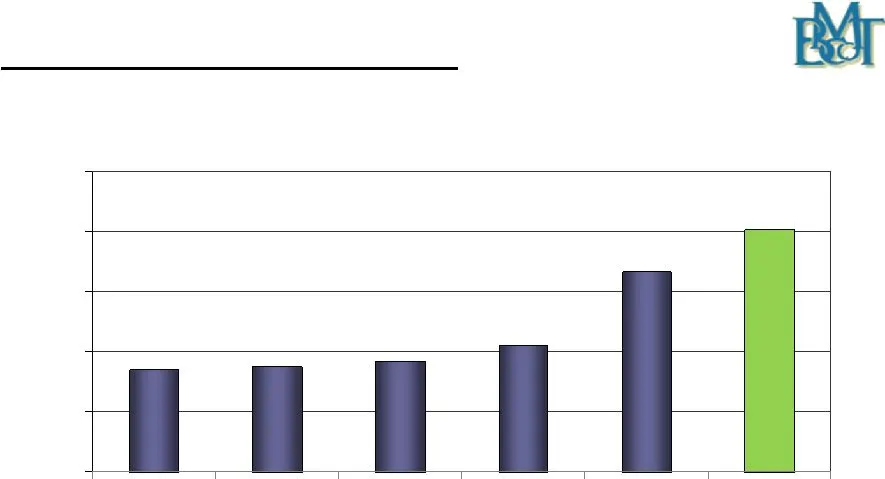
Slide 22: Wealth Management Fees
$13.5 $13.8 $14.2 $15.5 $21.7 $25.2 $5.0 $10.0 $15.0 $20.0 $25.0 $30.0 2011 Run Rate* Wealth Management Fees ($ in millions) * Assumes th Quarter fees for wealth management services are annualized.

Slide 23: Wealth Division Highlights
Wealth Division Highlights Total Assets Under Management: $4.8 billion Record 12 Month Revenue: $21.7 million 2011 Run Rate: $25.2 million Traditional Trust Activities (Bryn Mawr, PA) $2.3 billion in assets at December 31, 2011 Fiduciary trust, asset management, retirement services, investment manag

Slide 24: Wealth Division Highlights - continued
Wealth Division Highlights - continued Bryn Mawr Asset Management (Bryn Mawr, PA) $273 million in assets at December 31, 2011 “Lift Out” strategy with other opportunities being evaluated BMTC of Delaware (Greeneville, DE) $683 million in assets at December 31, 2011 Started de-novo in September 2008

Slide 25: Credit Review
Credit Review
Slide 26: Portfolio Loan & Lease Growth
Portfolio Loan & Lease Growth * From 2010 forward, includes the addition of the First Keystone loan portfolio.
Slide 27: Loan Composition at December 31, 2011
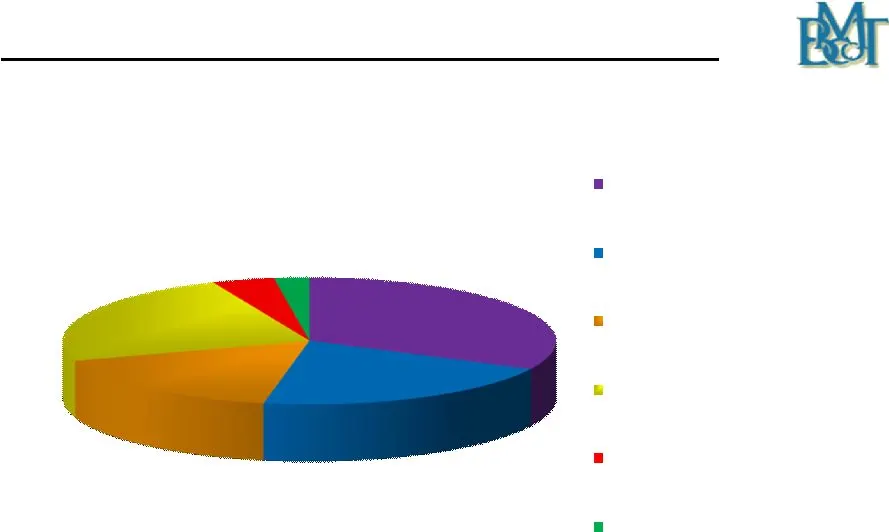
Loan Composition at December 31, 2011 $419 $267 $219 $307 $53 $30 Commercial Mortgages (32%) Commercial & Industrial (21%) Home Equity & Consumer Loans (17%) Residential Mortgages (24%) Construction (4%) Leases (2%) ($ in millions) Total loans and leases of $1.295 billion
Slide 28: Quarterly Asset Quality Data
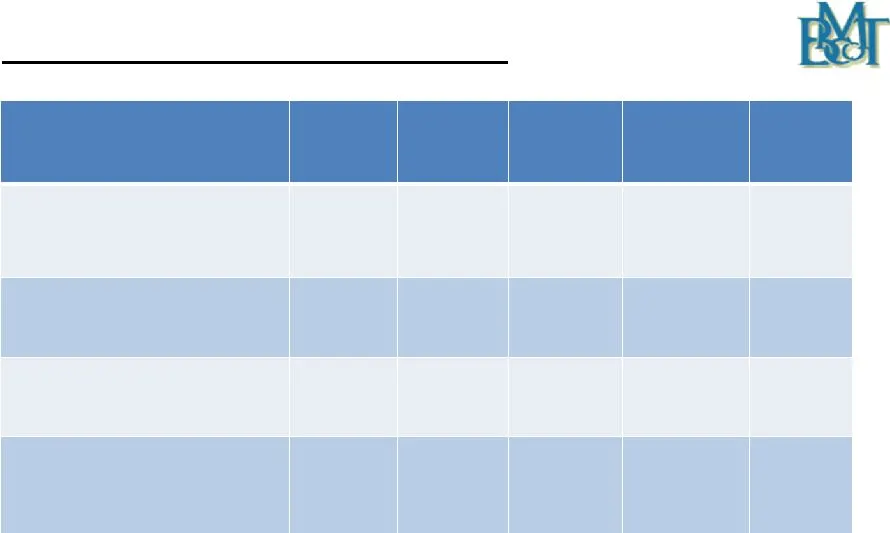
4 th Qtr 2011 3 rd Qtr 2011 2 nd Qtr 2011 1 st Qtr 2011 4 th Qtr 2010 Quarterly Asset Quality Data Non-Performing Loans as a % of Portfolio Loans and Leases 1.11% 1.11% 1.29% 0.88% 0.79% Allowance as a % of Portfolio Loans and Leases 0.98% 0.91% 0.90% 0.87% 0.86% Non-Performing Assets as a % of Asse

Slide 29: Small Ticket National Leasing Business
Small Ticket National Leasing Business Leases outstanding: $30 million at December 31, 2011 Average yield of 10.17% at December 31, 2011 Profitable in 2010 and 2011 as asset quality improved significantly Projections are for 6.5% growth in 2012 Delinquency rate continues to improve: 1.24% at Decembe

Slide 30: Summary
Summary Outstanding franchise in a stable market Focus on Wealth Services, Business Banking and Private Banking Investing in growth opportunities today for anticipated earnings growth tomorrow Sound business strategy, strong asset quality, well capitalized and solid risk management procedures serve

Slide 31: Thank You
Thank You Joseph Keefer, EVP 610-581-4869 [email protected] Duncan Smith, CFO 610-526 –2466 [email protected] Ted Peters, Chairman 610-581-4800 [email protected] Frank Leto, EVP 610-581-4730 [email protected] Aaron Strenkoski, VP – Investments & Shareholder Relations – 610-581-4822 – [email protected]

Slide 32: Forward-looking statements
This presentation contains statements which, to the extent that they are not recitations of historical fact may constitute forward-looking statements for purposes of the Securities Act of 1933, as amended, and the Securities Exchange Act of 1934, as amended. Such forward-looking statements may inclu

Slide 33: Safe Harbor (continued)
Safe Harbor (continued) Such factors include, among others, our need for capital, our ability to control operating costs and expenses, and to manage loan and lease delinquency rates; the credit risks of lending activities and overall quality of the composition of our loan, lease and securities portf

Slide 34: Safe Harbor (continued)
Safe Harbor (continued) For a complete discussion of the assumptions, risks and uncertainties related to our business, you are encouraged to review our filings with the Securities and Exchange Commission, including our most recent annual report on Form 10-K, as well as any changes in risk factors th

Slide 35: Safe Harbor (continued)
Safe Harbor (continued) No offer to purchase securities of the Corporation will be made or accepted prior to receipt by an investor of an Offering Memorandum and relevant subscription documentation, all of which must be reviewed together with the Corporation’s then-current financial statements and,
Source: SEC EDGAR · 8-K filed Jan 31, 2012
More decks from Bryn Mawr Bank Corporation
 Merger or Acquisition (March 2021)20 slides · Mar 10, 2021
 Q4 2020 Earnings Presentation16 slides · Jan 22, 2021
 Q3 2020 Earnings Presentation14 slides · Oct 23, 2020
 Investor Presentation (September 2020)17 slides · Sep 21, 2020
 Q2 2020 Earnings Presentation14 slides · Jul 21, 2020
 Q1 2020 Earnings Presentation13 slides · Apr 21, 2020