Bryn Mawr Bank — Q2 2020 Earnings Presentation
14 slides from Bryn Mawr Bank's earnings presentation, Jul 21, 2020
Slide 1: Second Quarter 2020 Earnings Review
Second Quarter 2020 Earnings Review Frank Leto Mike Harrington Liam Brickley President and Chief Financial Officer Chief Credit Officer Chief Executive Officer
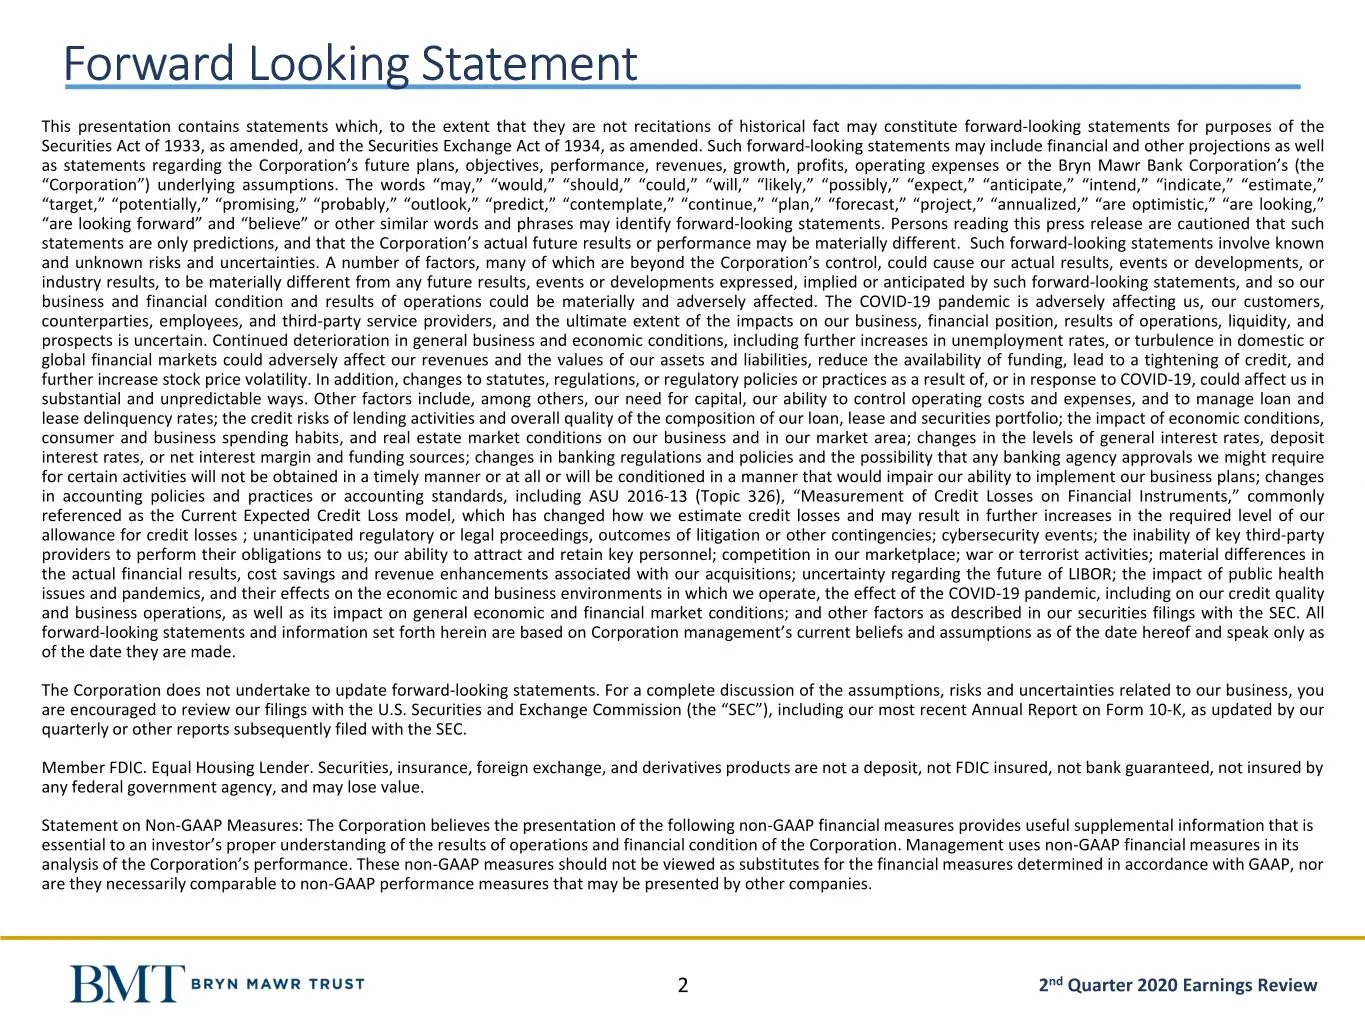
Slide 2: Forward Looking Statement
Forward Looking Statement This presentation contains statements which, to the extent that they are not recitations of historical fact may constitute forward-looking statements for purposes of the Securities Act of 1933, as amended, and the Securities Exchange Act of 1934, as amended. Such forward-lo
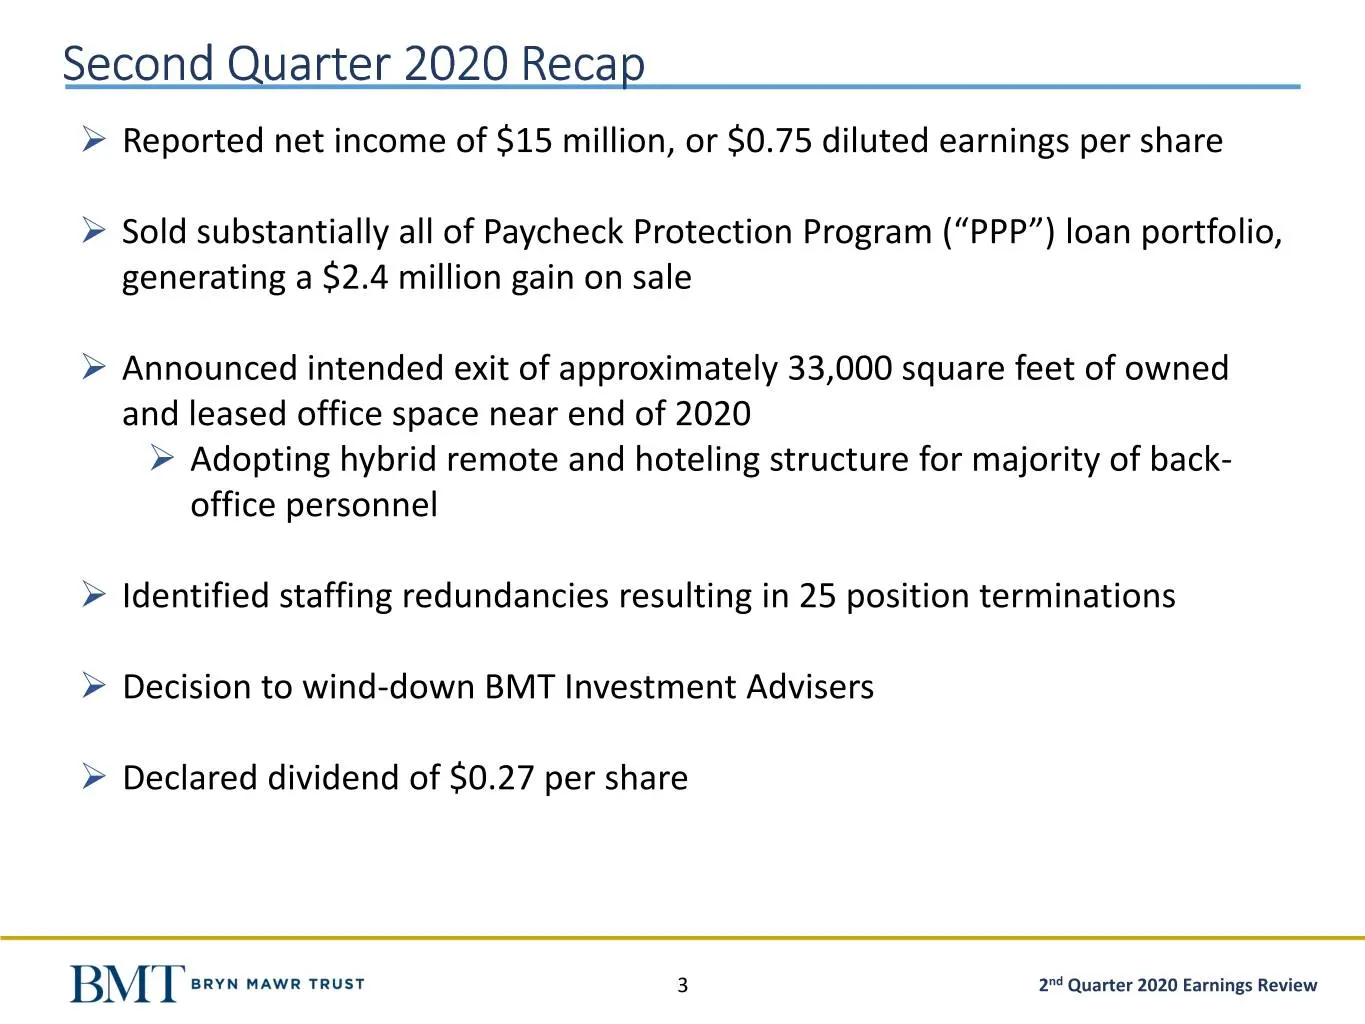
Slide 3: Second Quarter 2020 Recap
Second Quarter 2020 Recap ➢ Reported net income of $15 million, or $0.75 diluted earnings per share ➢ Sold substantially all of Paycheck Protection Program (“PPP”) loan portfolio, generating a $2.4 million gain on sale ➢ Announced intended exit of approximately 33,000 square feet of owned and leased
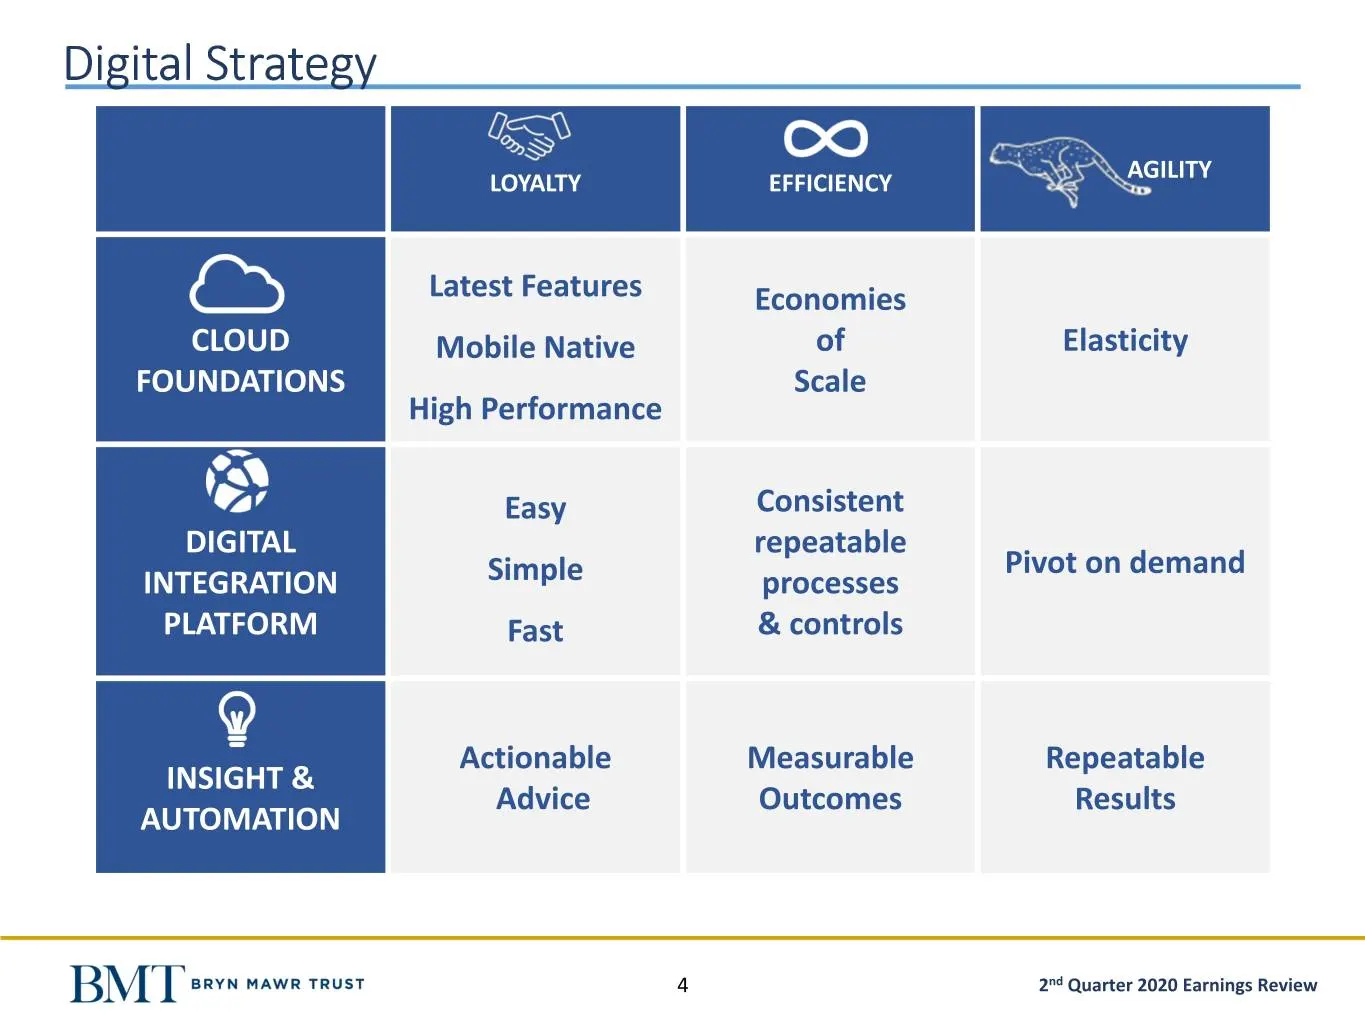
Slide 4: Digital Strategy
Digital Strategy AGILITY LOYALTY EFFICIENCY Latest Features Economies CLOUD Mobile Native of Elasticity FOUNDATIONS Scale High Performance Easy Consistent DIGITAL repeatable Pivot on demand INTEGRATION Simple processes PLATFORM Fast & controls Actionable Measurable Repeatable INSIGHT & Advice Outcom
Slide 5: Digital Change
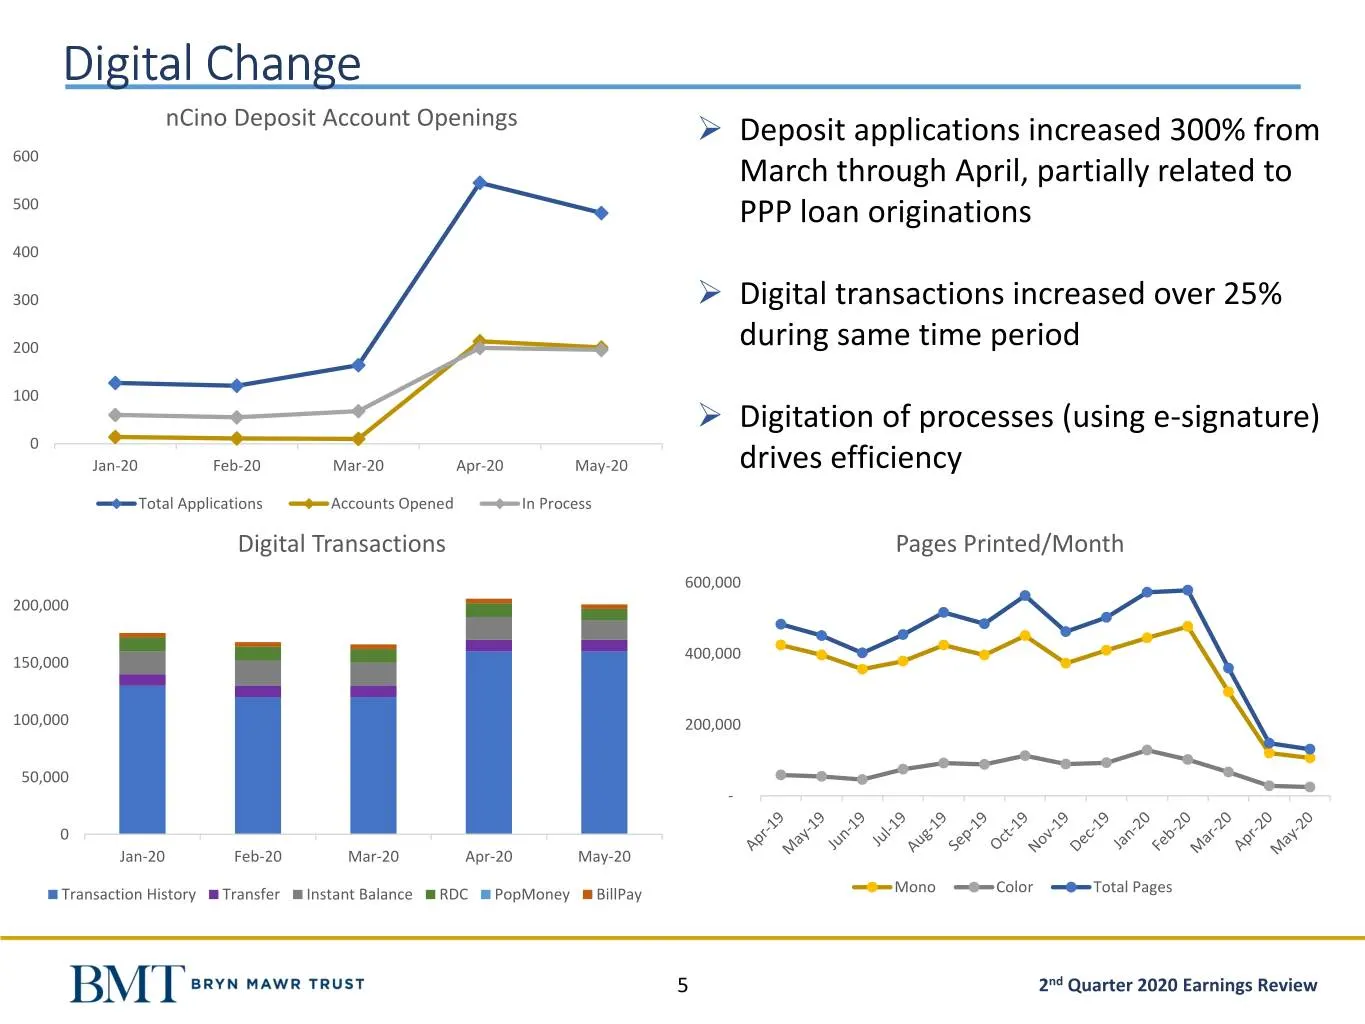
Digital Change nCino Deposit Account Openings ➢ Deposit applications increased 300% from 600 March through April, partially related to 500 PPP loan originations 400 300 ➢ Digital transactions increased over 25% 200 during same time period 100 ➢ Digitation of processes (using e-signature) 0 Jan-20 Fe
Slide 6: 2nd Quarter 2020 Results
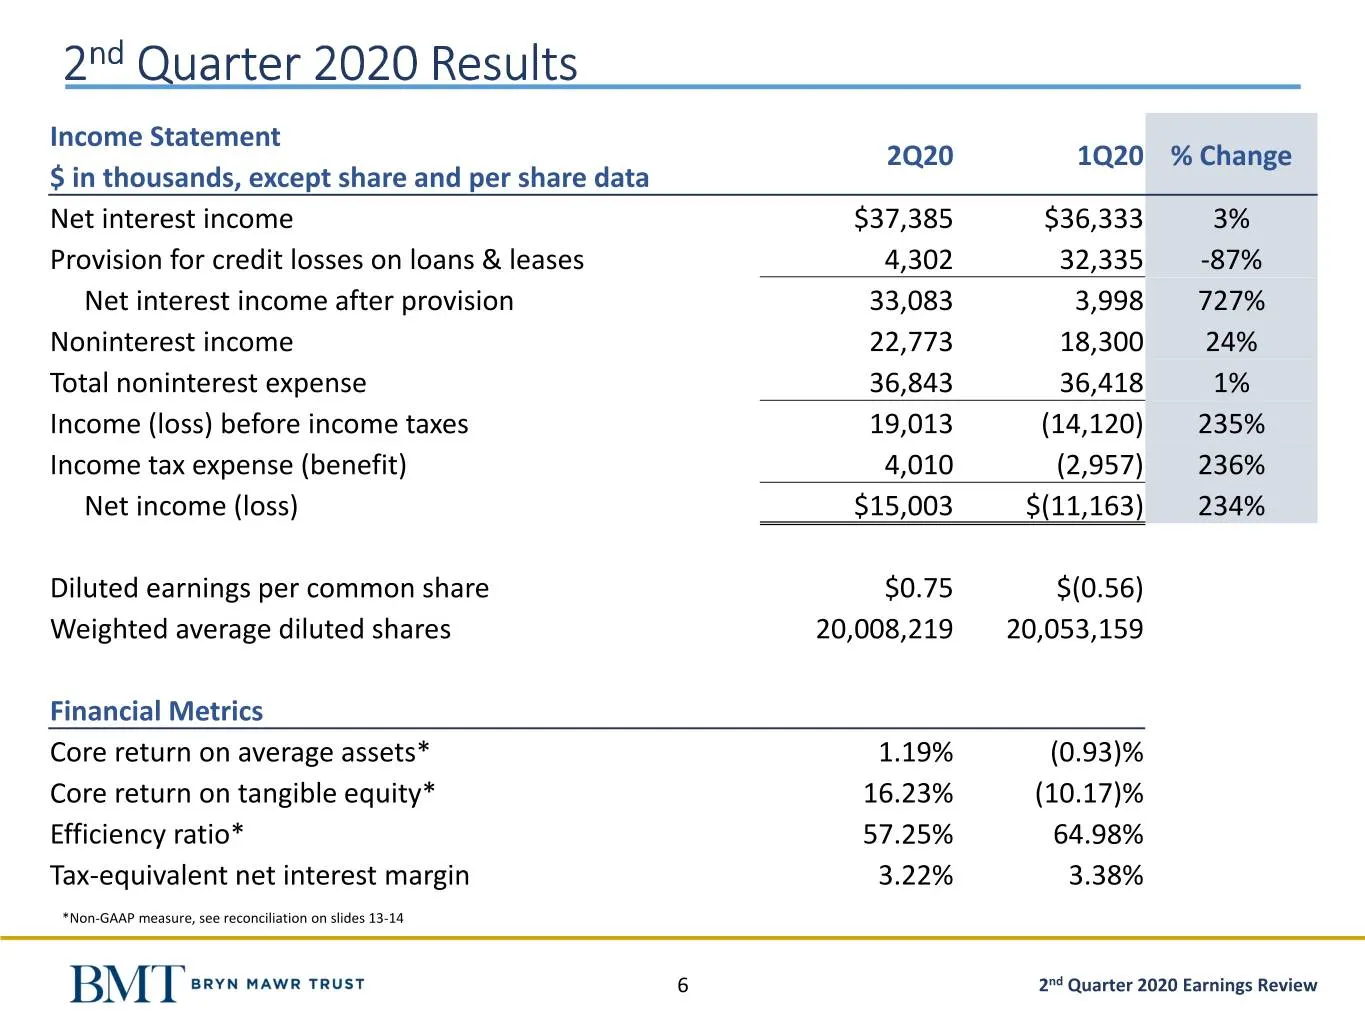
2nd Quarter 2020 Results Income Statement 2Q20 1Q20 % Change $ in thousands, except share and per share data Net interest income $37,385 $36,333 3% Provision for credit losses on loans & leases 4,302 32,335 -87% Net interest income after provision 33,083 3,998 727% Noninterest income 22,773 18,300 2
Slide 7: Balance Sheet - Liquidity - Capital
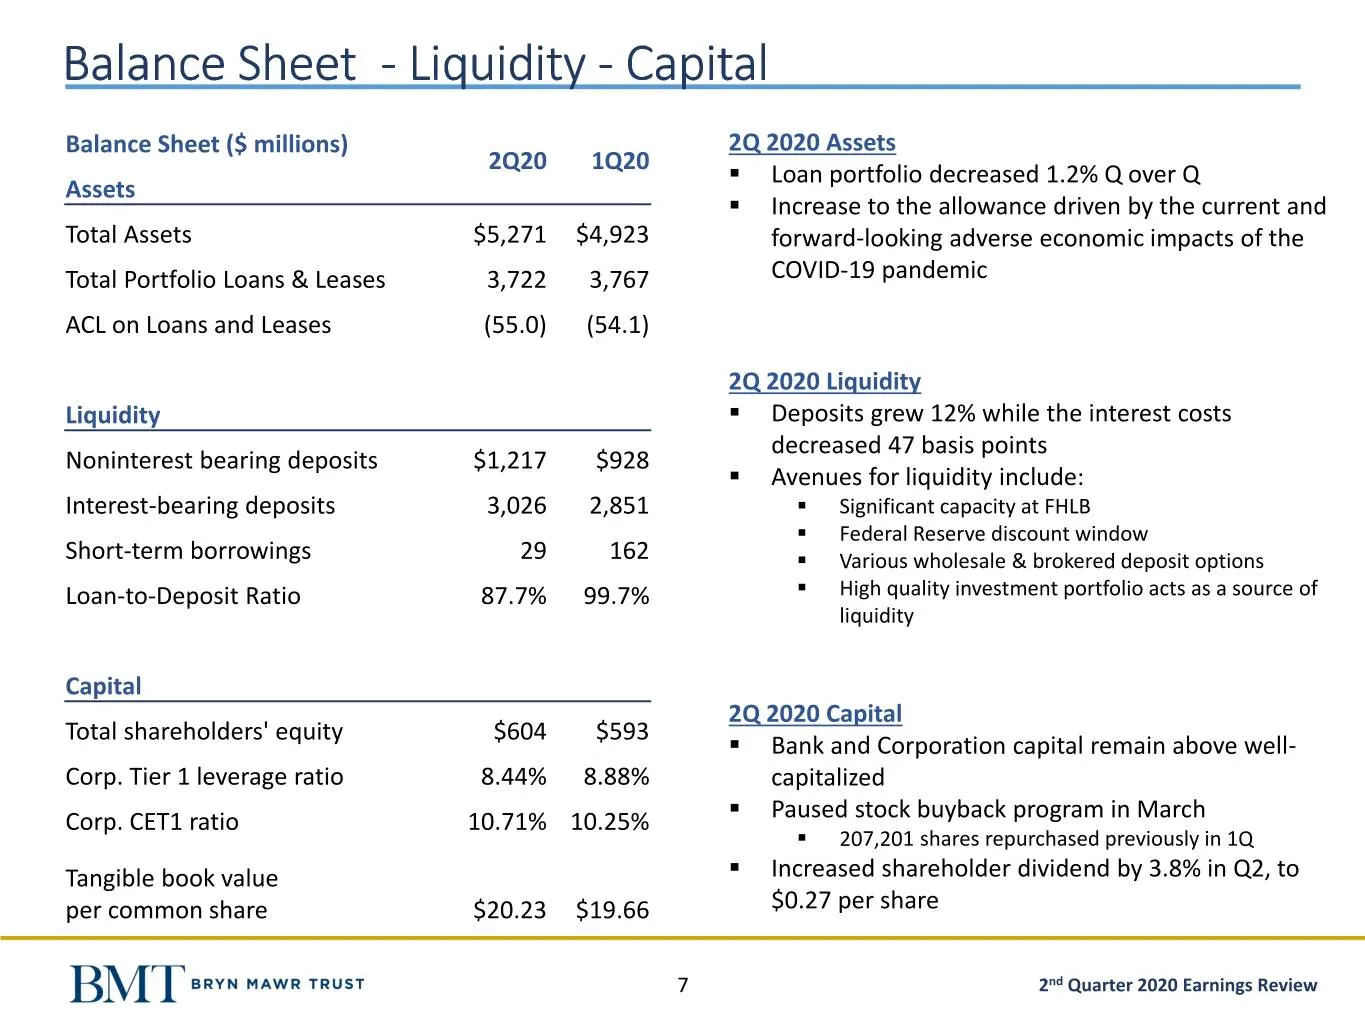
Balance Sheet - Liquidity - Capital Balance Sheet ($ millions) 2Q 2020 Assets 2Q20 1Q20 ▪ Loan portfolio decreased 1.2% Q over Q Assets ▪ Increase to the allowance driven by the current and Total Assets $5,271 $4,923 forward-looking adverse economic impacts of the Total Portfolio Loans & Leases 3,72
Slide 8: Asset Quality
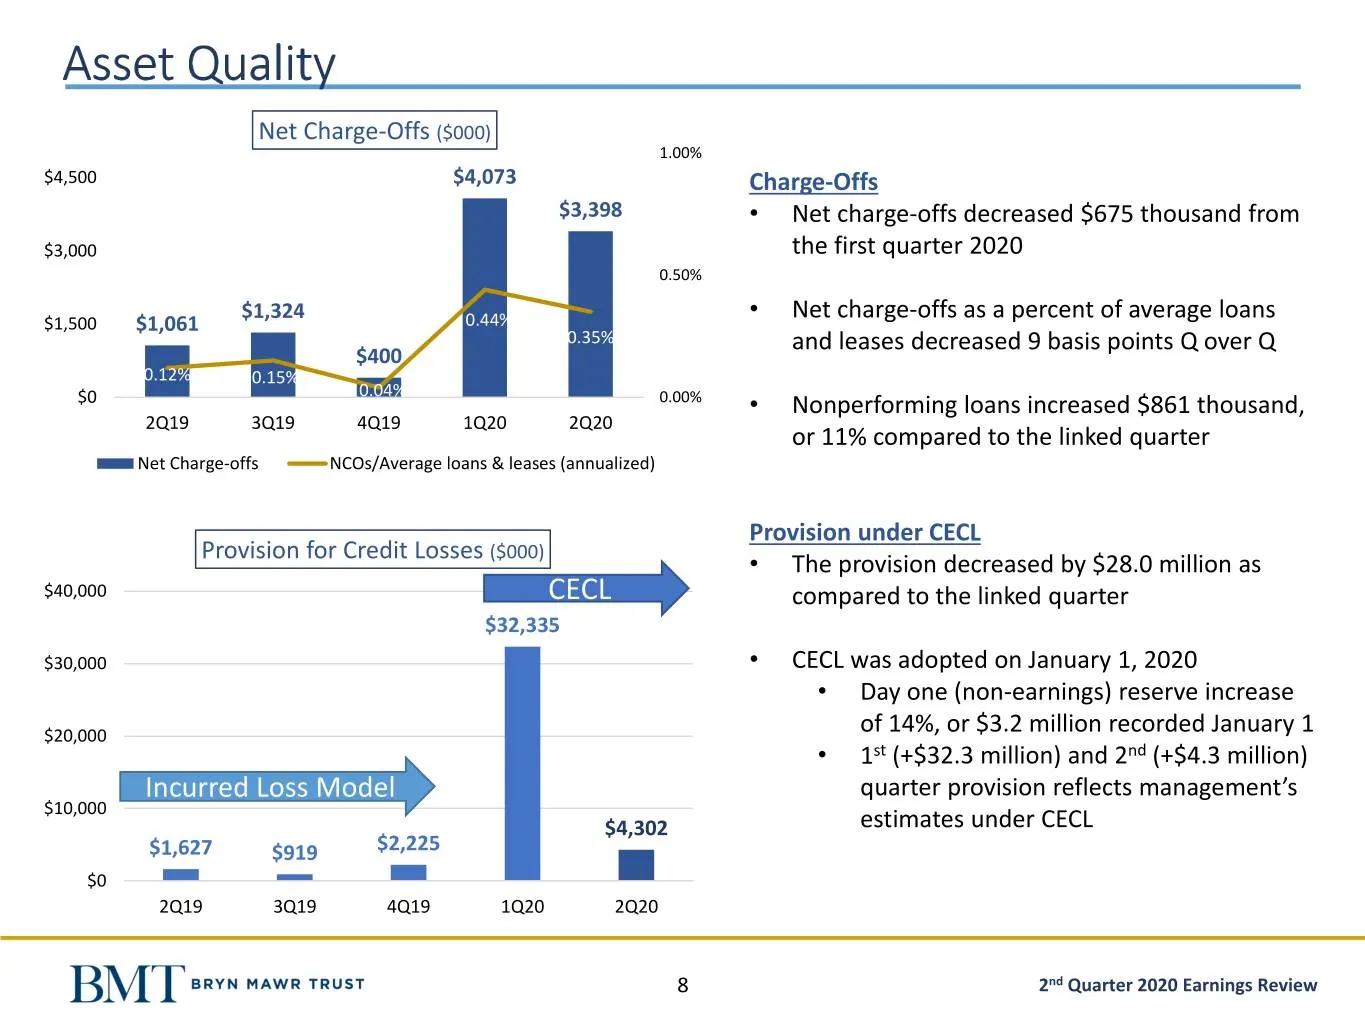
Asset Quality Net Charge-Offs ($000) 1.00% $4,500 $4,073 Charge-Offs $3,398 • Net charge-offs decreased $675 thousand from $3,000 the first quarter 2020 0.50% $1,324 • Net charge-offs as a percent of average loans $1,500 $1,061 0.44% 0.35% and leases decreased 9 basis points Q over Q $400 0.12% 0.15
Slide 9: Allowance for Credit Losses on Loans and Leases
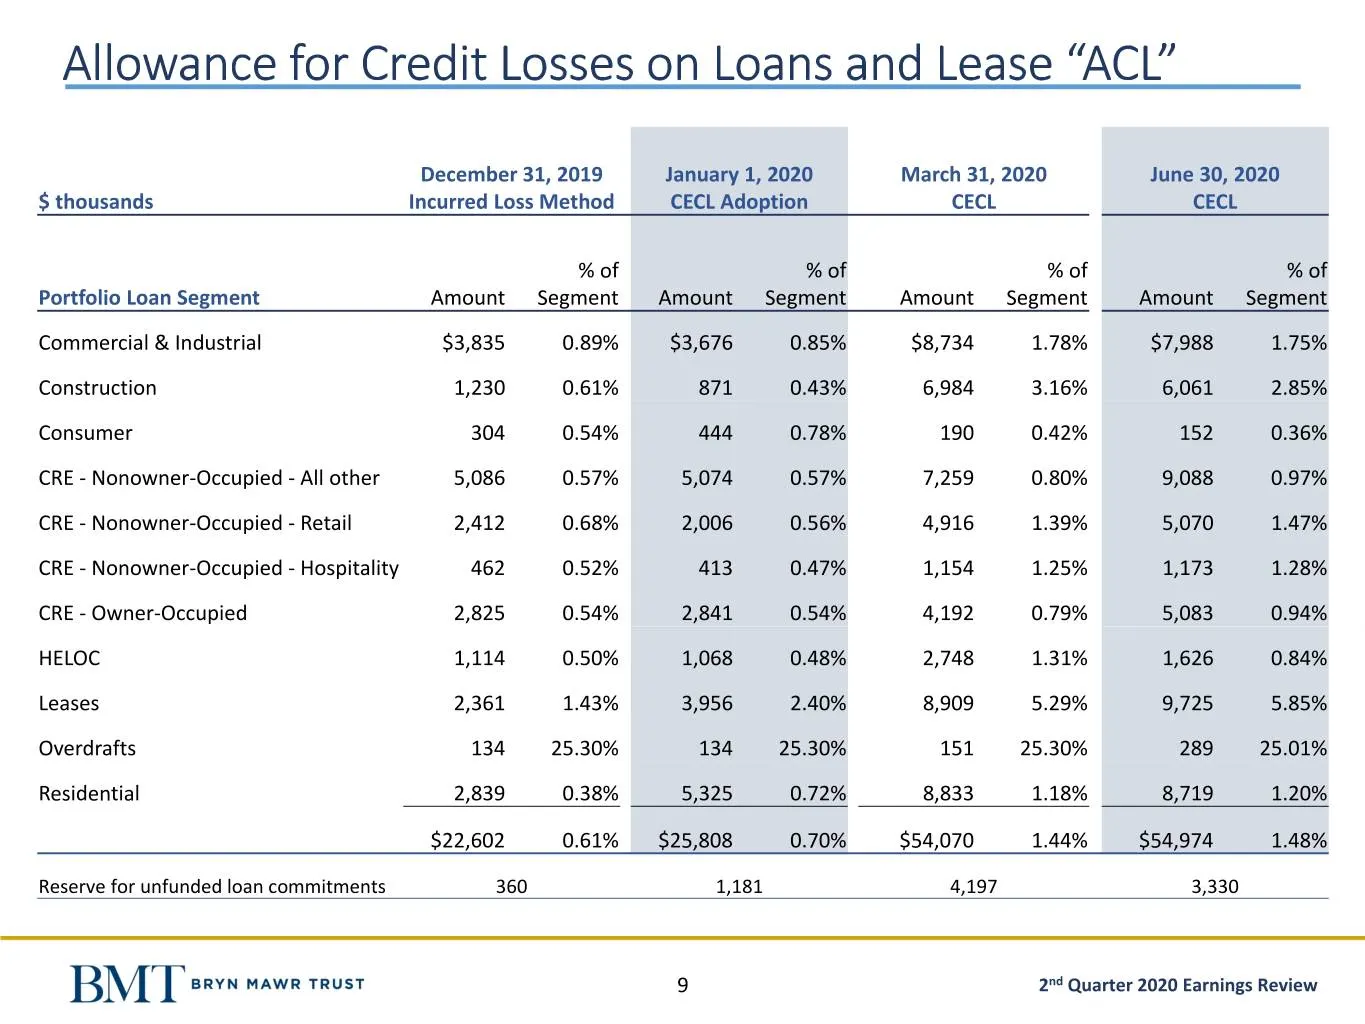
Allowance for Credit Losses on Loans and Lease “ACL” December 31, 2019 January 1, 2020 March 31, 2020 June 30, 2020 $ thousands Incurred Loss Method CECL Adoption CECL CECL % of % of % of % of Portfolio Loan Segment Amount Segment Amount Segment Amount Segment Amount Segment Commercial & Industrial
Slide 10: Loan Portfolio Segments
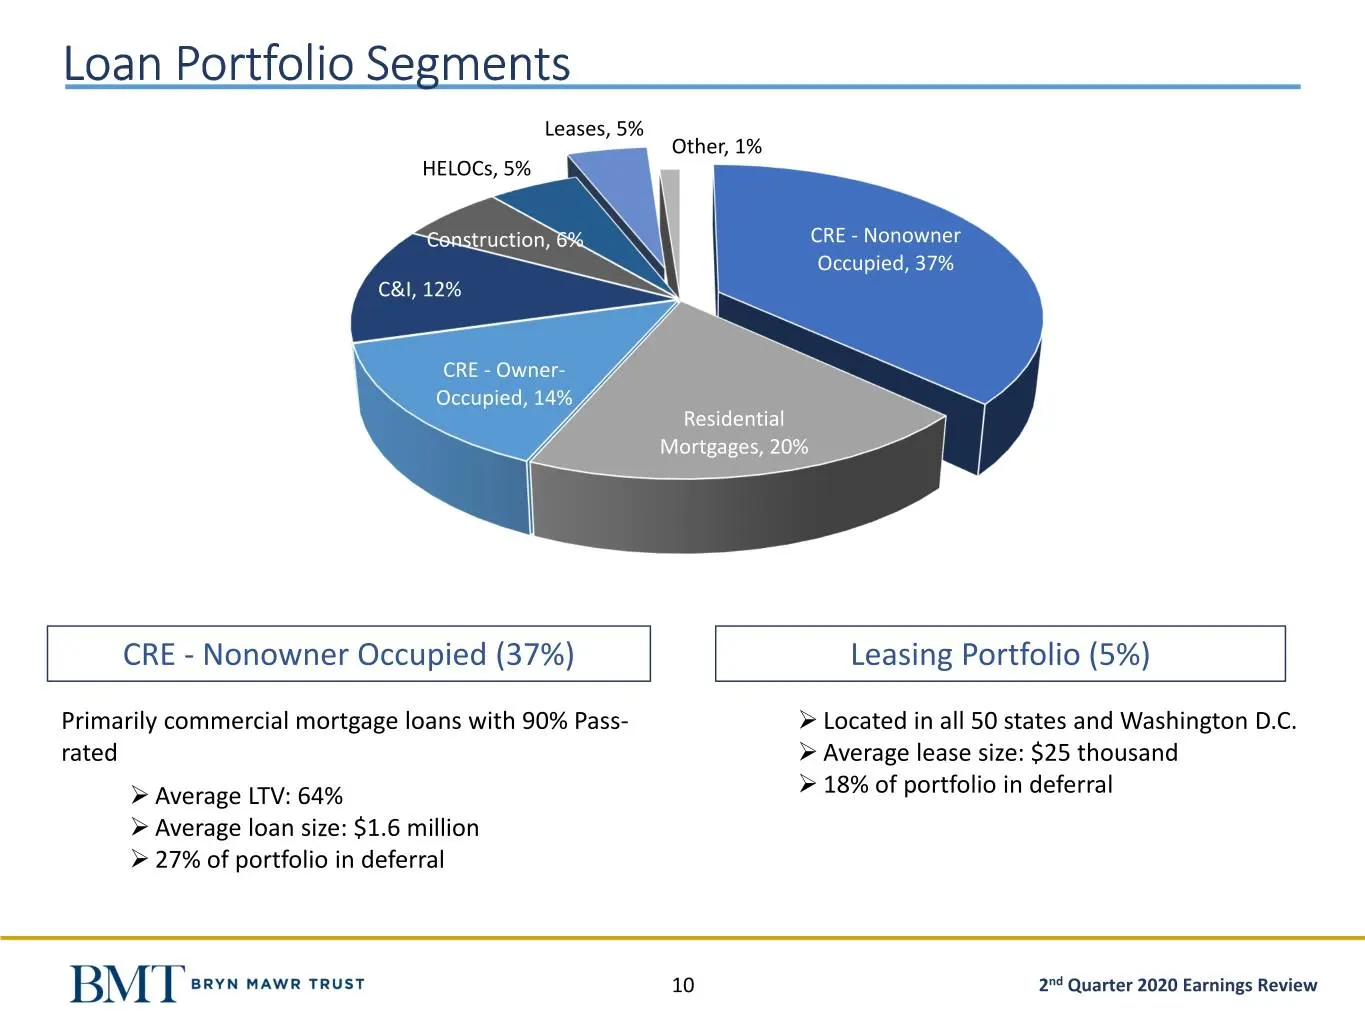
Loan Portfolio Segments Leases, 5% Other, 1% HELOCs, 5% Construction, 6% CRE - Nonowner Occupied, 37% C&I, 12% CRE - Owner- Occupied, 14% Residential Mortgages, 20% CRE - Nonowner Occupied (37%) Leasing Portfolio (5%) Primarily commercial mortgage loans with 90% Pass- ➢ Located in all 50 states and
Slide 11: Specialized Sector Exposures
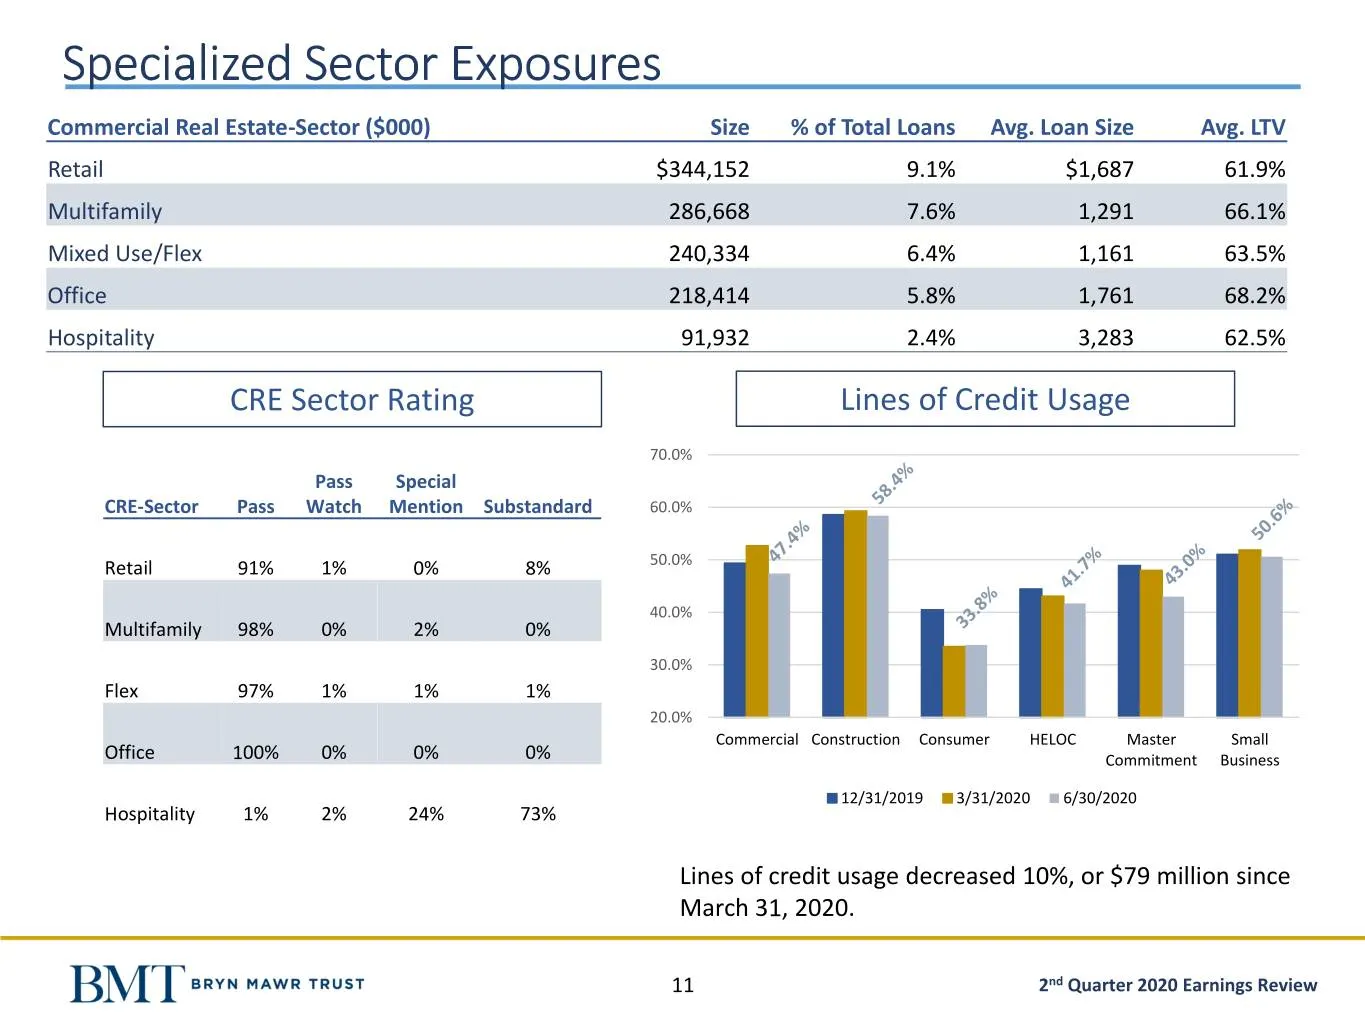
Specialized Sector Exposures Commercial Real Estate-Sector ($000) Size % of Total Loans Avg. Loan Size Avg. LTV Retail $344,152 9.1% $1,687 61.9% Multifamily 286,668 7.6% 1,291 66.1% Mixed Use/Flex 240,334 6.4% 1,161 63.5% Office 218,414 5.8% 1,761 68.2% Hospitality 91,932 2.4% 3,283 62.5% CRE Secto
Slide 12: Deferral & Classified/Criticized Loan Summary
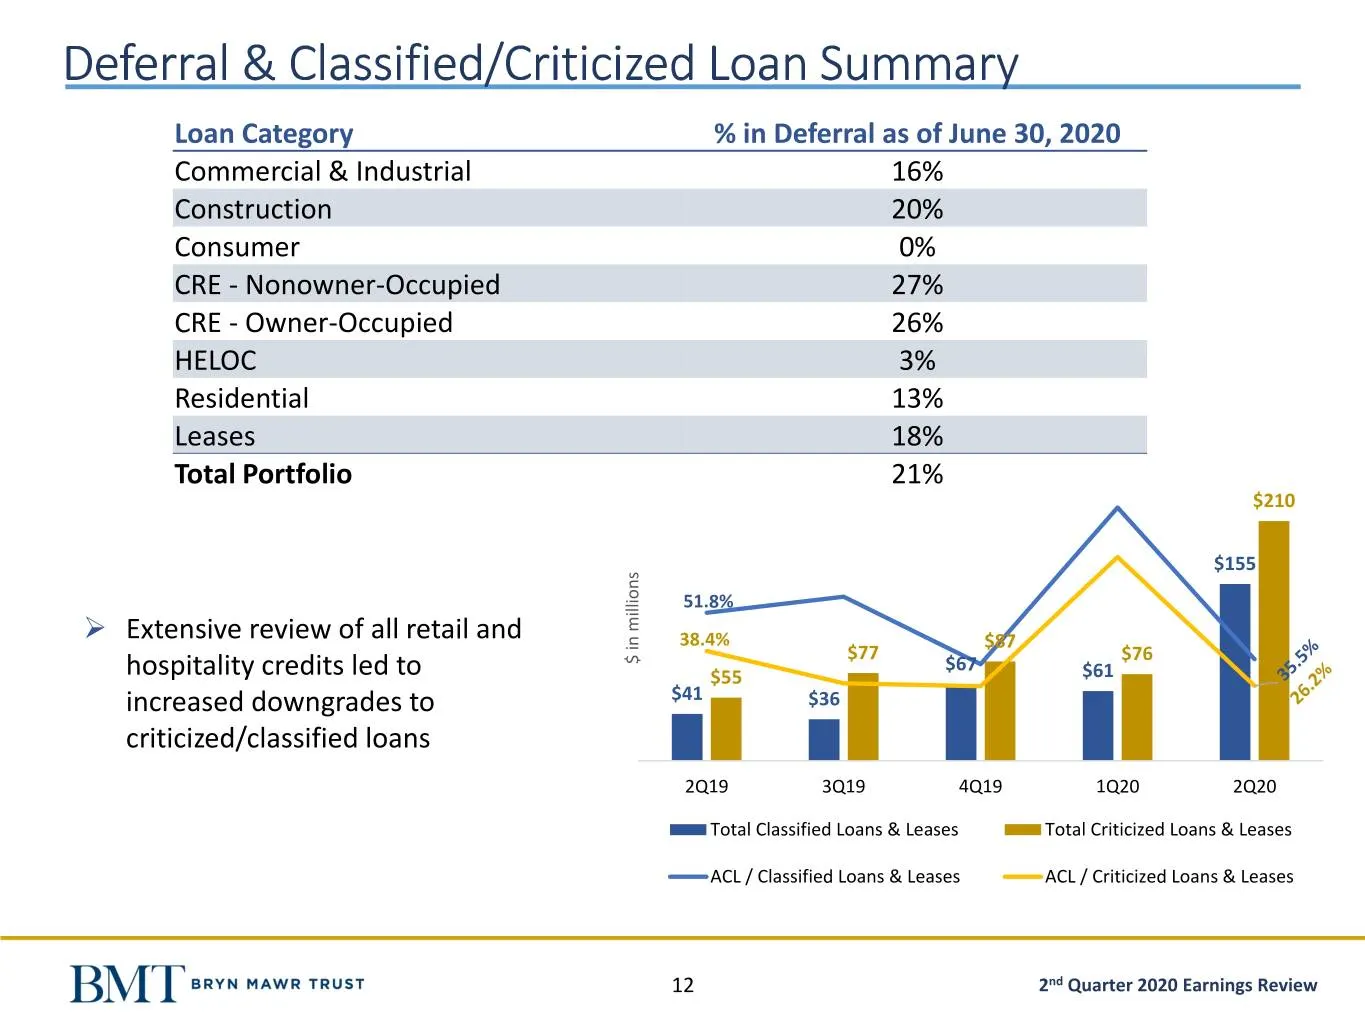
Deferral & Classified/Criticized Loan Summary Loan Category % in Deferral as of June 30, 2020 Commercial & Industrial 16% Construction 20% Consumer 0% CRE - Nonowner-Occupied 27% CRE - Owner-Occupied 26% HELOC 3% Residential 13% Leases 18% Total Portfolio 21% $210 $155 51.8% ➢ Extensive review of al
Slide 13: Non-GAAP Reconciliation
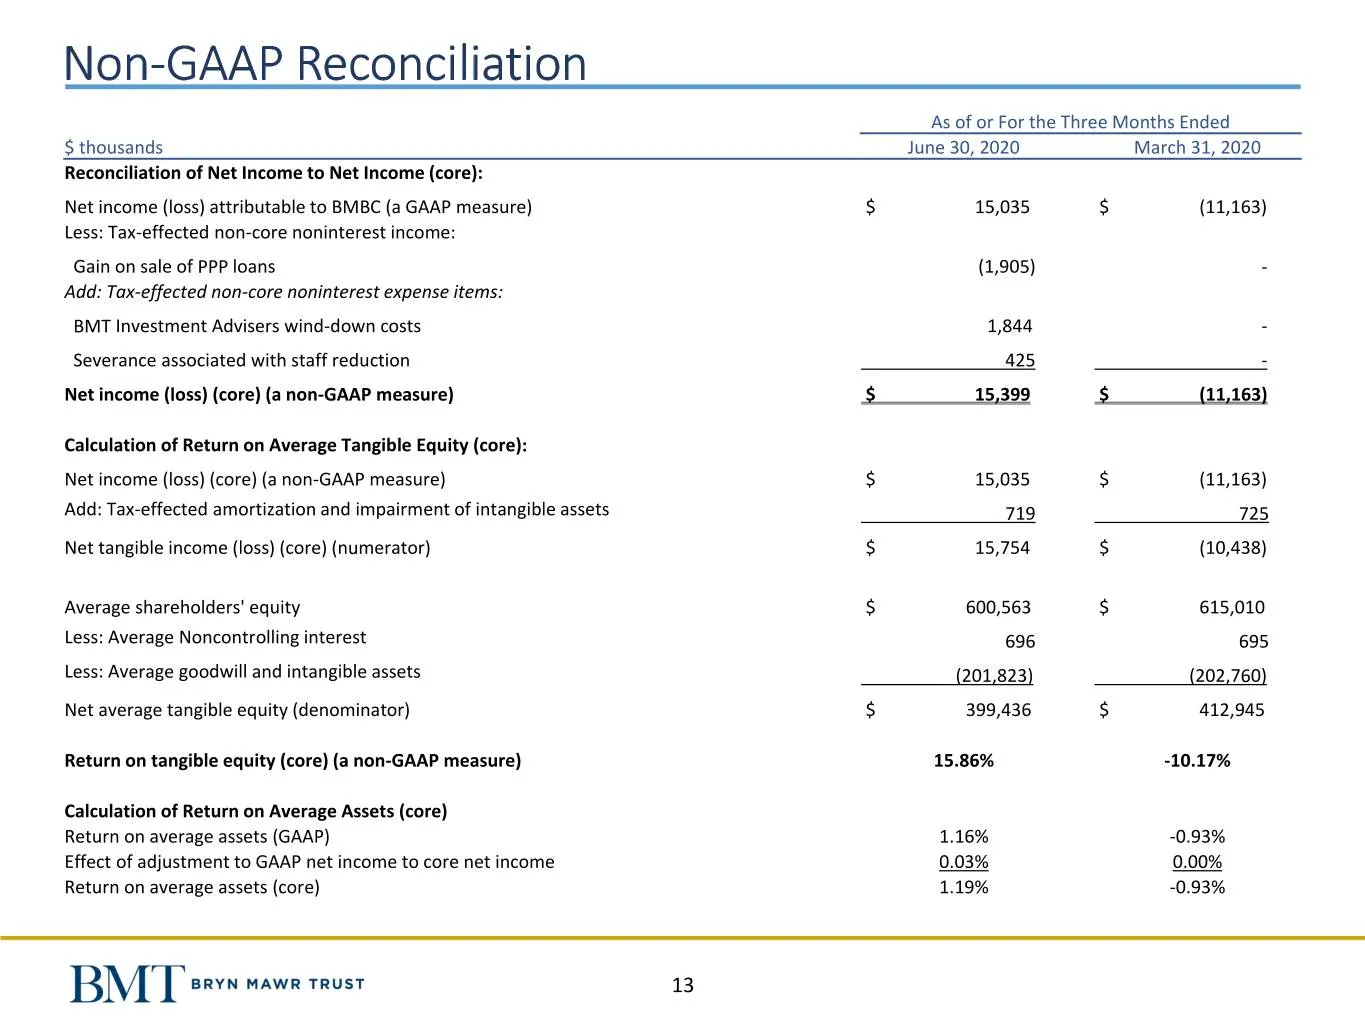
Non-GAAP Reconciliation As of or For the Three Months Ended $ thousands June 30, 2020 March 31, 2020 Reconciliation of Net Income to Net Income (core): Net income (loss) attributable to BMBC (a GAAP measure) $ 15,035 $ (11,163) Less: Tax-effected non-core noninterest income: Gain on sale of PPP loan
Slide 14: Non-GAAP Reconciliation
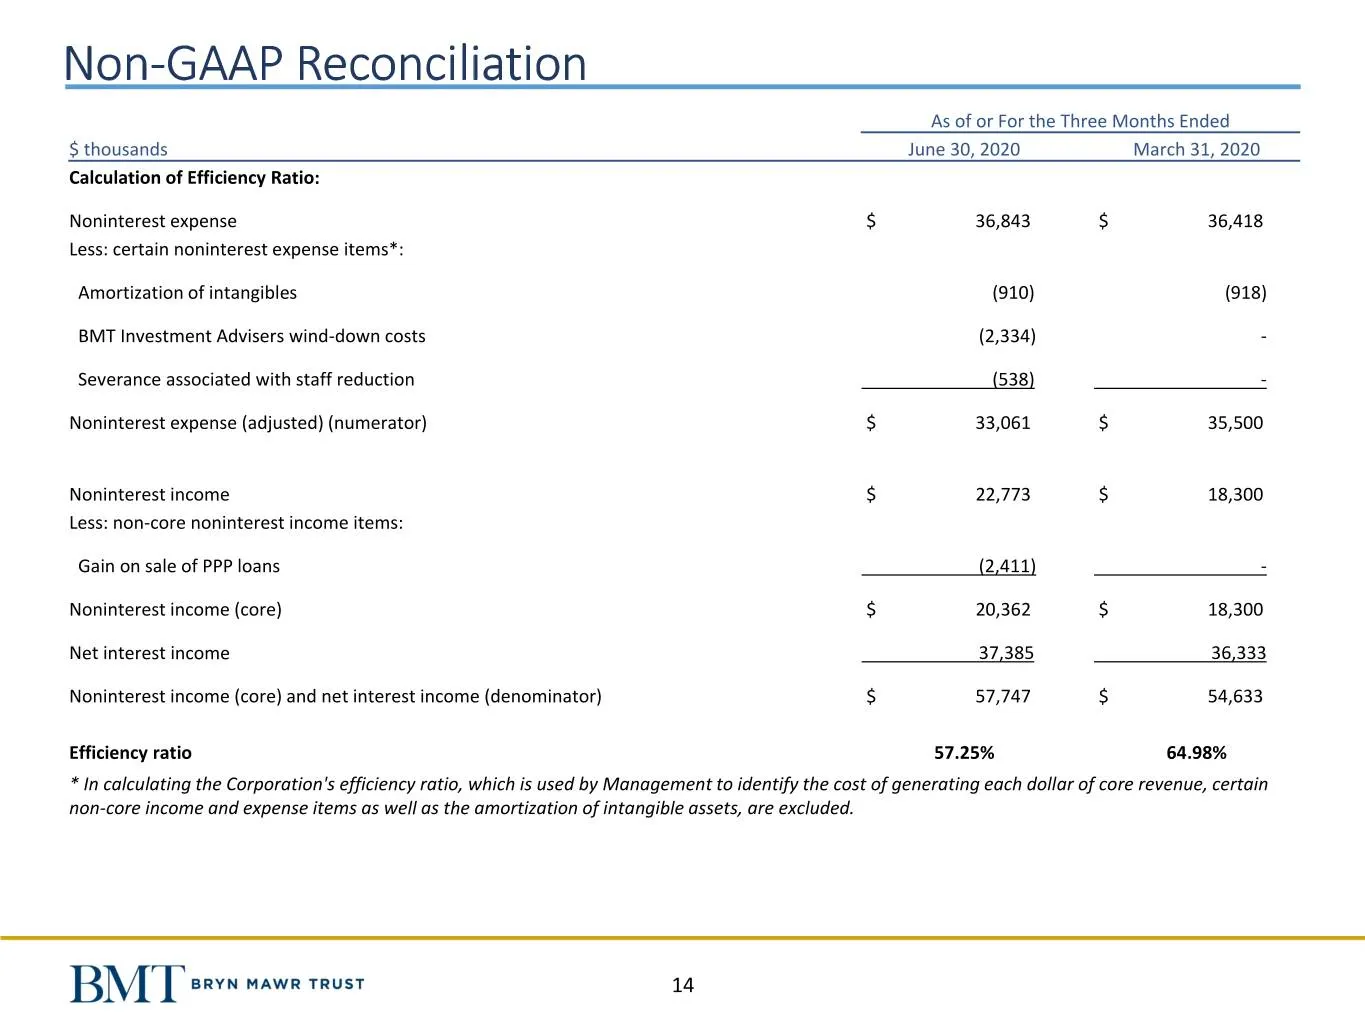
Non-GAAP Reconciliation As of or For the Three Months Ended $ thousands June 30, 2020 March 31, 2020 Calculation of Efficiency Ratio: Noninterest expense $ 36,843 $ 36,418 Less: certain noninterest expense items*: Amortization of intangibles (910) (918) BMT Investment Advisers wind-down costs (2,334
Source: SEC EDGAR · 8-K filed Jul 21, 2020
More decks from Bryn Mawr Bank Corporation
 Merger or Acquisition (March 2021)20 slides · Mar 10, 2021
 Q4 2020 Earnings Presentation16 slides · Jan 22, 2021
 Q3 2020 Earnings Presentation14 slides · Oct 23, 2020
 Investor Presentation (September 2020)17 slides · Sep 21, 2020
 Q1 2020 Earnings Presentation13 slides · Apr 21, 2020
 Q4 2019 Earnings Presentation36 slides · Feb 12, 2020