Omega Protein — Investor Presentation (May 2007)
47 slides from Omega Protein's investor presentation, May 29, 2007
Slide 1: May 2007
May 2007 Exhibit 99.1 The information presented herein may contain predictions, estimates and other forward- looking statements within the meaning of Section 27A of the Securities Act of 1933 and Section 21E of the Securities Exchange Act of 1934. Although the Company believes that its expectations

Slide 2: Company Overview
Company Overview

Slide 3: Founded in 1913
• Founded in 1913 • Approximately 1,100 employees • North America’s largest producer of fish meal • One of world’s largest fish oil producers • Attractive and growing target markets – Specialty animal feeds – Aquaculture feeds – Functional foods
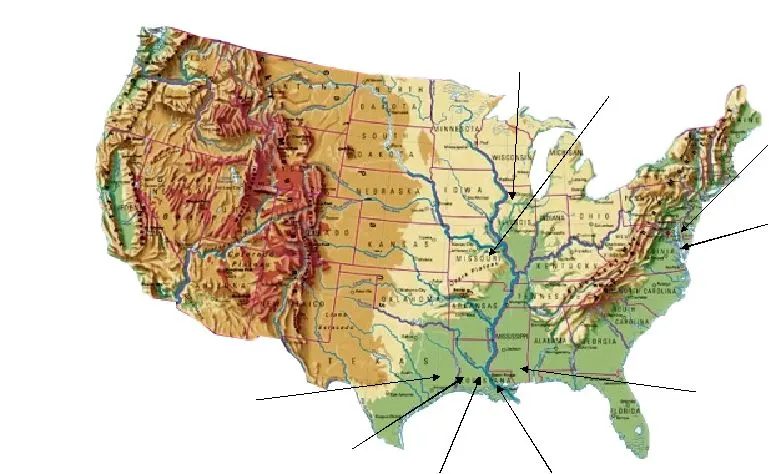
Slide 4: Office, Plant and Warehouse Locations
Office, Plant and Warehouse Locations Office, Plant and Warehouse Locations East Dubuque, IL Moss Point, MS Abbeville, LA Cameron, LA Avondale, LA Houston, TX Reedville, VA St, Louis, MO Norfolk, VA
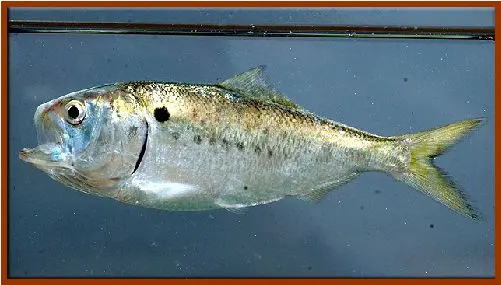
Slide 5: Menhaden
Menhaden ( Brevoortia tyrannus, Brevoortia patronus ) Female can lay up to 362,000 eggs Source: Amendment 1 to the Interstate Fishery Management Plan for Atlantic Menhaden. Atlantic States Marine Fisheries Commission, July 2001, p.5.
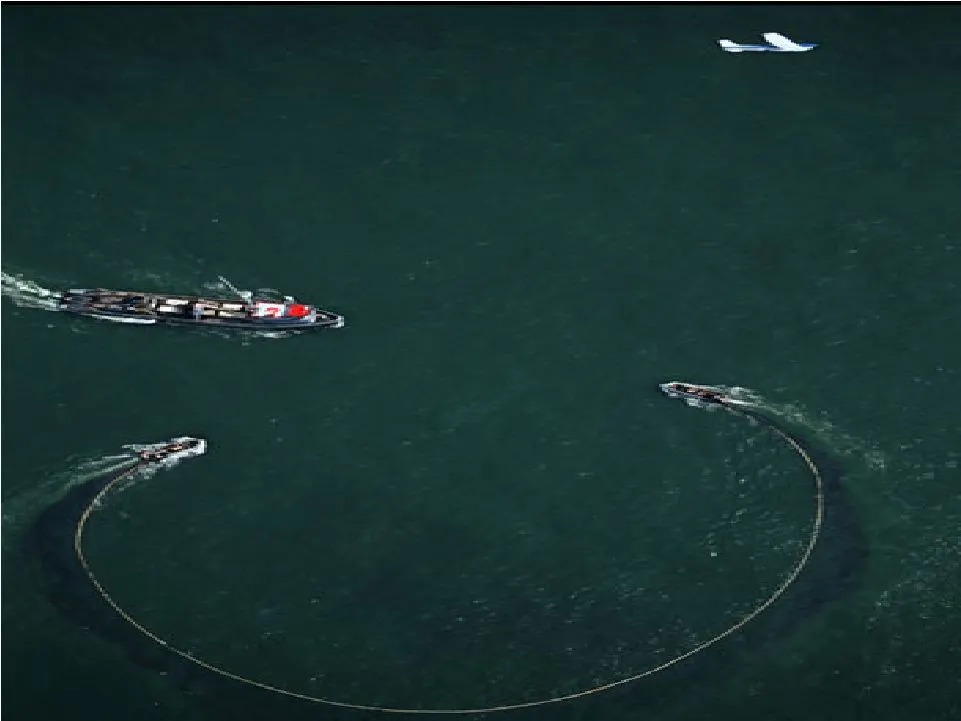
Slide 6: Purse Seine Fishing
Purse Seine Fishing

Slide 7: Menhaden: The Sustainable Resource
Menhaden: The Sustainable Resource “The status of the stock coastwide is considered to be healthy based on newly recommended benchmarks developed in the latest peer-reviewed stock assessment.” - National Marine Fisheries Service (2006 Stock Assessment) “The stock is not considered to be over - fishe
Slide 8: Omega Protein's Products
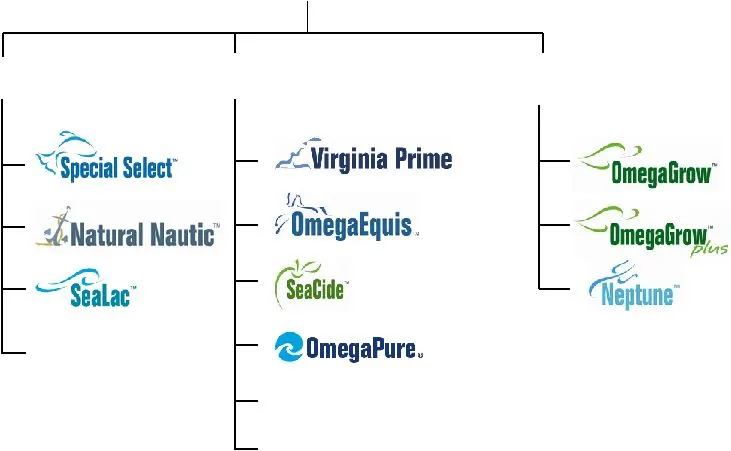
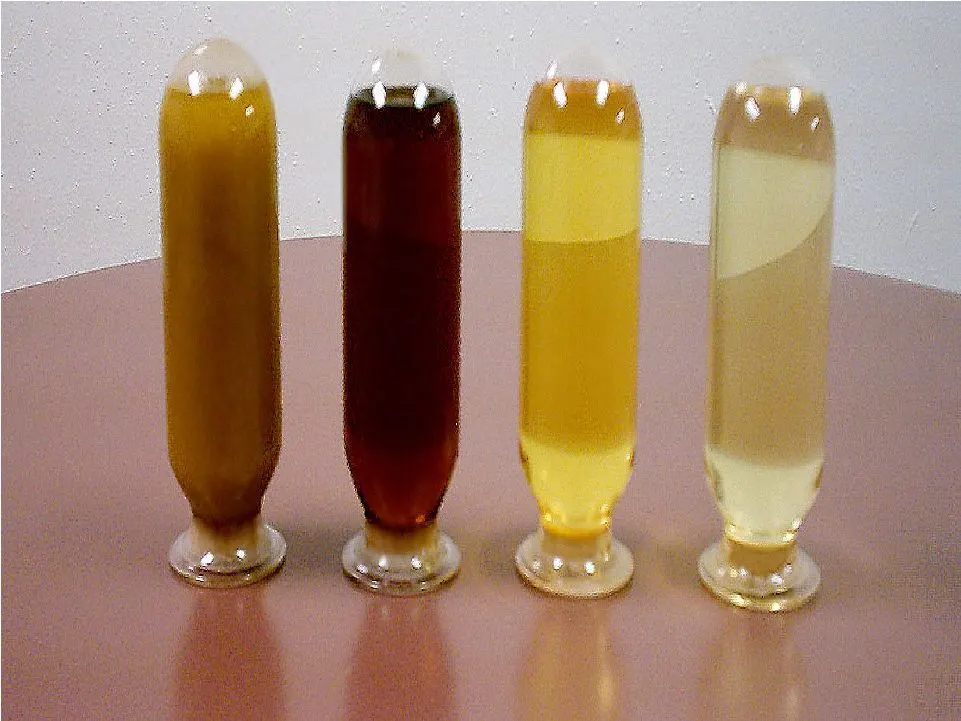
Omega Protein’s Products Omega Protein’s Products Menhaden Fish Oil Fish Meal Fish Solubles FAQ Aqua Oil Crude Oil

Slide 9: Agriproducts
Agriproducts
Slide 10: Feed to Food supply chain
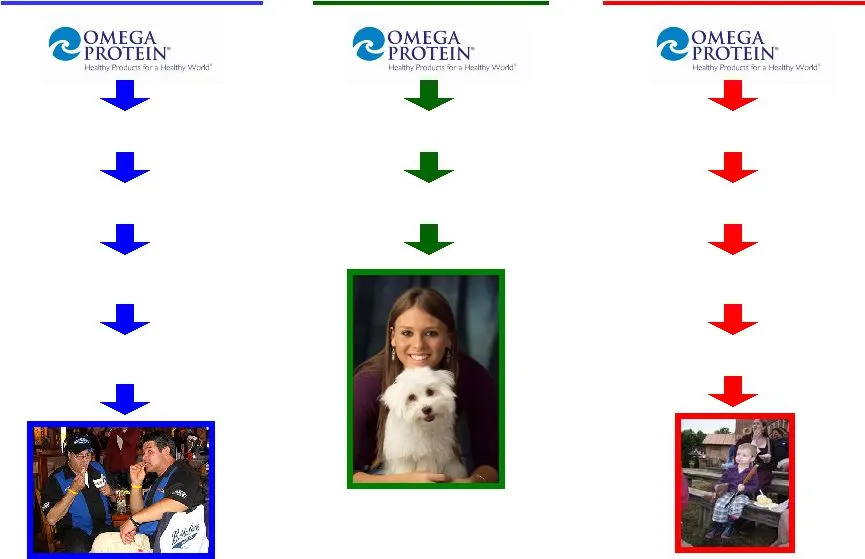
Slaughterhouse/Packer Processing Plant Hog Farmer Pet Food Retailer Aqua Producer Feed Manufacturer Feed Manufacturer Feed Manufacturer Swine Pet Aquaculture Food Store Food Store Feed to Food
Slide 11: Top Feed Manufacturers: 2006
Top 20 Feed Manufacturers: 2006 Company Headquarters Production Capacity (000) Cargill/Agribrands USA 17,500 Charoen Pokphand Thailand 15,200 Land O’Lakes USA 11,500 Tyson Foods USA 10,000 Zen-noh Co-operatives Japan 7,800 Nutreco Netherlands 6,100 Ucaab Co-operatives France 4,000 ABNA UK 3,800 Smit
Slide 12: World Meal Production
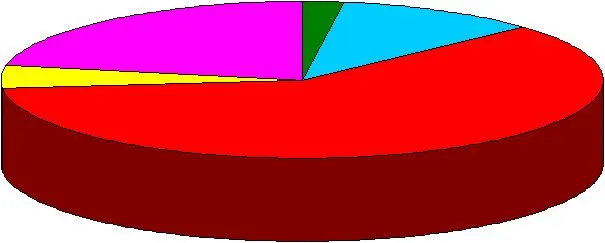
World Meal Production 2005 -2006 Soy 60.3% Other 21.9% Rapeseed 10.7% Fish 2.3% Sunflower 4.8% Source: Mielke, T. (Ed.). (2006). Oil World Annual . Hamburg, Germany: ISTA Mielke GmbH.
Slide 13: Fish Meal
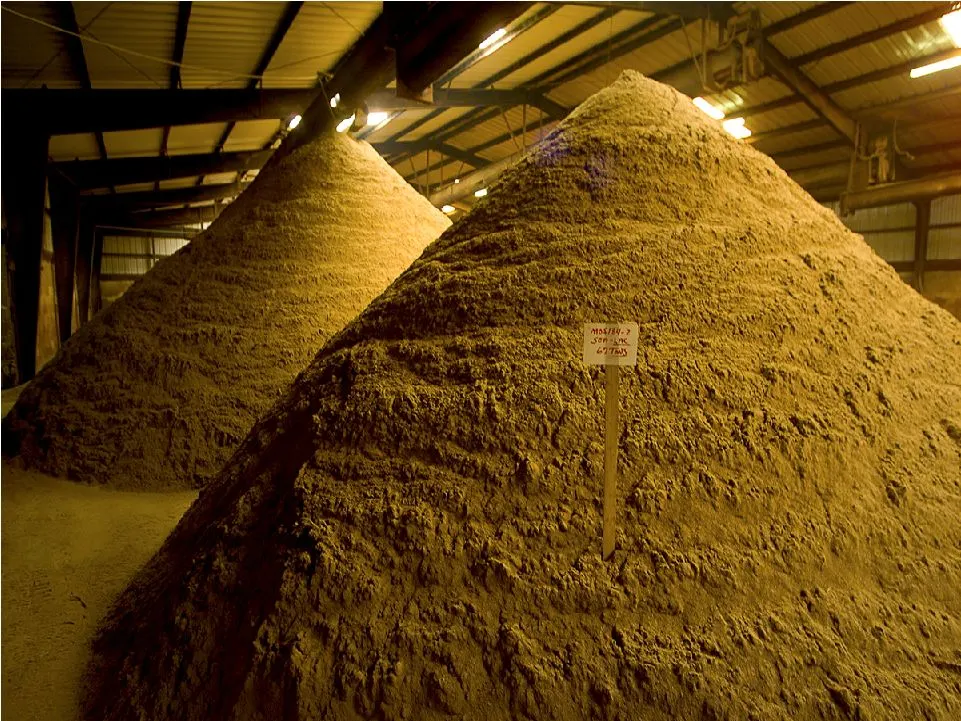
Fish Meal
Slide 14: Global Fish Meal Output
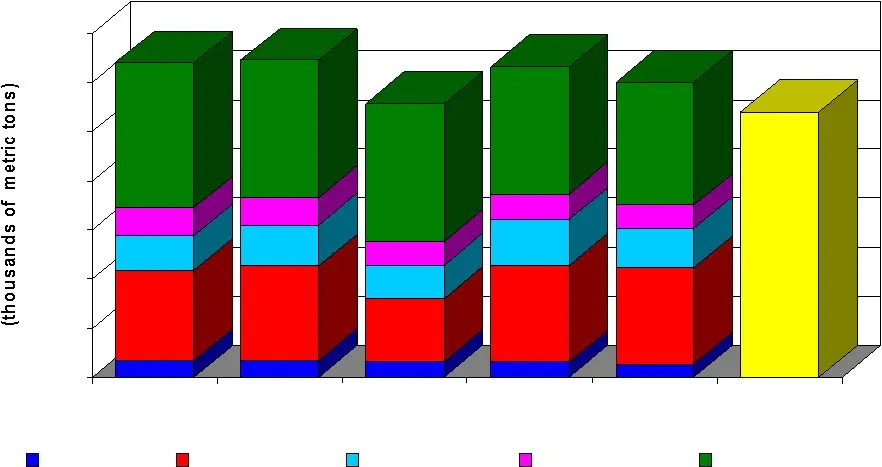
Global Fish Meal Output Source: Mielke, T. (Ed.). (2006). Oil World Annual . Hamburg, Germany: ISTA Mielke GmbH, (Oilmeals, p 32). *Mittaine, J.F. (2007, May). Panorama of the World Economic Environment and Recent Market Developments . Presented at the IFFO Commercial Committee Meeting, Miami, FL. 1
Slide 15: Fish Meal Imports in Key Markets
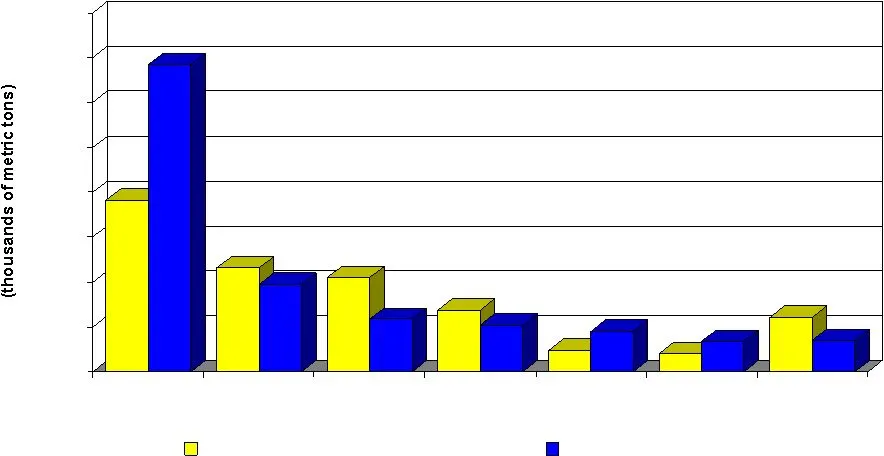
Fish Meal Imports in Key Markets 1994-1996 and 2004-2005 1369 1000 1200 1400 1600 China Japan Taiwan Germany Norway Denmark U.K. Average 1994-1996 Average 2004-2005 Source: Mittaine, J. F. (2006, April). Panorama Of The World Economic Environment And Recent Market Developments. Presented at the IFFO
Slide 16: Omega Protein Fish Meal Production
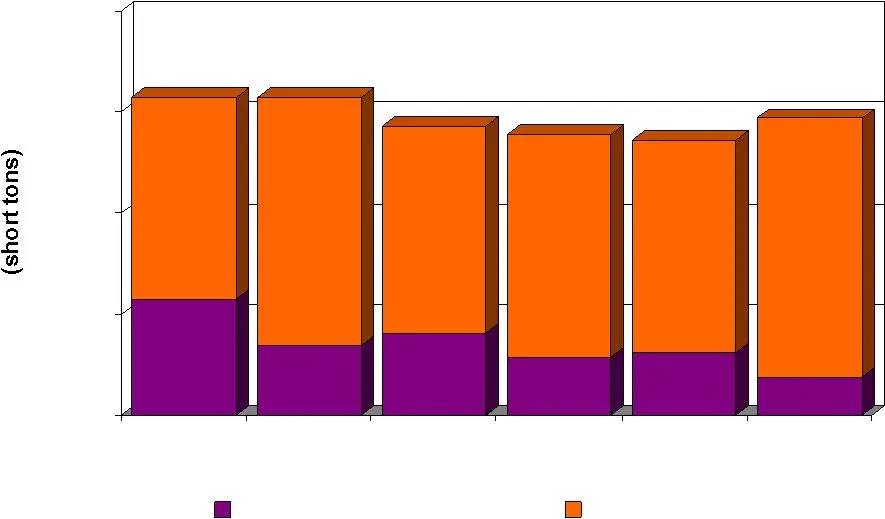
57,833 99,049 34,661 122,140 40,795 102,406 29,016 109,922 30,944 105,203 19,250 127,695 Omega Protein Fish Meal Production 50,000 100,000 150,000 200,000 2001 2002 2003 2004 2005 2006 FAQ Specialty
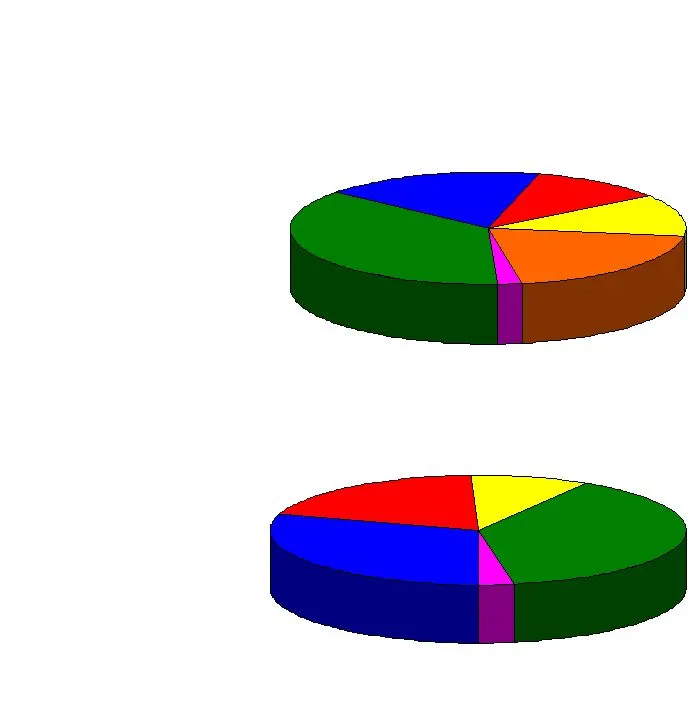
Slide 17: Total Omega Fish Meal Sales by Market
Total Omega Fish Meal Sales by Market Dairy 10% Swine 43% Aqua 33% Pet 22% Other 3% Aqua 18% Pet 11% Poultry 20% Dairy 12% Other 2% Swine 37% 2000 2006
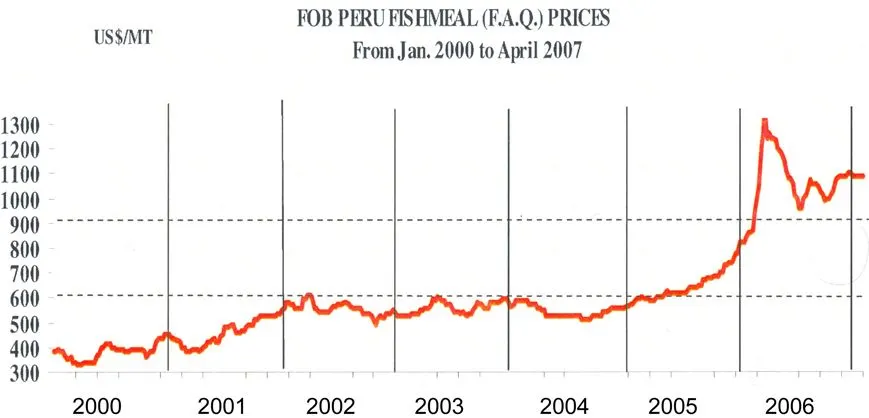
Slide 18: Fish meal market developments
Source: Mittaine, J. F. (2007, May). Panorama of the world economic environment and recent market developments. Presented at the IFFO Commercial Committee Meeting, Miami, FL.
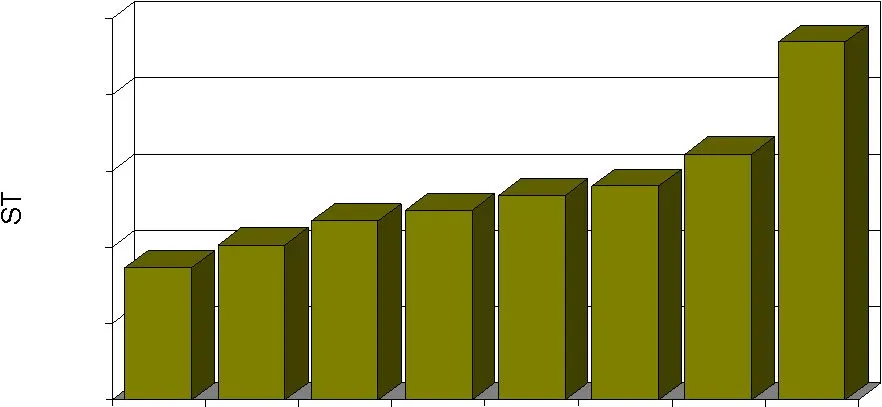
Slide 19: Omega Protein's Average Price per Ton: Fish Meal
$348 $407 $469 $498 $537 $562 $646 $940 Omega Protein’s Average Price per Ton Fish Meal $0 $200 $400 $600 $800 $1,000 2000 2001 2002 2003 2004 2005 2006 Current Spot as of 05/23/07
Slide 20: Fish Oil
Fish Oil
Slide 21: Global Production of Oils and Fats
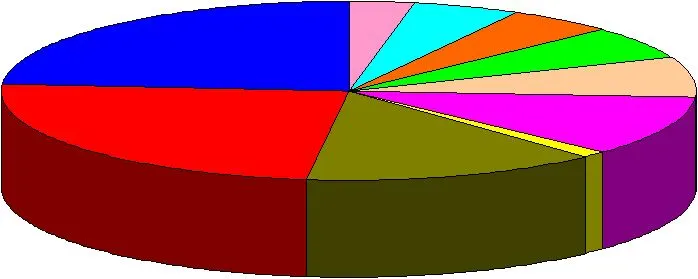
Global Production of Oils and Fats 2005 Palm Oil 24% Lard 5% Rapeseed 11% Sunflower 7% Tallow and Grease 6% Butter 5% Groundnut 3% Fish Oil 1% Other Oils 14% Soybean Oil 24% Source: Mielke, T. (Ed.). (2006). Oil World Annual . Hamburg, Germany: ISTA Mielke GmbH, (Oils & Fats, Summary 3).
Slide 22: Global Fish Oil Output
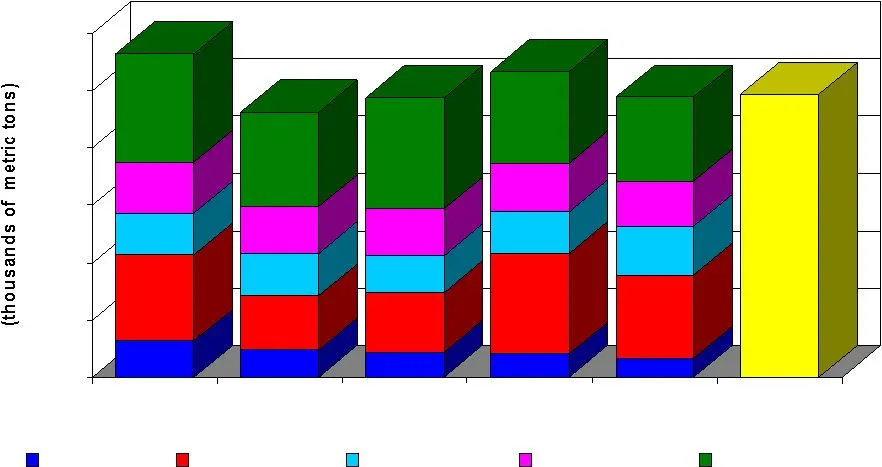
Global Fish Oil Output Source: Mielke, T. (Ed.). (2006). Oil World Annual . Hamburg, Germany: ISTA Mielke GmbH, (Oilmeals, p 32). *Mittaine, J.F. (2007, May). Panorama of the World Economic Environment and Recent Market Developments . Presented at the IFFO Commercial Committee Meeting, Miami, FL. 1,
Slide 23: Total Omega Fish Oil Sales by Market
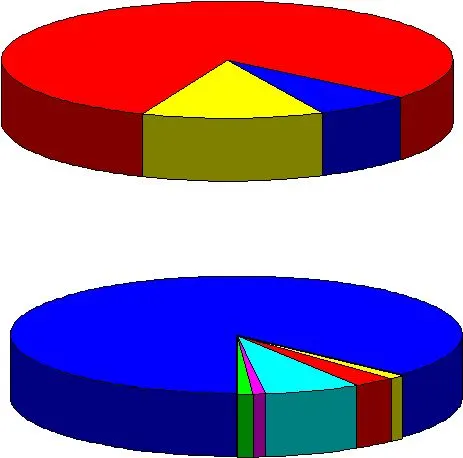
Total Omega Fish Oil Sales by Market Poultry 1% Industrial 3% Dairy 1% Aquaculture 87% Pet 7% Swine 1% 2000 2006 Hydrogenation 80% Beef 13% Aquaculture 7%
Slide 24: Omega Protein's Average Price per Ton: Fish Oil
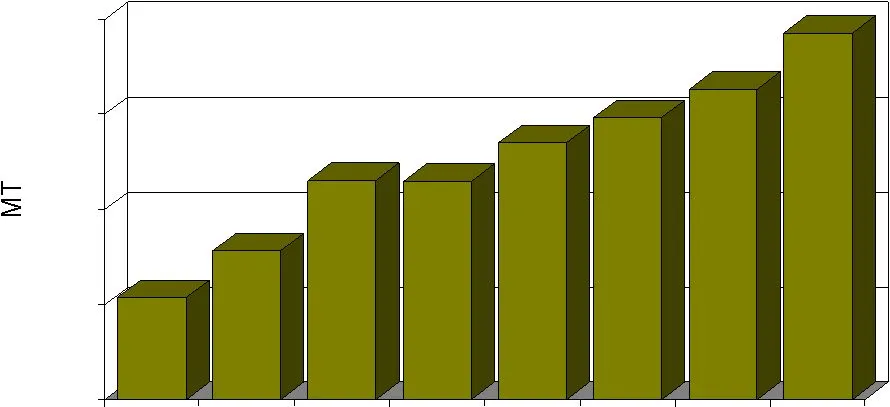
$215 $313 $461 $459 $540 $594 $652 $770 Omega Protein’s Average Price per Ton Fish Oil $0 $200 $400 $600 $800 2000 2001 2002 2003 2004 2005 2006 Current Spot as of 05/23/07 Developing Markets • Aquaculture : Increasing demand for farmed salmon and other seafood. • Pets : Rising pet ownership and dem
Slide 25: Aquaculture
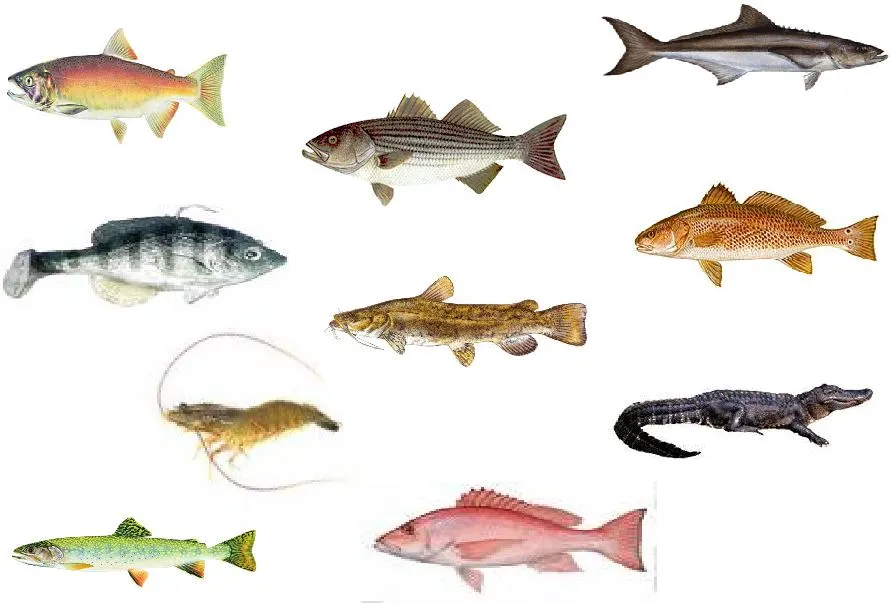
Aquaculture Atlantic Salmon Trout Cobia Red Snapper Tilapia Catfish Shrimp Striped Bass Redfish Alligator
Slide 26: Aquaculture market data
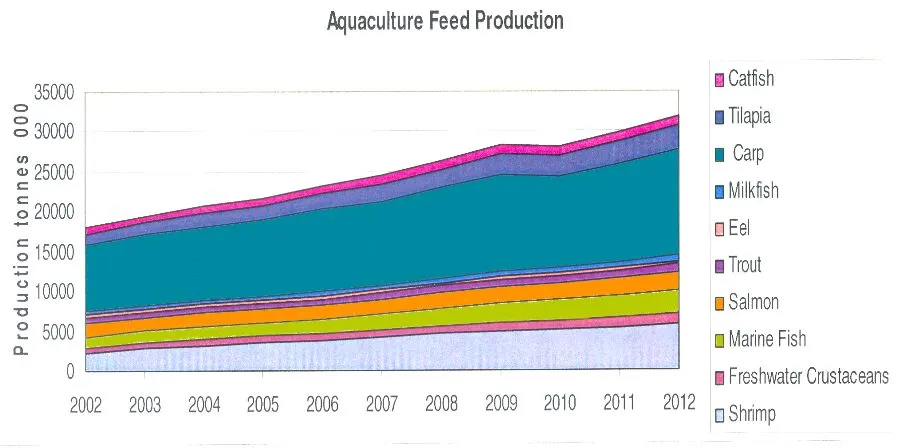
Source: Mittaine, J. F. (2007, May). Panorama of the world economic environment and recent market developments. Presented at the IFFO Commercial Committee Meeting, Miami, FL.
Slide 27: Production of Farmed Salmon and Trout
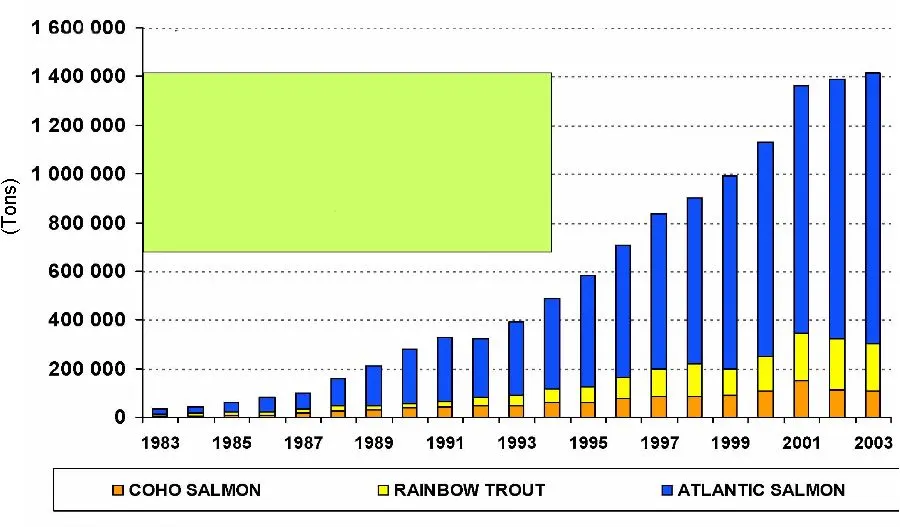
Production of Farmed Salmon and Trout by Major Species Total salmon and rainbow trout (marine brackish water) production in 2003 was 1,464,289 tons Atlantic Salmon 1,115,006 tons or 76.1% Rainbow Trout 195,032 tons or 13.3% Coho Salmon 105,786 tons or 7.2% Chinook Salmon 22,030 tons or 1.5% Source:
Slide 28: Pet Food Growth Drivers
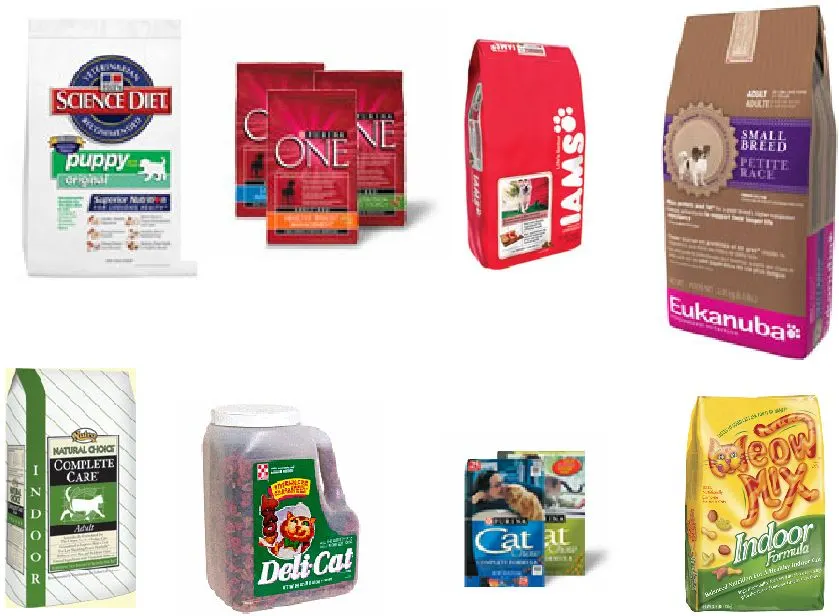
Pet Food Growth Drivers • Health-oriented pet products will spur growth in mature markets (U.S., Europe). • China and Russia will see strong growth. – Rising disposable income – Improved distribution – Changing consumer attitudes toward pets • Mid-priced brands (including Nestlé and Mars) are lookin

Slide 29: Sales Forecasts of Pet Products by Region
Sales Forecasts of Pet Products by Region (billions) 15.1% $67.0 $58.3 WORLD 22.9% 0.69 0.56 Africa/Middle East 17.4% 2.0 1.7 Australasia 13.8% 7.9 7.0 Asia Pacific 40.2% 5.5 3.9 Latin America 11.3% 24.7 22.2 North America 72.9% 2.7 1.6 Eastern Europe 10.1% $23.5 $21.4 Western Europe % Change 2010 2
Slide 30: Global Sales of Dog and Cat Food
% Growth 2010 2005 Category 14.1 $48,017.8 $42,077.8 Total cat and dog food 11.9 $18,099.9 $16,174.4 Total cat food 20.1 $ 756.1 $ 629.5 Cat treats and mixers 1.5 $ 2,342.6 $ 2,306.9 Economy cat food 8.3 $ 7,093.8 $ 6,548.8 Mid-priced cat food 18.2 $ 7,907.3 $ 6,689.2 Premium cat food 15.5 $29,917.9
Slide 31: CI Hubbard Feeds Inc.
CI Hubbard Feeds Inc. Pr nswers that WORK * JUBBARD. (74 SOUTHERN STATES
Slide 32: The World Market Demand for Meat
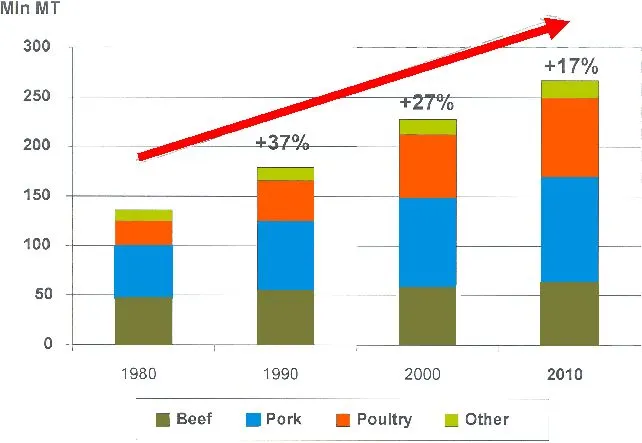
The World Market Demand for Meat Source: Hartog, L. (2005, April). Global Perspective on Integrated Pork Production. Presented at the London Swine Conference, England.
Slide 33: Pork Production
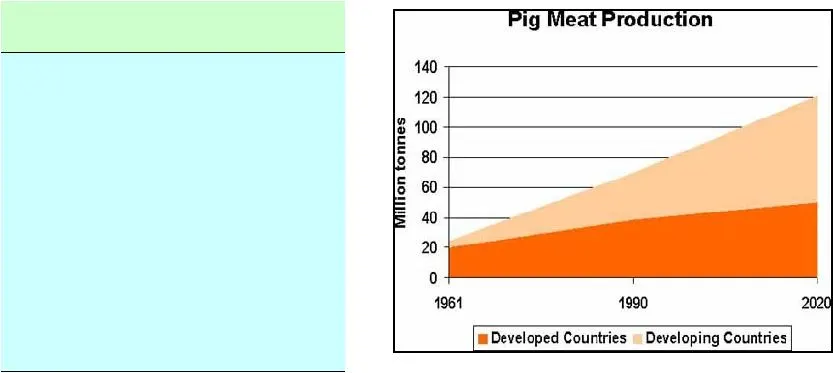
Pork Production 2003 Pork Production by Country Historical and Projected Pork Production Source: Speedy, A. Overview of world feed protein needs and supply. Retrieved May 24, 2007, from FAO Corporate Document Repository Web site: http://www.fao.org/docrep/007/y5019e/y5019e05.htm 1.76 Denmark 1.80 Vi

Slide 34: University research partners
Kansas State University ra WW RICSTATE UK UNIVERSITY OF KENTUCKY Allm BG university of Missouri-Columbia Colorado M@Virginialech Tier Invent the Future AUBURN .LSsD oo UCDAVIS Alii UY iv Ew ti) UNIVERSITY OF CALIFORNIA

Slide 35: OmegaPure: Healthy Products for a Healthy World
42 OmegaPure Healthy Products for a Healthy World®
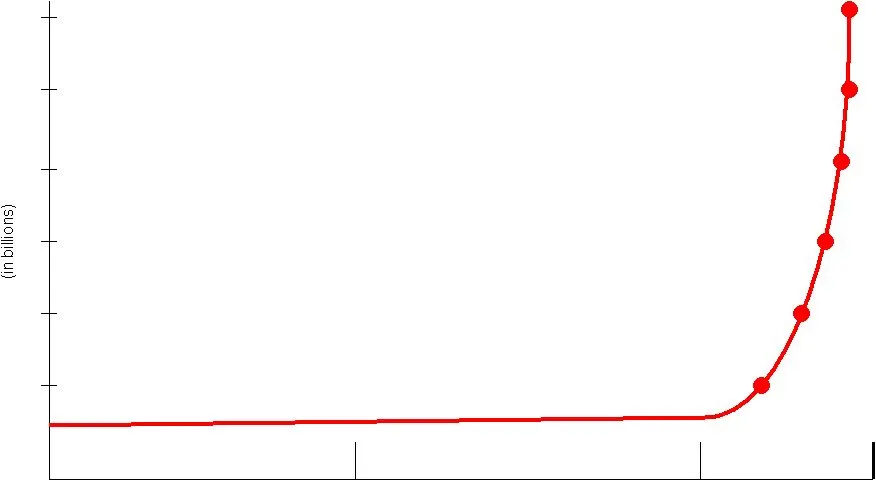
Slide 36: World Population Growth
World Population Growth Industrial Agricultural Hunter-Gatherer 1850 1930 1960 1976 1986 2006 (-4x10 years) (-10,000 years) 1800 1900 2000 Source: Leaf and Weber Am J Clin Nutr 1987;45:1048-1053
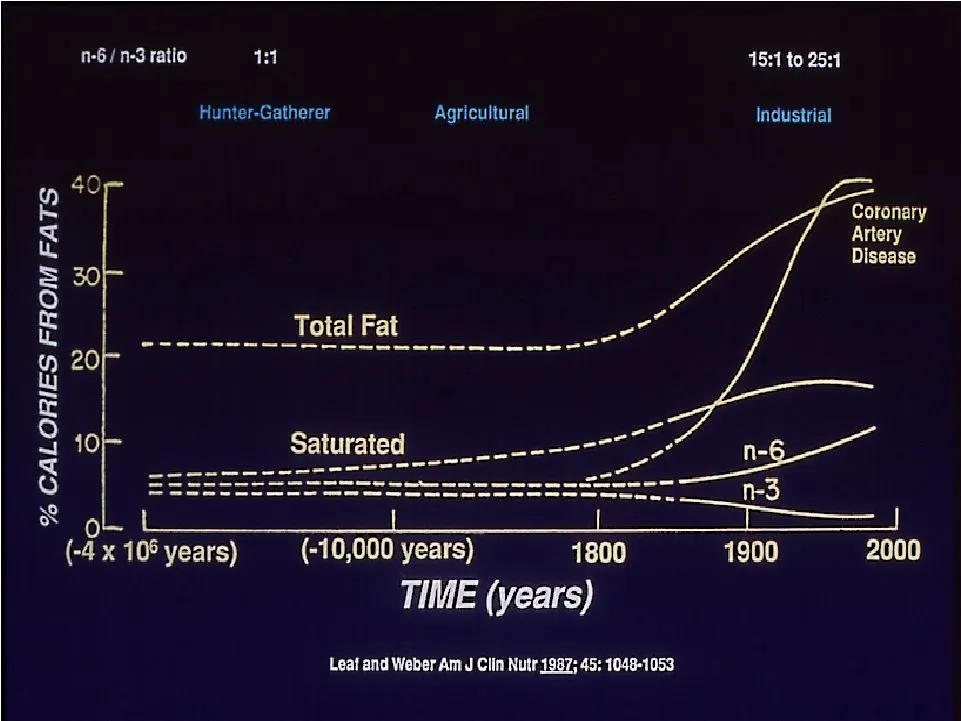
Slide 37: % Calories from Fats
% CALORIES FROM FATS n-6/n-3 ratio 11 15:1 to 25:1 Hunter-Gatherer Agricultural Industrial 40 Coronary Artery Disease 30 on 25s Total Fat - (Xo) ea aR cea peace aaa 40 Saturated = ____--- eae ee (e) (-4 x 10° years) (-10,000 years) 1800 1900 2000 TIME (years) Leaf and Weber Am J Clin Nutr 1987; 45:
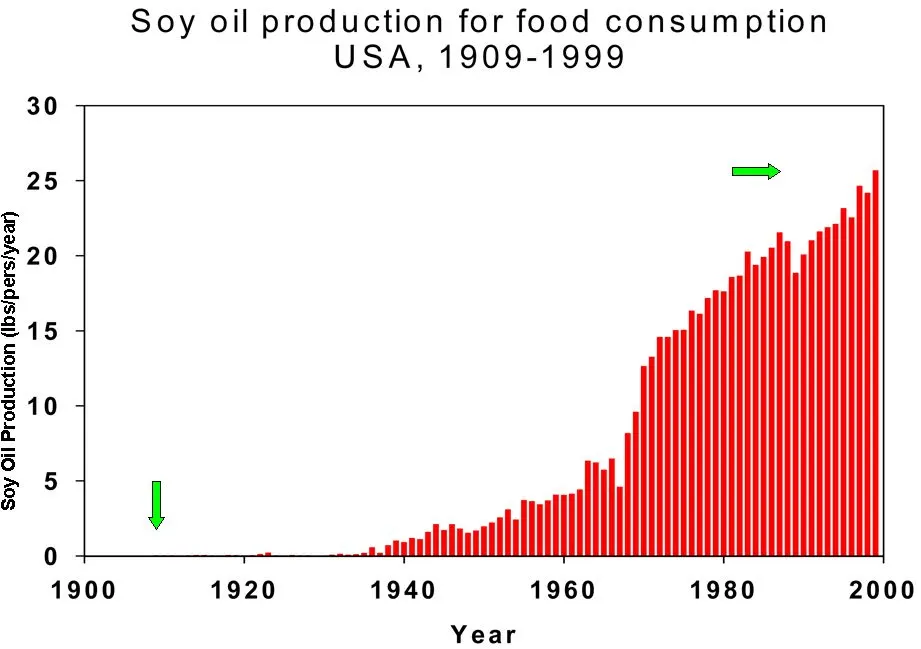
Slide 38: Omega-3 consumption per person per year
0.02 lbs/pers/year-1909 25.0 lbs/pers/year-1999 Source: J. Hibbeln, M.D., National Institute of Health, Bethesda, MD

Slide 39: Dyerberg and Bang Study
Dyerberg and Bang Study 2.8% 13.7% Omega-3 10.0% 5.4% Omega-6 Danish Greenland Eskimo Food Composition 34.7% 5.3% Danish Greenland Eskimo Ischemic Heart Disease Source: Dyerberg J. Observations on populations in Greenland and Denmark. In: Barlow SM. Stansby ME, eds. Nutritional evaluation of long-ch

Slide 40: PDAY Study
PDAY Study Heart Disease Begins in Childhood Source: PDAY results, Art. Thromb . Vasc . Biol. 19:753 - 761(1999) Prevention must begin in childhood! 30% 40% 30 – 10% 20% 15 – Coronary Artery Aorta Age % of Subjects Showing Damage to: Autopsied 2,875 persons aged 15 to 34 who died of external causes.
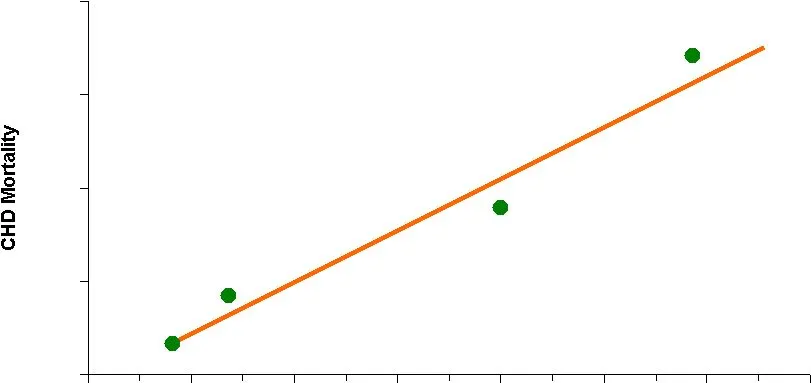
Slide 41: More Omega-3 = Less CHD
More Omega-3 = Less CHD Greenland Japan Spain United States Source: Lipids 38, 317-321 (April 2003) % Omega-6 in Tissue HUFA

Slide 42: Consumer Awareness Survey
Consumer Awareness Survey % General Population Who Believe Their Diet is Deficient in: 23 % Vitamin C 27 % Antioxidants 27 % Iron 29 % Whole Grains 30 % Water 31 % Soy Isoflavones 31 % Omega 3 Fatty Acids 31 % Fiber 34 % Soy Protein 37% Calcium % of Population NUTRIENT Source: The Health & Wellness
Slide 43: Top Functional Food Opportunities
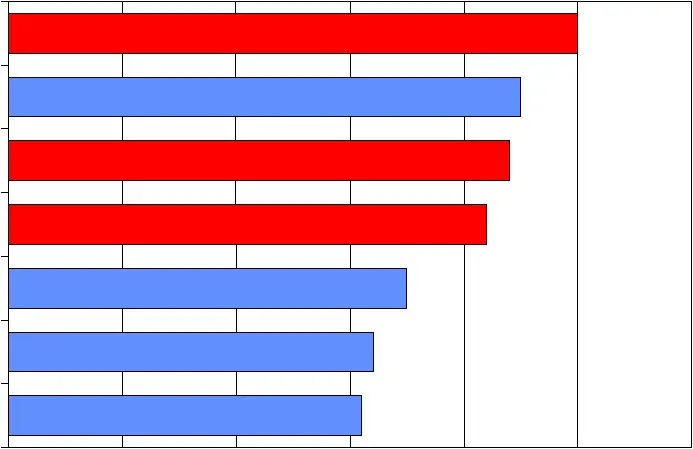
Top Functional Food Opportunities Which benefits present the greatest opportunity? Source: 2005 Prepared Foods Functional Foods Trends Survey of food developers/marketers 45% 44% 42% 35% 32% 31% 50% Cardiovascular Health Natural Ingredients Weight Loss Cholesterol Reduction Organic Ingredients Diges
Slide 44: Omega-3 Food Introductions
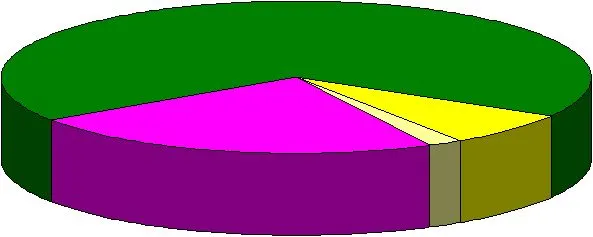
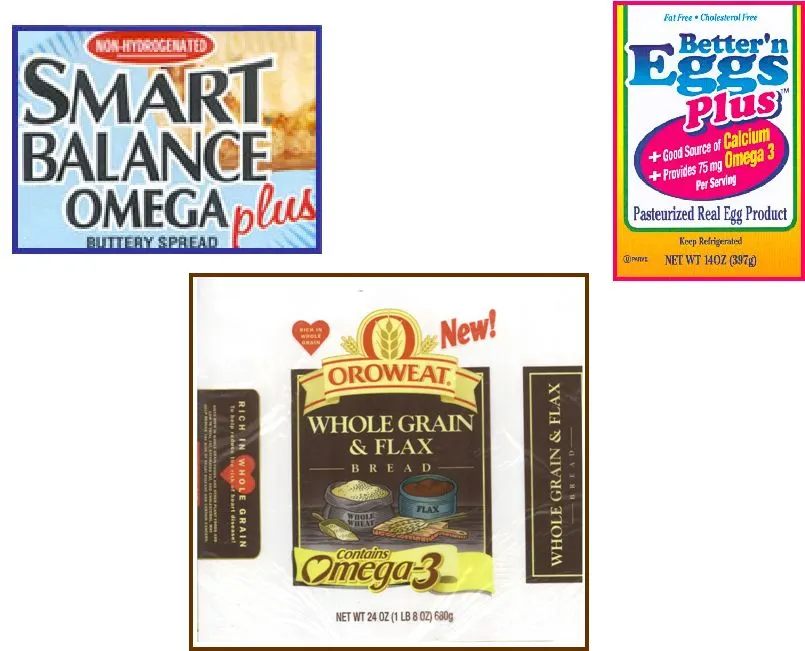
Omega-3 Food Introductions (1996 – January 2007) Fish OmegaPure fortified Long-chain fortified Short-chain fortified Source: Datamonitor Product Scan Online Database. Retrieved January, 2007 from datamonitor.com, Web site: http://www.datamonitor.com/~0d1c9075ab7c4f41a12ca5e2971db35a Challenges • We
Slide 45: | NN CEES
| NN CEES SMART. NET WT 2402 (1 1B 8.07) 6805

Slide 46: Omega Protein Technology and Innovation Center (OPTIC)
Omega Protein Technology and Innovation Center (“OPTIC”) Houston, Texas OPTIC Capabilities 1. Lipids Lab (we simulate what happens in a plant): pilot scale applications, pilot refining equipment and PAAR reactor. 2. Analytical Lab (Instrumentation to analyze product): atomic absorption, gas chromato

Slide 47: Omega Protein
OMEGA Co PROTEIN’ Healthy Products for a Healthy World®
Source: SEC EDGAR · 8-K filed May 29, 2007
More decks from Omega Protein Corp
 Investor Presentation (May 2017)27 slides · May 17, 2017
 Investor Presentation (January 2017)27 slides · Jan 11, 2017
 Proxy Contest (June 2016)48 slides · Jun 8, 2016
 Proxy Contest (June 2016)36 slides · Jun 7, 2016
 Investor Presentation (May 2016)29 slides · May 18, 2016
 Investor Presentation (September 2015)25 slides · Sep 17, 2015