New York REIT — Investor Presentation (February 2016)
14 slides from New York REIT's investor presentation, Feb 26, 2016
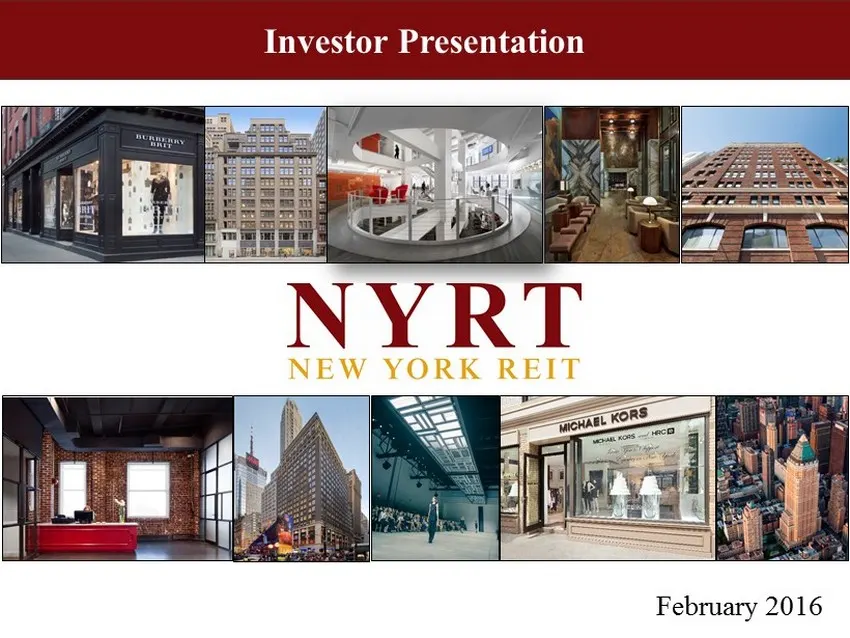
Slide 1: Investor Presentation February 2016
0 February 2014 Investor Presentation February 2016
Slide 2: Forward Looking Statements & Projections
1 1 Forward Looking Statements & Projections Certain statements included in this presentation are forward - looking statements . Those statements include statements regarding the intent, belief or current expectations of New York REIT, Inc . (the “Company,” “NYRT,” "we," "our" or "us ") and members
Slide 3: Company Overview
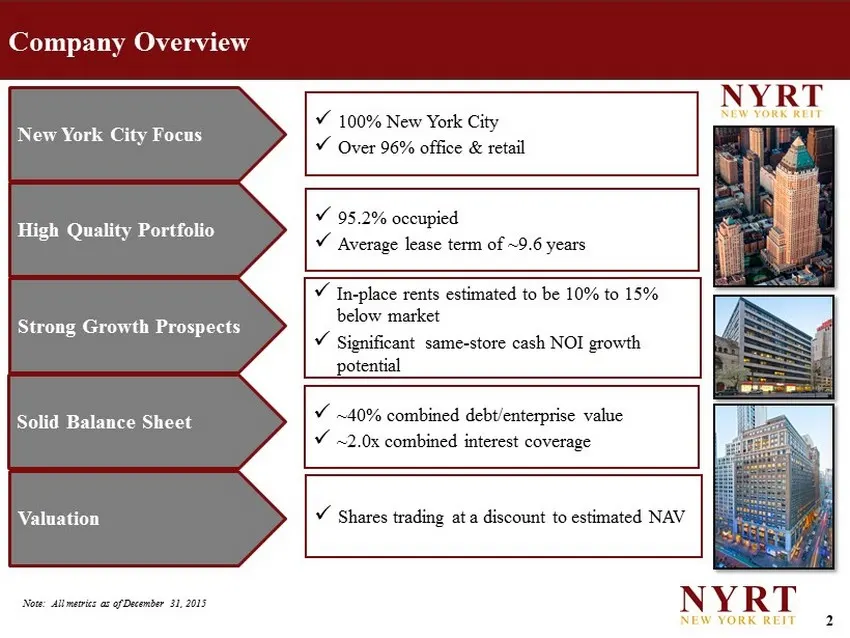
2 Company Overview x In - place rents estimated to be 10% to 15% below market x Significant same - store cash NOI growth potential x 100% New York City x Over 96% office & retail x 95.2% occupied x Average lease term of ~9.6 years x ~ 40% combined debt/enterprise value x ~2.0x combined interest cove
Slide 4: Portfolio Snapshot (as of 12/31/15)
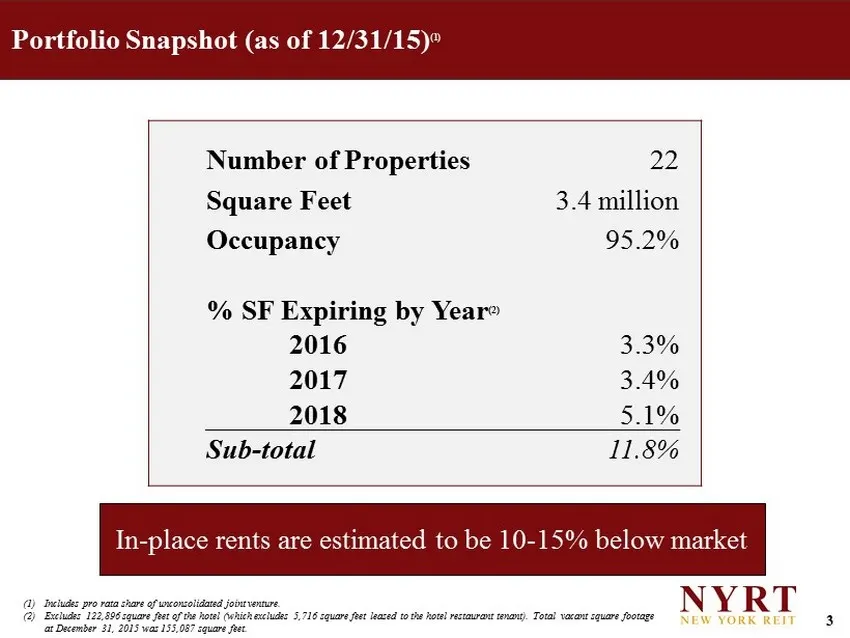
3 Portfolio Snapshot (as of 12/31/15) (1) In - place rents are estimated to be 10 - 15% below market Number of Properties 22 Square Feet 3.4 million Occupancy 95.2% % SF Expiring by Year (2) 2016 3.3% 2017 3.4% 2018 5.1% Sub - total 11.8% (1) Includes pro rata share of unconsolidated joint venture.
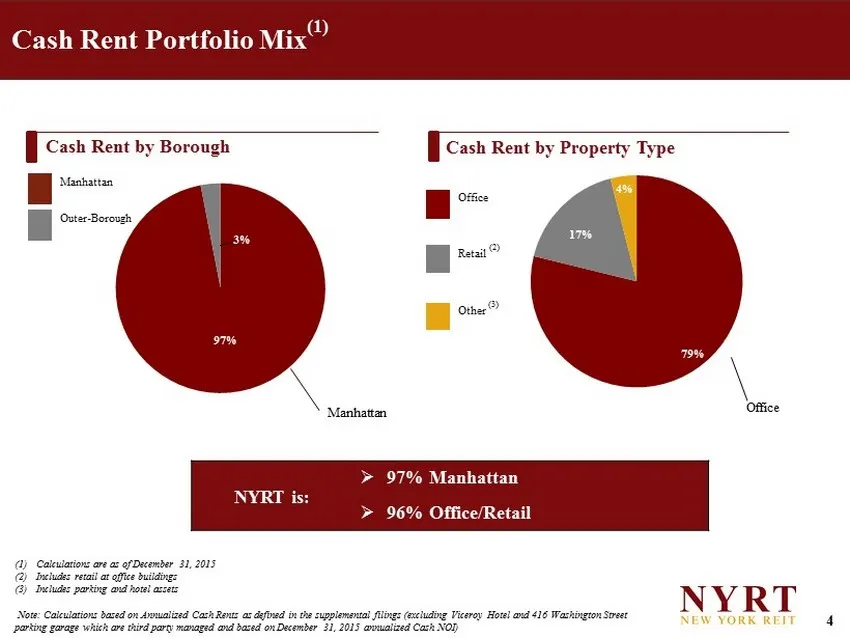
Slide 5: Cash Rent Portfolio Mix
4 79% 17% 4% 97% 3% Cash Rent Portfolio Mix (1) (1) Calculations are as of December 31, 2015 (2) Includes retail at office buildings (3) Includes parking and hotel assets Note: Calculations based on Annualized Cash Rents as defined in the supplemental filings (excluding Viceroy Hotel and 416 Washing
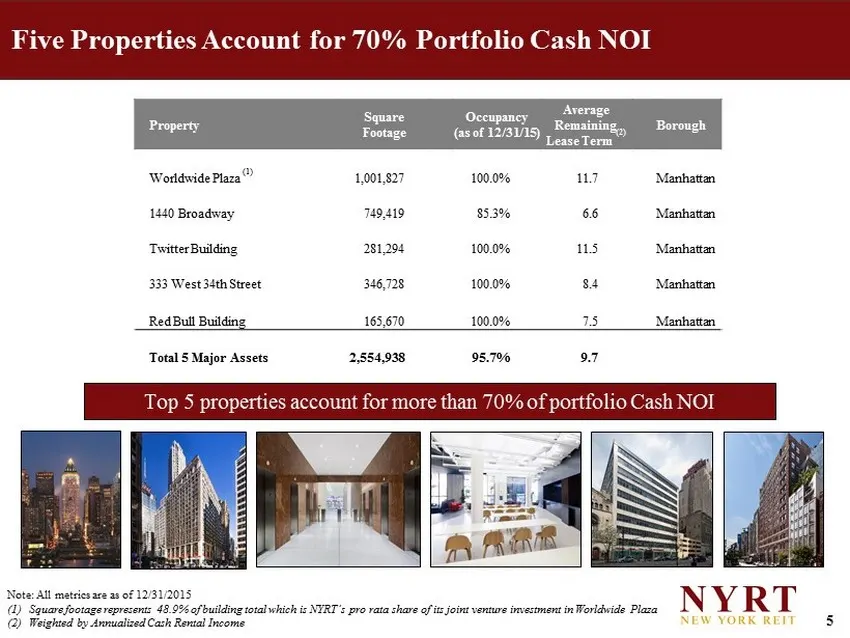
Slide 6: Five Properties Account for 70% Portfolio Cash NOI
5 Five Properties Account for 70% Portfolio Cash NOI Note: All metrics are as of 12/31/2015 (1) Square footage represents 48.9 % of building total which is NYRT’s pro rata share of its joint venture investment in Worldwide Plaza (2) Weighted by Annualized Cash Rental Income Top 5 properties account
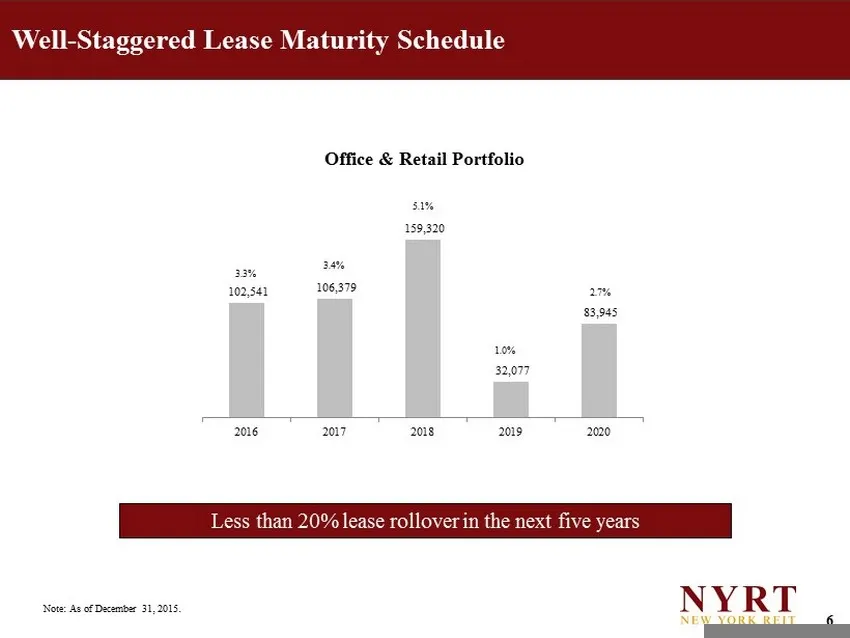
Slide 7: Well-Staggered Lease Maturity Schedule
6 102,541 106,379 159,320 32,077 83,945 2016 2017 2018 2019 2020 (1) As of June 30, 2015. Excludes Hotel and Multifamily properties. Note: As of December 31, 2015. 171,000 SF is attributed to Rent Path, Inc. (formerly Primedia) at 1440 Broadway Well - Staggered Lease Maturity Schedule Office & Retai
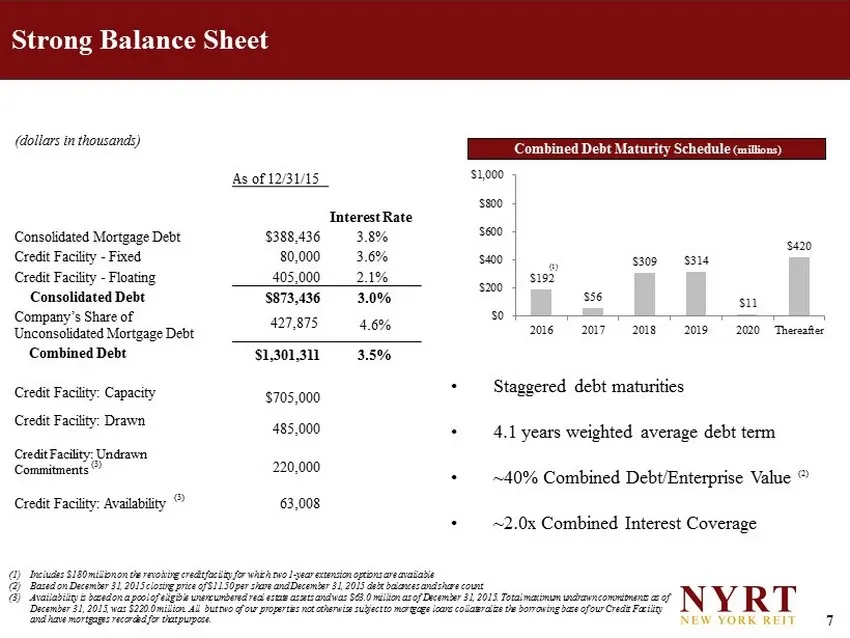
Slide 8: Strong Balance Sheet
7 $192 $56 $309 $314 $11 $420 $0 $200 $400 $600 $800 $1,000 2016 2017 2018 2019 2020 Thereafter Strong Balance Sheet (1) Includes $180 million on the revolving credit facility for which two 1 - year extension options are available (2) Based on December 31, 2015 closing price of $11.50 per share and
Slide 9: Same-Store NOI Bridge
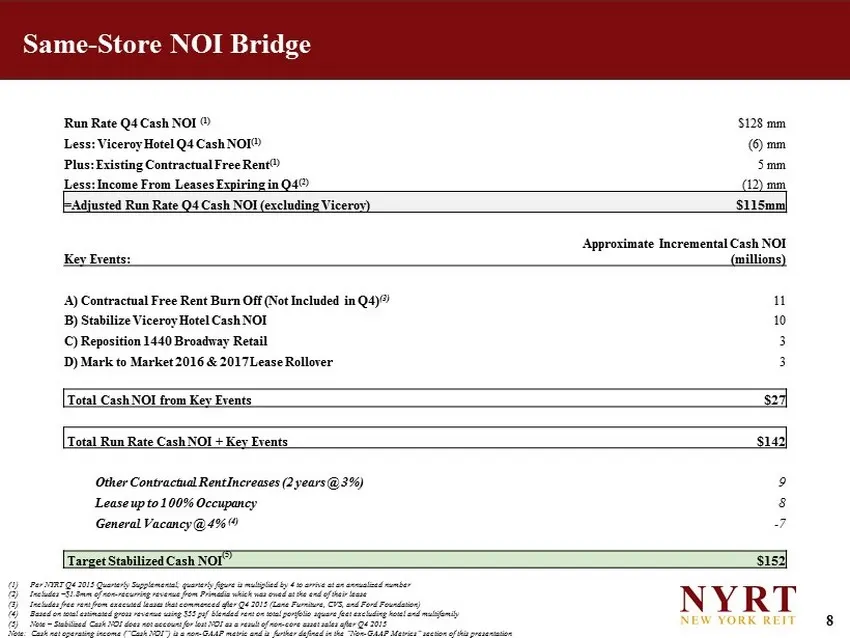
8 (1) Per NYRT Q4 2015 Quarterly Supplemental; quarterly figure is multiplied by 4 to arrive at an annualized number (2) Includes ~$1.8mm of non - recurring revenue from Primedia which was owed at the end of their lease (3) Includes free rent from executed leases that commenced after Q4 2015 (Lane F
Slide 10: Highlights for 4Q 2015
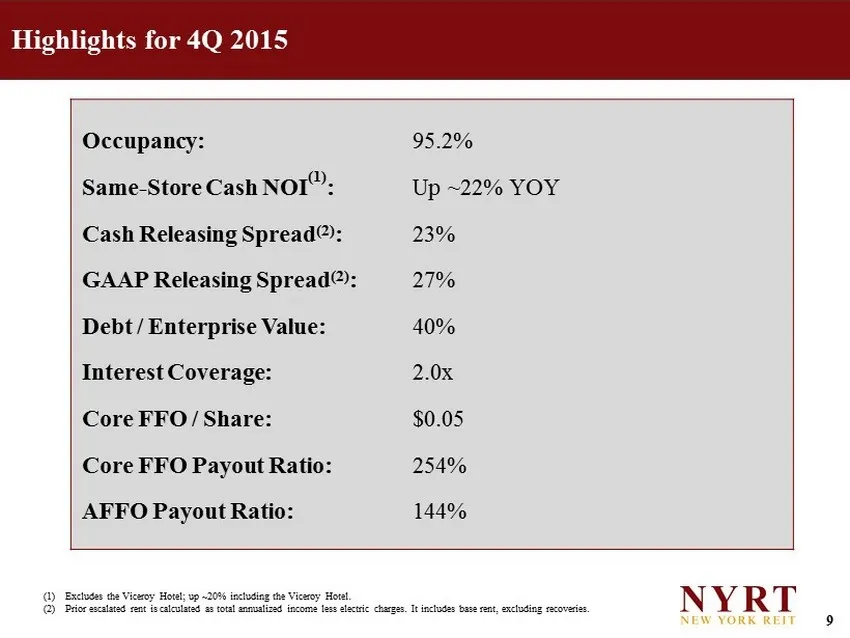
9 Highlights for 4Q 2015 Occupancy: 95.2% Same - Store Cash NOI (1) : Up ~22% YOY Cash Releasing Spread (2) : 23% GAAP Releasing Spread (2) : 27% Debt / Enterprise Value: 40% Interest Coverage: 2.0x Core FFO / Share: $0.05 Core FFO Payout Ratio: 254% AFFO Payout Ratio: 144% (1) Excludes the Viceroy
Slide 11: External Growth Opportunity
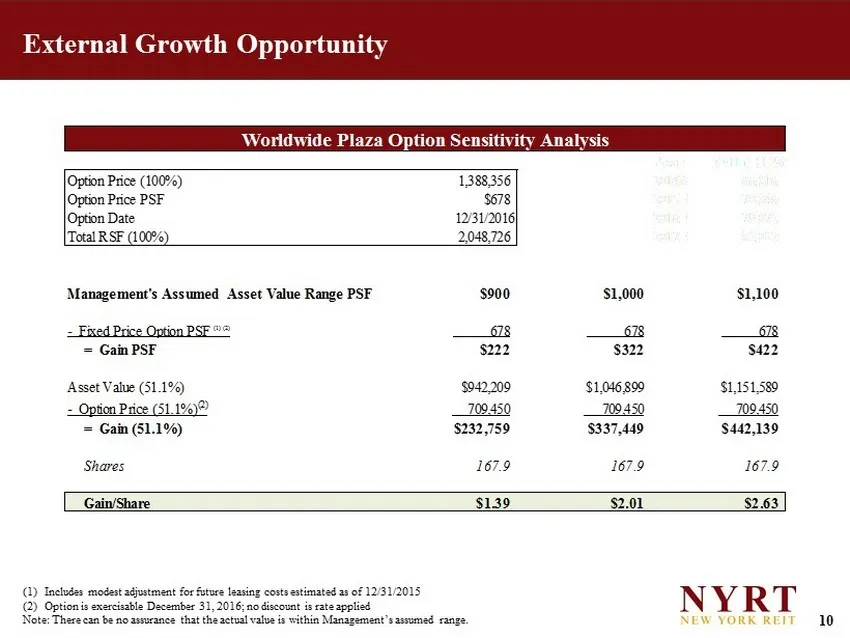
10 External Growth Opportunity (1) Includes modest adjustment for future leasing costs estimated as of 12/31/2015 (2) Option is exercisable December 31, 2016; no discount is rate applied Note: There can be no assurance that the actual value is within Management’s assumed range. Worldwide Plaza Optio
Slide 12: Non-Core Asset Sales
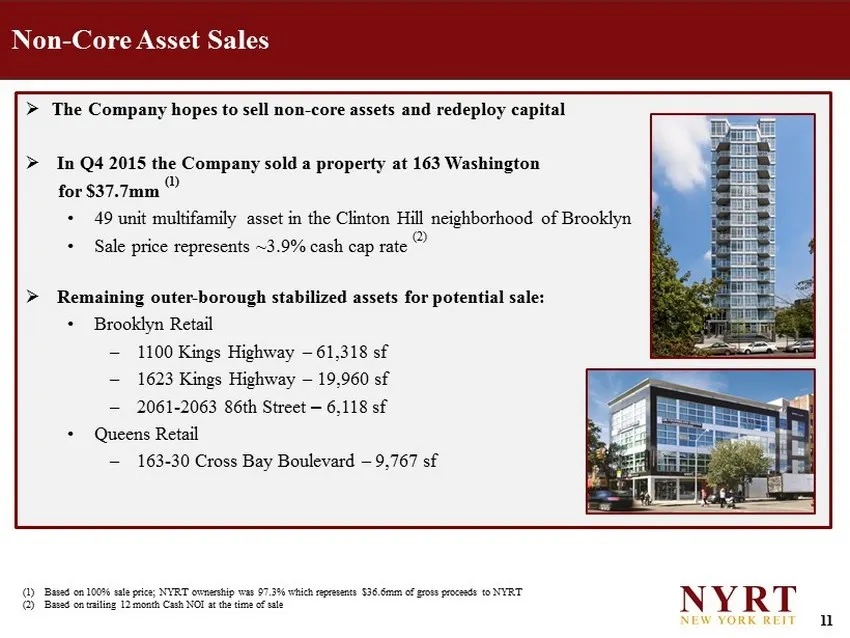
11 » The Company hopes to sell non - core assets and redeploy capital » In Q4 2015 the Company sold a property at 163 Washington for $37.7mm (1) • 49 unit multifamily asset in the Clinton Hill neighborhood of Brooklyn • Sale price represents ~3.9% cash cap rate (2) » Remaining outer - borough stabil
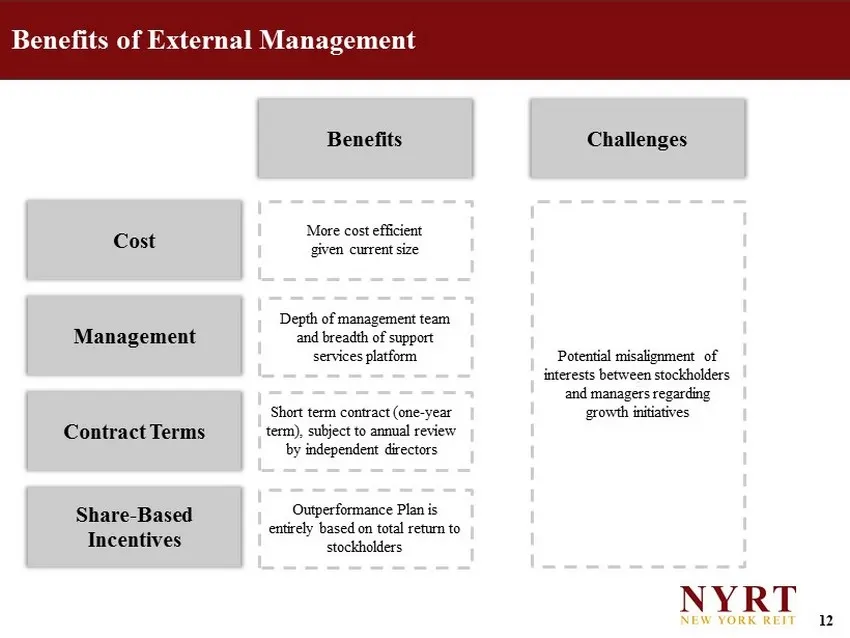
Slide 13: Benefits of External Management
12 Benefits of External Management Cost Management Contract Terms Share - Based Incentives Potential misalignment of interests between stockholders and managers regarding growth initiatives Benefits Challenges More cost efficient given current size Depth of management team and breadth of support ser
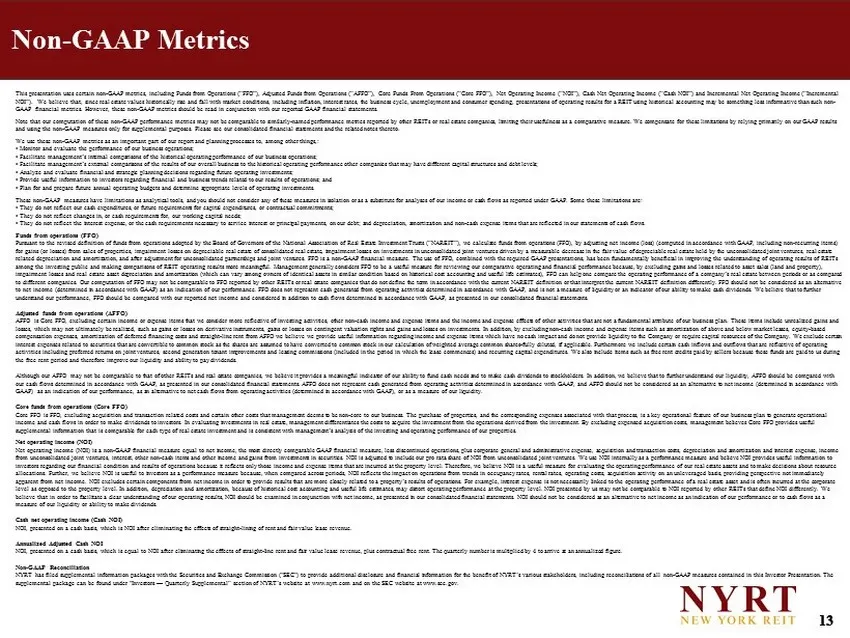
Slide 14: Non-GAAP Metrics
13 Non - GAAP Metrics This presentation uses certain non - GAAP metrics, including Funds from Operations (“FFO”), Adjusted Funds from Operations (“AFFO” ), Core Funds From Operations (“ Core FFO”), Net Operating Income (“NOI”), Cash Net Operating Income (“Cash NOI”) and Incremental Net Operating Inc
Source: SEC EDGAR · 8-K filed Feb 26, 2016
More decks from New York REIT Inc
 Investor Presentation (August 2016)11 slides · Aug 9, 2016
 Proxy Contest (July 2016)18 slides · Jul 26, 2016
 Proxy Contest (June 2016)16 slides · Jun 21, 2016
 Merger or Acquisition (May 2016)52 slides · May 25, 2016
 Investor Presentation (November 2015)12 slides · Nov 5, 2015
 Investor Presentation (October 2015)15 slides · Oct 9, 2015