INX — Investor Presentation (November 2006)
28 slides from INX's investor presentation, Nov 6, 2006
Slide 1: INX Inc. Investor Presentation, November 6, 2006
Mark Hilz President & COO Brian Fontana CFO INX Inc. Nasdaq: INXI www.INXI.com November 6, 2006
Slide 2: Safe Harbor Statement
Safe Harbor Statement This presentation contains "forward-looking statements" within the meaning of the Private Securities Litigation Reform Act of 1995. Statements associated with words such as "anticipate," "believe," "expect," "hope," "should," "will" or other similar words are forward-looking st
Slide 3: INX Inc.
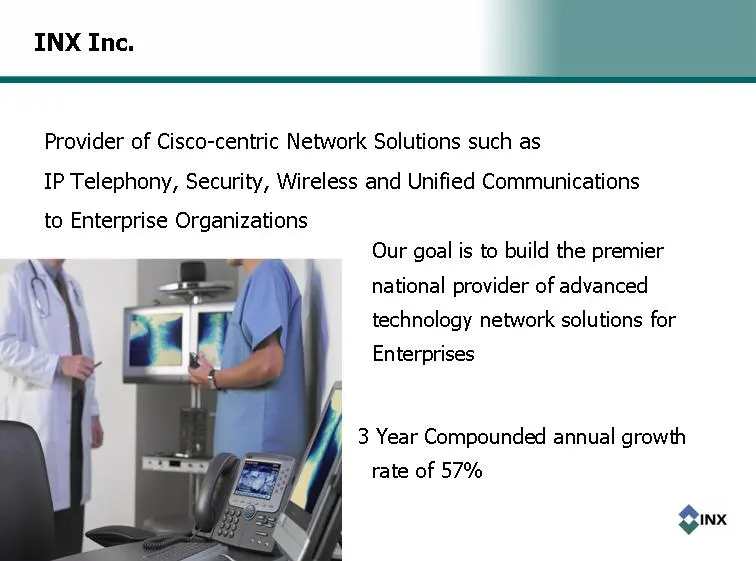
INX Inc. Provider of Cisco-centric Network Solutions such as IP Telephony, Security, Wireless and Unified Communications to Enterprise Organizations Our goal is to build the premier national provider of advanced technology network solutions for Enterprises 3 Year Compounded annual growth rate of 57%
Slide 4: Investment Highlights
Investment Highlights A multi-billion dollar, high growth market/industry opportunity Closely aligned with Cisco, the dominant manufacturer in networking, + now #1 in enterprise phone systems through their VOIP based IP telephony offering The only public company focused solely on enterprise IP telep
Slide 5: Market
Market
Slide 6: Our "Market"
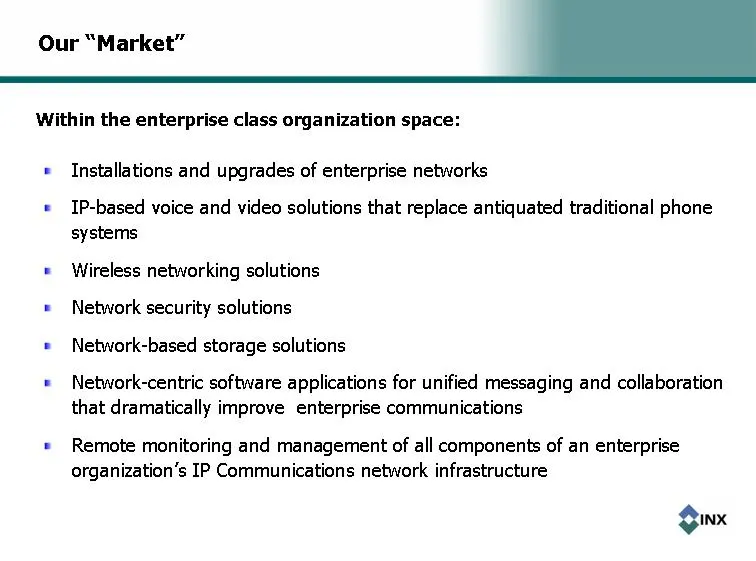
Our "Market" Within the enterprise class organization space: Installations and upgrades of enterprise networks IP-based voice and video solutions that replace antiquated traditional phone systems Wireless networking solutions Network security solutions Network-based storage solutions Network-centric
Slide 7: Industry Evolution and Industry Leadership
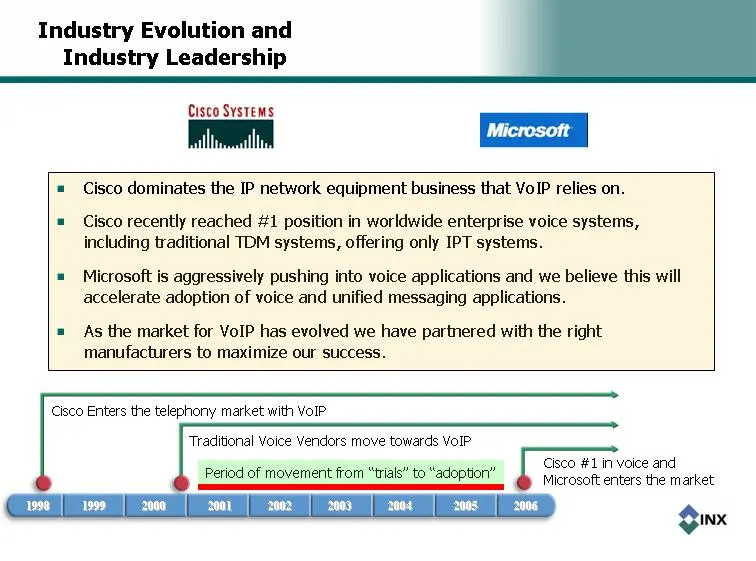
Industry Evolution and Industry Leadership Cisco dominates the IP network equipment business that VoIP relies on. Cisco recently reached #1 position in worldwide enterprise voice systems, including traditional TDM systems, offering only IPT systems. Microsoft is aggressively pushing into voice appli
Slide 8: Early Stages Of The Initial Upgrade Cycle
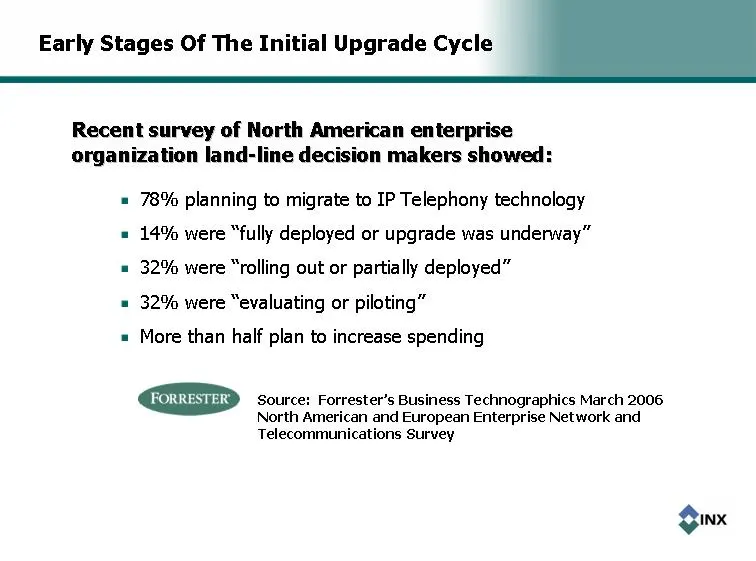
Early Stages Of The Initial Upgrade Cycle 78% planning to migrate to IP Telephony technology 14% were "fully deployed or upgrade was underway" 32% were "rolling out or partially deployed" 32% were "evaluating or piloting" More than half plan to increase spending Recent survey of North American enter
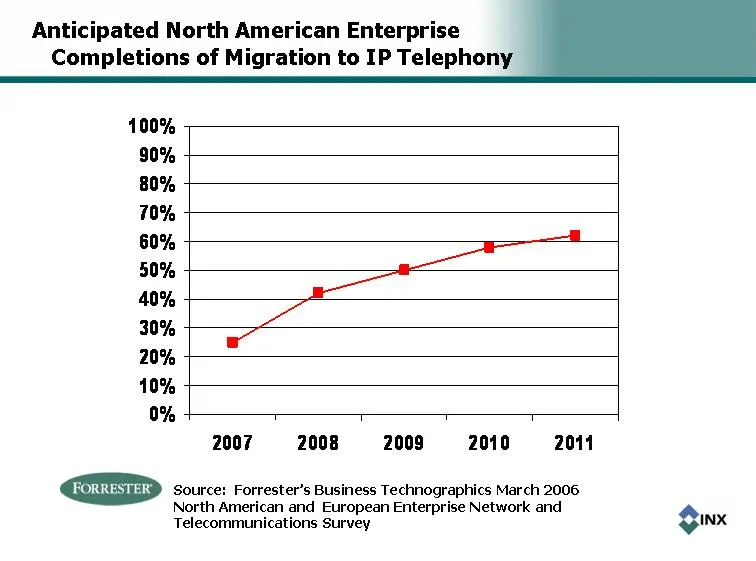
Slide 9: Anticipated North American Enterprise Completions of Migration to IP Telephony
Anticipated North American Enterprise Completions of Migration to IP Telephony 2007 2008 2009 2010 2011 East 0.25 0.42 0.5 0.58 0.62 MSGraph.Chart.8 MSGraph.Chart.8 Source: Forrester's Business Technographics March 2006 North American and European Enterprise Network and Telecommunications Survey
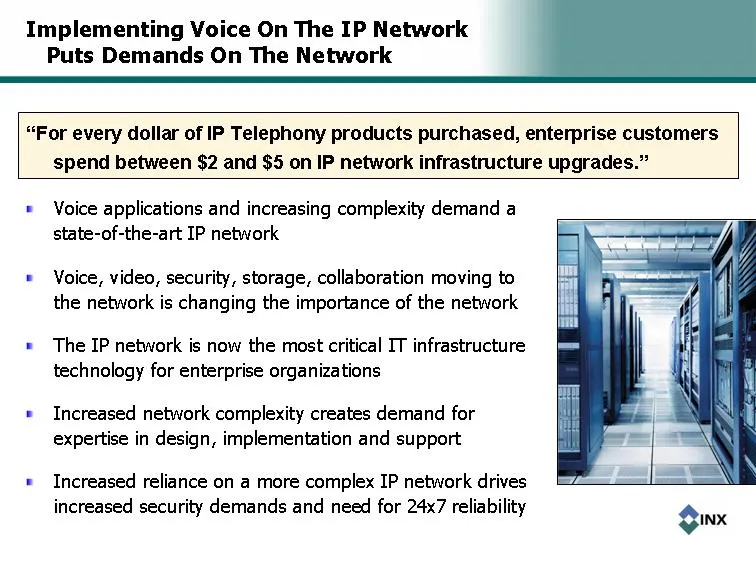
Slide 10: Implementing Voice On The IP Network Puts Demands On The Network
Implementing Voice On The IP Network Puts Demands On The Network "For every dollar of IP Telephony products purchased, enterprise customers spend between $2 and $5 on IP network infrastructure upgrades." Voice applications and increasing complexity demand a state-of-the-art IP network Voice, video,
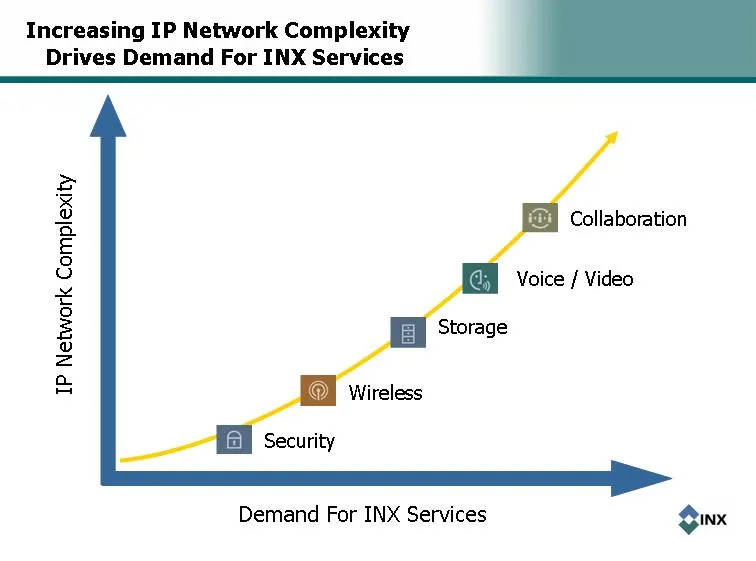
Slide 11: Increasing IP Network Complexity Drives Demand For INX Services
Increasing IP Network Complexity Drives Demand For INX Services Voice / Video Wireless Storage Collaboration Security Demand For INX Services IP Network Complexity
Slide 12: The Company
The Company
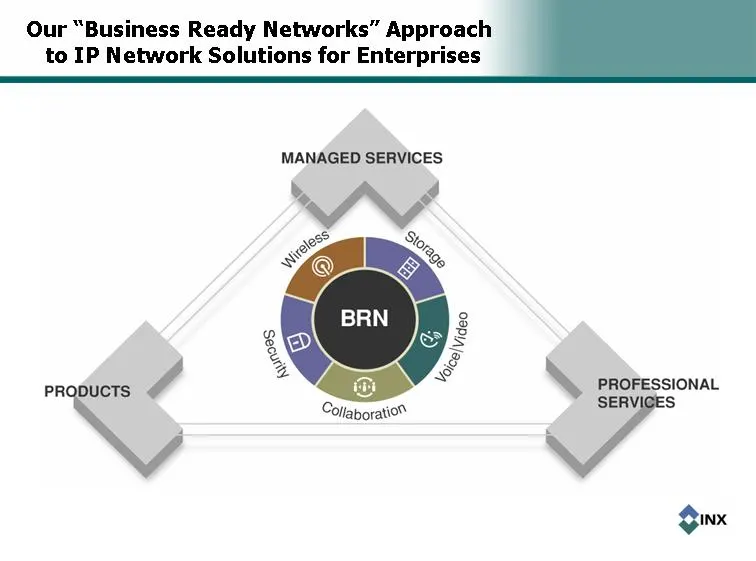
Slide 13: Our "Business Ready Networks" Approach
Our "Business Ready Networks" Approach to IP Network Solutions for Enterprises
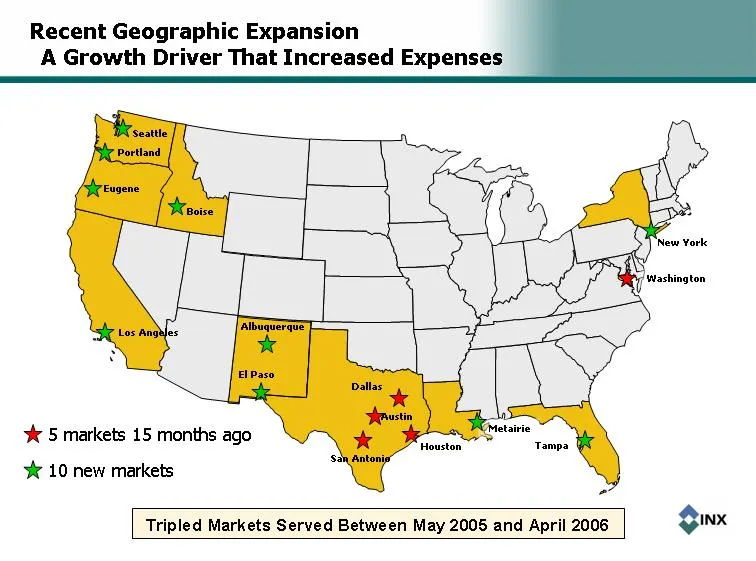
Slide 14: Recent Geographic Expansion
5 markets 15 months ago 10 new markets Recent Geographic Expansion A Growth Driver That Increased Expenses Houston Metairie San Antonio Austin Dallas El Paso Albuquerque Los Angeles Eugene Portland Seattle Washington Tampa New York Boise Tripled Markets Served Between May 2005 and April 2006
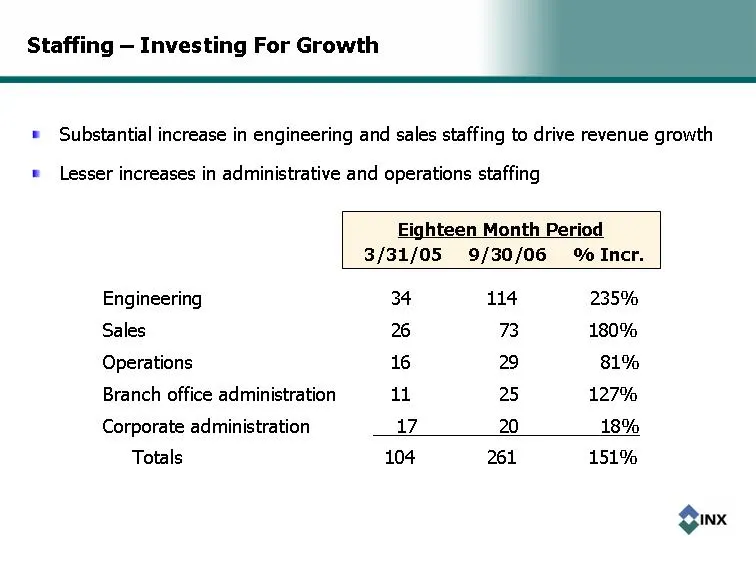
Slide 15: Staffing - Investing For Growth
Staffing - Investing For Growth Engineering 34 114 235% Sales 26 73 180% Operations 16 29 81% Branch office administration 11 25 127% Corporate administration 17 20 18% Totals 104 261 151% Eighteen Month Period 3/31/05 9/30/06 % Incr. Substantial increase in engineering and sales staffing to drive r
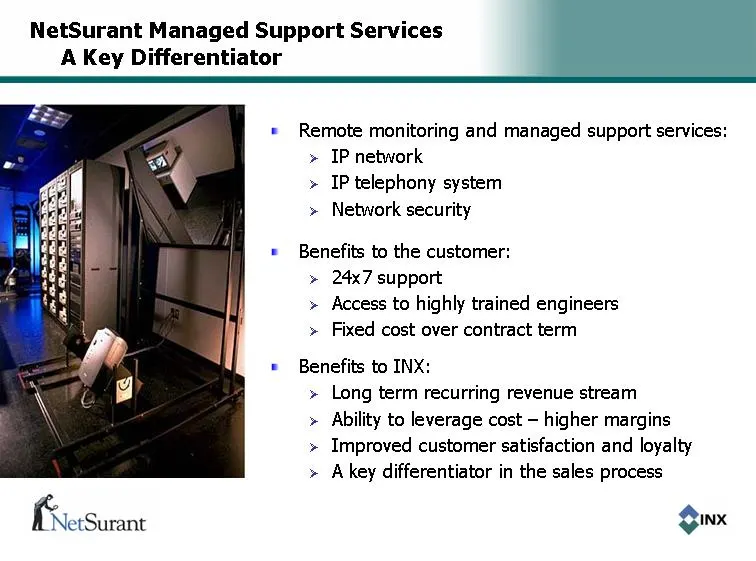
Slide 16: NetSurant Managed Support Services
NetSurant Managed Support Services A Key Differentiator Remote monitoring and managed support services: IP network IP telephony system Network security Benefits to the customer: 24x7 support Access to highly trained engineers Fixed cost over contract term Benefits to INX: Long term recurring revenue
Slide 17: NetSurant Recurring Service Revenue
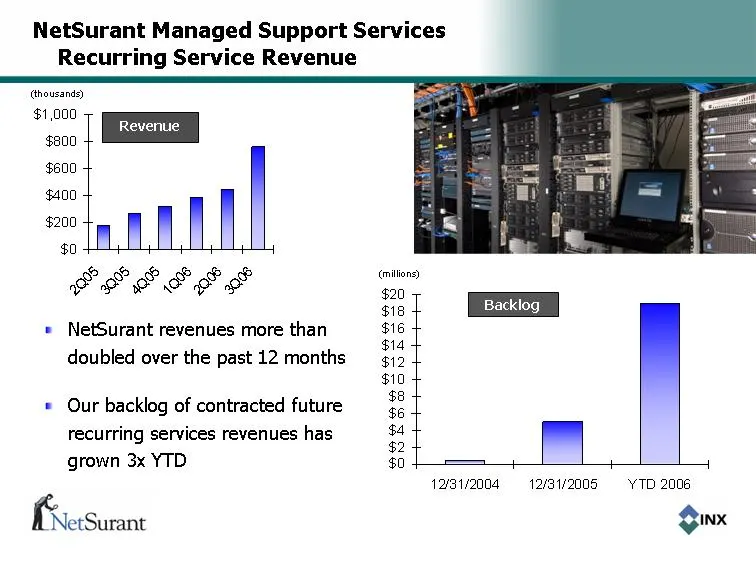
NetSurant Managed Support Services Recurring Service Revenue Recurring Service Revenue Recurring Service Revenue 2Q05 3Q05 4Q05 1Q06 2Q06 3Q06 Quarterly Revenue (,000) 180 265 318 385 449 765 12/31/2004 12/31/2005 YTD 2006 Contract Value 0.445 5.025 19 NetSurant revenues more than doubled over the p
Slide 18: Blue Chip Customer Base
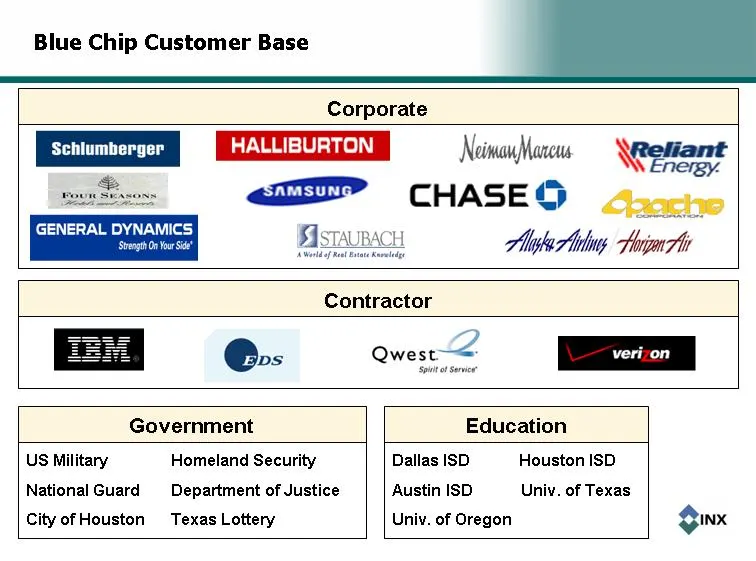
Blue Chip Customer Base Corporate Dallas ISD Houston ISD Austin ISD Univ. of Texas Univ. of Oregon Education US Military Homeland Security National Guard Department of Justice City of Houston Texas Lottery Government Contractor
Slide 19: Management
Management Jim Long - Chairman & CEO - founded company in 1982. Mark Hilz - President & COO - experience as CEO of larger public company; acquisitions experience; served on our board prior to joining management in July 2000. Brian Fontana - CFO - since January 2005; experience as CFO with larger pub
Slide 20: Financials
Financials
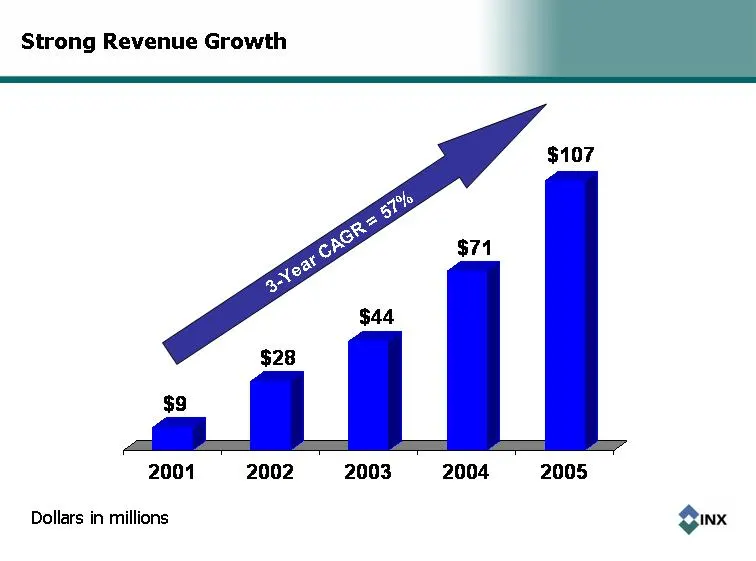
Slide 21: Strong Revenue Growth
2001 2002 2003 2004 2005 9.365 27.72 43.595 71.487 107.319 Strong Revenue Growth 3-Year CAGR = 57% Dollars in millions
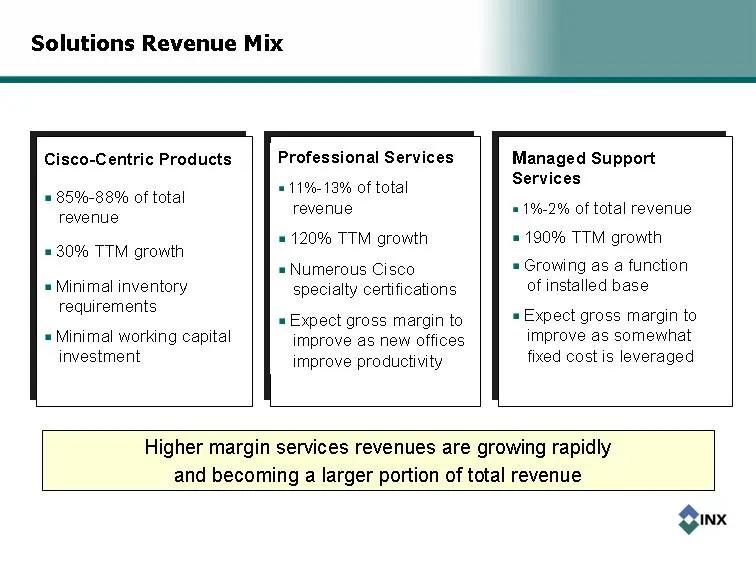
Slide 22: Solutions Revenue Mix
Managed Support Services 1%-2% of total revenue 190% TTM growth Growing as a function of installed base Expect gross margin to improve as somewhat fixed cost is leveraged Professional Services 11%-13% of total revenue 120% TTM growth Numerous Cisco specialty certifications Expect gross margin to imp
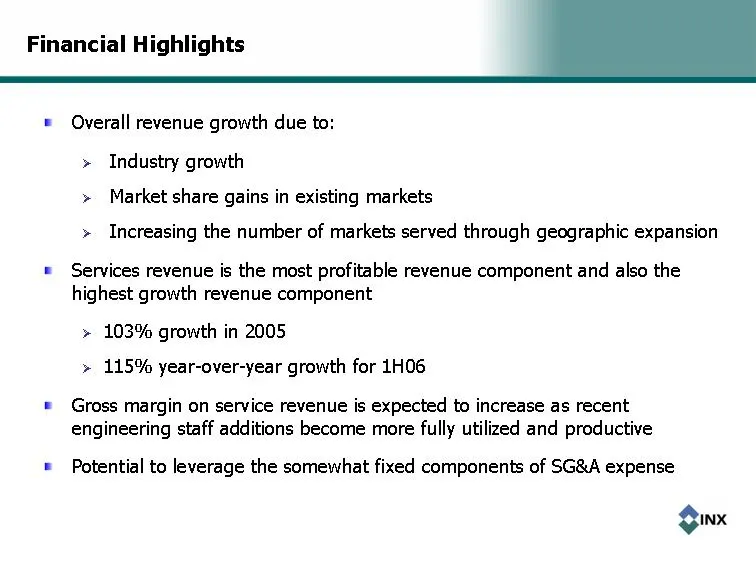
Slide 23: Financial Highlights
Financial Highlights Overall revenue growth due to: Industry growth Market share gains in existing markets Increasing the number of markets served through geographic expansion Services revenue is the most profitable revenue component and also the highest growth revenue component 103% growth in 2005
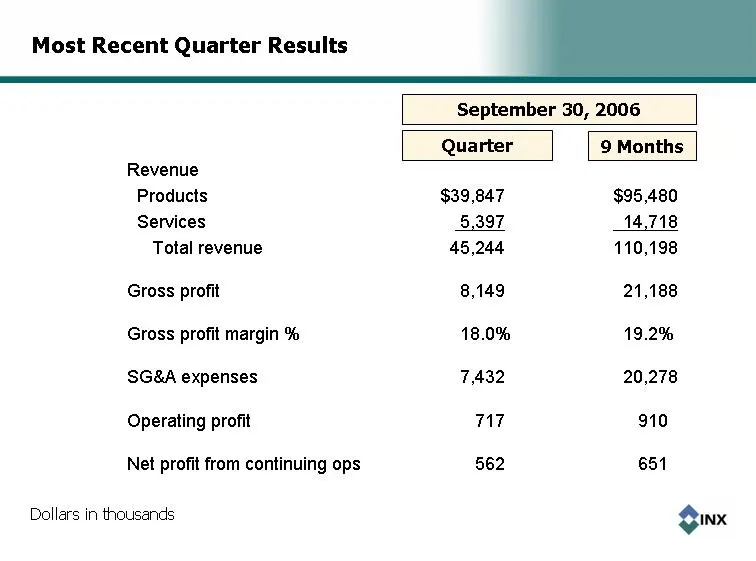
Slide 24: Most Recent Quarter Results
Most Recent Quarter Results Quarter Dollars in thousands Revenue Products $39,847 Services 5,397 Total revenue 45,244 Gross profit 8,149 Gross profit margin % 18.0% SG&A expenses 7,432 Operating profit 717 Net profit from continuing ops 562 9 Months $95,480 14,718 110,198 21,188 19.2% 20,278 910 651
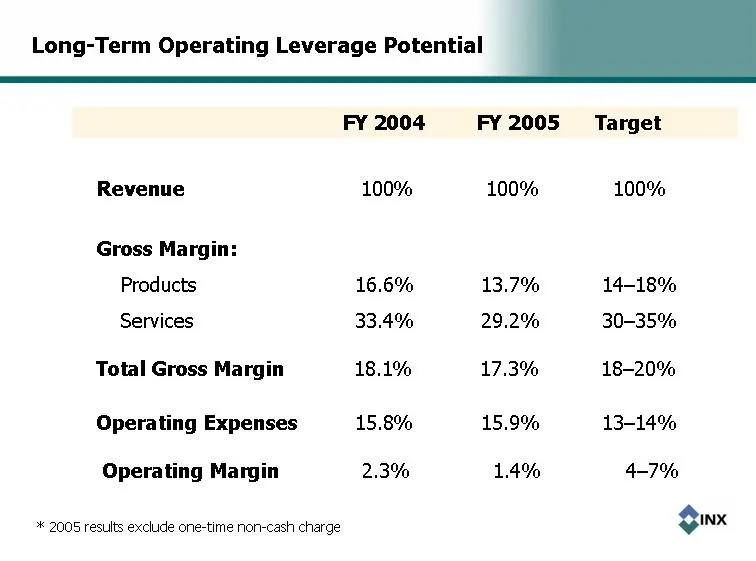
Slide 25: Long-Term Operating Leverage Potential
Long-Term Operating Leverage Potential Revenue 100% 100% 100% FY 2004 FY 2005 Target Gross Margin: Operating Expenses 15.8% 15.9% 13-14% Operating Margin 2.3% 1.4% 4-7% Products 16.6% 13.7% 14-18% Services 33.4% 29.2% 30-35% Total Gross Margin 18.1% 17.3% 18-20% * 2005 results exclude one-time non-c
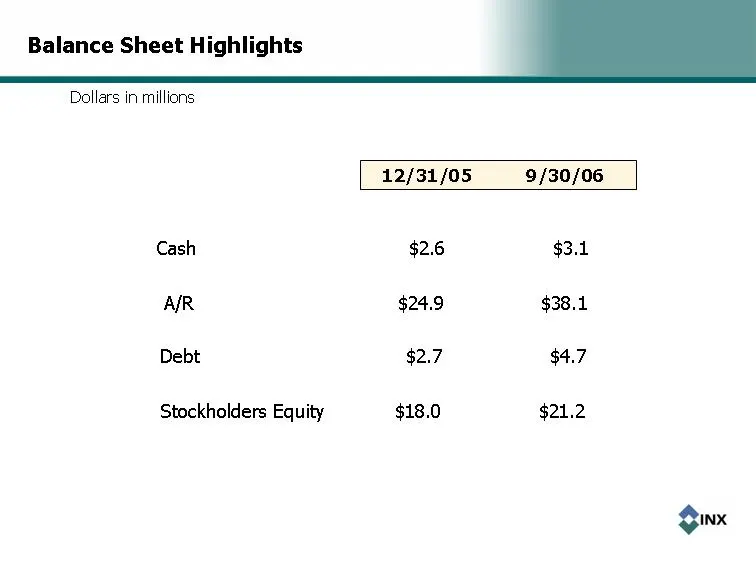
Slide 26: Balance Sheet Highlights
Balance Sheet Highlights Cash $2.6 $3.1 12/31/05 9/30/06 A/R $24.9 $38.1 Debt $2.7 $4.7 Stockholders Equity $18.0 $21.2 Dollars in millions
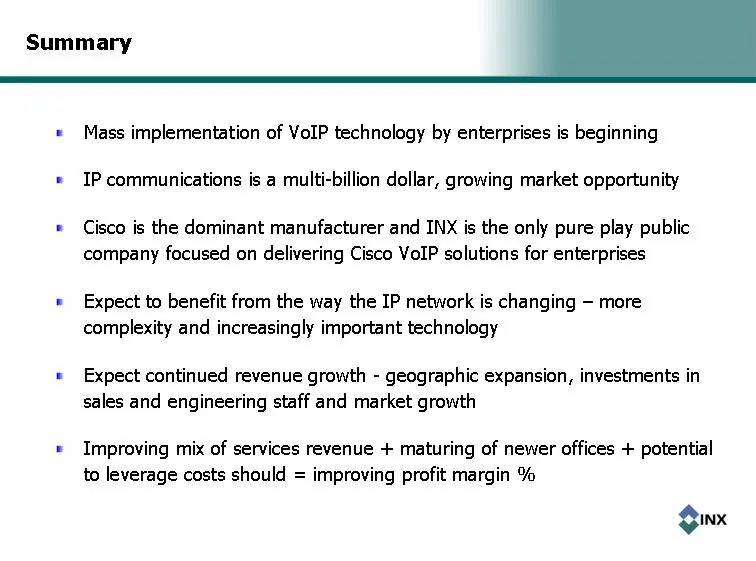
Slide 27: Summary
Summary Mass implementation of VoIP technology by enterprises is beginning IP communications is a multi-billion dollar, growing market opportunity Cisco is the dominant manufacturer and INX is the only pure play public company focused on delivering Cisco VoIP solutions for enterprises Expect to bene
Slide 28: Contact: Mark Hilz and Brian Fontana
Mark Hilz President & COO Brian Fontana CFO INX Inc. Nasdaq: INXI www.INXI.com November 6, 2006
Source: SEC EDGAR · 8-K filed Nov 6, 2006
More decks from INX Inc
 Merger or Acquisition (November 2011)10 slides · Nov 1, 2011
 Rodman & Renshaw Global Investment Conference 201120 slides · Sep 13, 2011
 Shareholder Meeting (July 2011)15 slides · Jul 19, 2011
 Q1 2011 Earnings Presentation15 slides · Jul 13, 2011
 FY2010 Earnings Presentation28 slides · Jun 6, 2011
 Corporate Update (November 2010)24 slides · Nov 10, 2010