SunTrust Banks — Goldman Sachs Financial Services Conference 2013
20 slides from SunTrust Banks's conference presentation, Dec 10, 2013
Slide 1: Goldman Sachs Financial Services Conference
Goldman Sachs Financial Services Conference William H. Rogers, Jr., Chairman and Chief Executive Officer, SunTrust Banks, Inc. December 10, 2013
Slide 2: Important Cautionary Statement About Forward-Looking Statements
2 Important Cautionary Statement About Forward-Looking Statements The following should be read in conjunction with the financial statements, notes and other information contained in the Company’s 2012 Annual Report on Form 10-K, Quarterly Reports on Form 10-Q, and Current Reports on Form 8-K. This p
Slide 3: Franchise Overview: Who is SunTrust?
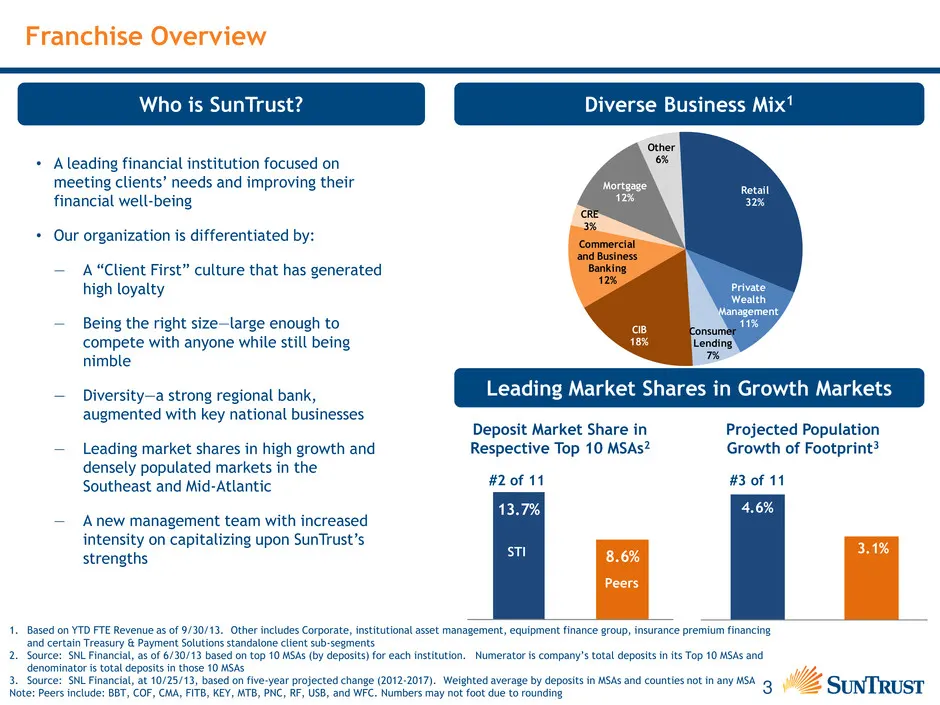
3 4.6% 3.1% 13.7% 8.6% Franchise Overview Who is SunTrust? Diverse Business Mix1 • A leading financial institution focused on meeting clients’ needs and improving their financial well-being • Our organization is differentiated by: — A “Client First” culture that has generated high loyalty — Being th
Slide 4: SunTrust Markets Continue To Improve
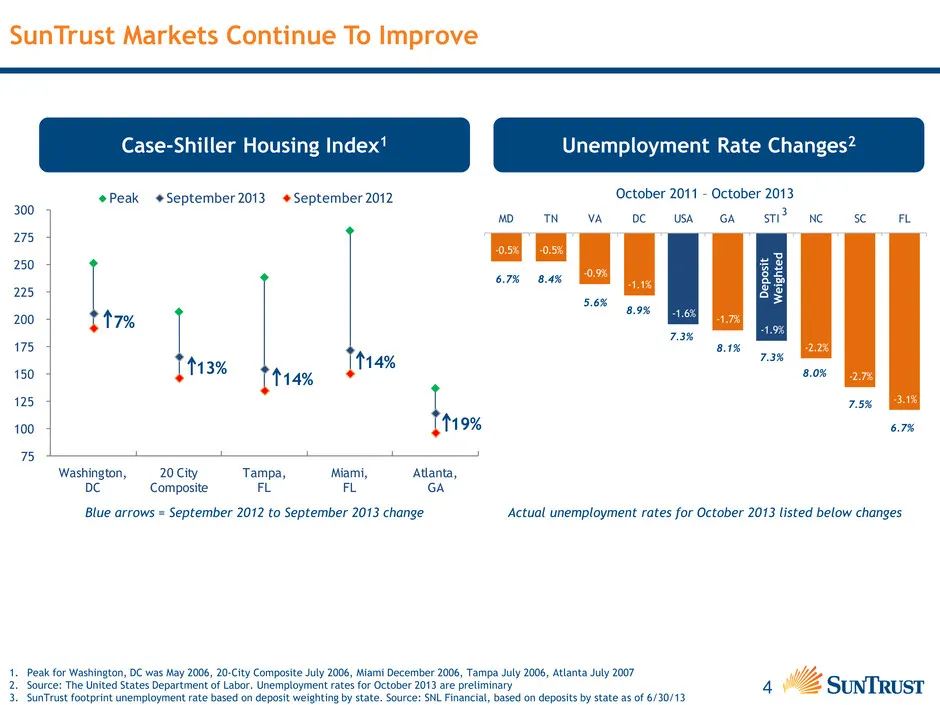
4 75 100 125 150 175 200 225 250 275 300 Washington, DC 20 City Composite Tampa, FL Miami, FL Atlanta, GA Peak September 2013 September 2012 -0.5% -0.5% -0.9% -1.1% -1.6% -1.7% -1.9% -2.2% -2.7% -3.1% MD TN VA DC USA GA STI NC SC FL SunTrust Markets Continue To Improve 1. Peak for Washington, DC was
Slide 5: Corporate Strategic Priorities
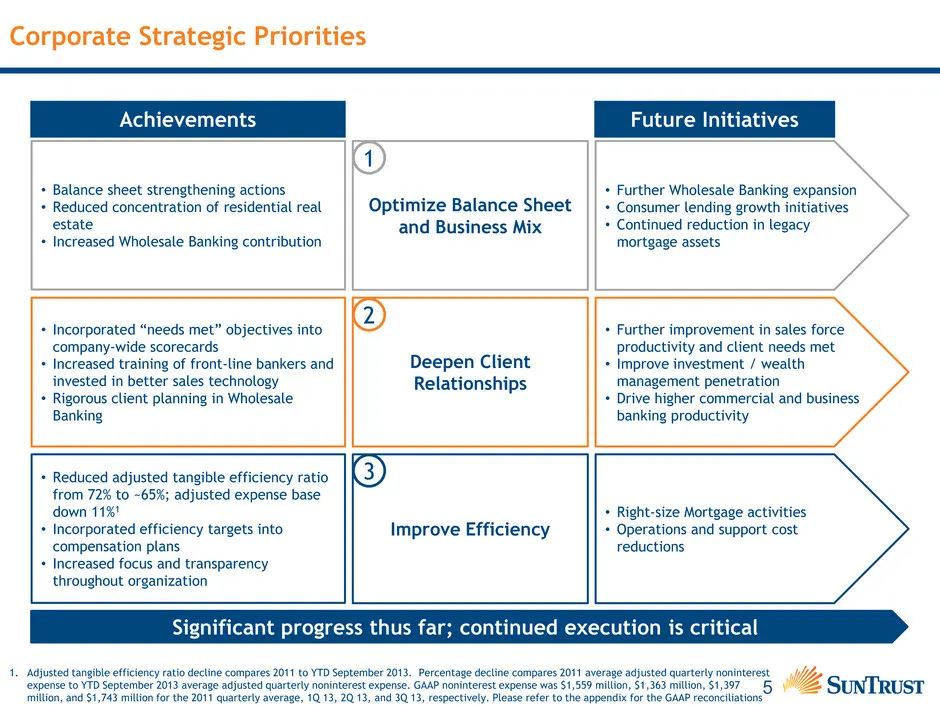
5 Corporate Strategic Priorities Improve Efficiency • Incorporated “needs met” objectives into company-wide scorecards • Increased training of front-line bankers and invested in better sales technology • Rigorous client planning in Wholesale Banking Optimize Balance Sheet and Business Mix Deepen Cli
Slide 6: Stronger and More Diversified Balance Sheet
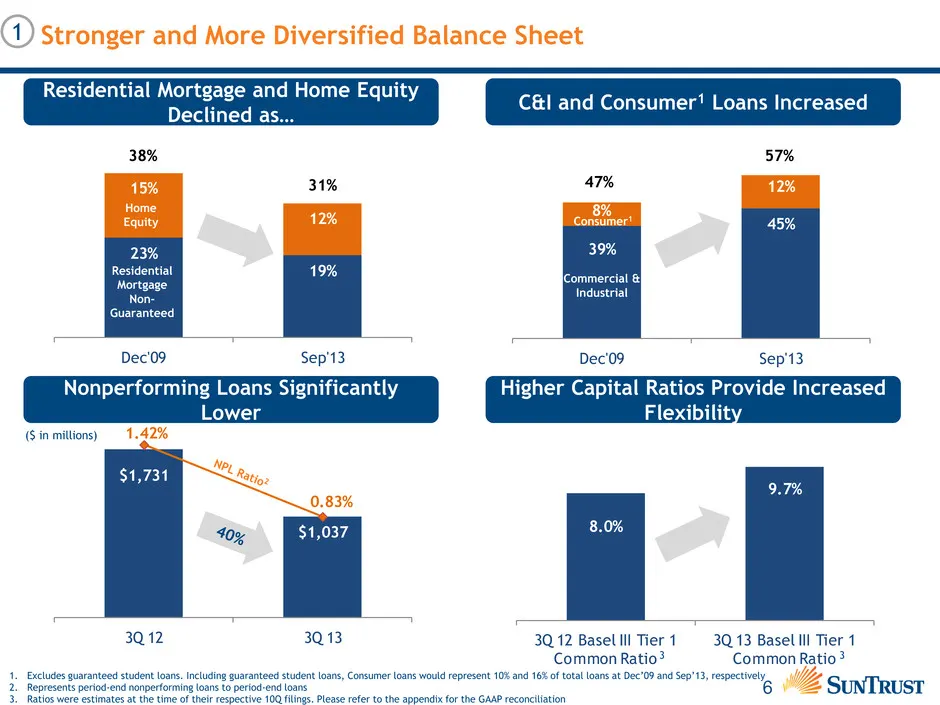
6 $1,731 $1,037 1.42% 0.83% 3Q 12 3Q 13 39% 45% 8% 12% Dec'09 Sep'13 Stronger and More Diversified Balance Sheet Residential Mortgage and Home Equity Declined as… 23% 19% 15% 12% Dec'09 Sep'13 Residential Mortgage Non- Guaranteed Home Equity 38% 31% C&I and Consumer1 Loans Increased Commercial & Ind
Slide 7: Loan Growth Trends Improving, More Stable NII
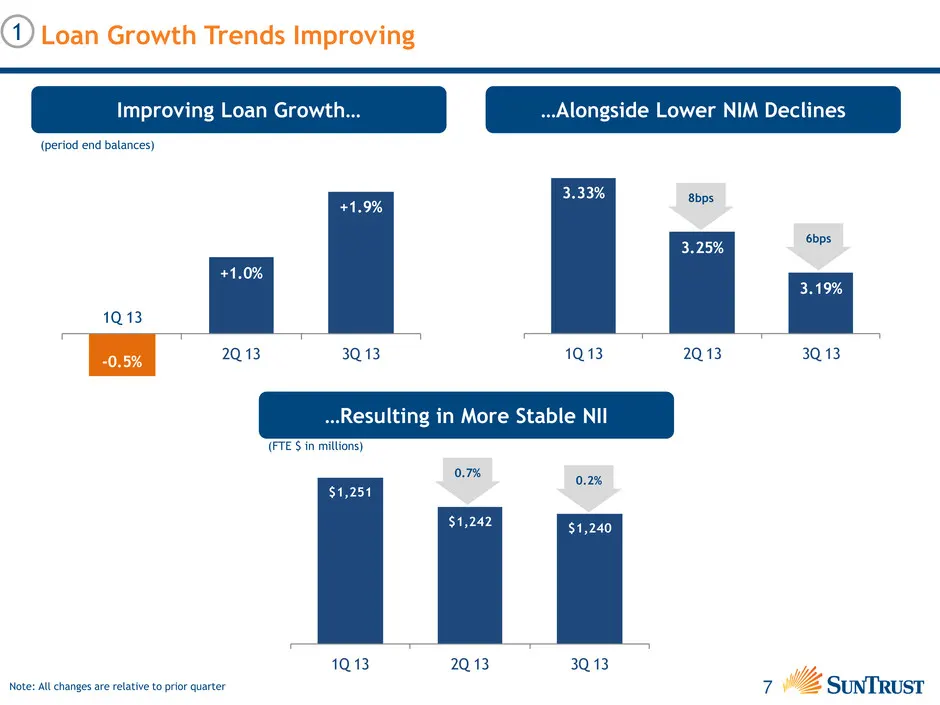
7 -0.5% +1.0% +1.9% 2Q 13 3Q 13 $1,251 $1,242 $1,240 1Q 13 2Q 13 3Q 13 Loan Growth Trends Improving …Resulting in More Stable NII …Alongside Lower NIM Declines 3.33% 3.25% 3.19% 1Q 13 2Q 13 3Q 13 Improving Loan Growth… 8bps 6bps (period end balances) (FTE $ in millions) 0.7% 0.2% 1Q 13 Note: All cha
Slide 8: Making Investments to Meet More Client Needs
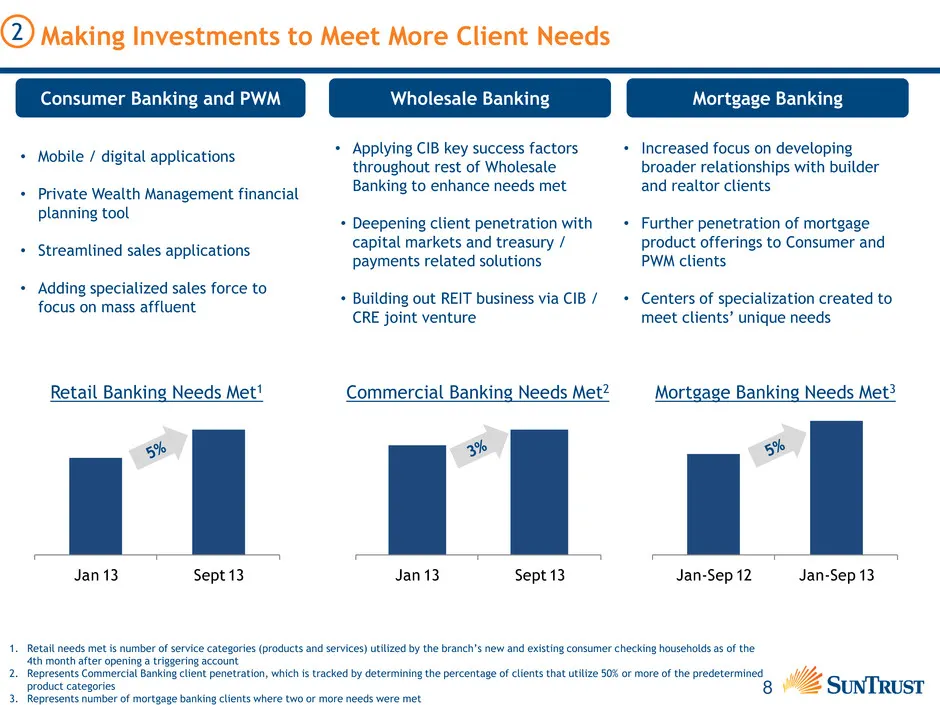
8 Jan 13 Sept 13Jan 13 Sept 13 • Mobile / digital applications • Private Wealth Management financial planning tool • Streamlined sales applications • Adding specialized sales force to focus on mass affluent Making Investments to Meet More Client Needs Consumer Banking and PWM Wholesale Banking Mortg
Slide 9: Successfully Driving Down Expenses
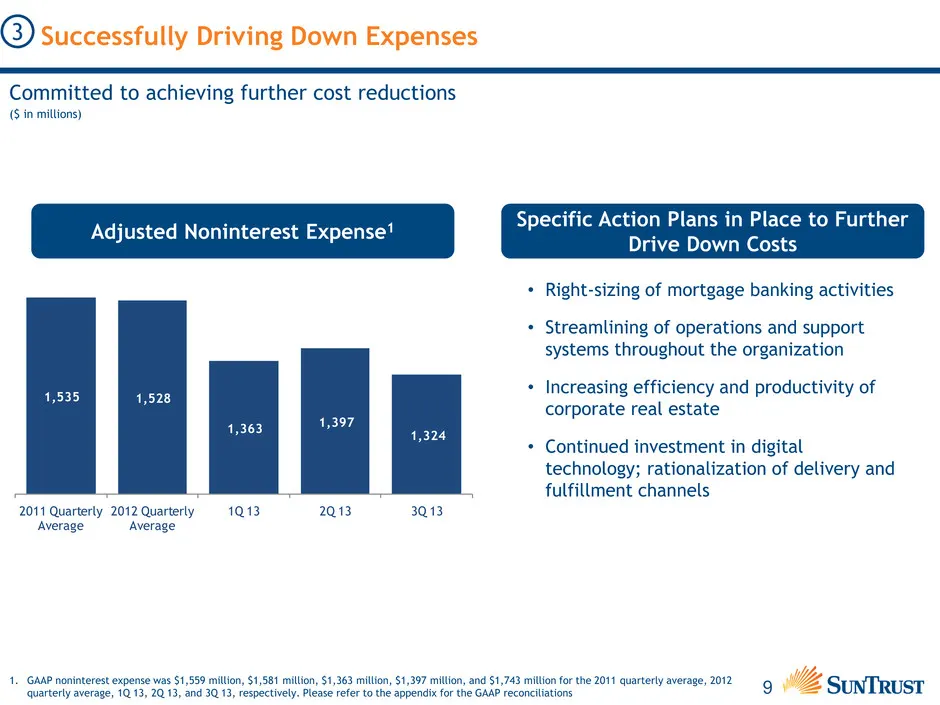
9 Successfully Driving Down Expenses Committed to achieving further cost reductions 1. GAAP noninterest expense was $1,559 million, $1,581 million, $1,363 million, $1,397 million, and $1,743 million for the 2011 quarterly average, 2012 quarterly average, 1Q 13, 2Q 13, and 3Q 13, respectively. Please
Slide 10: Adjusted Tangible Efficiency Ratio: Progress and Future Path
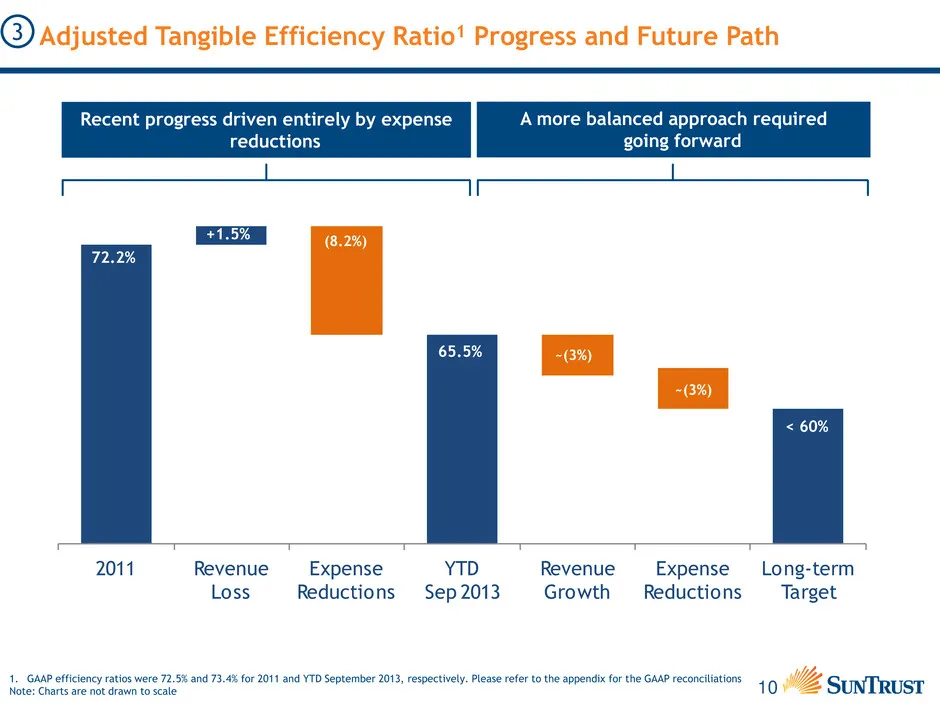
10 2011 Revenue Loss Expense Reductions YTD Sep 2013 Revenue Growth Expense Reductions Long-term Target Adjusted Tangible Efficiency Ratio1 Progress and Future Path Recent progress driven entirely by expense reductions A more balanced approach required going forward 72.2% +1.5% (8.2%) 65.5% ~(3%) ~(
Slide 11: Strategic Priorities by Segment
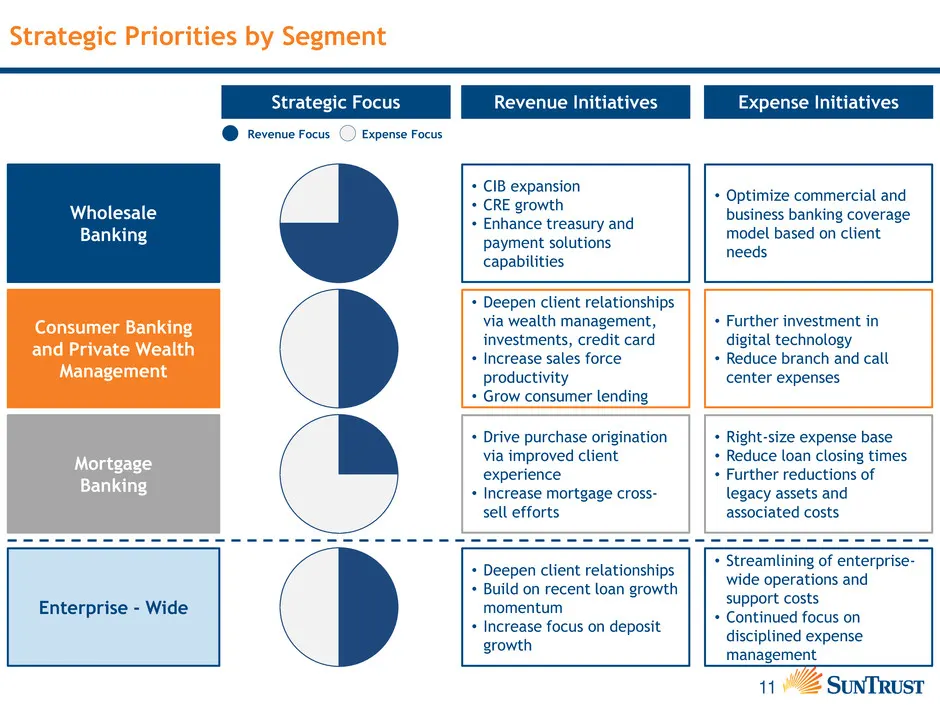
11 Strategic Priorities by Segment Wholesale Banking Consumer Banking and Private Wealth Management Mortgage Banking Enterprise - Wide Strategic Focus Revenue Initiatives Expense Initiatives • CIB expansion • CRE growth • Enhance treasury and payment solutions capabilities • Optimize commercial and
Slide 12: Wholesale Banking Strategic Priorities
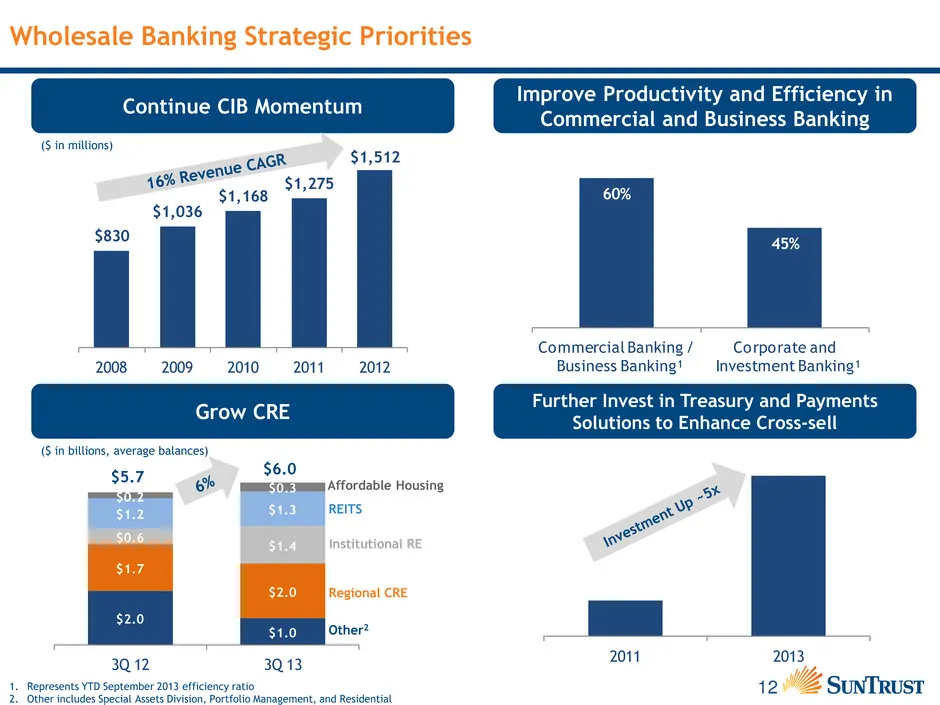
12 $2.0 $1.0 $1.7 $2.0 $0.6 $1.4 $1.2 $1.3 $0.2 $0.3 3Q 12 3Q 13 Wholesale Banking Strategic Priorities Continue CIB Momentum 1. Represents YTD September 2013 efficiency ratio 2. Other includes Special Assets Division, Portfolio Management, and Residential Grow CRE 1 Further Invest in Treasury and P
Slide 13: Consumer Banking & Private Wealth Management Strategic Priorities
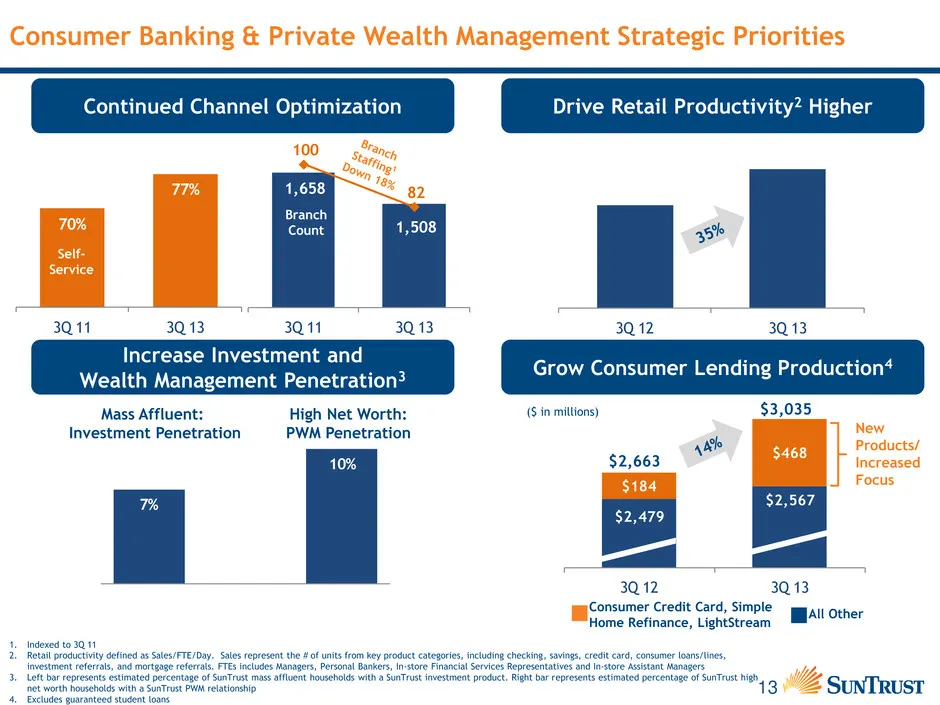
13 $2,479 $2,567 $184 $468 3Q 12 3Q 13 1,658 1,508 100 82 3Q 11 3Q 13 7% 10%3Q 12 3Q 13 70% 77% 3Q 11 3Q 13 Consumer Banking & Private Wealth Management Strategic Priorities ($ in millions) Drive Retail Productivity2 Higher Continued Channel Optimization Branch Count Self- Service Increase Investmen
Slide 14: Mortgage Banking Strategic Priorities
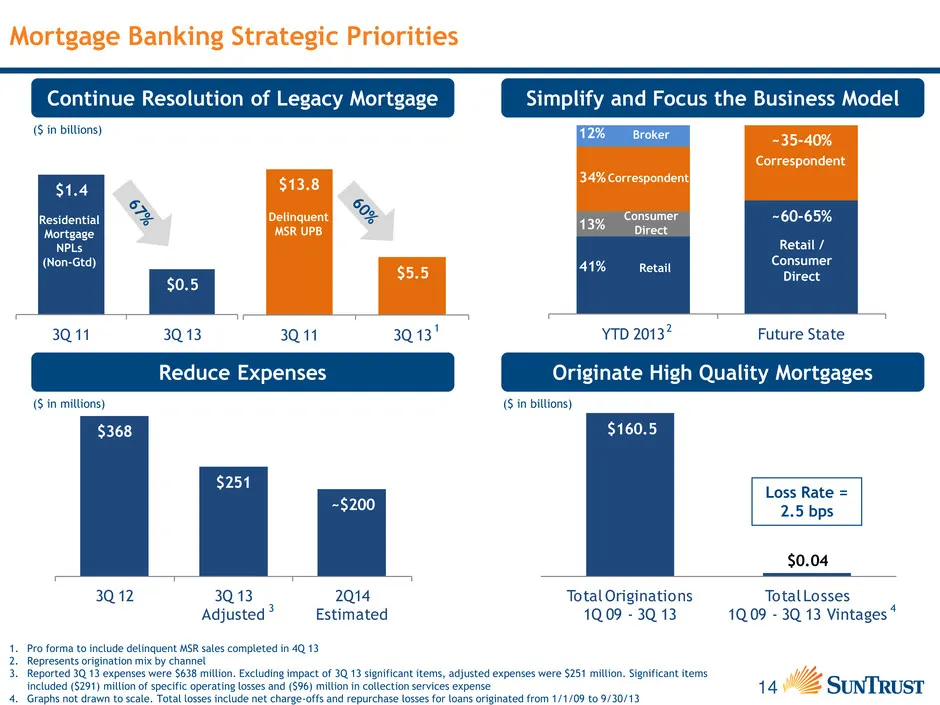
14 $160.5 $0.04 Total Originations 1Q 09 - 3Q 13 Total Losses 1Q 09 - 3Q 13 Vintages $13.8 $5.5 3Q 11 3Q 13 $1.4 $0.5 3Q 11 3Q 13 $368 $251 ~$200 3Q 12 3Q 13 Adjusted 2Q14 Estimated Mortgage Banking Strategic Priorities ($ in millions) Simplify and Focus the Business Model Continue Resolution of Leg
Slide 15: Investment Thesis: Why SunTrust?
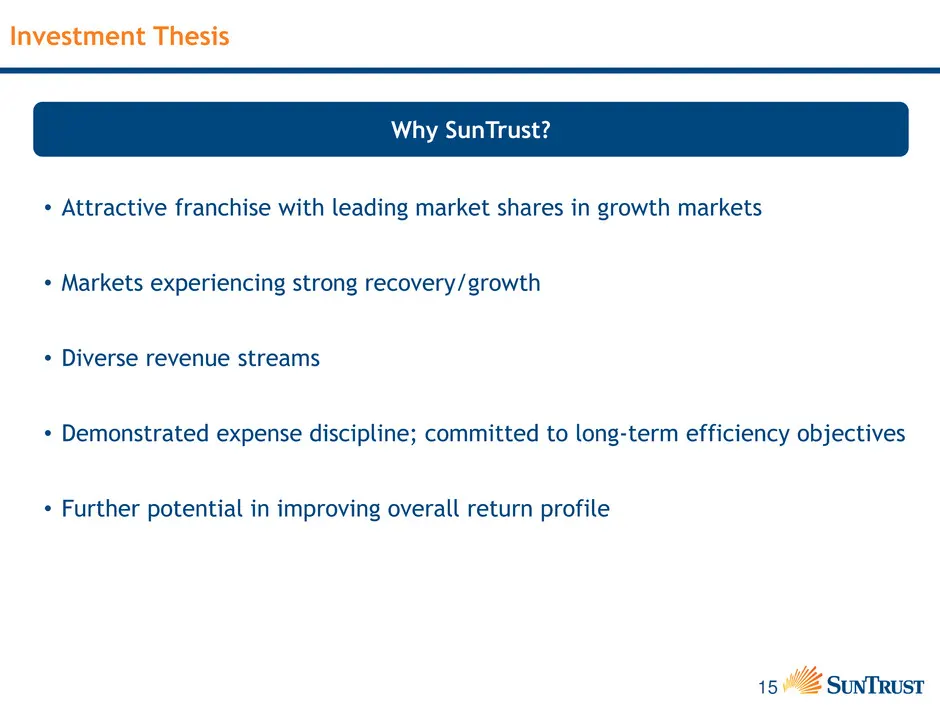
15 Investment Thesis Why SunTrust? • Attractive franchise with leading market shares in growth markets • Markets experiencing strong recovery/growth • Diverse revenue streams • Demonstrated expense discipline; committed to long-term efficiency objectives • Further potential in improving overall retu
Slide 16: Appendix
Appendix 162 SunTrust
Slide 17: Reconciliation of Tier 1 Common Equity Ratio
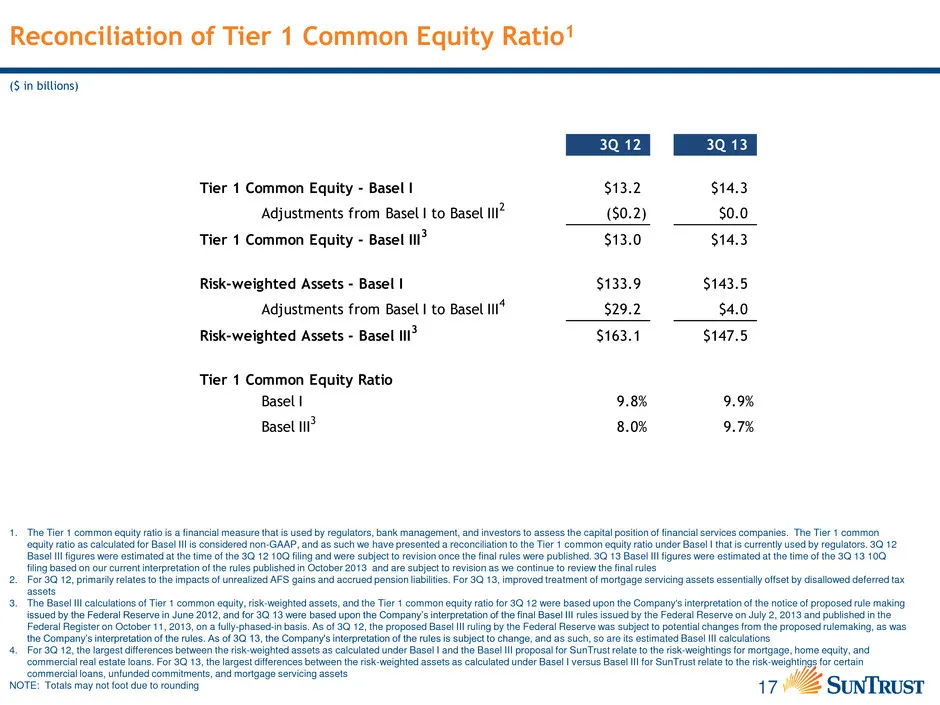
17 Reconciliation of Tier 1 Common Equity Ratio1 ($ in billions) 1. The Tier 1 common equity ratio is a financial measure that is used by regulators, bank management, and investors to assess the capital position of financial services companies. The Tier 1 common equity ratio as calculated for Basel
Slide 18: Noninterest Expense Reconciliation
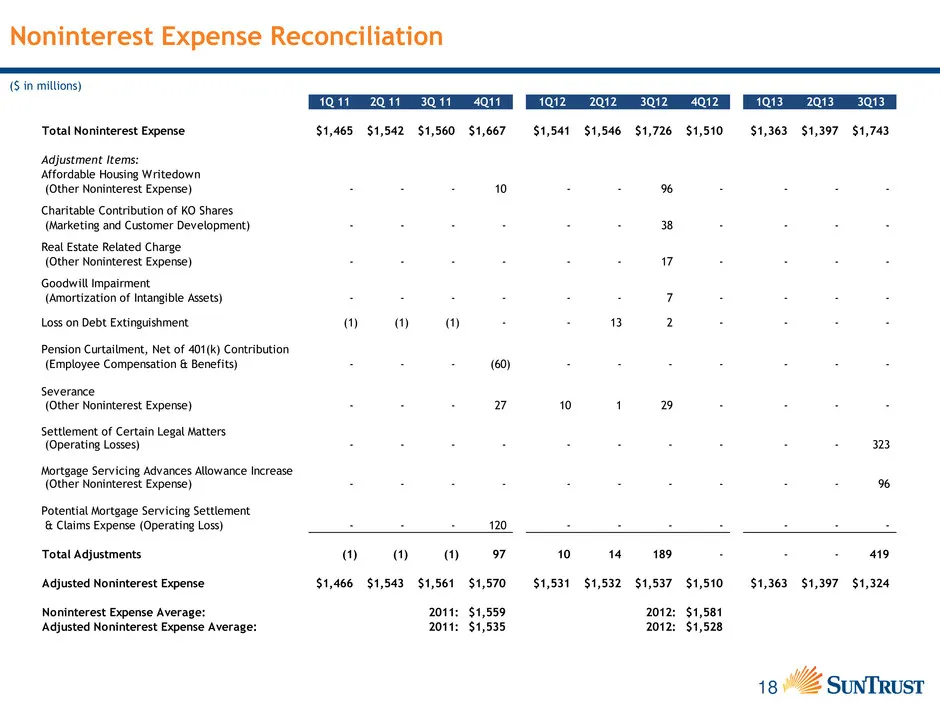
18 Noninterest Expense Reconciliation ($ in millions) 1Q 11 2Q 11 3Q 11 4Q11 1Q12 2Q12 3Q12 4Q12 1Q13 2Q13 3Q13 Total Noninterest Expense $1,465 $1,542 $1,560 $1,667 $1,541 $1,546 $1,726 $1,510 $1,363 $1,397 $1,743 Adjustment Items: Affordable Housing Writedown (Other Noninterest Expense) - - - 10 -
Slide 19: Reconciliation of Efficiency Ratio
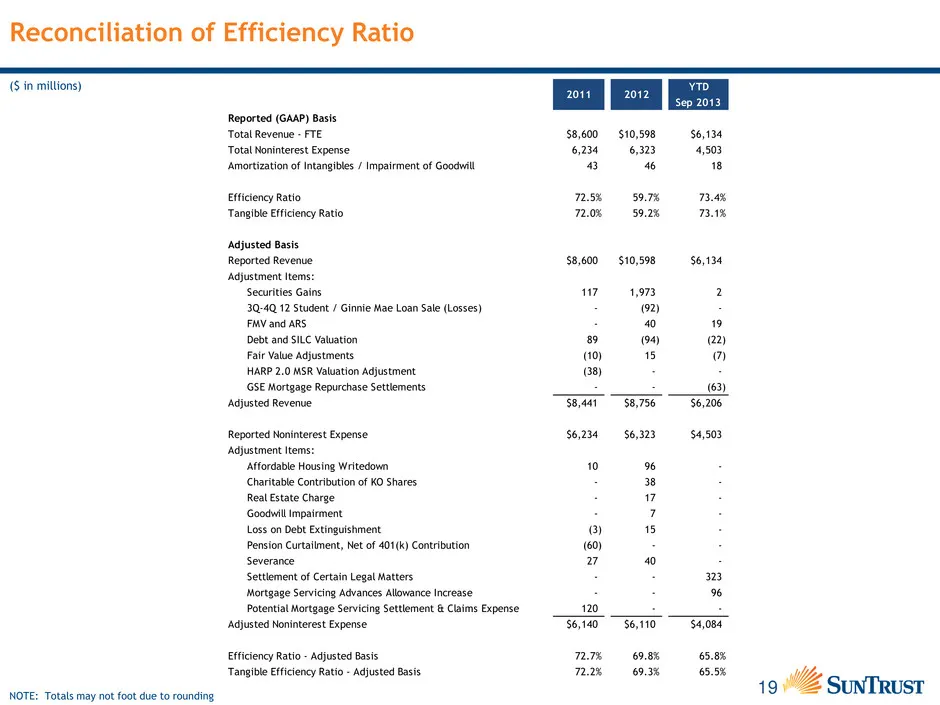
19 Reconciliation of Efficiency Ratio ($ in millions) NOTE: Totals may not foot due to rounding 2011 2012 YTD Sep 2013 Reported (GAAP) Basis Total Revenue - FTE $8,600 $10,598 $6,134 Total Noninterest Expense 6,234 6,323 4,503 Amortization of Intangibles / Impairment of Goodwill 43 46 18 Efficiency
Slide 20: Goldman Sachs Financial Services Conference
Goldman Sachs Financial Services Conference William H. Rogers, Jr., Chairman and Chief Executive Officer, SunTrust Banks, Inc. December 10, 2013
Source: SEC EDGAR · 8-K filed Dec 10, 2013
More decks from SunTrust Banks Inc
 Q3 2019 Earnings Presentation21 slides · Oct 17, 2019
 Q2 2019 Earnings Presentation22 slides · Jul 18, 2019
 Q1 2019 Earnings Presentation22 slides · Apr 18, 2019
 Merger or Acquisition (February 2019)38 slides · Feb 7, 2019
 Q4 2018 Earnings Presentation23 slides · Jan 18, 2019
 2018 Goldman Sachs US Financial Services Conference30 slides · Dec 4, 2018