Mattress Firm — Investor Presentation (October 2013)
25 slides from Mattress Firm's investor presentation, Oct 29, 2013
Slide 1: Investor Presentation October 2013
Investor Presentation October 2013 1
Slide 2: Forward Looking Statements and Non-GAAP Information
Forward Looking Statements and Non-GAAP Information This presentation contains forward-looking statements within the meaning of federal securities laws, that are subject to risks and uncertainties. All statements other than statements of historical fact included in this presentation are forward-look
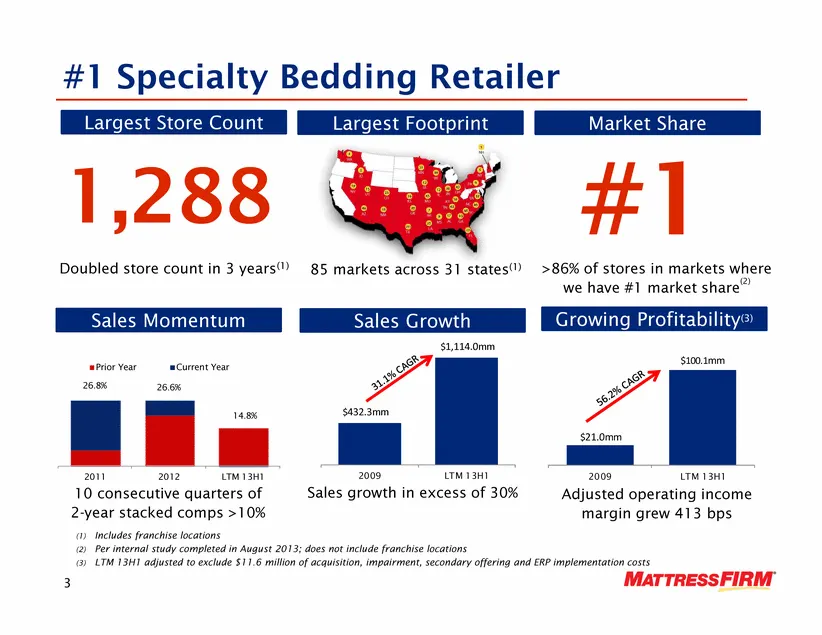
Slide 3: #1 Specialty Bedding Retailer
#1 Specialty Bedding Retailer L F i L t St C t M k Sh #1 1 288 Largest Footprint Largest Store Count Market Share 85 markets across 31 states(1) Doubled store count in 3 years(1) >86% of stores in markets where 1,288 we have #1 market share(2) Sales Growth Sales Momentum Growing Profitability(3) $1,
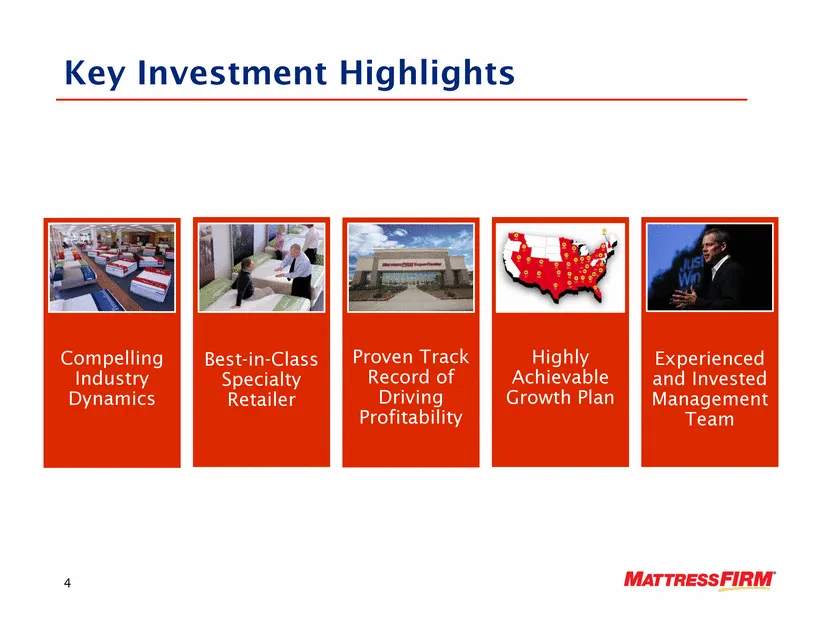
Slide 4: Key Investment Highlights
Key Investment Highlights Proven Track Compelling Best in Class Highly Experienced Record of Driving Profitability Industry Dynamics Best-in-Specialty Retailer Achievable Growth Plan and Invested Management Team 4
Slide 5: Compelling Industry Dynamics
Compelling Industry Dynamics 5Rosenberg, TX
Slide 6: Attractive Industry Dynamics
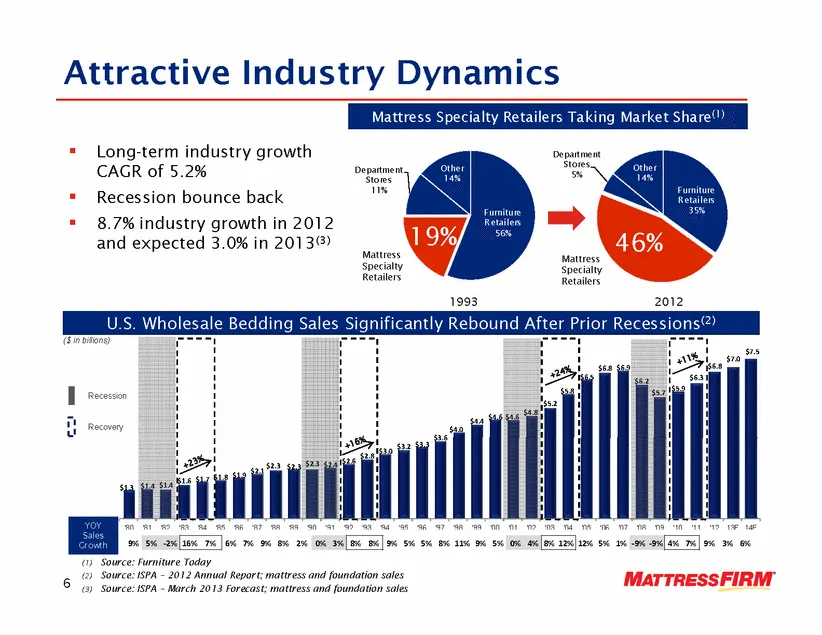
Attractive Industry Dynamics 1 9 Mattress Specialty Retailers Taking Market Share(1) Department Stores 11% Other 14% % . Long-term industry growth CAGR of 5.2% . Recession bounce back Furniture R t il Department Stores 5% Other 14% Furniture Retailers 56% 19% . 8.7% industry growth in 2012 and expec
Slide 7: Industry Growth Drivers
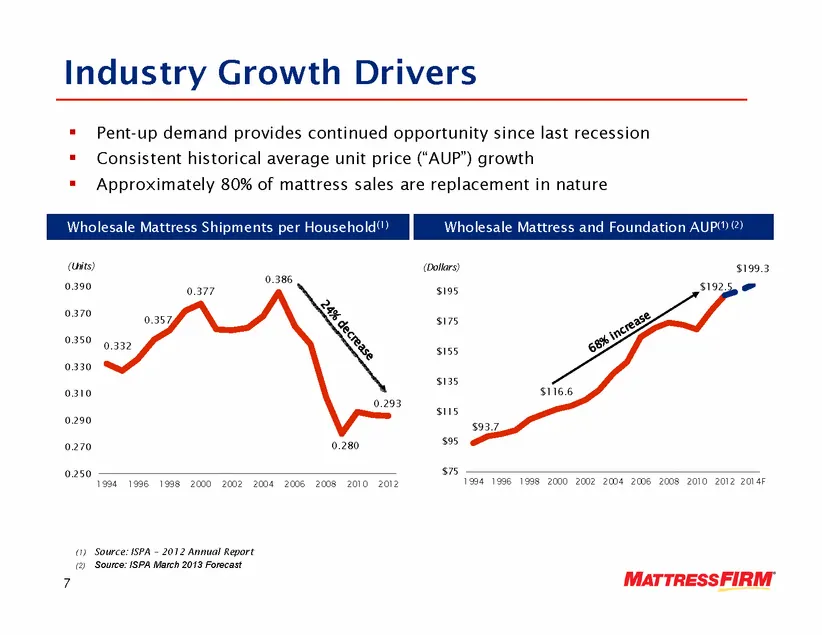
Industry Growth Drivers . Pent-up demand provides continued opportunity since last recession . Consistent historical average unit price (“AUP”) growth . Approximately 80% of mattress sales are replacement in nature $199.3 (Dollars) Wholesale Mattress Shipments per Household(1) Wholesale Mattress and
Slide 8: Best-in-Class Retailer
Best-in-Class Retailer 8Hamilton, OH
Slide 9: Competitive Real Estate Locations
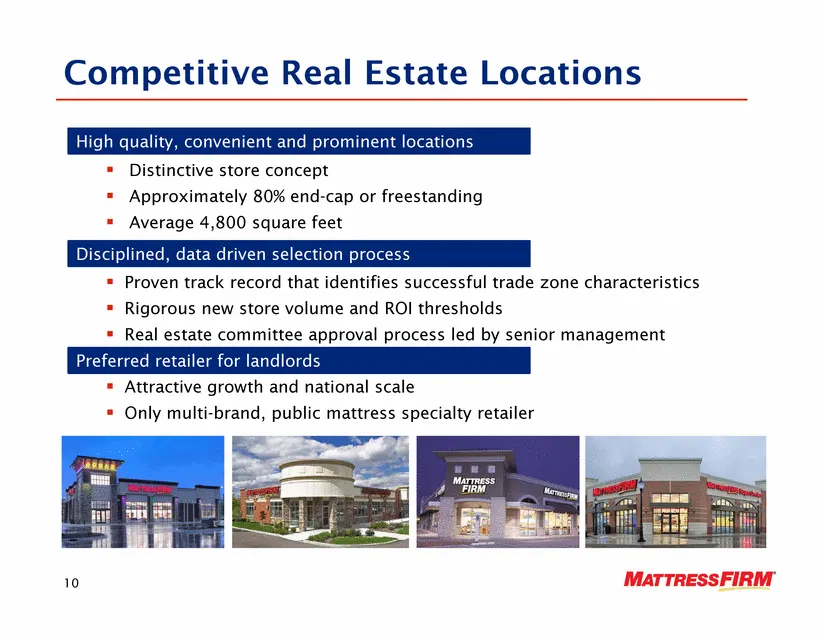
Competitive Real Estate Locations High quality, convenient and prominent locations . Distinctive store concept . Approximately 80% end-cap or freestanding High quality, convenient and prominent locations . Average 4,800 square feet Disciplined, data driven selection process P k d h id ifi f l d h i
Slide 10: Breadth of Merchandising
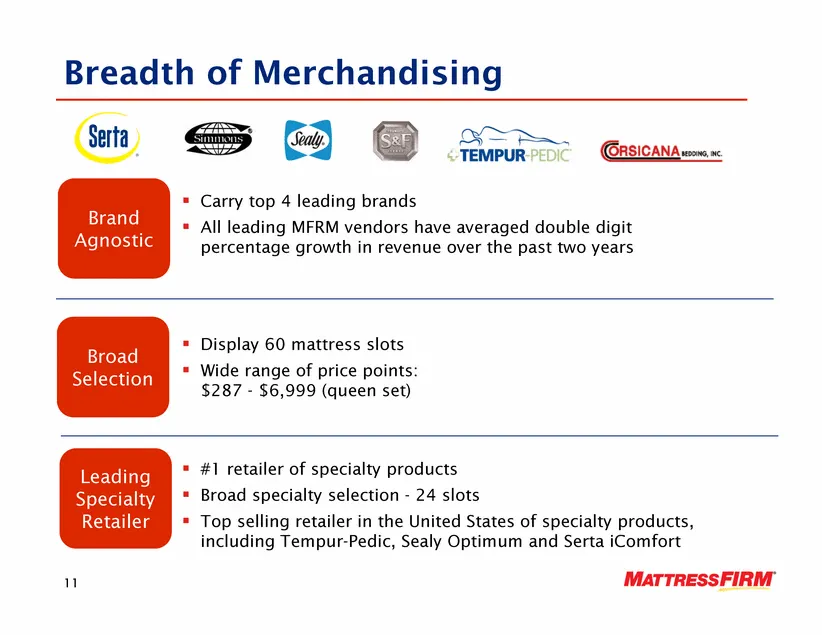
Breadth of Merchandising C t l di b d Brand Agnostic . Carry top 4 leading brands . All leading MFRM vendors have averaged double digit percentage growth in revenue over the past two years Broad . Display 60 mattress slots Selection . Wide range of price points: $287 - $6,999 (queen set) Leading Spe
Slide 11: Unique Merchandising Approach
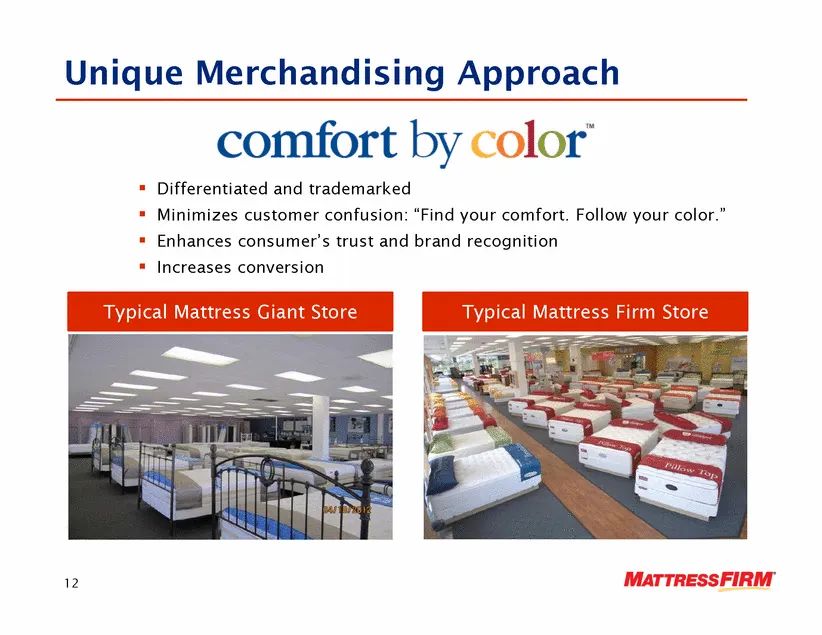
Unique Merchandising Approach . Differentiated and trademarked . Minimizes customer confusion: “Find your comfort. Follow your color.” . Enhances consumer’s trust and brand recognition . Increases conversion Typical Mattress Giant Store Typical Mattress Firm Store 12
Slide 12: Differentiated Customer Experience
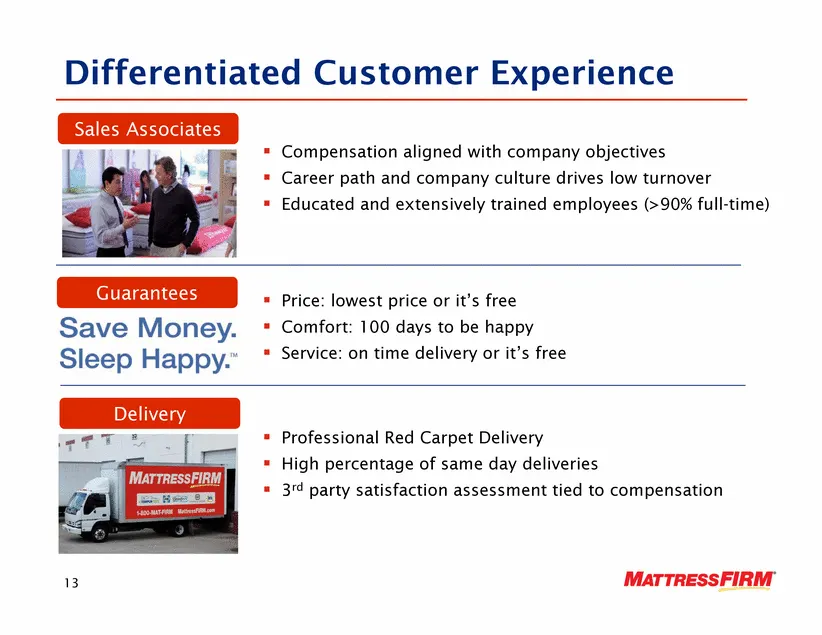
Differentiated Customer Experience Sales Associates . Compensation aligned with company objectives . Career path and company culture drives low turnover d d d l d l ( fll ) . Educated and extensively trained employees (>90% full-time) Guarantees . Price: lowest price or it’s free . Comfort: 100 days
Slide 13: Proven Track Record of Driving Profitability
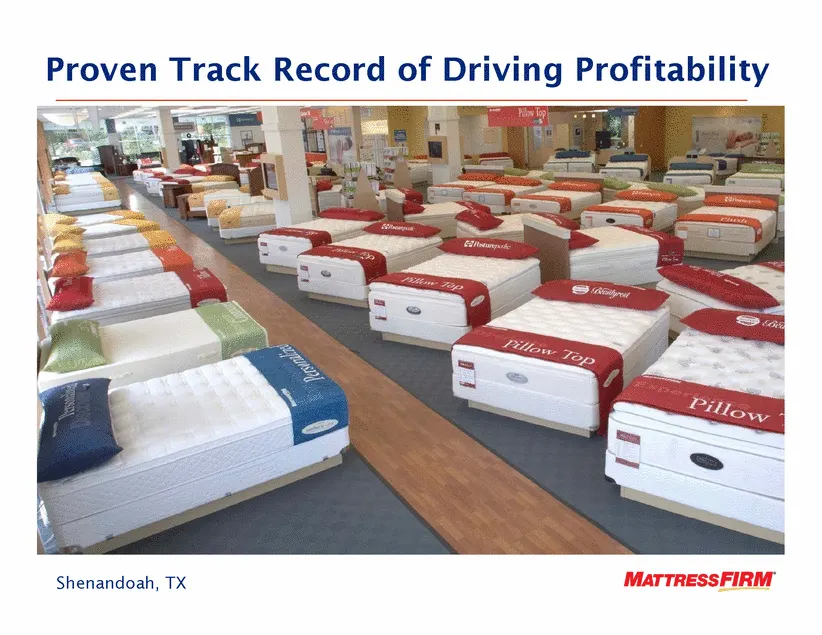
Proven Track Record of Driving Profitability 14 Shenandoah, TX
Slide 14: Market Penetration Case Study: Houston Market
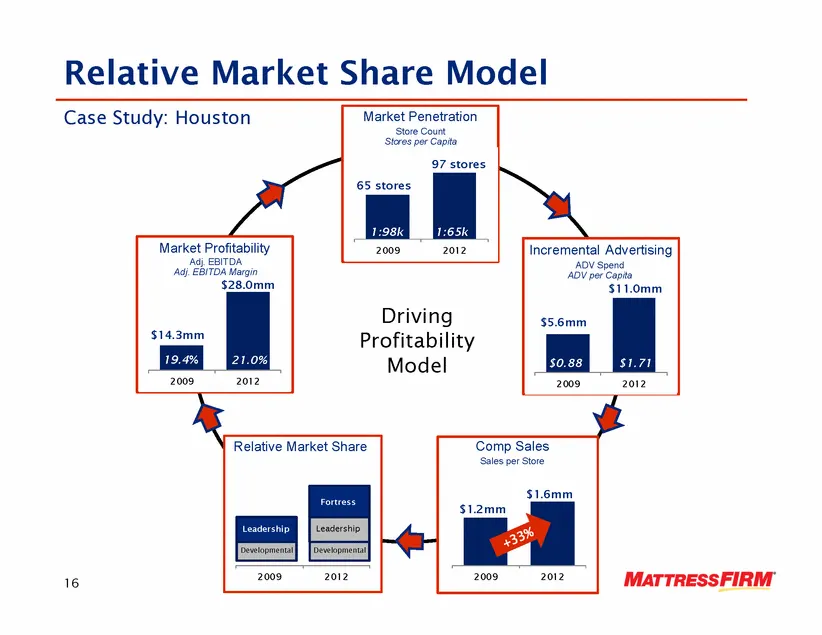
Relative Market Share Model Penetration Case Study: Houston Market Store Count Stores per Capita 97 stores 65 stores 2009 2012 Incremental Advertising Market Profitability ADV Spend per Adj. EBITDA Adj. EBITDA Margin 1:98k 1:65k Driving Profitability d l ADV Capita $5.6mm $11.0mm $14.3mm $28.0mm 19
Slide 15: Market Penetration Highly Correlated to Profitability
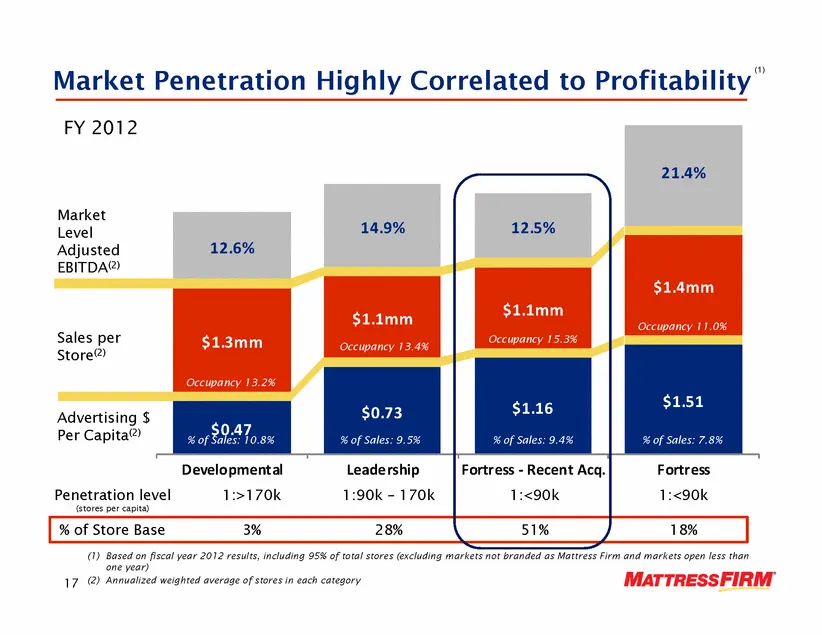
Market Penetration Highly Correlated to Profitability(1) 21.4% FY 2012 12.6% 14.9% 12.5% Market Level Adjusted EBITDA(2) $1.3mm $1.1mm $1.1mm $1.4mm Sales per Store(2) Occupancy 13.4% Occupancy 11.0% Occupancy 15.3% $0.47 $0.73 $1.16 $1.51 Store Advertising $ Per Capita(2) % f S l 10 8% % f S l 9 5%
Slide 16: Acquisition Updates
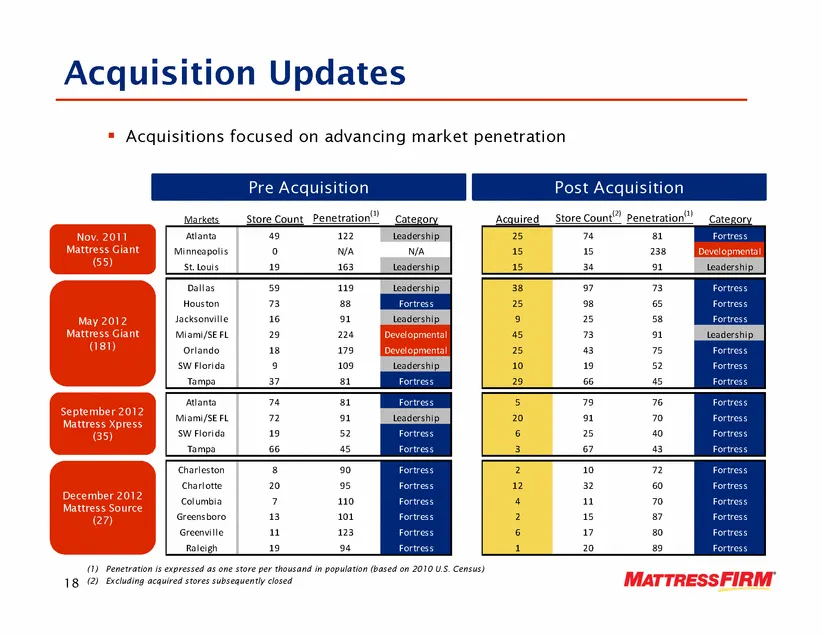
Acquisition Updates Pre Acquisition Post Acquisition . Acquisitions focused on advancing market penetration Nov. 2011 Mattress Giant (55) Markets Store Count Penetration(1) Category Atlanta 49 122 Leadership Minneapolis 0 N/A N/A St. Louis 19 163 Leadership Acquired Store Count(2) Penetration(1) Cat
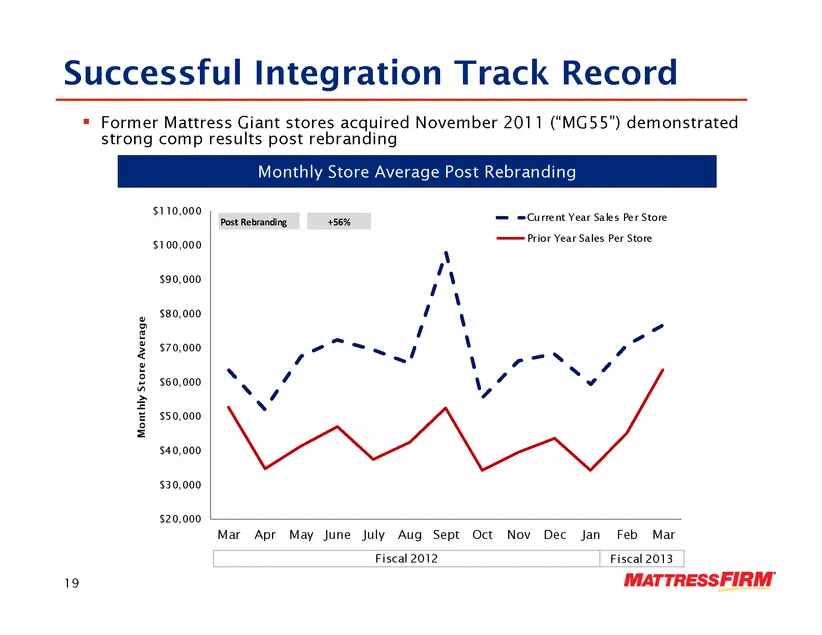
Slide 17: Successful Integration Track Record (MG55)
Successful Integration Track Record F M Gi i d N b MG55”) d d . Former Mattress Giant stores acquired November 2011 (“demonstrated strong comp results post rebranding Monthly Store Average Post Rebranding $90 000 $100,000 $110,000 Current Year Sales Per Store Prior Year Sales Per Store (1) Post Rebr
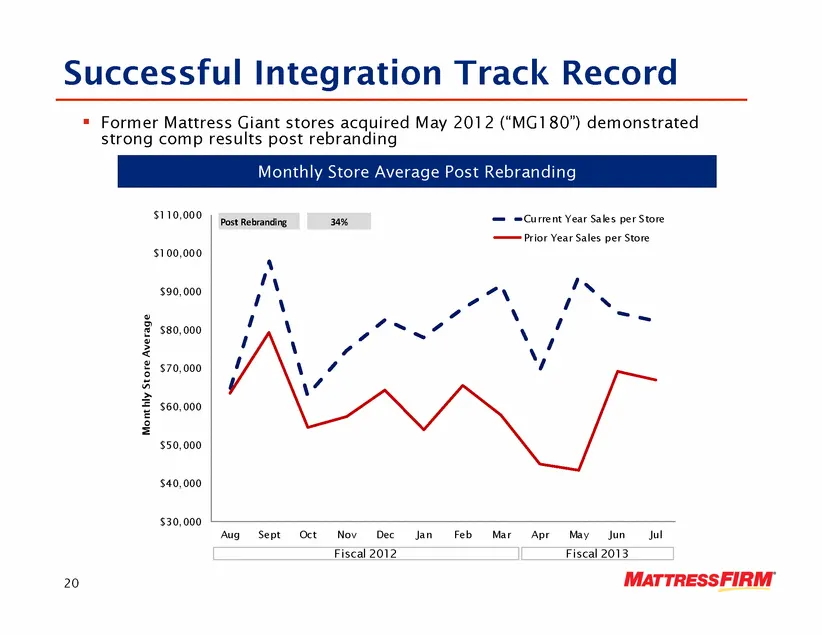
Slide 18: Successful Integration Track Record (MG180)
Successful Integration Track Record F M Gi i d M d d . Former Mattress Giant stores acquired May 2012 (“MG180”) demonstrated strong comp results post rebranding Monthly Store Average Post Rebranding $100,000 $110,000 Current Year Sales per Store Prior Year Sales per Store (1) Post Rebranding 34% $80
Slide 19: Highly Achievable Growth Plan
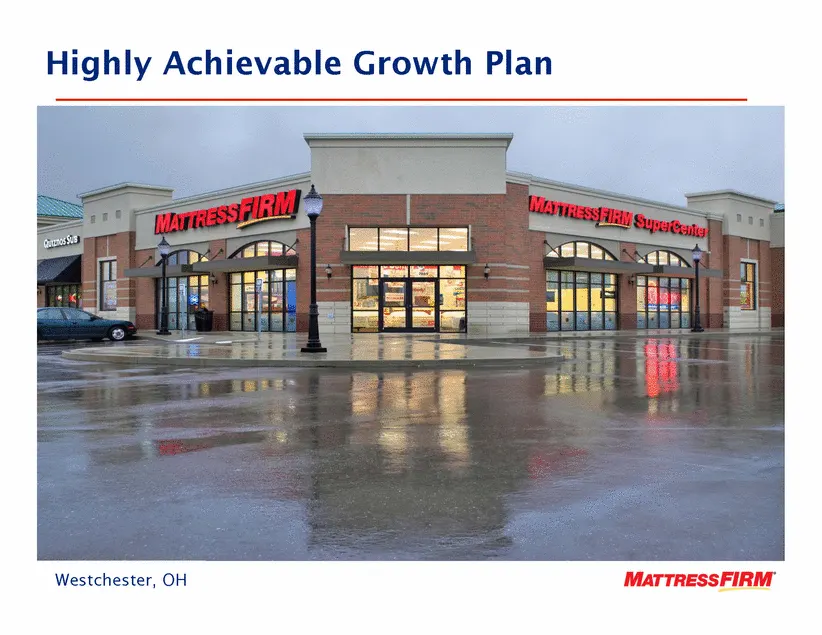
Highly Achievable Growth Plan 21 Westchester, OH
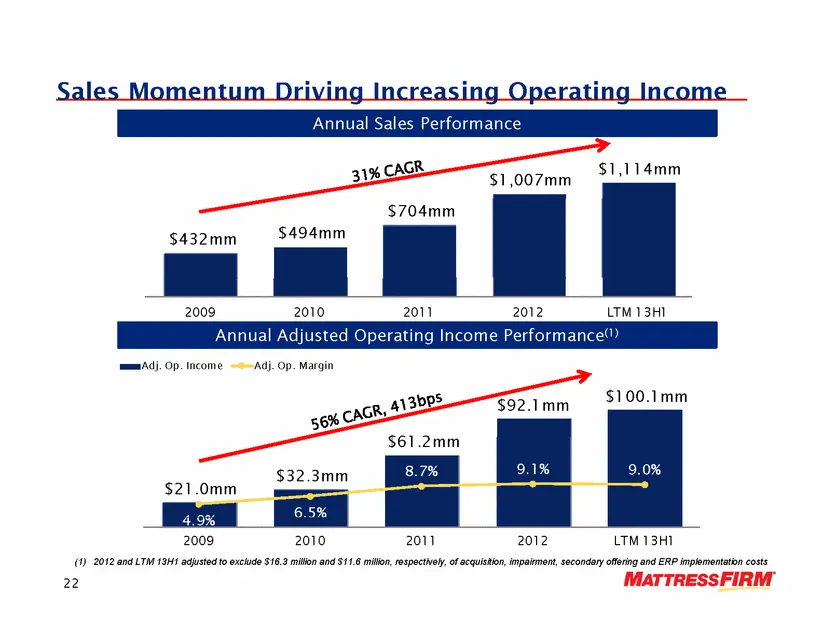
Slide 20: Sales Momentum Driving Increasing Operating Income
Sales Momentum Driving Increasing Operating Income A l Sl P f $1,007mm $1,114mm Annual Sales Performance $432mm $494mm $704mm 2009 2010 2011 2012 LTM 13H1 Annual Adjusted Operating Income Performance(1) $61 2 $92.1mm $100.1mm 20.0% 30.0% $ 80 $100 $120 Adj. Op. Income Adj. Op. Margin $21.0mm $32.3mm
Slide 21: Organic Growth Plan Through 2016
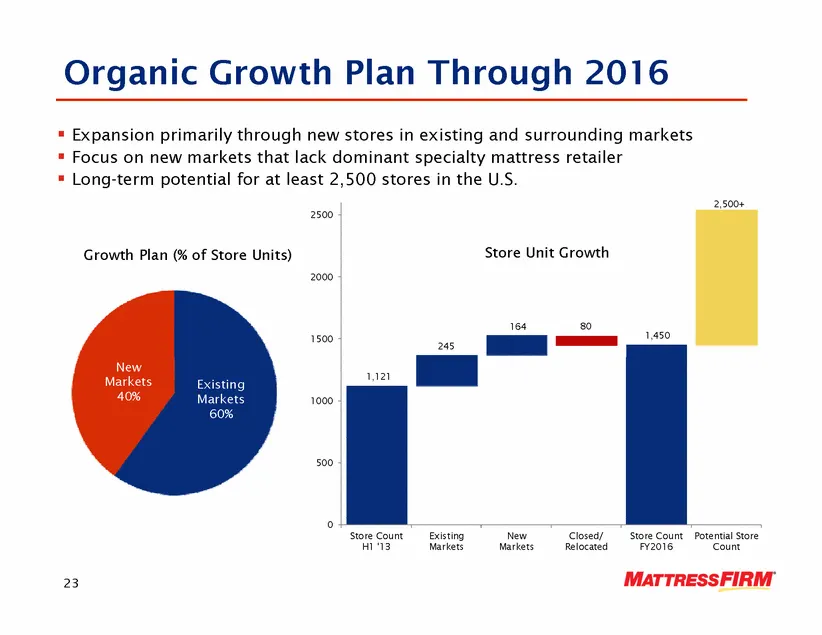
Organic Growth Plan Through 2016 . Expansion primarily through new stores in existing and surrounding markets . Focus on new markets that lack dominant specialty mattress retailer . Long-term potential for at least 2,500 stores in the U.S. 2,500+ 2000 2500 Growth Plan (% of Store Units) Store Unit G
Slide 22: Highly Accretive New Store Economic Model
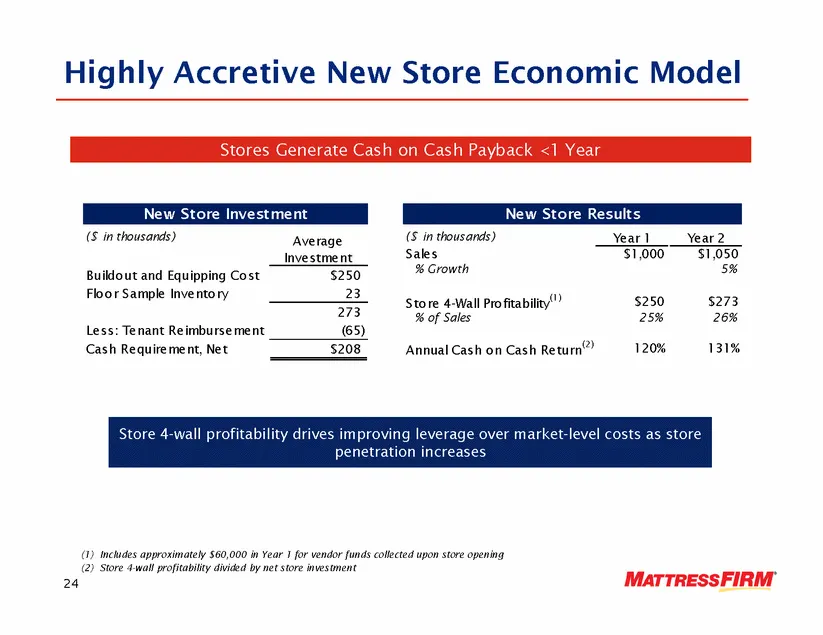
Highly Accretive New Store Economic Model Stores Generate Cash on Cash Payback <1 Year New Store Investment ($ in thousands) Average Investment Buildout and Equipping Cost $250 New Store Results ($ in thousands) Year 1 Year 2 Sales $1,000 $1,050 % Growth 5% Buildout and Equipping Cost $250 Floor Sam
Slide 23: Continued Store Growth
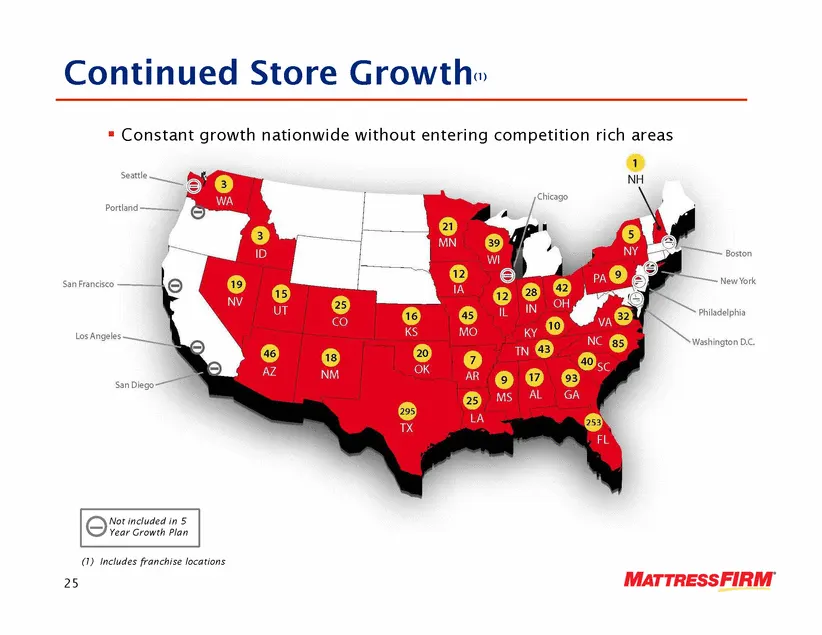
Continued Store Growth(1) . Constant growth nationwide without entering competition rich areas l d d 25 Not included in 5 Year Growth Plan (1) Includes franchise locations
Slide 24: Experienced and Invested Management Team
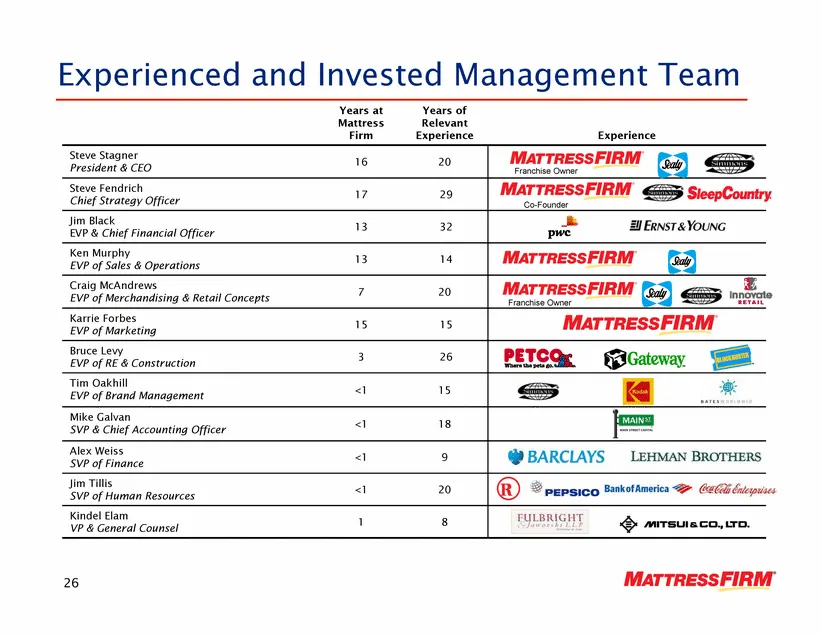
Years at Years of Experienced and Invested Management Team Mattress Firm Relevant Experience Experience Steve Stagner President & CEO 16 20 Steve Fendrich Chi f S Offi 17 29 Franchise Owner Chief Strategy Officer Jim Black EVP & Chief Financial Officer 13 32 Ken Murphy EVP of Sales & Operations 13 1
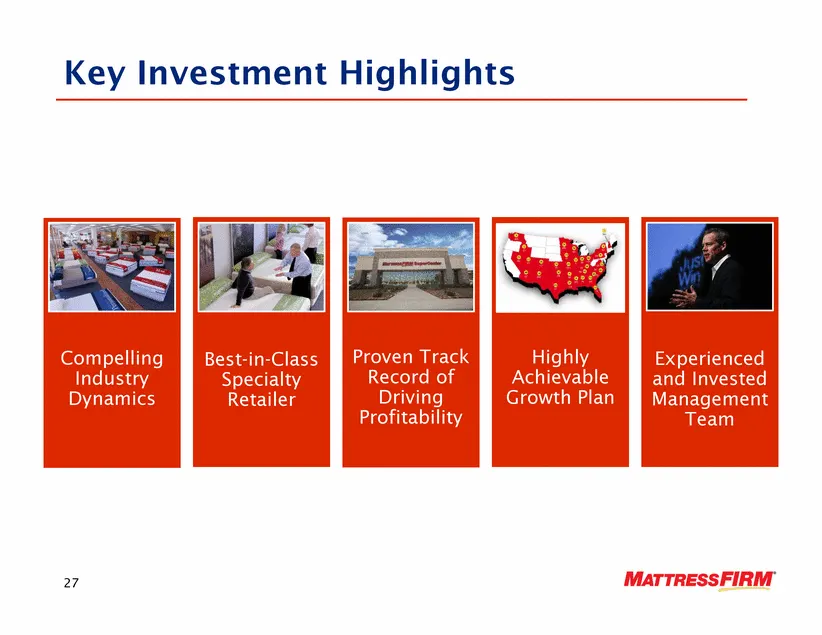
Slide 25: Key Investment Highlights
Key Investment Highlights Proven Track Compelling Best in Class Highly Experienced Record of Driving Profitability Industry Dynamics Best-in-Specialty Retailer Achievable Growth Plan and Invested Management Team 27
Source: SEC EDGAR · 8-K filed Oct 29, 2013