Pioneer Natural Resources — Non-Deal Roadshow (May 2006)
36 slides from Pioneer Natural Resources's roadshow presentation, May 16, 2006
Slide 1: Investor Meetings May 2006
PIONEER NATURAL RESOURCES Investor Meetings May 2006
Slide 2: Forward-Looking Statements
Forward-Looking Statements Except for historical information contained herein, the statements in this presentation are forward-looking statements that are made pursuant to the Safe Harbor Provisions of the Private Securities Litigation Reform Act of 1995. Forward- looking statements and the business
Slide 3: Strategy For Strong, Consistent Growth
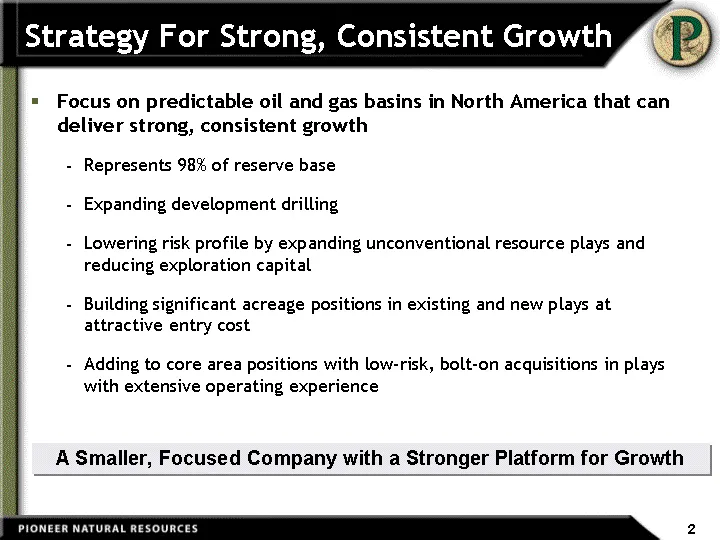
Strategy For Strong, Consistent Growth Focus on predictable oil and gas basins in North America that can deliver strong, consistent growth Represents 98% of reserve base Expanding development drilling Lowering risk profile by expanding unconventional resource plays and reducing exploration capital B
Slide 4: Pioneer Today (Post Divestitures)
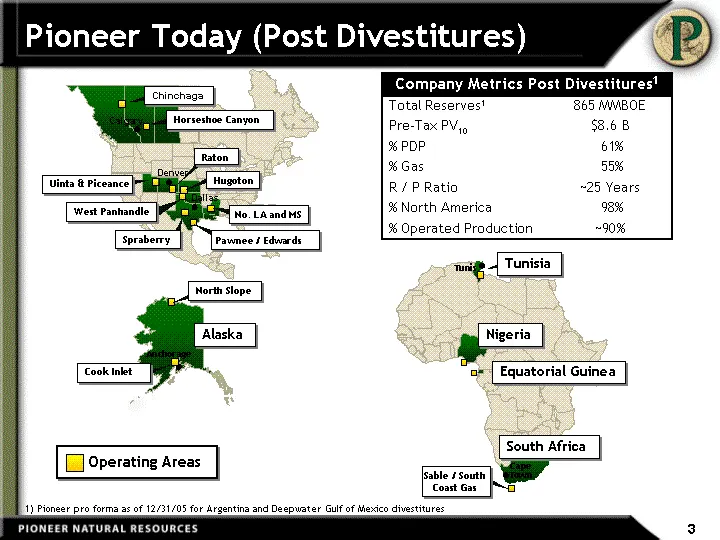
Pioneer Today (Post Divestitures) T unis Cape T own Operating Areas Tunisia Nigeria Equatorial Guinea South Africa Sable / South Coast Gas Company Metrics Post Divestitures1 Company Metrics Post Divestitures1 Total Reserves1 865 MMBOE Pre-Tax PV10 $8.6 B % PDP 61% % Gas 55% R / P Ratio ~25 Years % N
Slide 5: Significant Unbooked Resource Potential
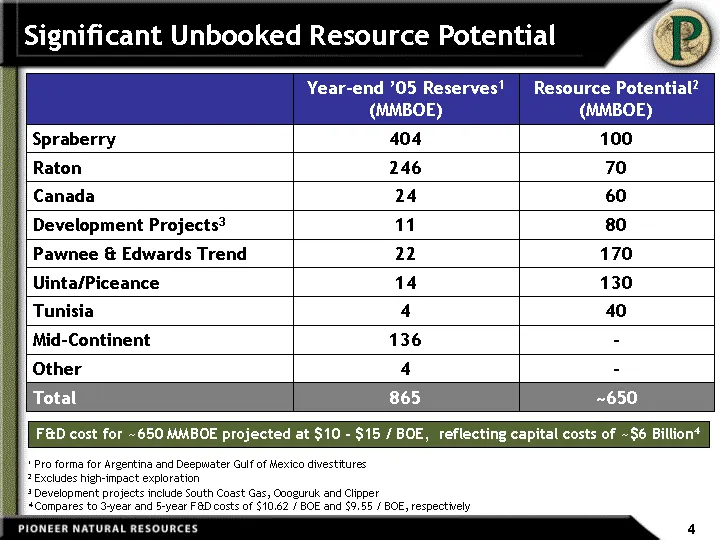
Significant Unbooked Resource Potential Year-end '05 Reserves1 (MMBOE) Resource Potential2 (MMBOE) Spraberry 404 100 Raton 246 70 Canada 24 60 Development Projects3 11 80 Pawnee & Edwards Trend 22 170 Uinta/Piceance 14 130 Tunisia 4 40 Mid-Continent 136 - Other 4 - Total 865 ~650 3 Development proje
Slide 6: 2006 Capital Budget Generates Strong IRRs & Growth
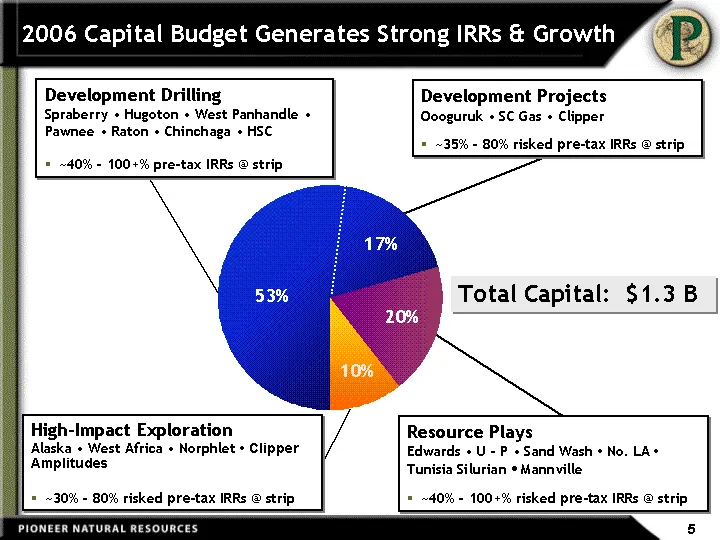
2006 Capital Budget Generates Strong IRRs & Growth Development Resource Plays High-Impact East 924 247 137 20% 17% 53% High-Impact Exploration Alaska • West Africa • Norphlet • Clipper Amplitudes ~30% - 80% risked pre-tax IRRs @ strip Resource Plays Edwards • U - P • Sand Wash • No. LA • Tunisia Sil
Slide 7: Targeting Double-Digit Production Growth
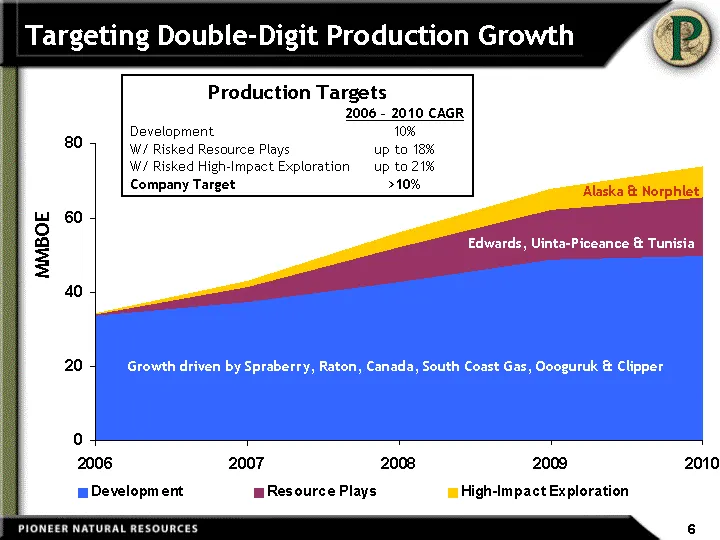
Targeting Double-Digit Production Growth Production Targets 2006 - 2010 CAGR Development 10% W/ Risked Resource Plays up to 18% W/ Risked High-Impact Exploration up to 21% Company Target >10% MMBOE Edwards, Uinta-Piceance & Tunisia Growth driven by Spraberry, Raton, Canada, South Coast Gas, Oooguruk
Slide 8: On Track to Deliver Production Growth Targets
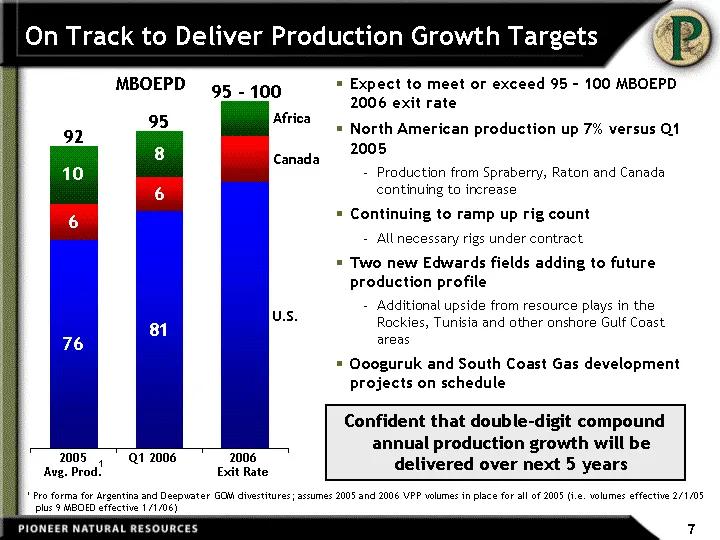
Expect to meet or exceed 95 - 100 MBOEPD 2006 exit rate North American production up 7% versus Q1 2005 Production from Spraberry, Raton and Canada continuing to increase Continuing to ramp up rig count All necessary rigs under contract Two new Edwards fields adding to future production profile Addit
Slide 9: Spraberry Anchors Growth
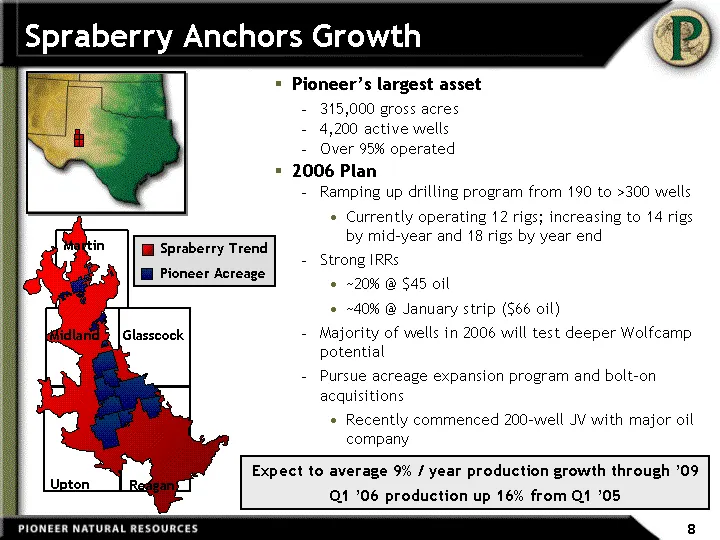
Spraberry Anchors Growth Glasscock Reagan Upton Midland Martin Spraberry Trend Pioneer Acreage Pioneer's largest asset 315,000 gross acres 4,200 active wells Over 95% operated 2006 Plan Ramping up drilling program from 190 to >300 wells Currently operating 12 rigs; increasing to 14 rigs by mid-year
Slide 10: Edwards Trend - 100% Drilling Success YTD
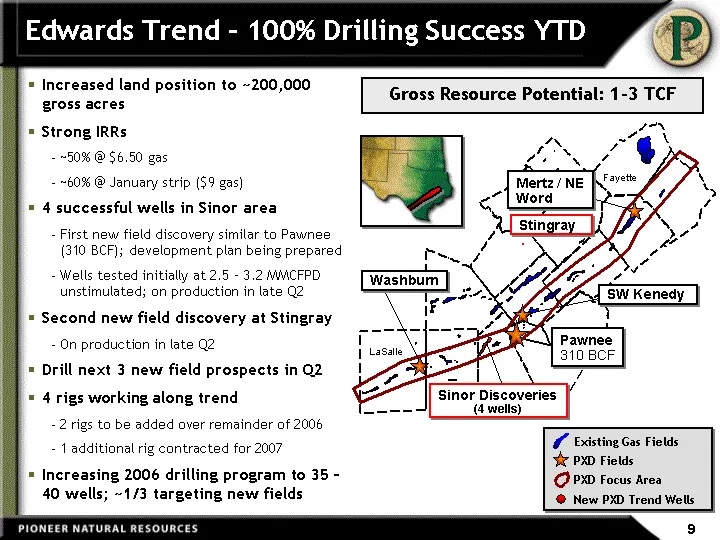
Edwards Trend - 100% Drilling Success YTD Increased land position to ~200,000 gross acres Strong IRRs ~50% @ $6.50 gas ~60% @ January strip ($9 gas) 4 successful wells in Sinor area First new field discovery similar to Pawnee (310 BCF); development plan being prepared Wells tested initially at 2.5 -
Slide 11: Raton Expansion Continues
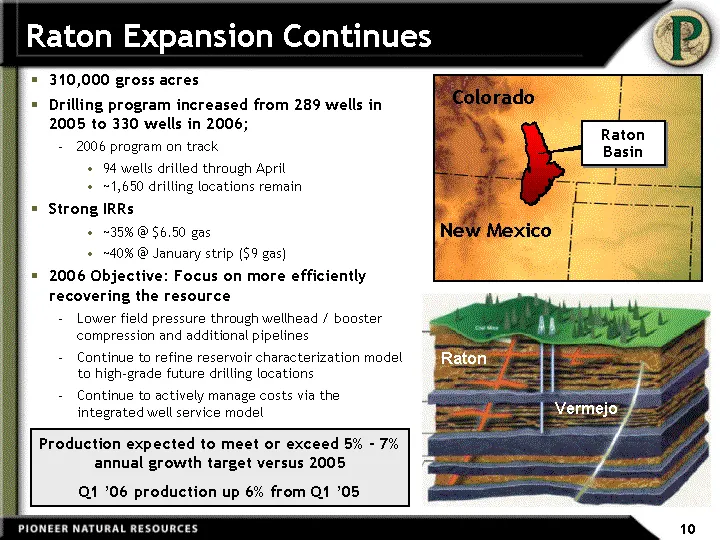
Raton Expansion Continues New Mexico Colorado Raton Basin 310,000 gross acres Drilling program increased from 289 wells in 2005 to 330 wells in 2006; 2006 program on track 94 wells drilled through April ~1,650 drilling locations remain Strong IRRs ~35% @ $6.50 gas ~40% @ January strip ($9 gas) 2006
Slide 12: Rockies Emerging Resource Plays
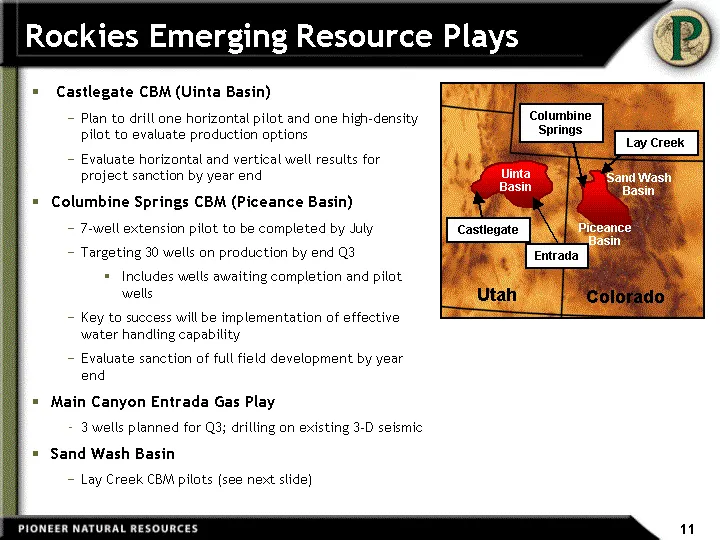
Rockies Emerging Resource Plays Castlegate CBM (Uinta Basin) Plan to drill one horizontal pilot and one high-density pilot to evaluate production options Evaluate horizontal and vertical well results for project sanction by year end Columbine Springs CBM (Piceance Basin) 7-well extension pilot to be
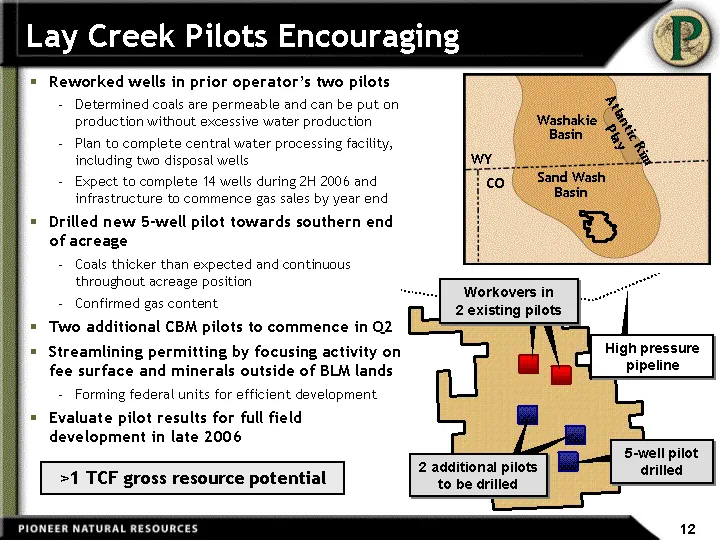
Slide 13: Lay Creek Pilots Encouraging
Reworked wells in prior operator's two pilots Determined coals are permeable and can be put on production without excessive water production Plan to complete central water processing facility, including two disposal wells Expect to complete 14 wells during 2H 2006 and infrastructure to commence gas
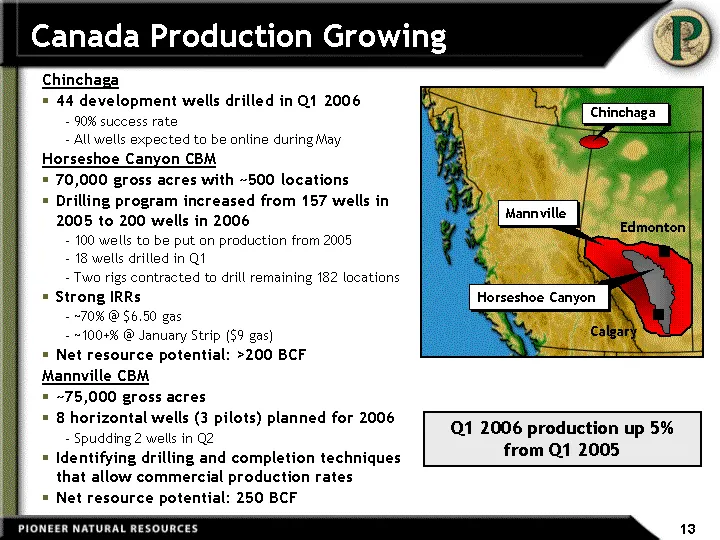
Slide 14: Canada Production Growing
Canada Production Growing Chinchaga 44 development wells drilled in Q1 2006 90% success rate All wells expected to be online during May Horseshoe Canyon CBM 70,000 gross acres with ~500 locations Drilling program increased from 157 wells in 2005 to 200 wells in 2006 100 wells to be put on production
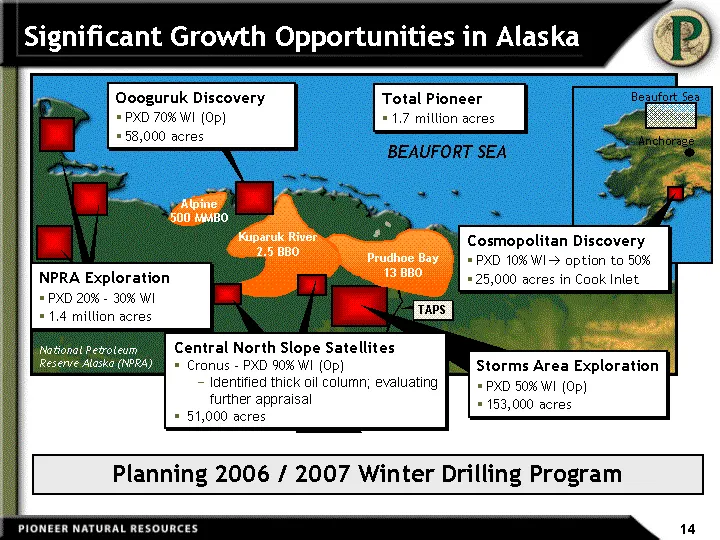
Slide 15: Significant Growth Opportunities in Alaska
BEAUFORT SEA National Petroleum Reserve Alaska (NPRA) Significant Growth Opportunities in Alaska Storms Area Exploration PXD 50% WI (Op) 153,000 acres NPRA Exploration PXD 20% - 30% WI 1.4 million acres Total Pioneer 1.7 million acres Oooguruk Discovery PXD 70% WI (Op) 58,000 acres Prudhoe Bay 13 BB
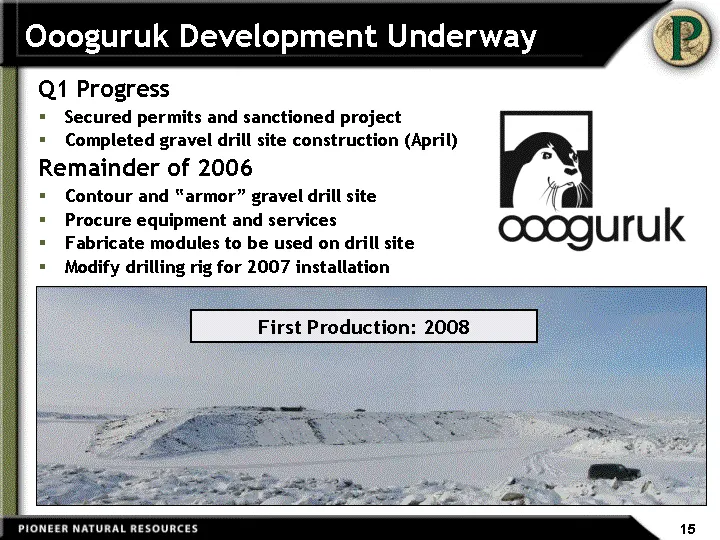
Slide 16: Oooguruk Development Underway
Q1 Progress Secured permits and sanctioned project Completed gravel drill site construction (April) Remainder of 2006 Contour and "armor" gravel drill site Procure equipment and services Fabricate modules to be used on drill site Modify drilling rig for 2007 installation First Production: 2008 Ooogu
Slide 17: Clipper Provides Significant Reserve Upside
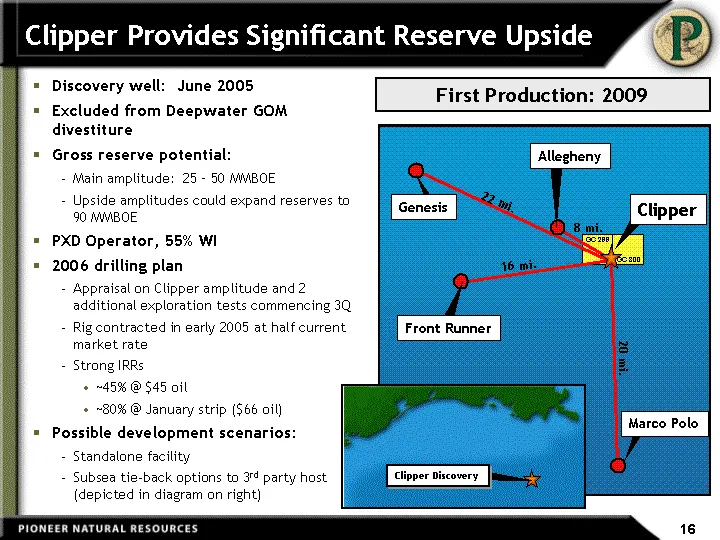
Clipper Provides Significant Reserve Upside Discovery well: June 2005 Excluded from Deepwater GOM divestiture Gross reserve potential: Main amplitude: 25 - 50 MMBOE Upside amplitudes could expand reserves to 90 MMBOE PXD Operator, 55% WI 2006 drilling plan Appraisal on Clipper amplitude and 2 additi
Slide 18: Tunisia Provides Core Area Potential
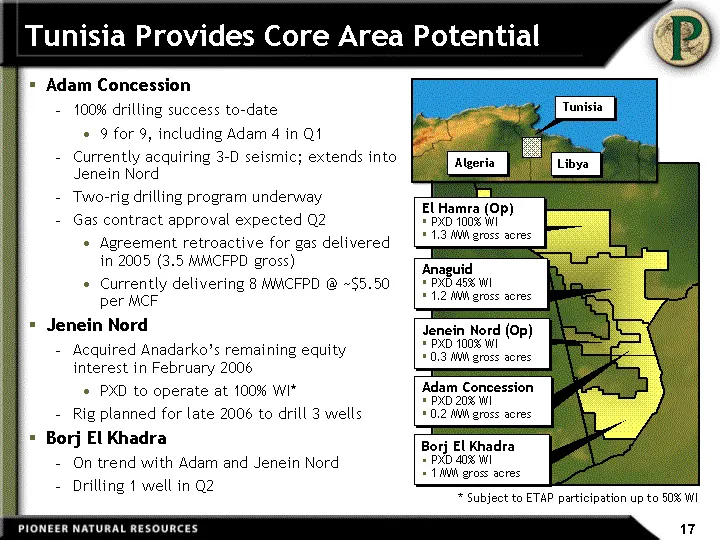
Tunisia Provides Core Area Potential Adam Concession 100% drilling success to-date 9 for 9, including Adam 4 in Q1 Currently acquiring 3-D seismic; extends into Jenein Nord Two-rig drilling program underway Gas contract approval expected Q2 Agreement retroactive for gas delivered in 2005 (3.5 MMCFPD
Slide 19: South Coast Gas Project Progressing
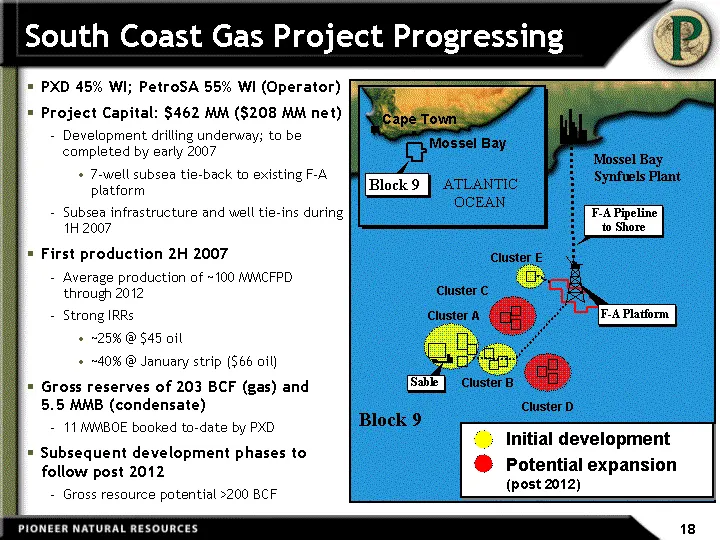
South Coast Gas Project Progressing Mossel Bay Synfuels Plant F-A Pipeline to Shore Sable F-A Platform ATLANTIC OCEAN Cape Town Mossel Bay Block 9 Cluster A Cluster B Cluster E Cluster D Cluster C Initial development Potential expansion (post 2012) Block 9 PXD 45% WI; PetroSA 55% WI (Operator) Proje
Slide 20: Significant Growth Opportunities in West Africa
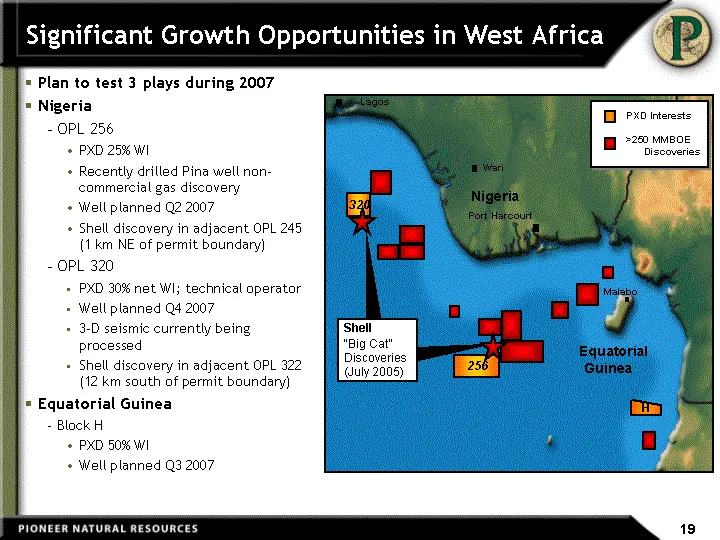
Significant Growth Opportunities in West Africa Nigeria Malabo Lagos Port Harcourt Wari 320 Equatorial Guinea 256 H PXD Interests >250 MMBOE Discoveries Shell "Big Cat" Discoveries (July 2005) Plan to test 3 plays during 2007 Nigeria OPL 256 PXD 25% WI Recently drilled Pina well non- commercial gas
Slide 21: Corporate Goals (2006 - 2010)
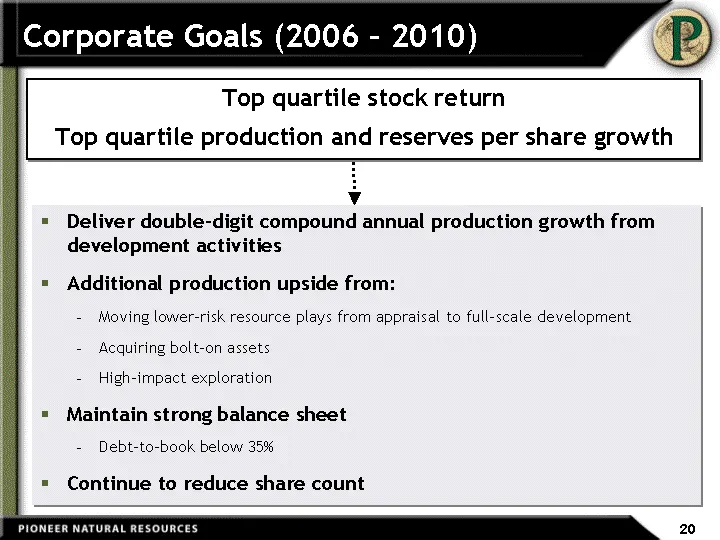
Corporate Goals (2006 - 2010) Top quartile stock return Top quartile production and reserves per share growth Deliver double-digit compound annual production growth from development activities Additional production upside from: Moving lower-risk resource plays from appraisal to full-scale developmen
Slide 22: Appendix
PIONEER NATURAL RESOURCES Appendix 21
Slide 23: Key Pricing Assumption
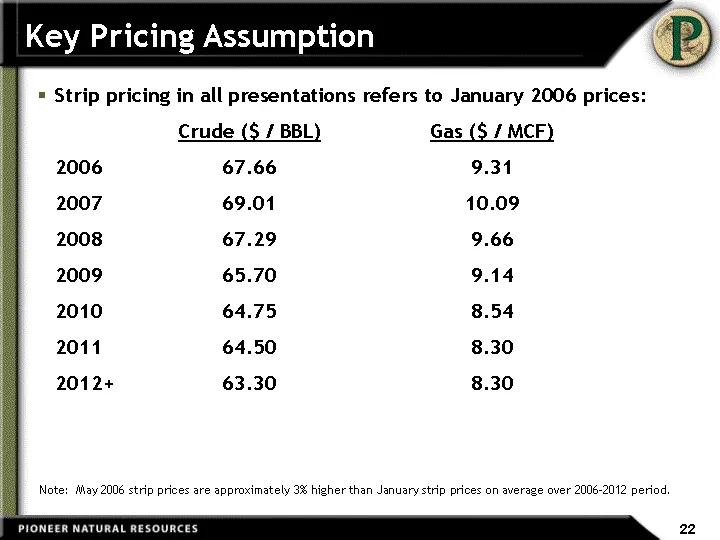
Key Pricing Assumption Strip pricing in all presentations refers to January 2006 prices: Crude ($ / BBL) Gas ($ / MCF) 2006 67.66 9.31 2007 69.01 10.09 2008 67.29 9.66 2009 65.70 9.14 2010 64.75 8.54 2011 64.50 8.30 2012+ 63.30 8.30 Note: May 2006 strip prices are approximately 3% higher than Januar
Slide 24: Successful Argentina Divestiture
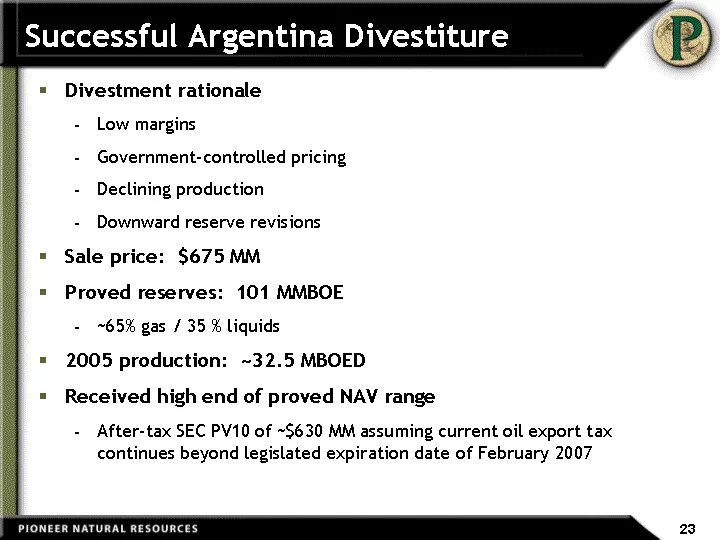
Successful Argentina Divestiture Divestment rationale Low margins Government-controlled pricing Declining production Downward reserve revisions Sale price: $675 MM Proved reserves: 101 MMBOE ~65% gas / 35 % liquids 2005 production: ~32.5 MBOED Received high end of proved NAV range After-tax SEC PV10
Slide 25: Successful Deepwater GOM Divestiture
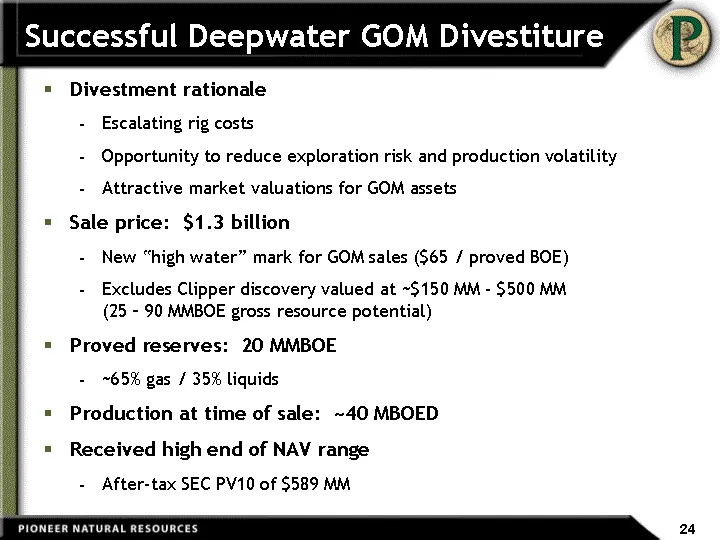
Successful Deepwater GOM Divestiture Divestment rationale Escalating rig costs Opportunity to reduce exploration risk and production volatility Attractive market valuations for GOM assets Sale price: $1.3 billion New "high water" mark for GOM sales ($65 / proved BOE) Excludes Clipper discovery value
Slide 26: NAV Update
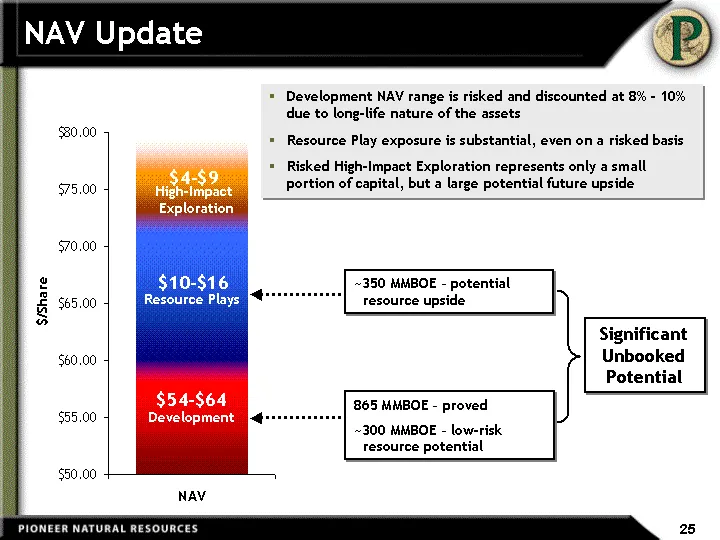
NAV Update NAV 2P 58 Transition 2 Resource Plays 11 Transition 2 Traditional Exploration 3.5 Transition 3 Development NAV range is risked and discounted at 8% - 10% due to long-life nature of the assets Resource Play exposure is substantial, even on a risked basis Risked High-Impact Exploration repr
Slide 27: Capital Allocation and Returns
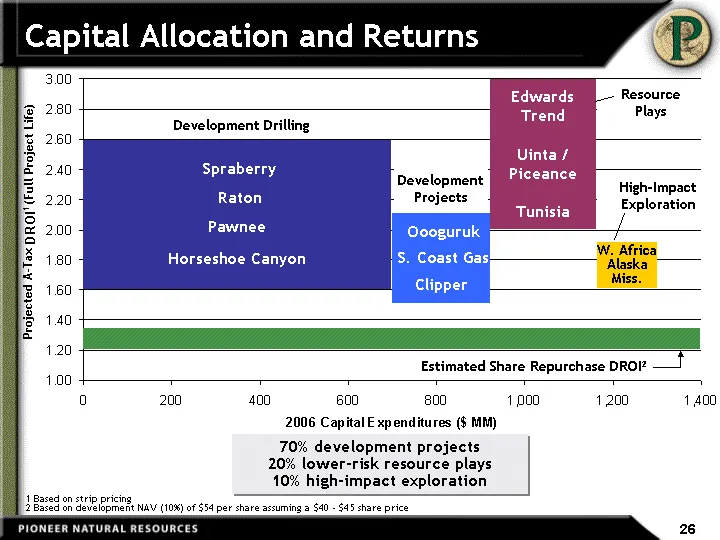
70% development projects 20% lower-risk resource plays 10% high-impact exploration Capital Allocation and Returns Spraberry Raton Pawnee Horseshoe Canyon Oooguruk S. Coast Gas Clipper Edwards Trend Uinta / Piceance Tunisia W. Africa Alaska Miss. Development Drilling Development Projects Resource Pla
Slide 28: Continuing to Accelerate Low-Risk Drilling
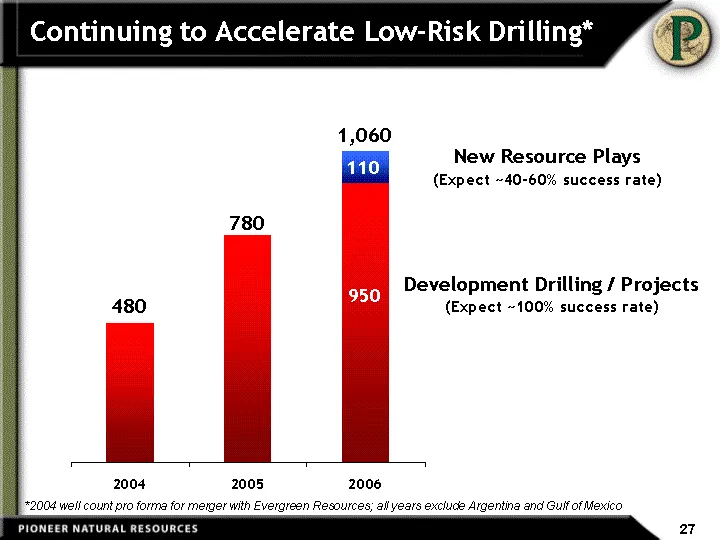
Continuing to Accelerate Low-Risk Drilling* 2004 2005 2006 110 1,060 *2004 well count pro forma for merger with Evergreen Resources; all years exclude Argentina and Gulf of Mexico 950 Development Drilling / Projects (Expect ~100% success rate) New Resource Plays (Expect ~40-60% success rate) 150 110
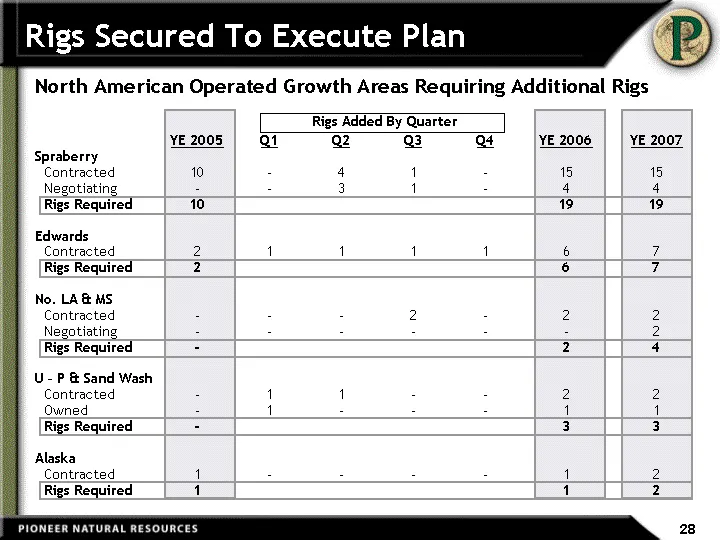
Slide 29: Rigs Secured To Execute Plan
Rigs Secured To Execute Plan Rigs Added By Quarter North American Operated Growth Areas Requiring Additional Rigs YE 2005 Q1 Q2 Q3 Q4 YE 2006 YE 2007 Spraberry Contracted 10 - 4 1 - 15 15 Negotiating - - 3 1 - 4 4 Rigs Required 10 19 19 Edwards Contracted 2 1 1 1 1 6 7 Rigs Required 2 6 7 No. LA & M
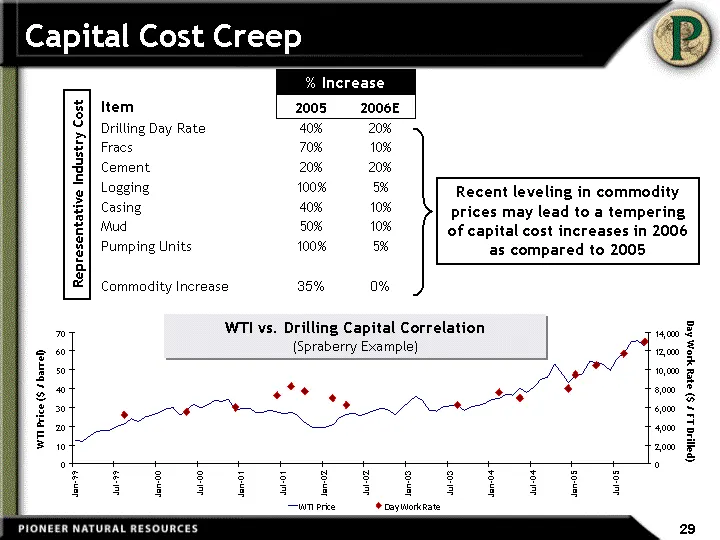
Slide 30: Capital Cost Creep
Capital Cost Creep % Increase % Increase Item 2005 2006E Drilling Day Rate 40% 20% Fracs 70% 10% Cement 20% 20% Logging 100% 5% Casing 40% 10% Mud 50% 10% Pumping Units 100% 5% Commodity Increase 35% 0% Representative Industry Cost Recent leveling in commodity prices may lead to a tempering of capit
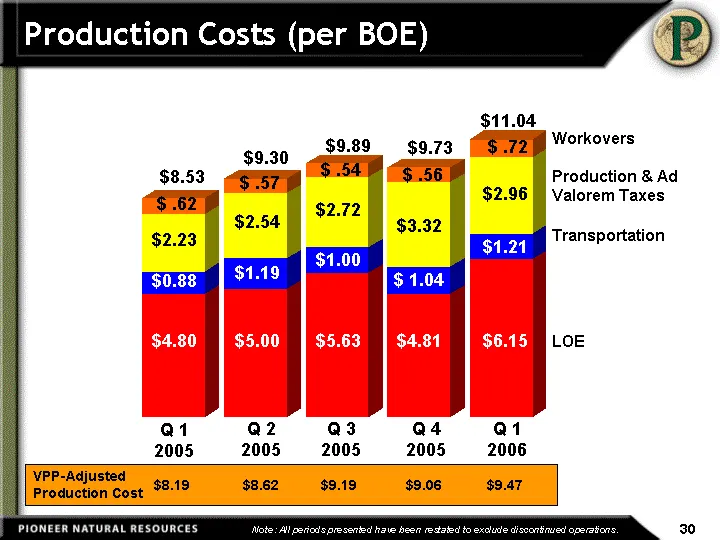
Slide 31: Spraberry operating cost history
Q1 Q2 Q3 Q1 2000 Q2 2000 Q3 2000 Q4 2000 Q1 01 Q2 2001 Q3 01 Q4 01 Q1 02 Q2 02 Q3 02 Q4 02 Q1 03 Q2 03 Q3 03 Q4 03 Q1 04 Q2 04 Q3 04 Q4 04 Q1 05 Q2 05 Q3 05 Q4 05 Q1 06 LOE 2.99 2.42 2.47 2.18 2.05 2.2 2.33 2.36 2.58 2.89 3.19 3.29 2.88 2.63 2.68 3.02 3.3 3.29 3.44 3.43 3.71 3.81 4.22 4.8 5 5.63 4.8
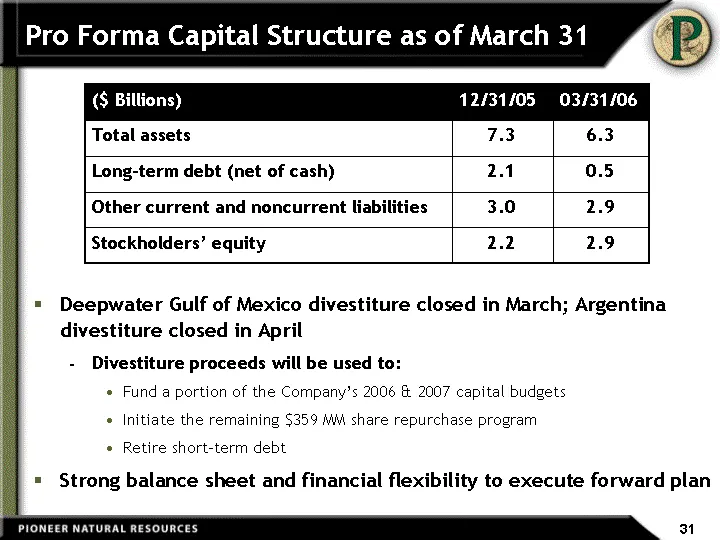
Slide 32: Pro Forma Capital Structure as of March
Pro Forma Capital Structure as of March 31 Deepwater Gulf of Mexico divestiture closed in March; Argentina divestiture closed in April Divestiture proceeds will be used to: Fund a portion of the Company's 2006 & 2007 capital budgets Initiate the remaining $359 MM share repurchase program Retire shor
Slide 33: Pro Forma Senior Notes and Credit Facility Maturities
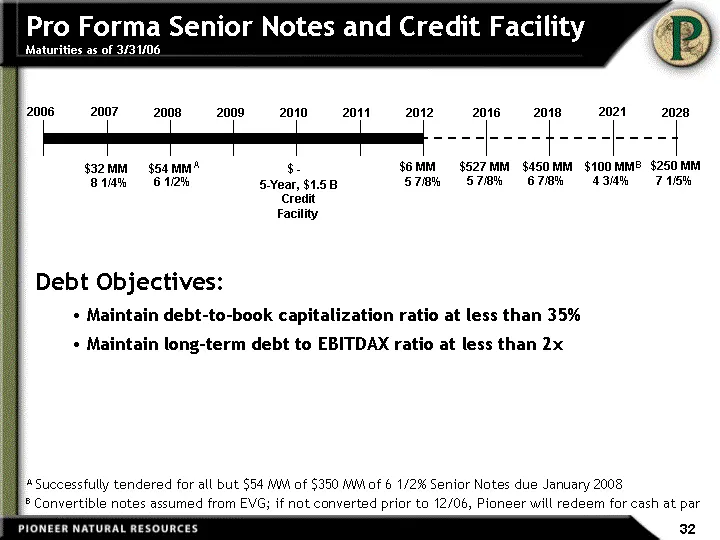
Pro Forma Senior Notes and Credit Facility Maturities as of 3/31/06 B Convertible notes assumed from EVG; if not converted prior to 12/06, Pioneer will redeem for cash at par 2006 2007 2008 2009 2010 2011 2012 2028 $32 MM 8 1/4% $6 MM 5 7/8% $250 MM 7 1/5% 2016 $527 MM 5 7/8% 2021 $100 MM 4 3/4% B 2
Slide 34: Remaining Hedge Positions as of 5/8/06
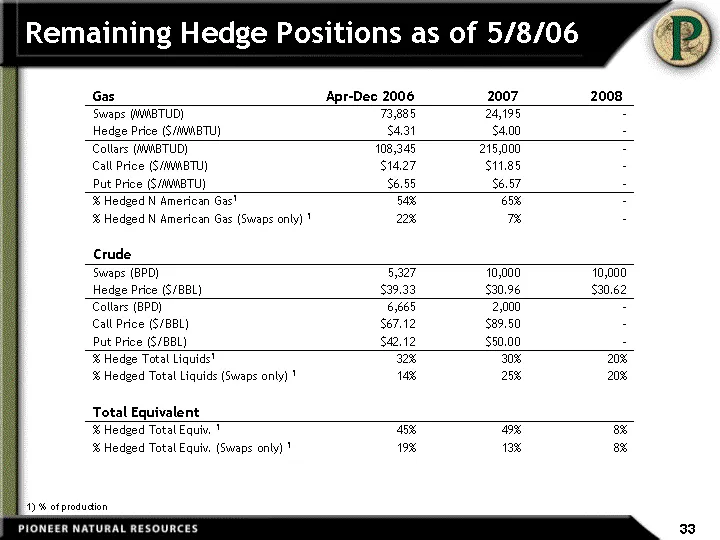
Remaining Hedge Positions as of 5/8/06 1) % of production Gas Apr-Dec 2006 2007 2008 Swaps (MMBTUD) 73,885 24,195 - Hedge Price ($/MMBTU) $4.31 $4.00 - Collars (MMBTUD) 108,345 215,000 - Call Price ($/MMBTU) $14.27 $11.85 - Put Price ($/MMBTU) $6.55 $6.57 - % Hedged N American Gas1 54% 65% - % Hedge
Slide 35: Certain Reserve Information
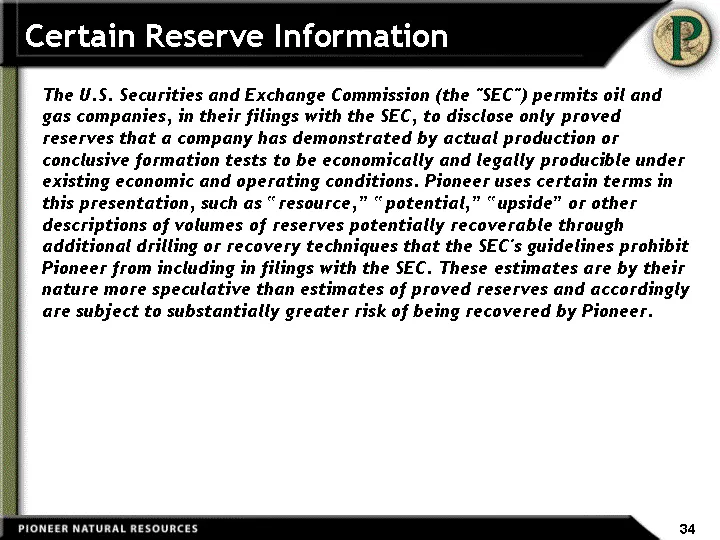
Certain Reserve Information The U.S. Securities and Exchange Commission (the "SEC") permits oil and gas companies, in their filings with the SEC, to disclose only proved reserves that a company has demonstrated by actual production or conclusive formation tests to be economically and legally produci
Slide 36: Net Asset Value Disclosure
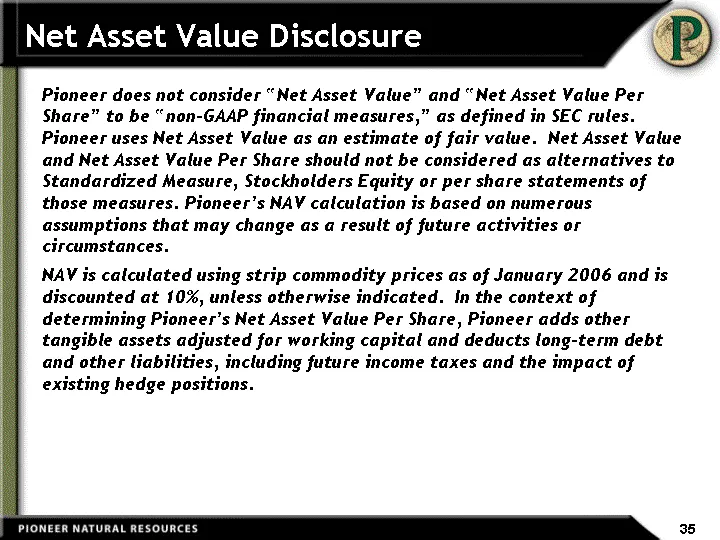
Net Asset Value Disclosure Pioneer does not consider "Net Asset Value" and "Net Asset Value Per Share" to be "non-GAAP financial measures," as defined in SEC rules. Pioneer uses Net Asset Value as an estimate of fair value. Net Asset Value and Net Asset Value Per Share should not be considered as al
Source: SEC EDGAR · 8-K filed May 16, 2006
More decks from Pioneer Natural Resources Co
 Merger or Acquisition (October 2023)15 slides · Oct 11, 2023
 Q3 2020 Earnings Presentation30 slides · Nov 4, 2020
 Merger or Acquisition (October 2020)18 slides · Oct 20, 2020
 IPAA Oil & Gas Investment Symposium 201846 slides · Apr 9, 2018
 Investor Presentation (January 2014)80 slides · Jan 6, 2014
 Q4 2012 Earnings Presentation48 slides · Feb 13, 2013