Pioneer Natural Resources — Investor Presentation (January 2014)
80 slides from Pioneer Natural Resources's investor presentation, Jan 6, 2014

Slide 1: Investor Presentation January 2014
Exhibit 99.1 Investor Presentation January 2014

Slide 2: Forward-Looking Statements
Forward-Looking Statements Except for historical information contained herein, the statements, charts and graphs in this presentation are forward-looking statements that are made pursuant to the Safe Harbor Provisions of the Private Securities Litigation Reform Act of 1995. Forward-looking statement
Slide 3: Pioneer At A Glance
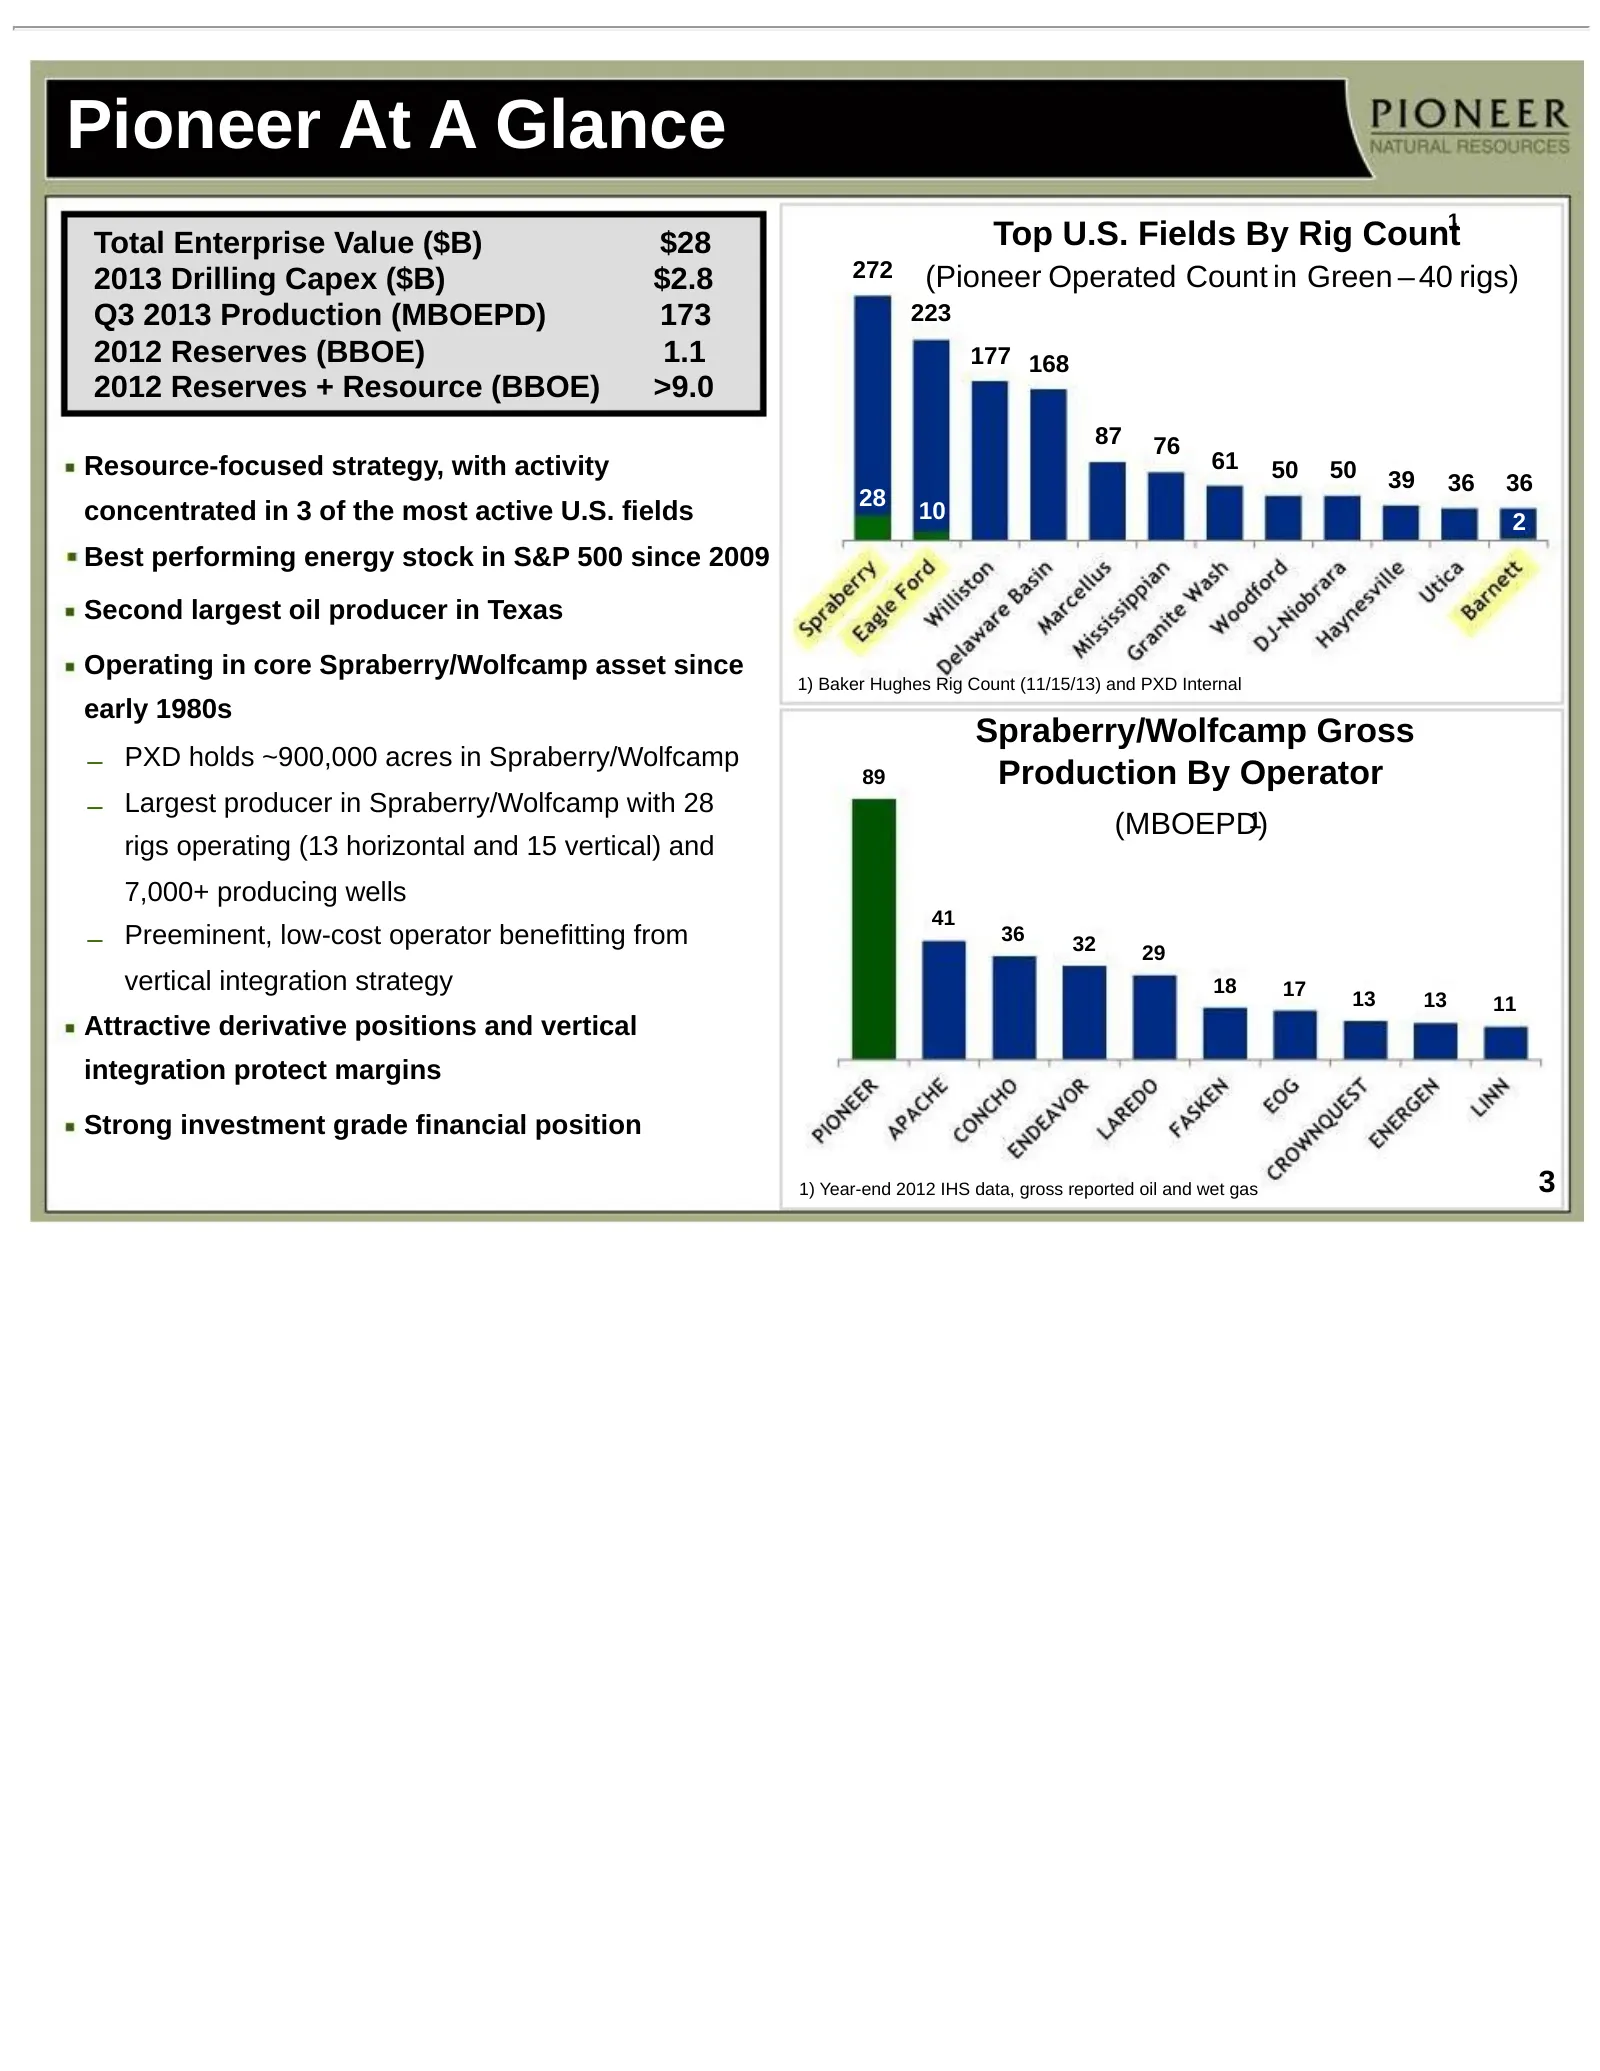
Pioneer At A Glance 1 Total Enterprise Value ($B) $28 Top U.S. Fields By Rig Count 2013 Drilling Capex ($B) $2.8 272 (Pioneer Operated Count in Green – 40 rigs) Q3 2013 Production (MBOEPD) 173 223 2012 Reserves (BBOE) 1.1 177 168 2012 Reserves + Resource (BBOE) >9.0 87 76 Resource-focused strategy,
Slide 4: 2013E Capital Spending and Cash Flow
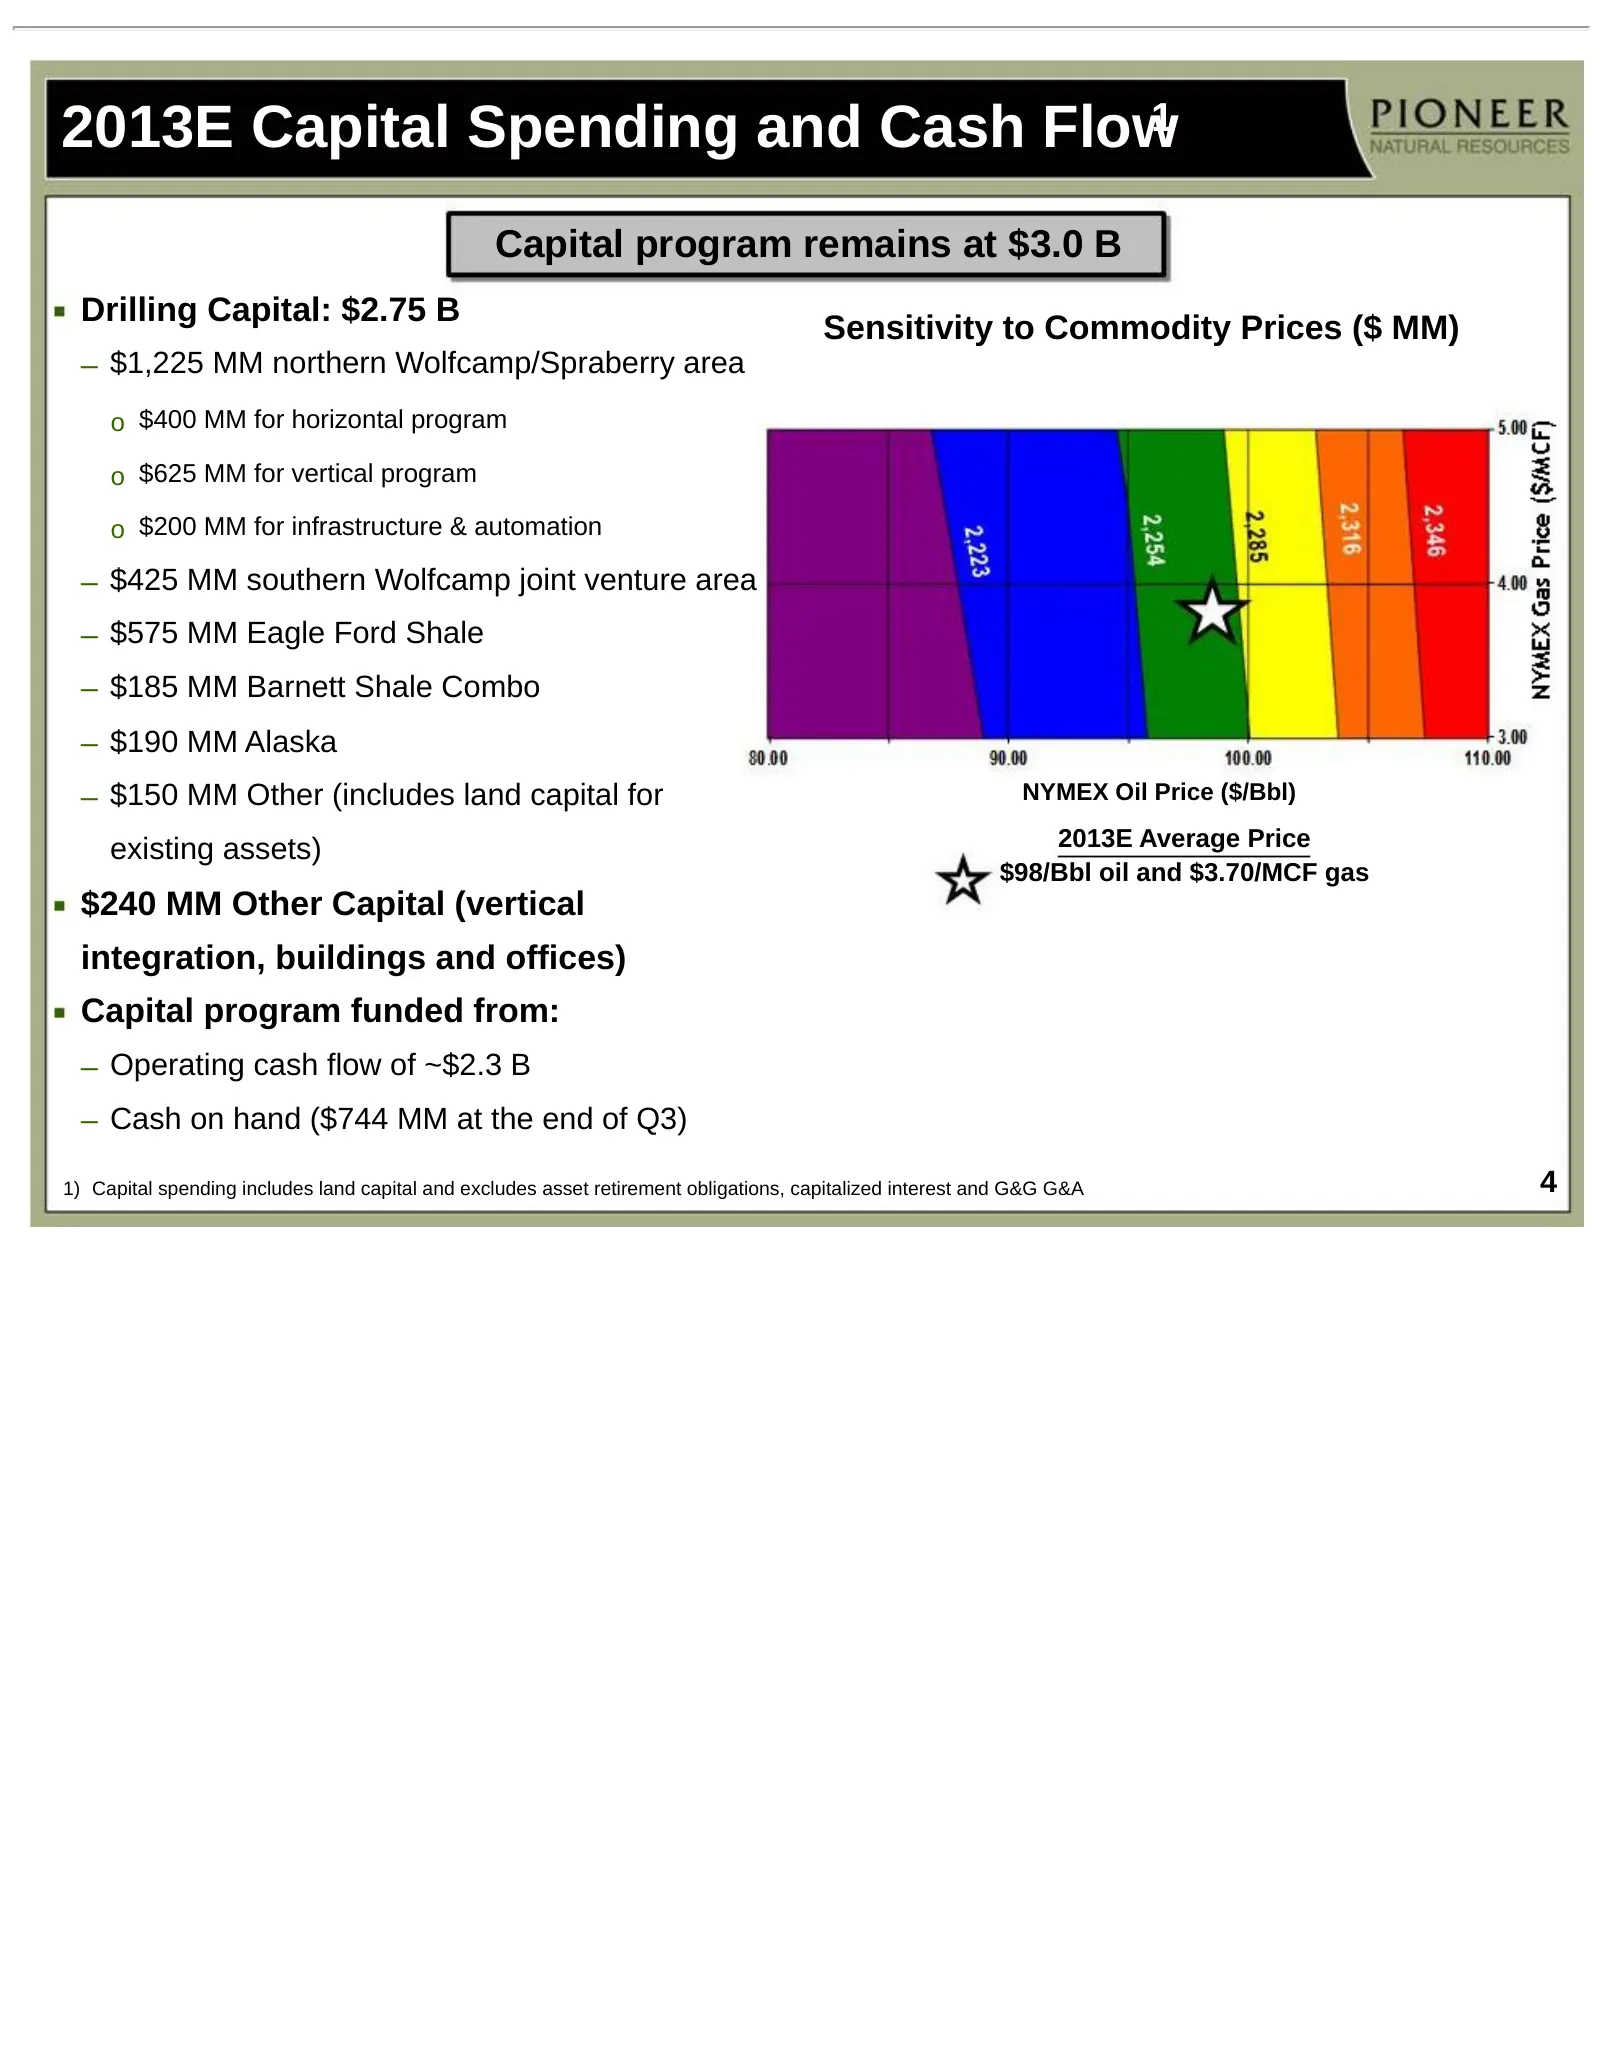
2013E Capital Spending and Cash Flow1 Capital program remains at $3.0 B Drilling Capital: $2.75 B Sensitivity to Commodity Prices ($ MM) – $1,225 MM northern Wolfcamp/Spraberry area o $400 MM for horizontal program o $625 MM for vertical program o $200 MM for infrastructure & automation – $425 MM so
Slide 5: Pioneer Focusing Capex in Highest Margin Assets
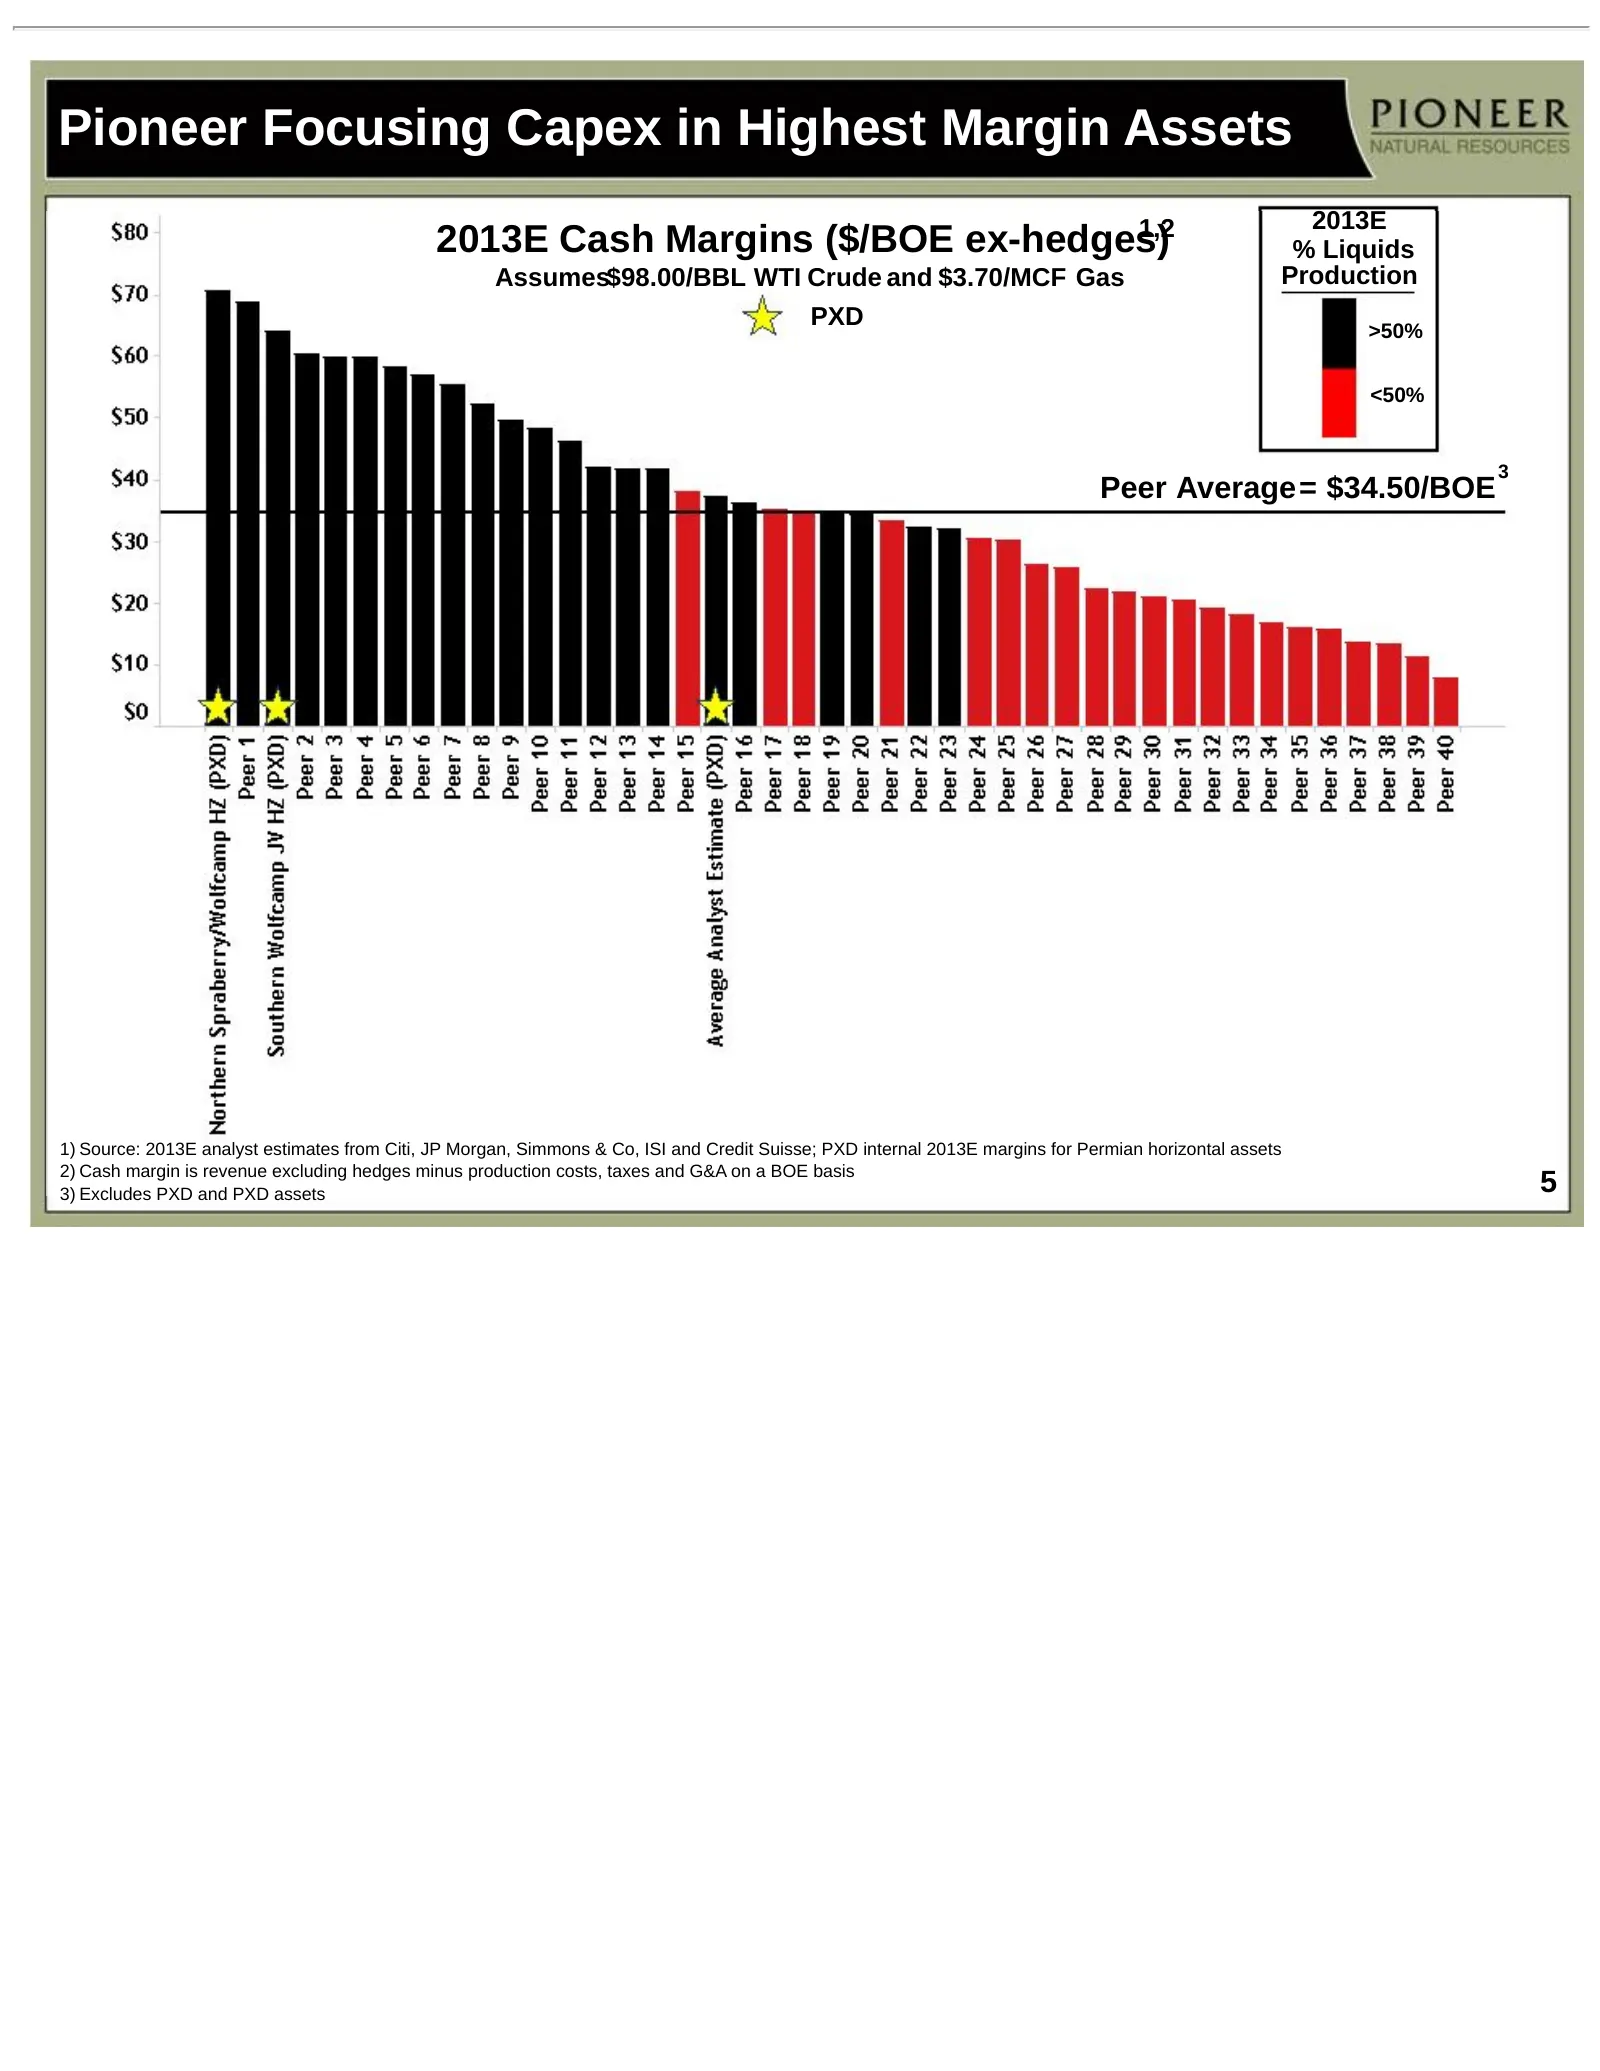
Pioneer Focusing Capex in Highest Margin Assets 1,2 2013E 2013E Cash Margins ($/BOE ex-hedges) % Liquids Assumes$98.00/BBL WTI Crude and $3.70/MCF Gas Production PXD >50% <50% 3 Peer Average= $34.50/BOE 1) Source: 2013E analyst estimates from Citi, JP Morgan, Simmons & Co, ISI and Credit Suisse; PXD
Slide 6: Production Outlook
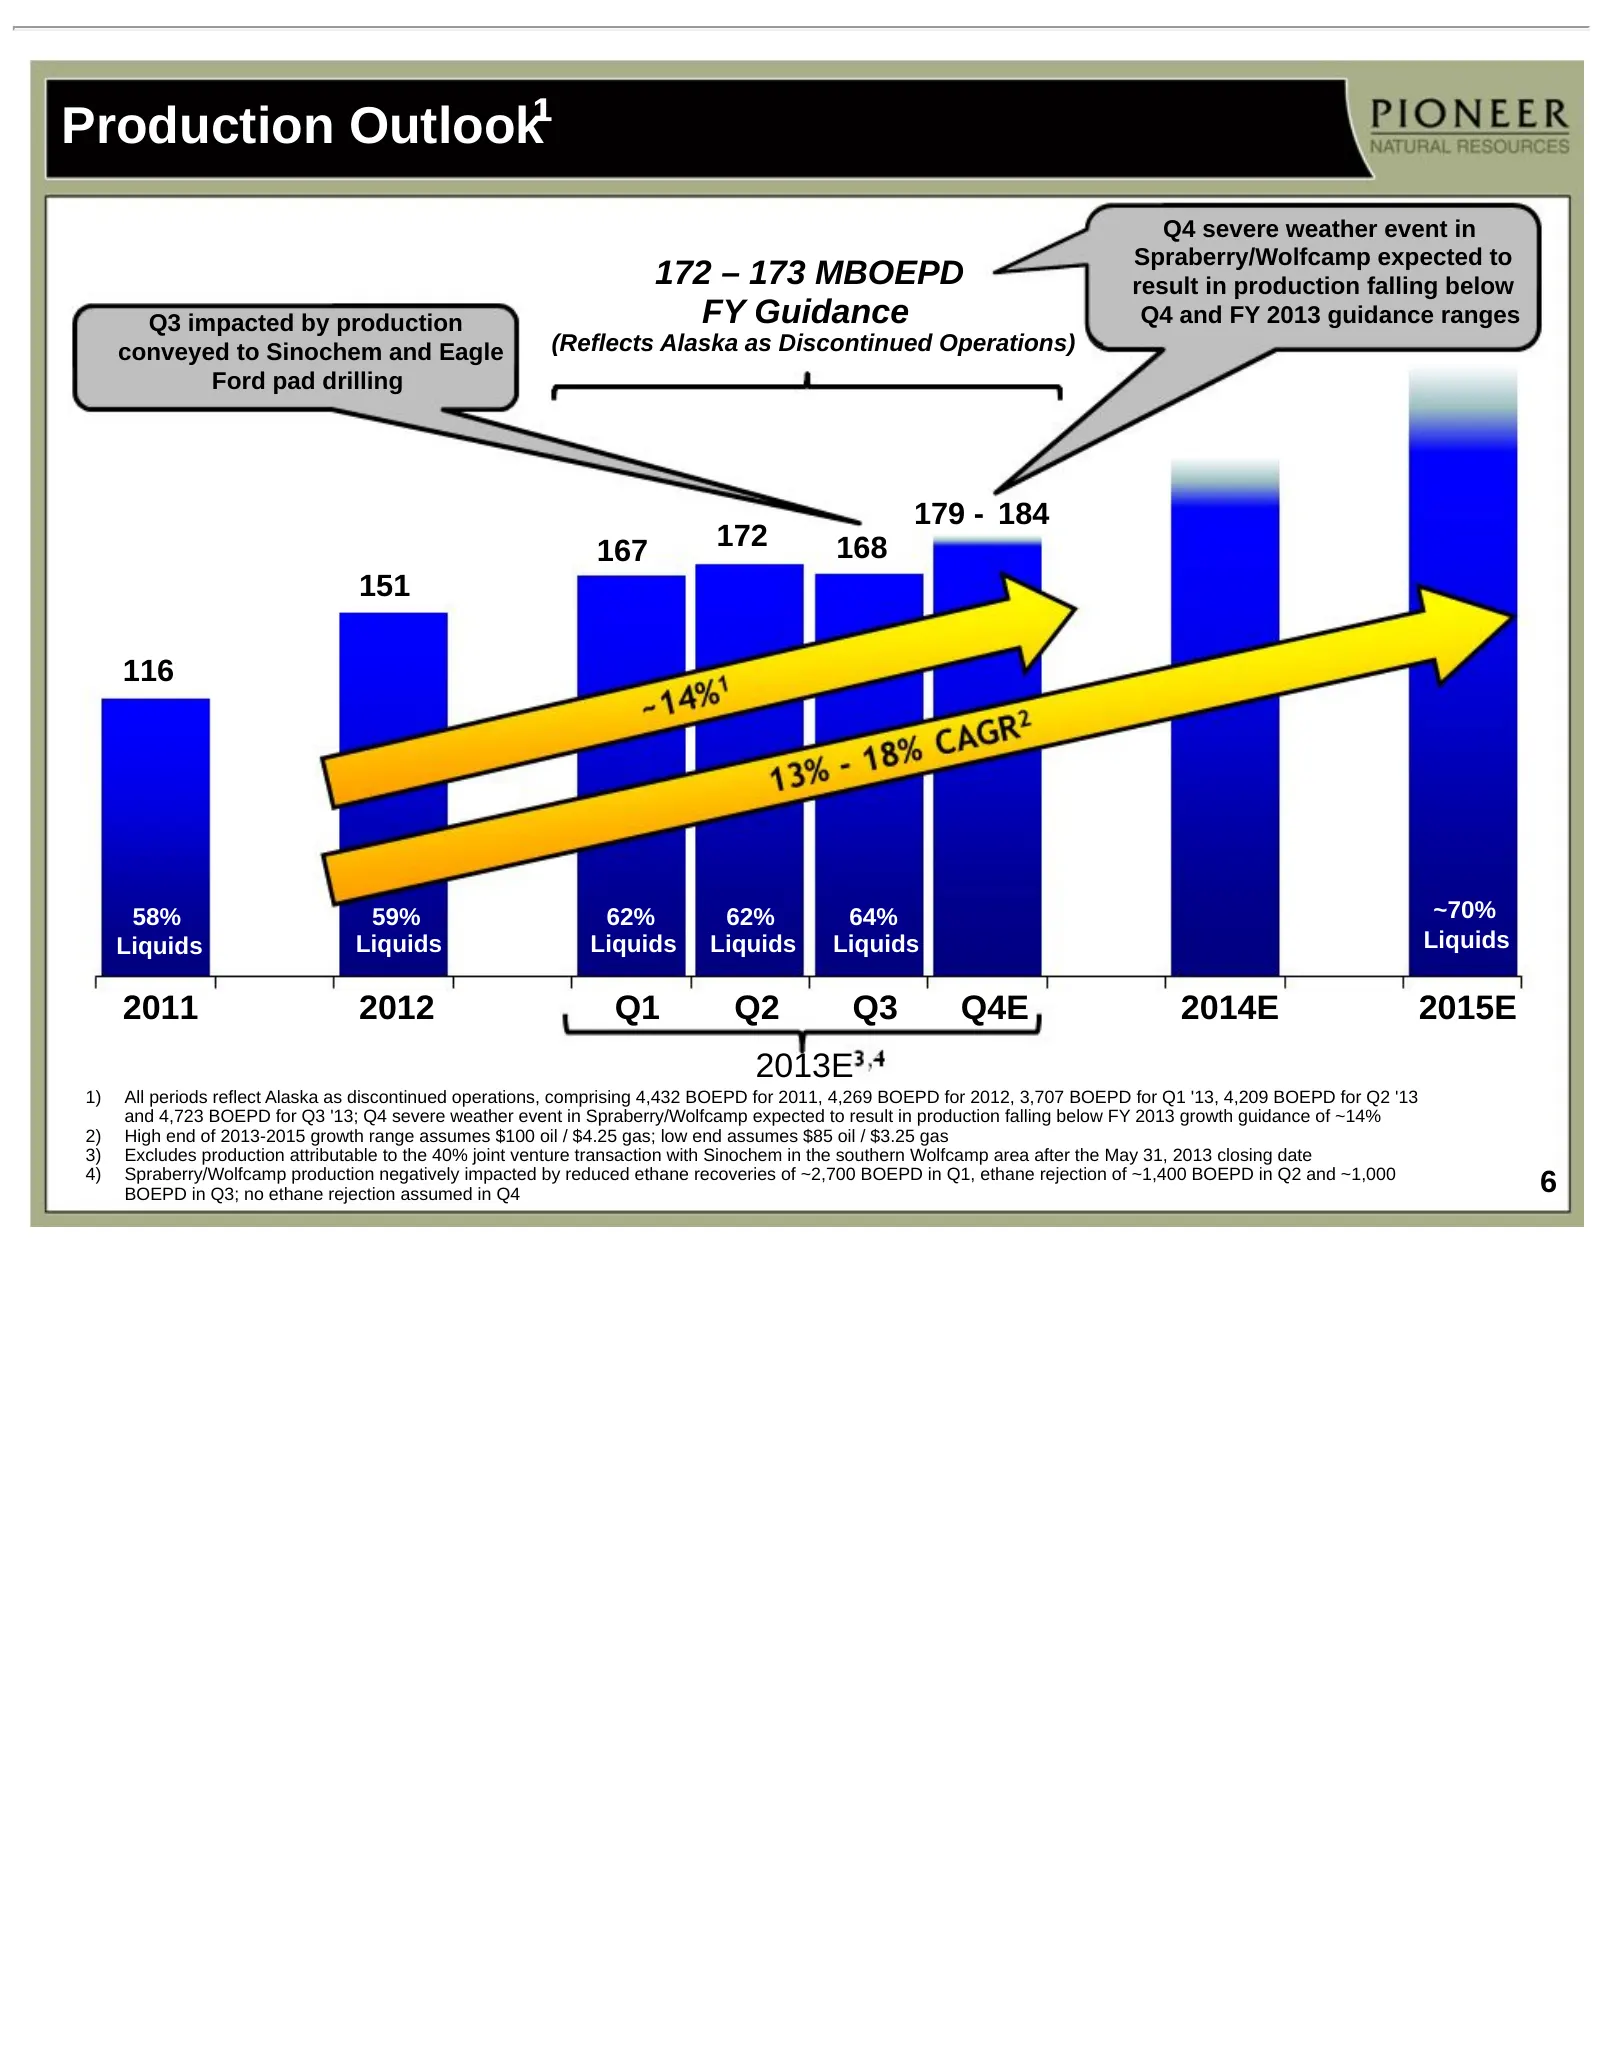
Production Outlook¹ Q4 severe weather event in Spraberry/Wolfcamp expected to 172 – 173 MBOEPD result in production falling below Q3 impacted by production FY Guidance Q4 and FY 2013 guidance ranges conveyed to Sinochem and Eagle (Reflects Alaska as Discontinued Operations) Ford pad drilling 179 - 1
Slide 7: Liquidity Position (09/30/13)
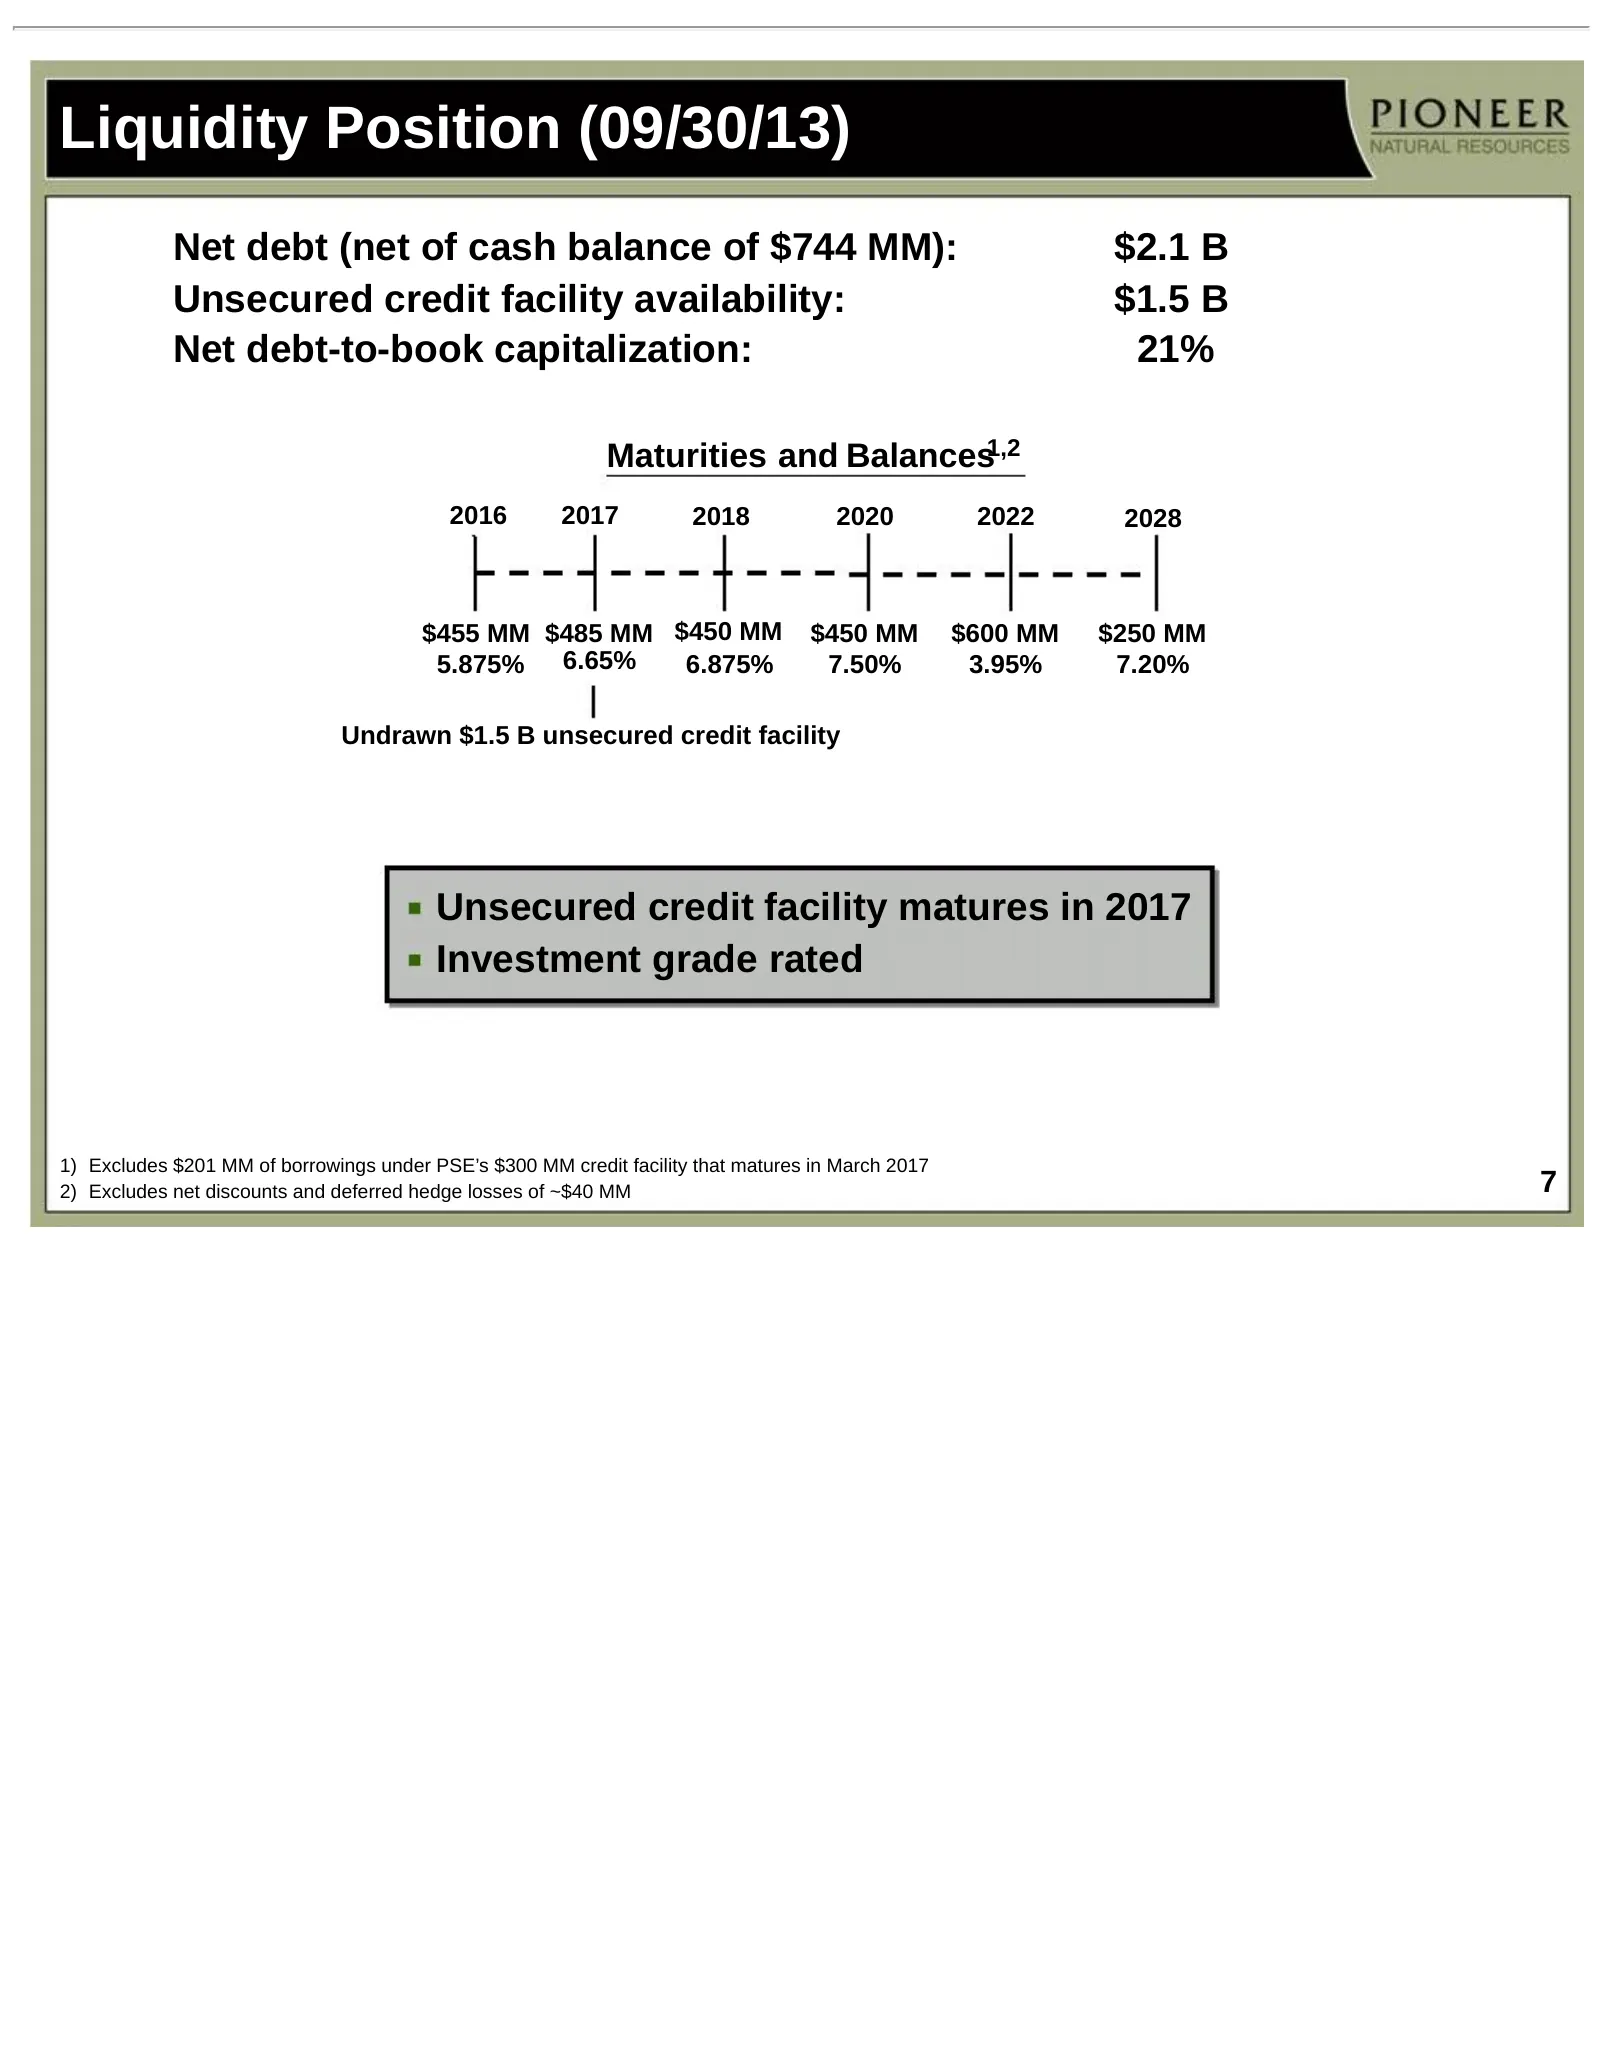
Liquidity Position (09/30/13) Net debt (net of cash balance of $744 MM): $2.1 B Unsecured credit facility availability: $1.5 B Net debt-to-book capitalization: 21% Maturities and Balances1,2 2016 2017 2018 2020 2022 2028 $455 MM $485 MM $450 MM $450 MM $600 MM $250 MM 5.875% 6.65% 6.875% 7.50% 3.95%
Slide 8: Pioneer's Significant Proved Reserves and Recoverable Resource Potential
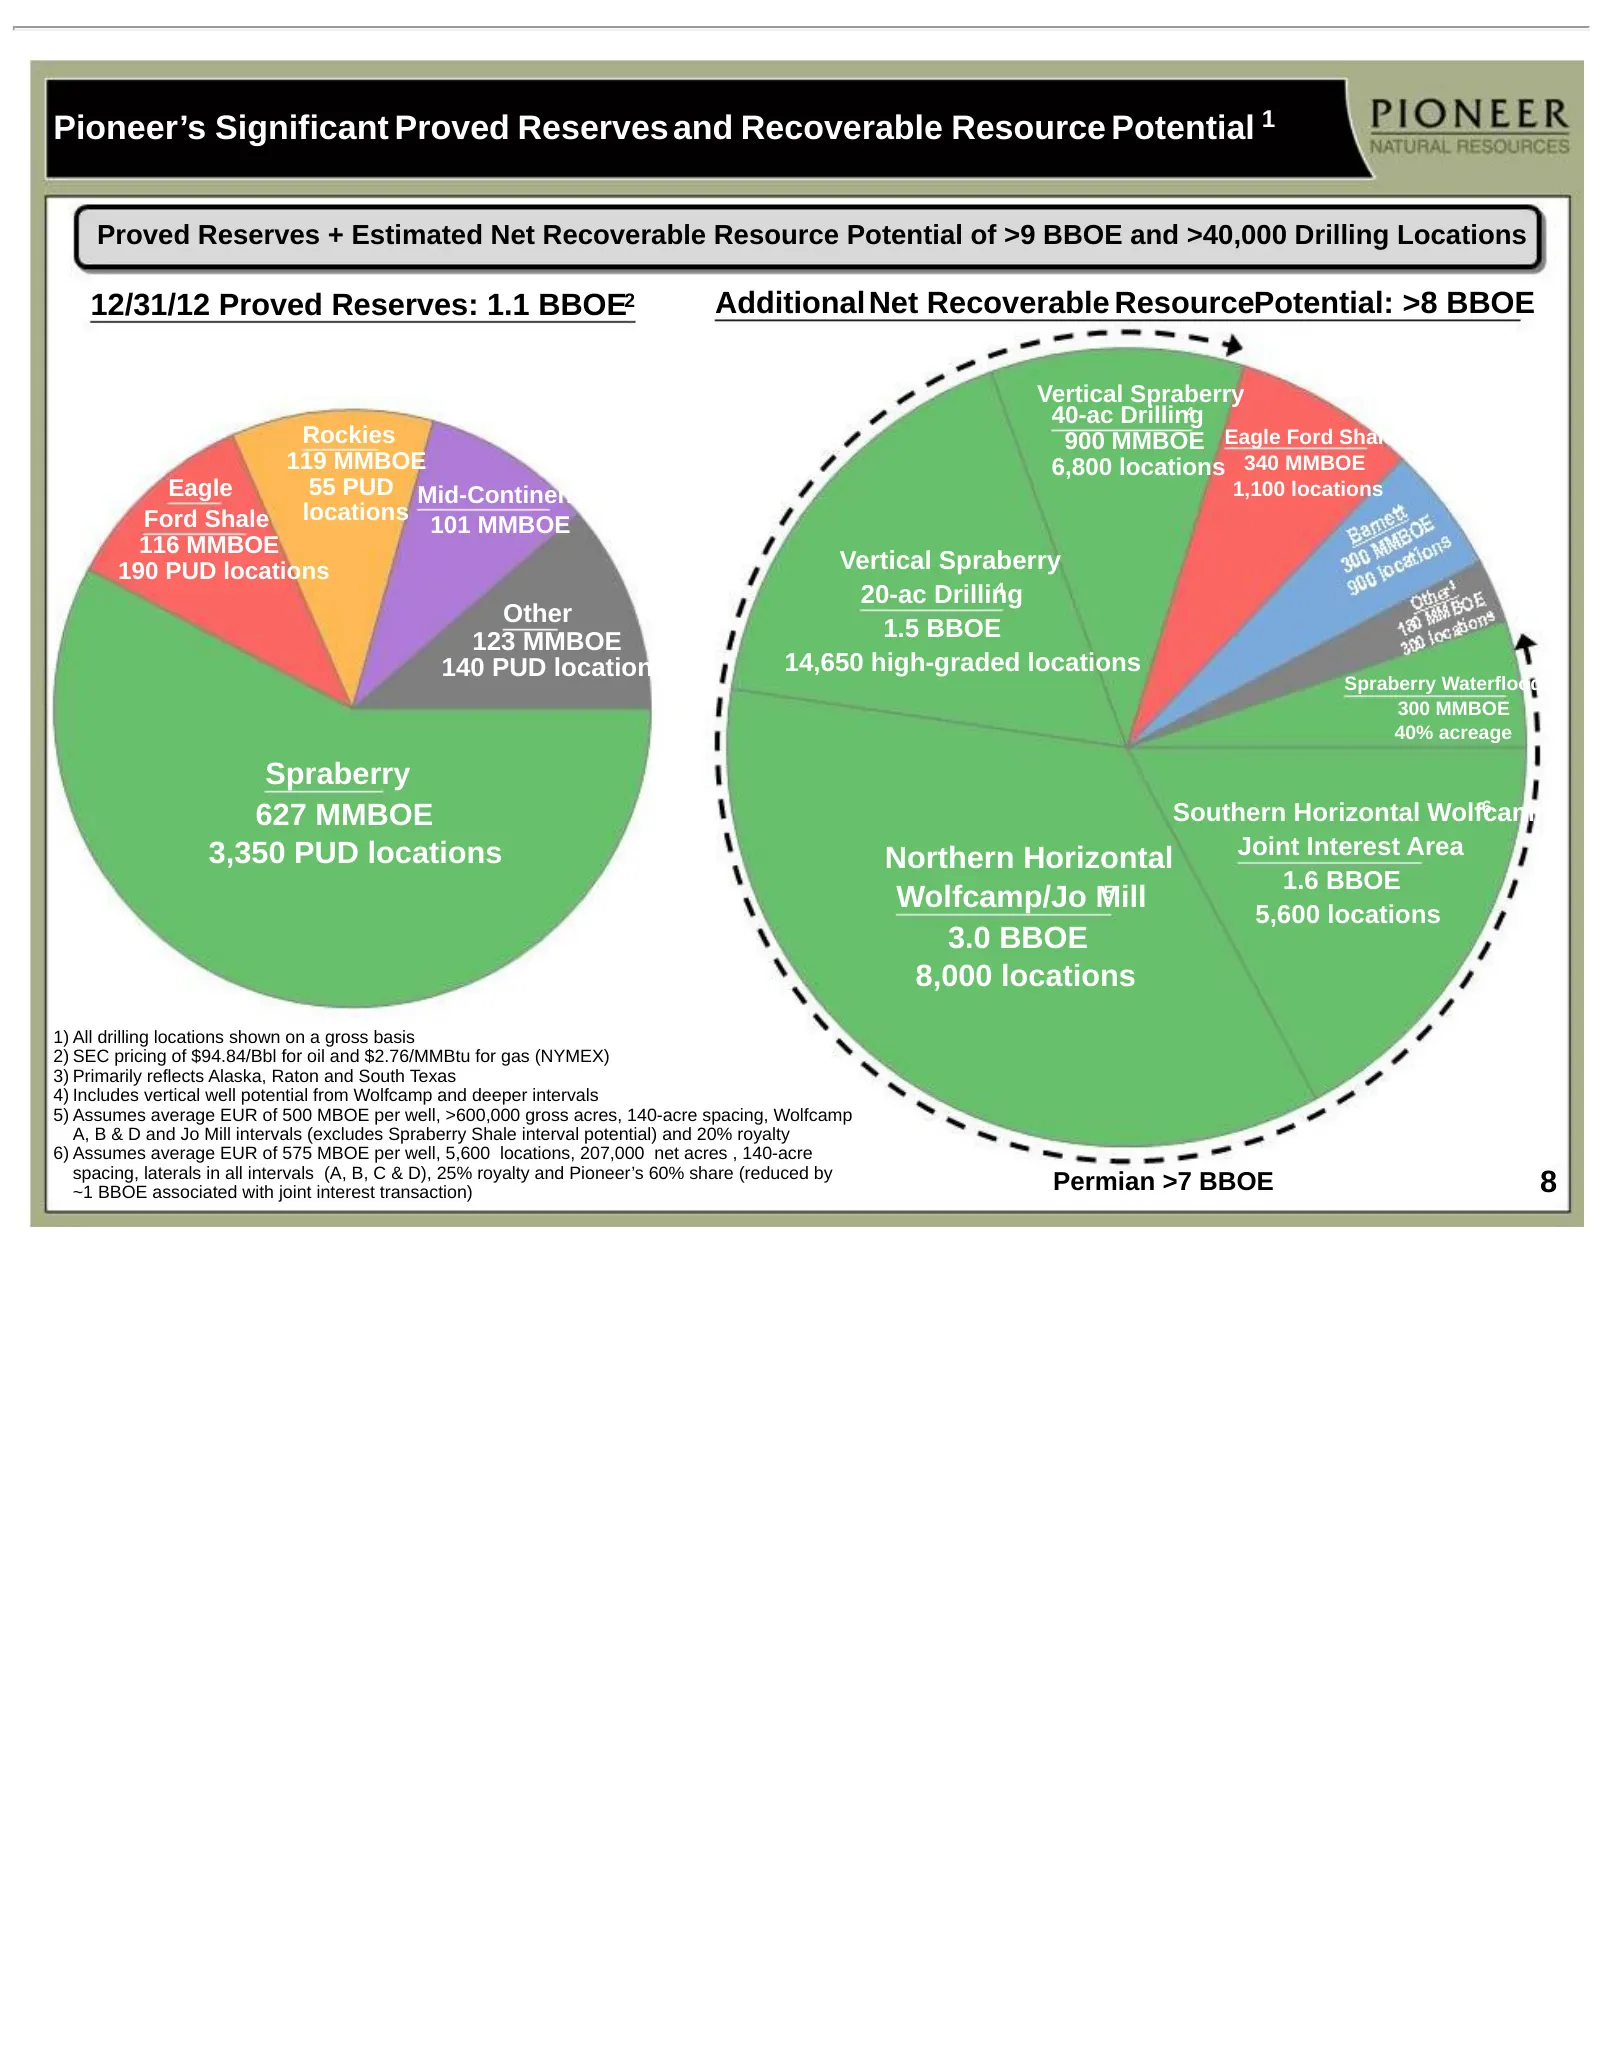
Pioneer’s Significant Proved Reserves and Recoverable Resource Potential 1 Proved Reserves + Estimated Net Recoverable Resource Potential of >9 BBOE and >40,000 Drilling Locations 12/31/12 Proved Reserves: 1.1 BBOE2 Additional Net Recoverable ResourcePotential: >8 BBOE Vertical Spraberry 40-ac Drill
Slide 9: Expect to continue operating 8 horizontal rigs in 2014
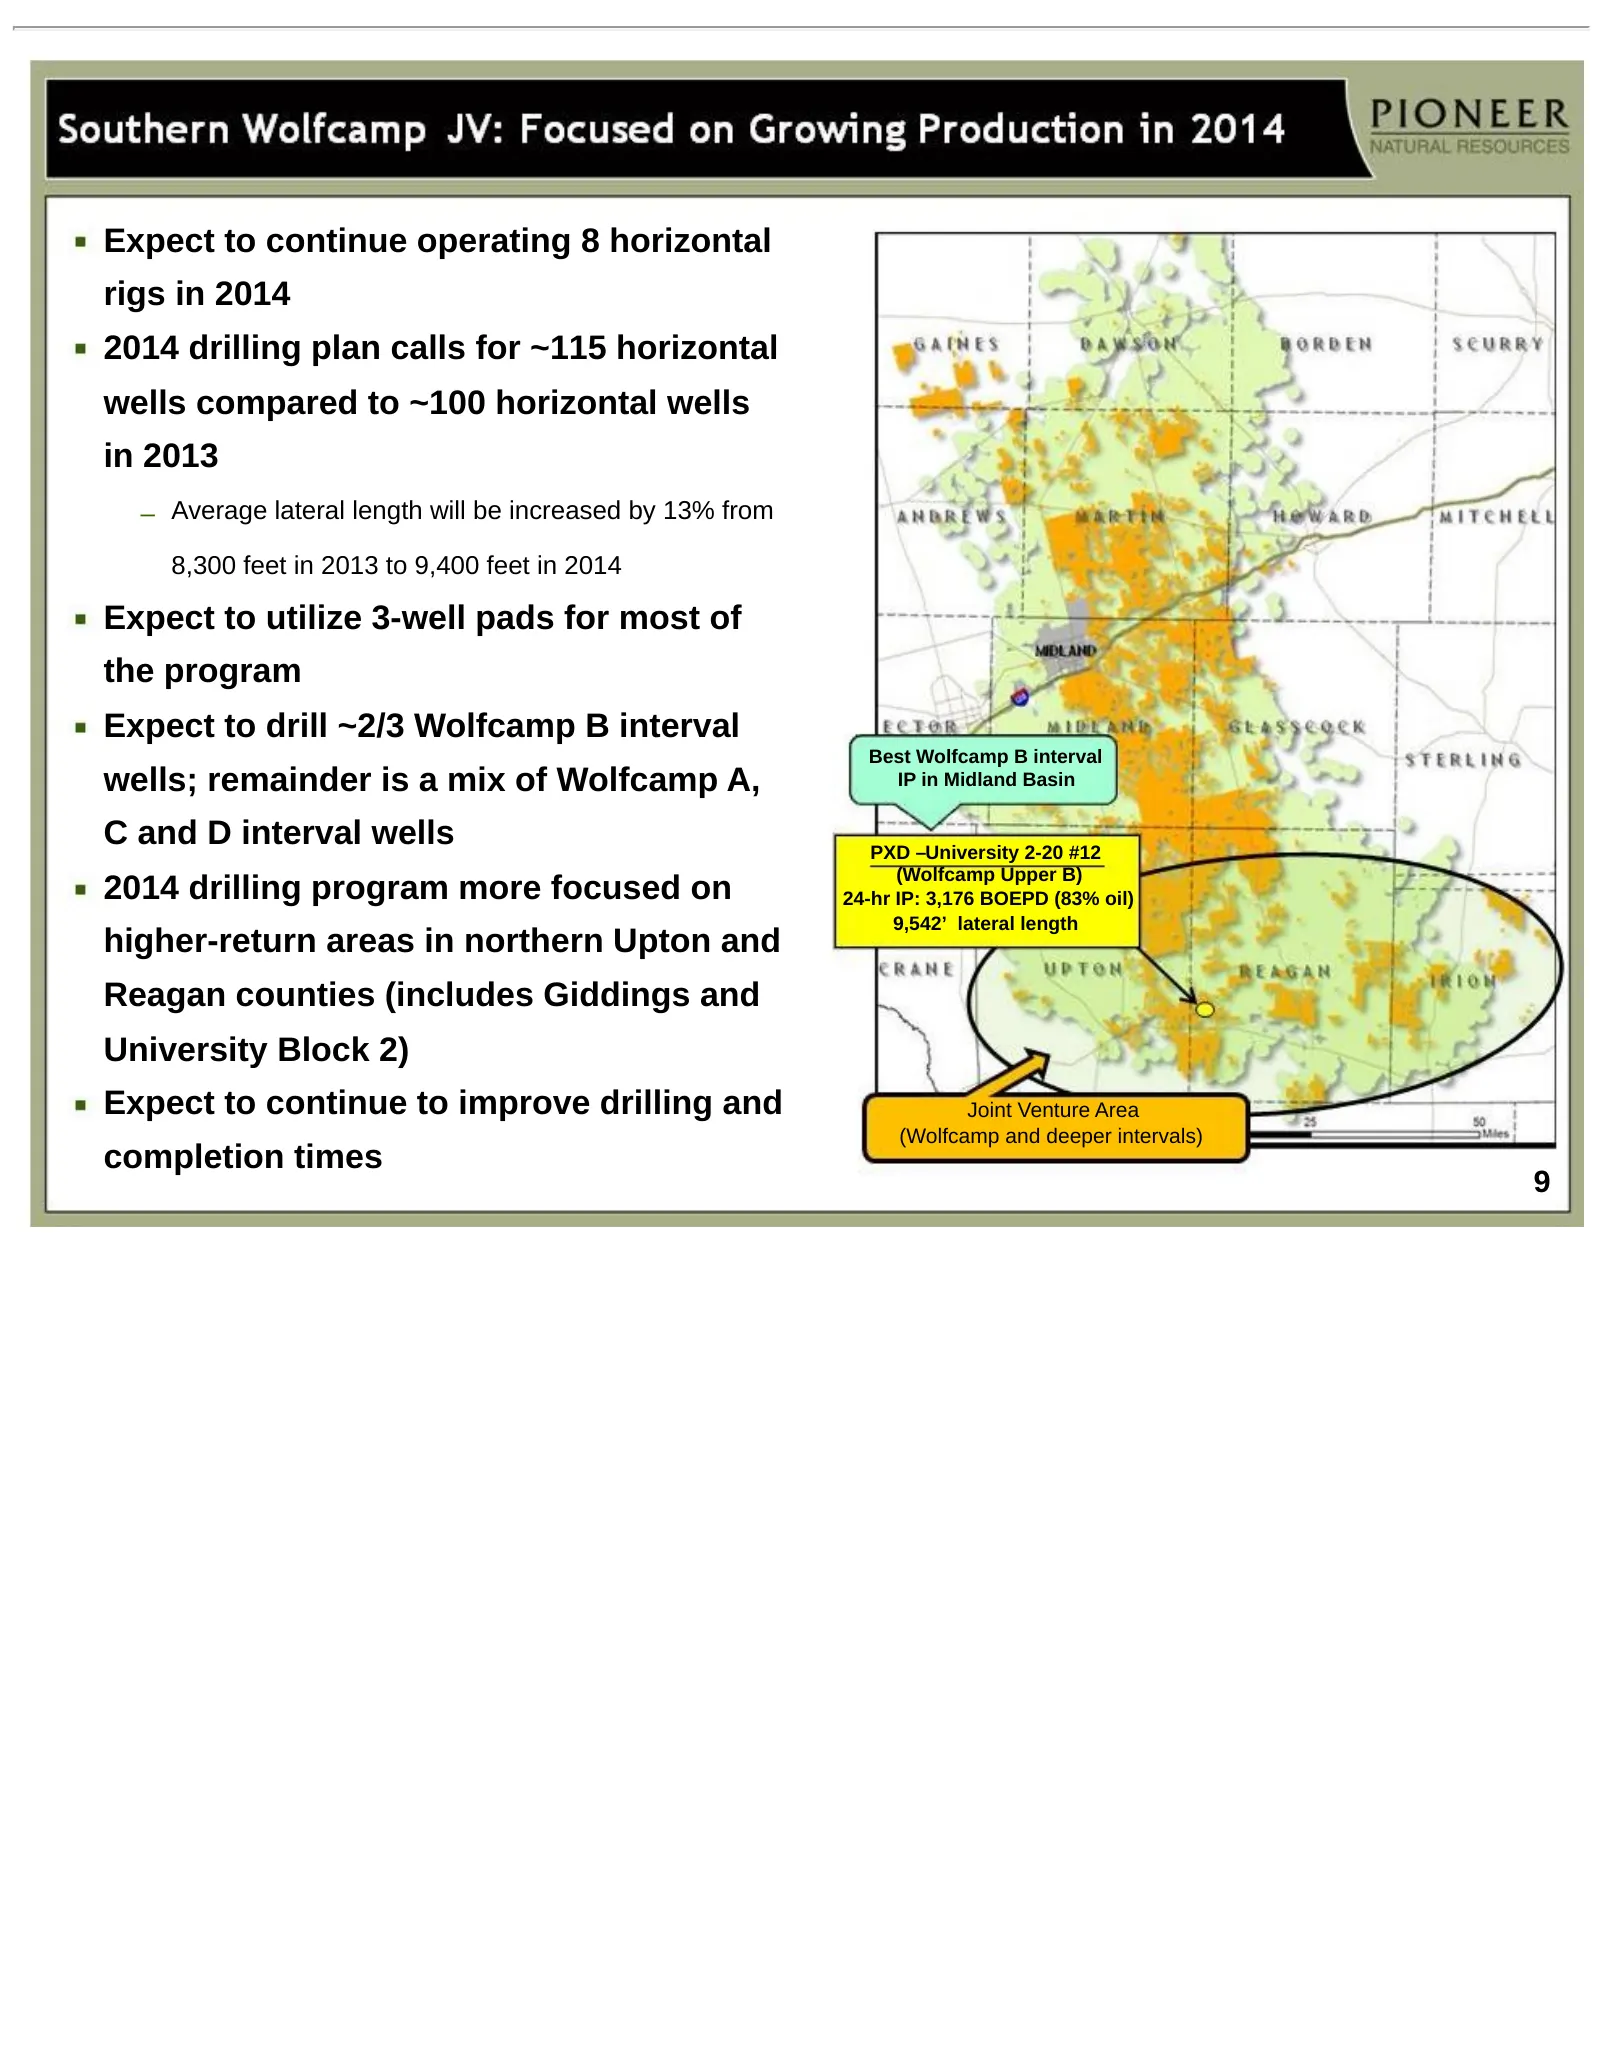
Expect to continue operating 8 horizontal rigs in 2014 2014 drilling plan calls for ~115 horizontal wells compared to ~100 horizontal wells in 2013 – Average lateral length will be increased by 13% from 8,300 feet in 2013 to 9,400 feet in 2014 Expect to utilize 3-well pads for most of the program Ex
Slide 10: Downspacing Test Underway in Southern JV Area
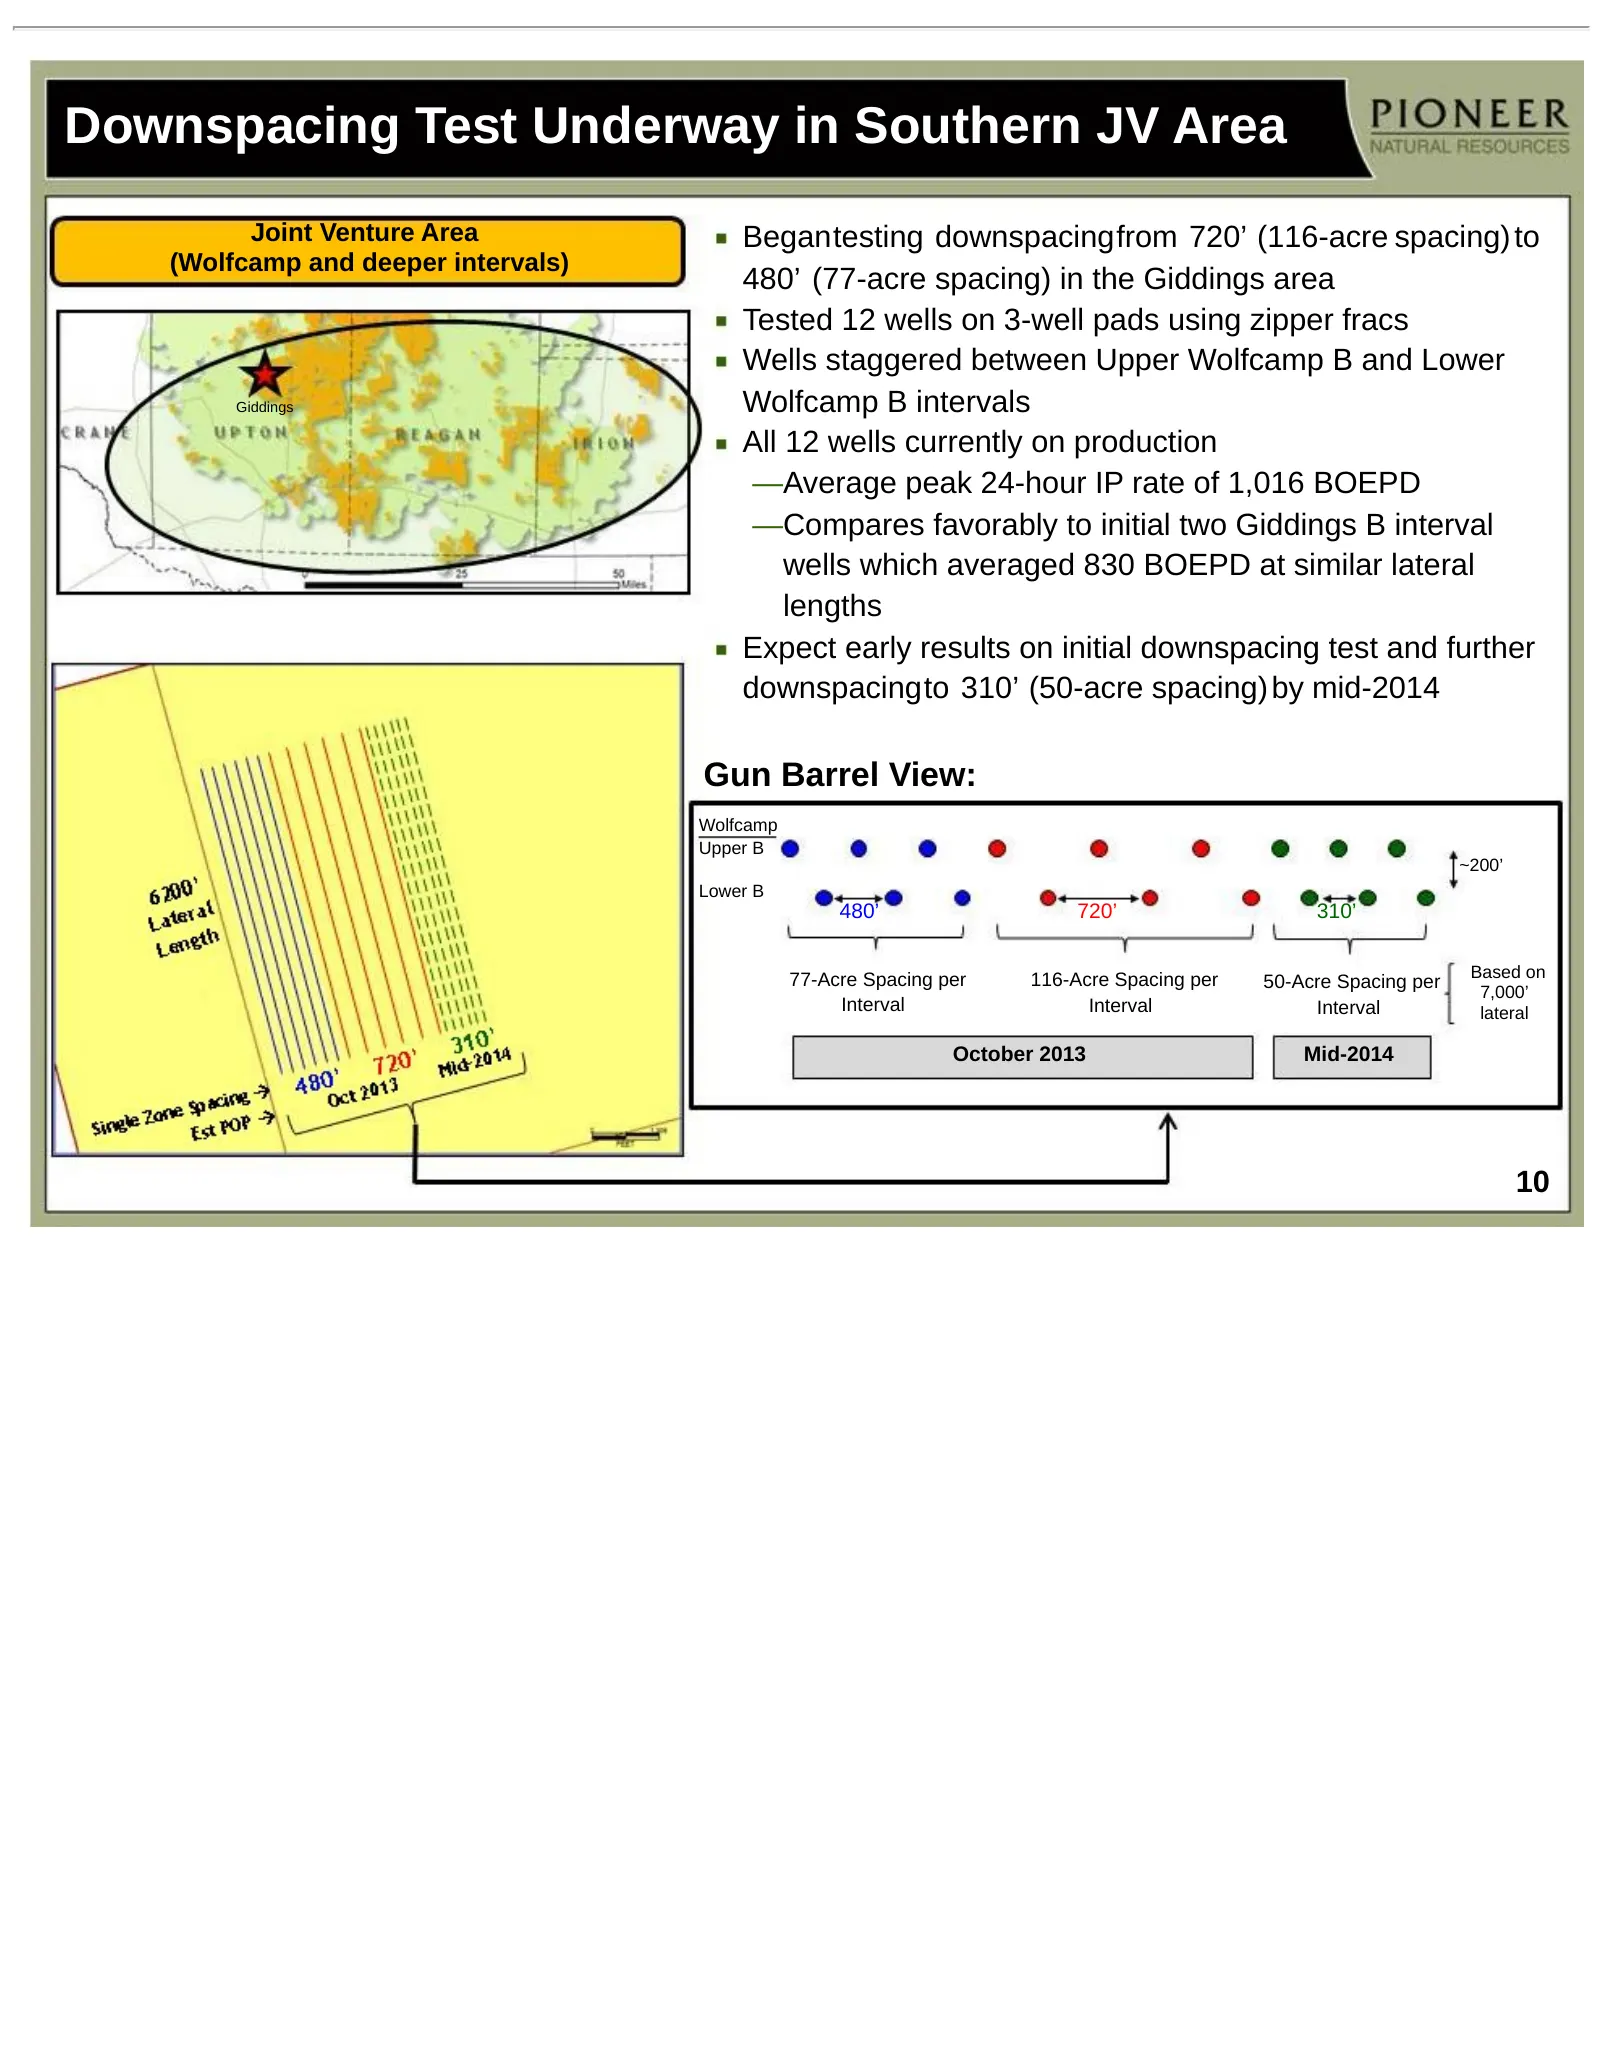
Downspacing Test Underway in Southern JV Area Joint Venture Area Begantesting downspacingfrom 720’ (116-acre spacing) to (Wolfcamp and deeper intervals) 480’ (77-acre spacing) in the Giddings area Tested 12 wells on 3-well pads using zipper fracs Wells staggered between Upper Wolfcamp B and Lower Gi
Slide 11: Northern Spraberry/Wolfcamp Targeted Horizontal Drilling Intervals
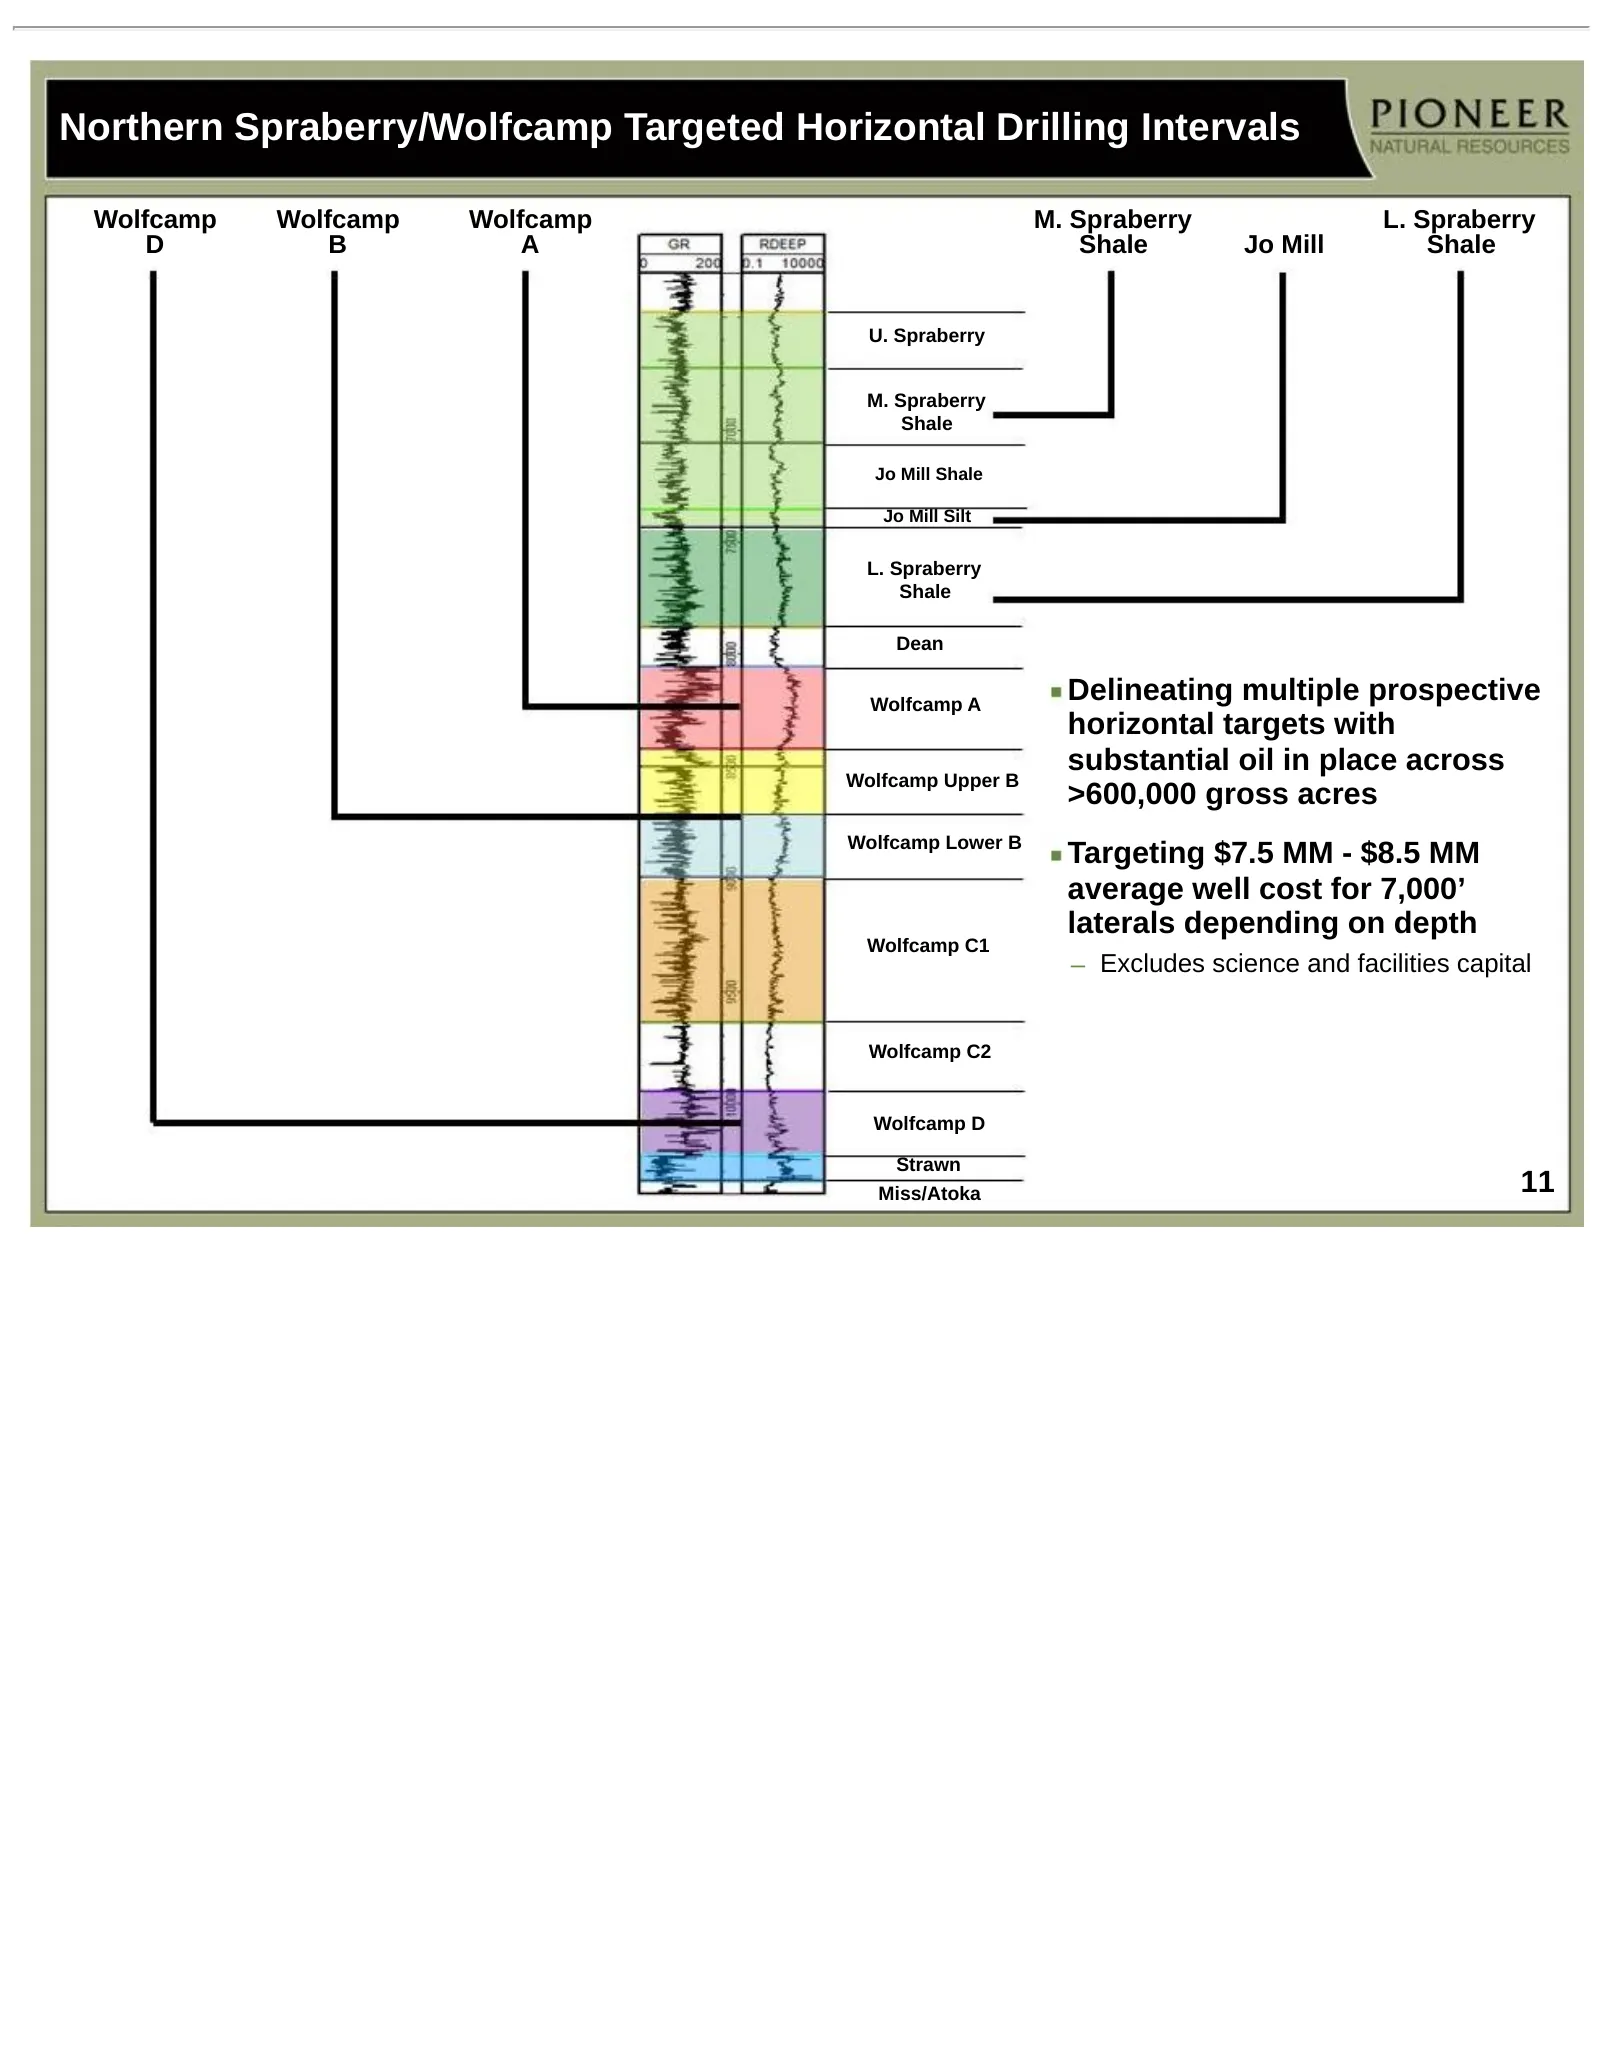
Northern Spraberry/Wolfcamp Targeted Horizontal Drilling Intervals Wolfcamp Wolfcamp Wolfcamp M. Spraberry L. Spraberry D B A Shale Jo Mill Shale U. Spraberry M. Spraberry Shale Jo Mill Shale Jo Mill Silt L. Spraberry Shale Dean Wolfcamp A Delineating multiple prospective horizontal targets with sub
Slide 12: Pioneer's Northern Horizontal Wolfcamp D Shale Wells
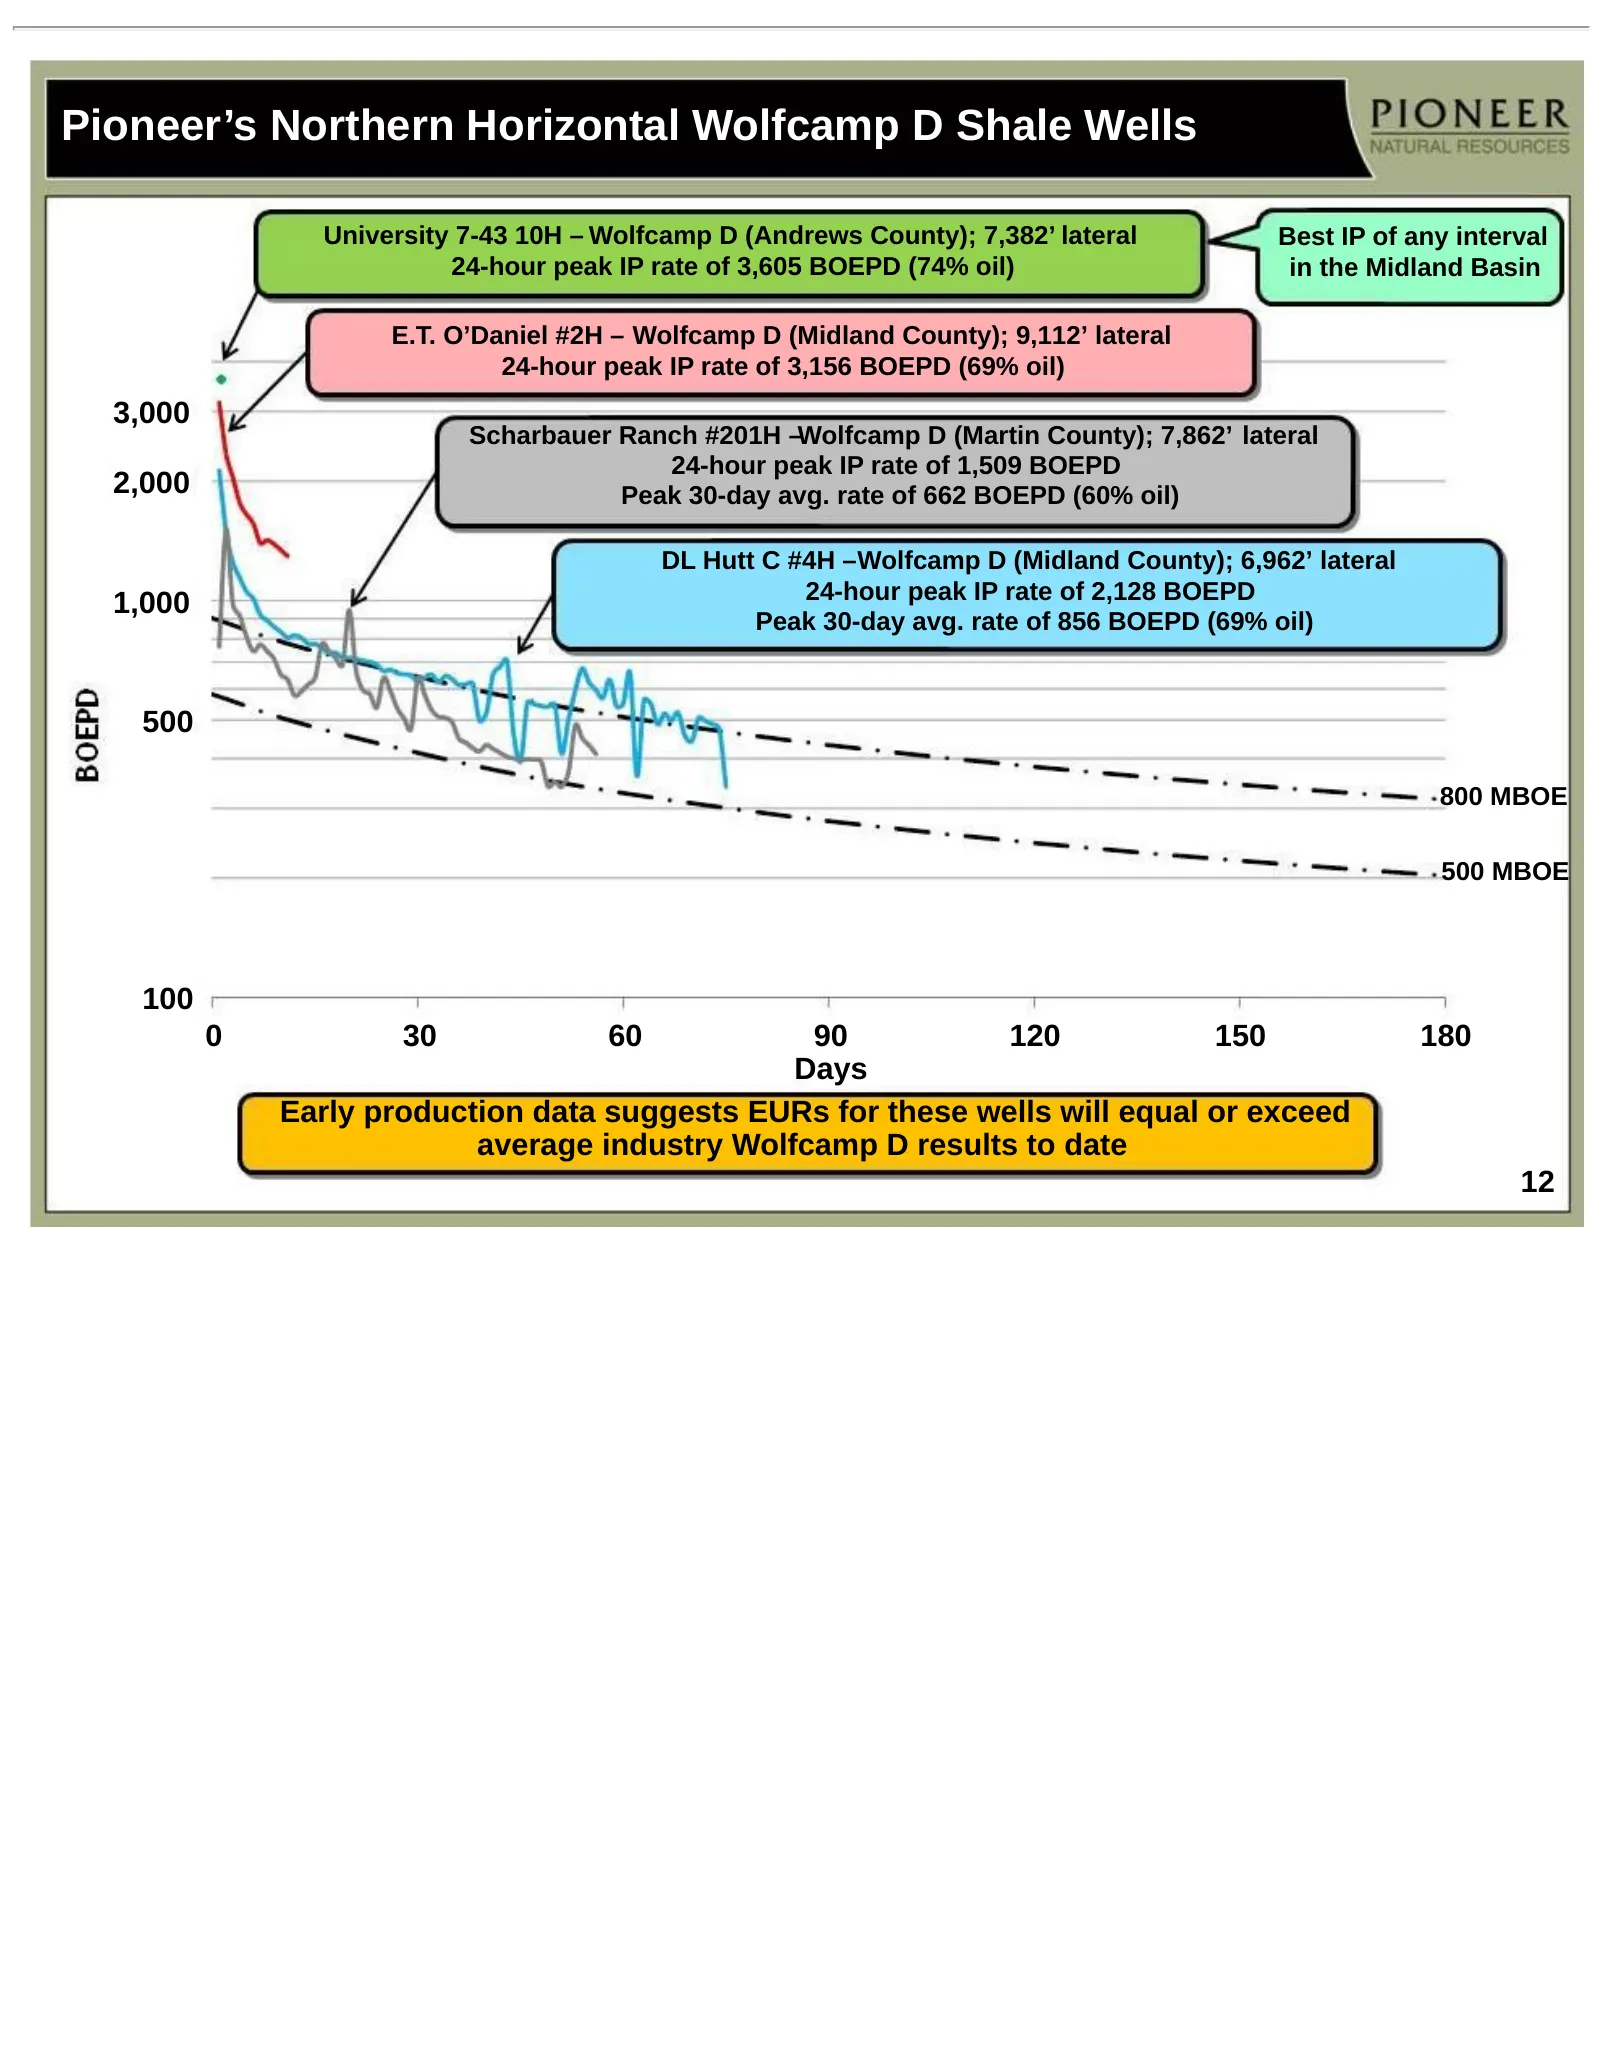
Pioneer’s Northern Horizontal Wolfcamp D Shale Wells University 7-43 10H – Wolfcamp D (Andrews County); 7,382’ lateral Best IP of any interval 24-hour peak IP rate of 3,605 BOEPD (74% oil) in the Midland Basin E.T. O’Daniel #2H – Wolfcamp D (Midland County); 9,112’ lateral 24-hour peak IP rate of 3,
Slide 13: Pioneer's Wolfcamp D Wells Extend Play 60 Miles West
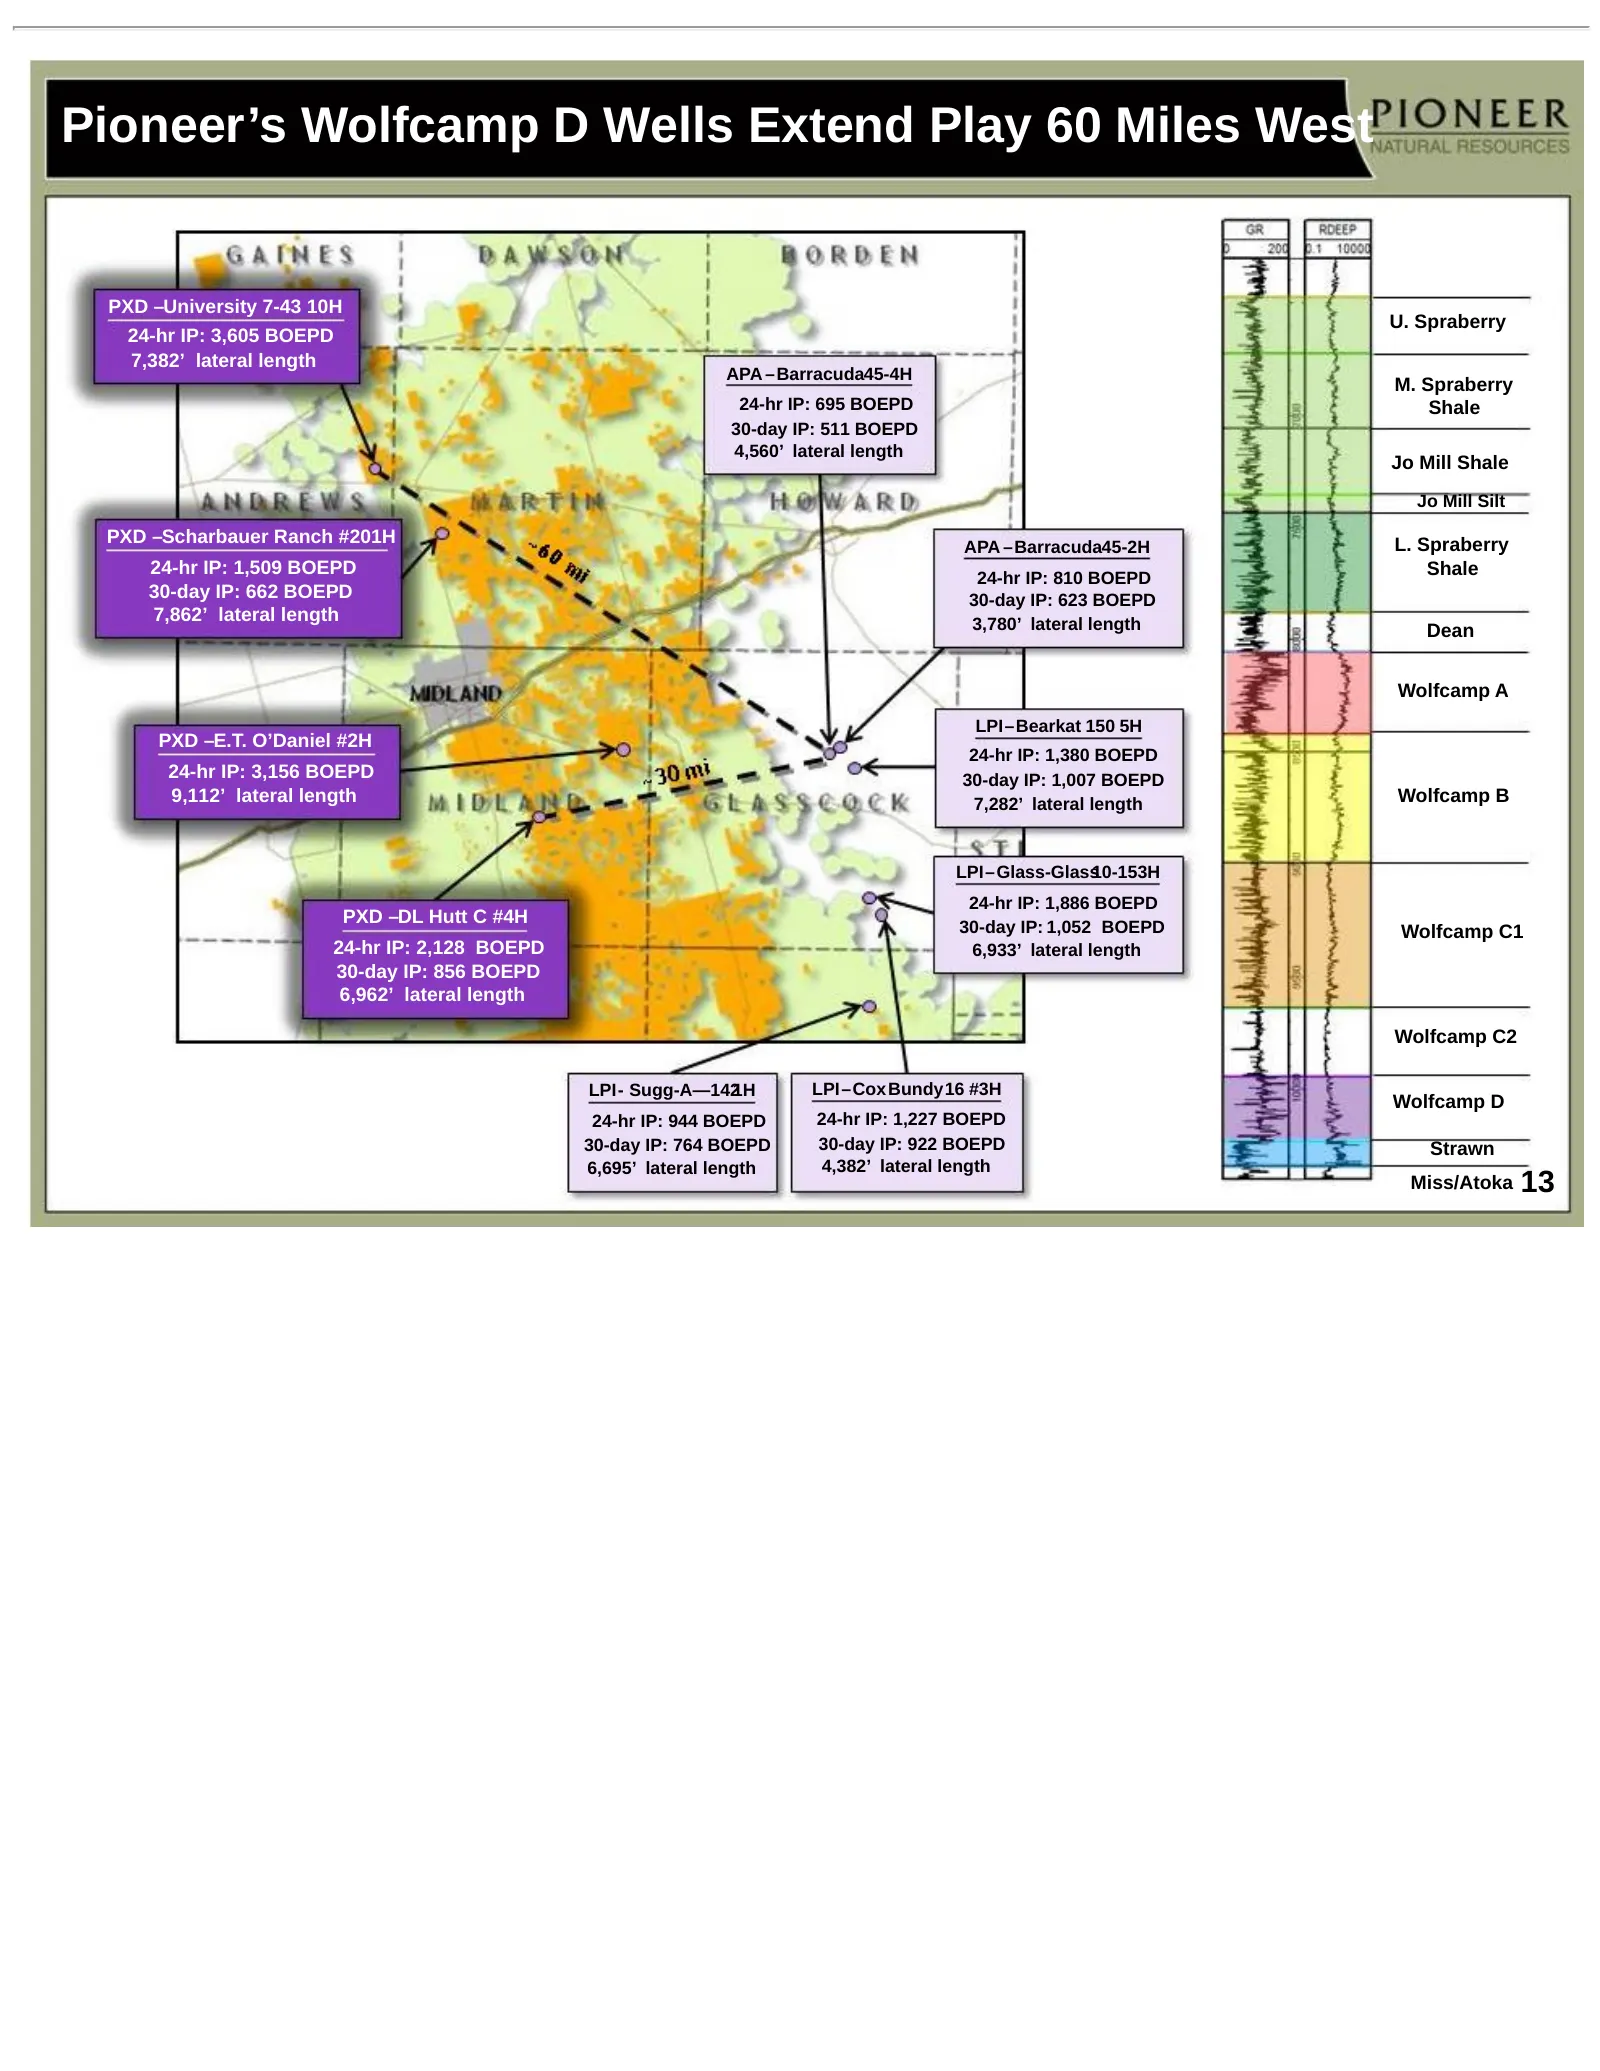
Pioneer’s Wolfcamp D Wells Extend Play 60 Miles West PXD –University 7-43 10H U. Spraberry 24-hr IP: 3,605 BOEPD 7,382’ lateral length APA –Barracuda45-4H M. Spraberry 24-hr IP: 695 BOEPD Shale 30-day IP: 511 BOEPD 4,560’ lateral length Jo Mill Shale Jo Mill Silt PXD –Scharbauer Ranch #201H APA –Bar
Slide 14: Pioneer's Northern Horizontal Wolfcamp B and Wolfcamp A Shale Wells
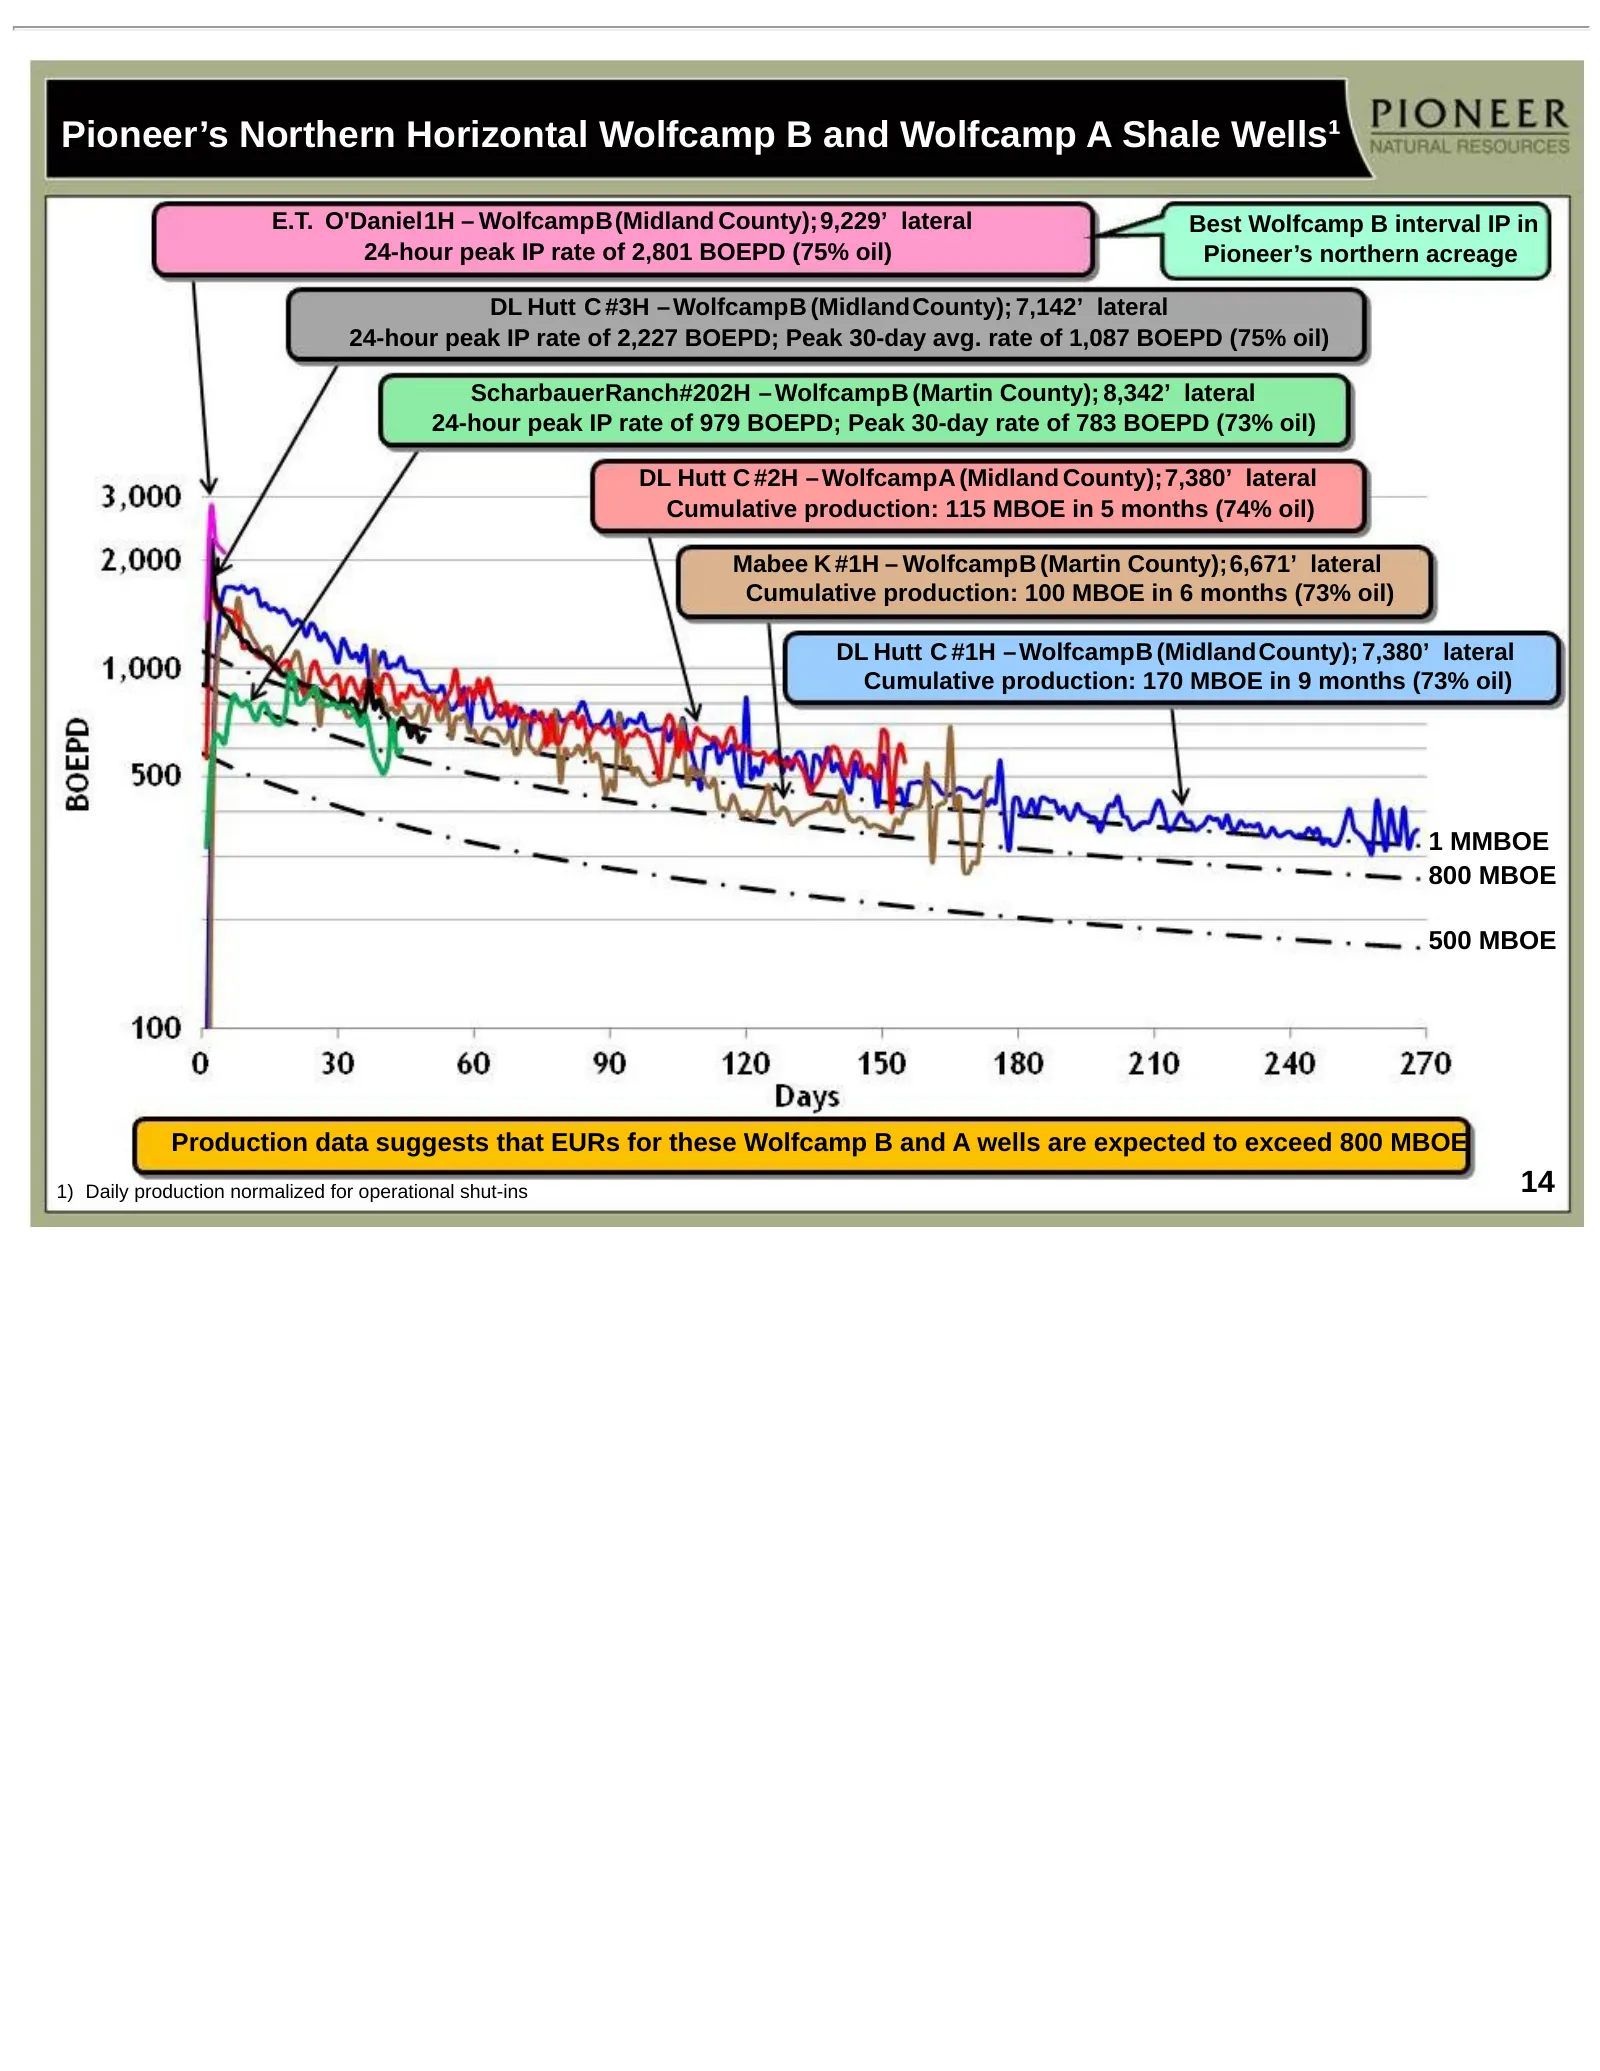
Pioneer’s Northern Horizontal Wolfcamp B and Wolfcamp A Shale Wells¹ E.T. O'Daniel1H – WolfcampB(Midland County);9,229’ lateral Best Wolfcamp B interval IP in 24-hour peak IP rate of 2,801 BOEPD (75% oil) Pioneer’s northern acreage DL Hutt C #3H – WolfcampB (MidlandCounty); 7,142’ lateral 24-hour pe
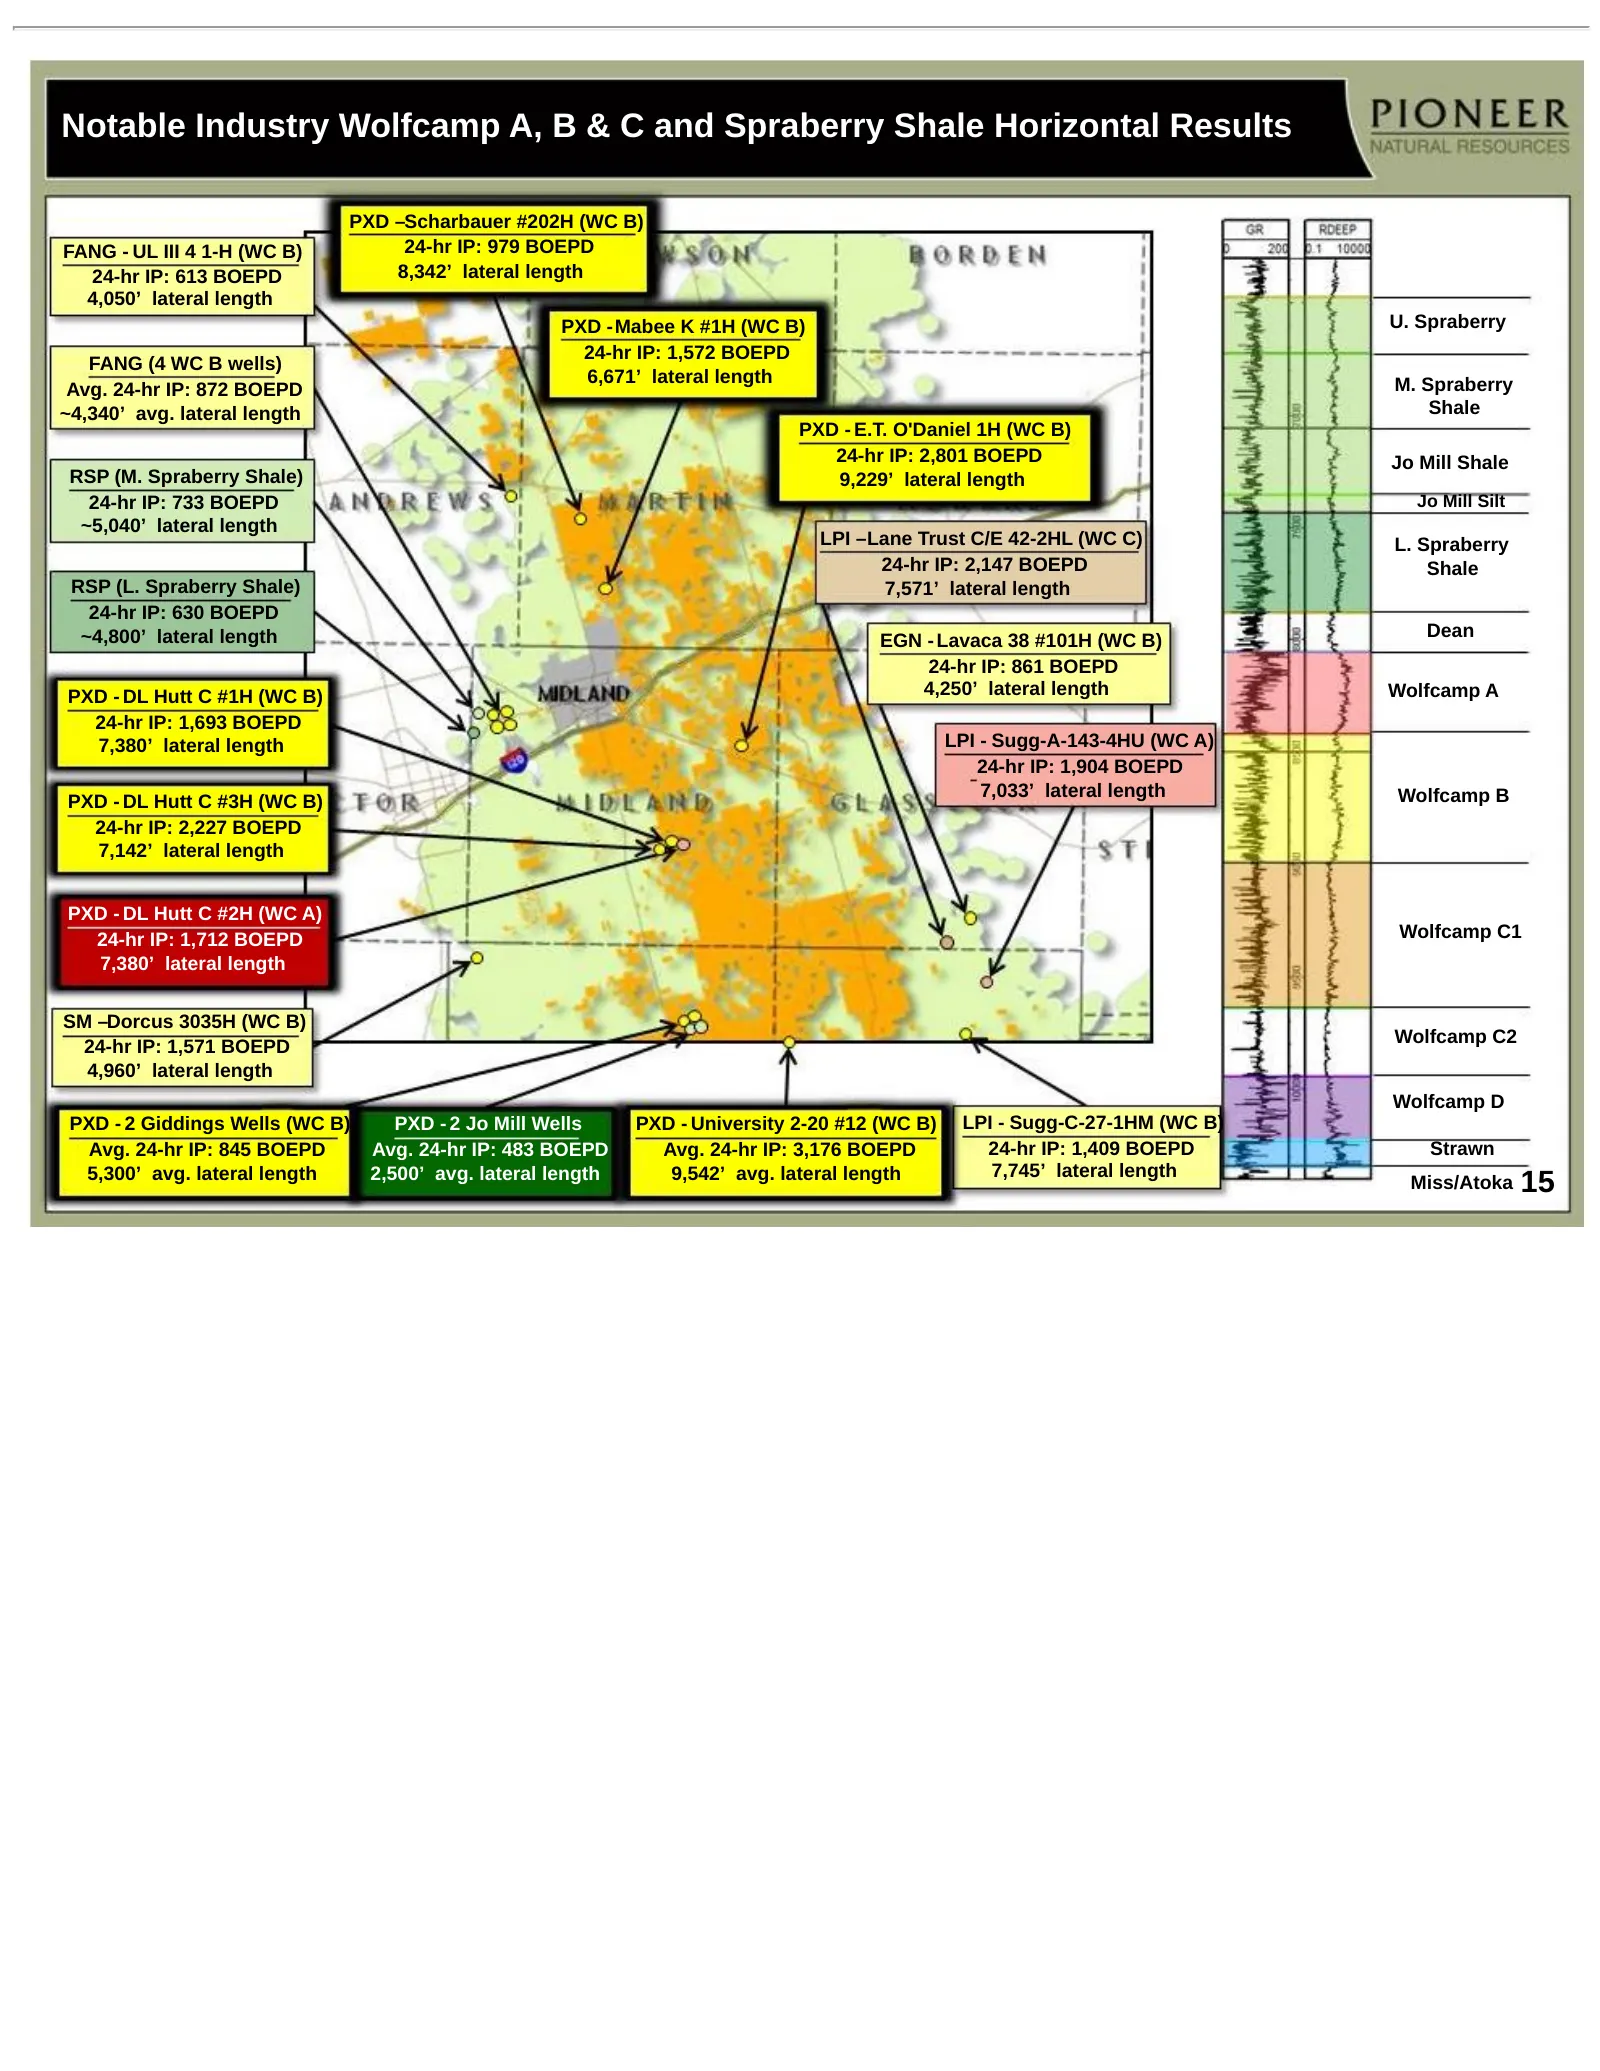
Slide 15: Notable Industry Wolfcamp A, B & C and Spraberry Shale Horizontal Results
Notable Industry Wolfcamp A, B & C and Spraberry Shale Horizontal Results PXD –Scharbauer #202H (WC B) FANG - UL III 4 1-H (WC B) 24-hr IP: 979 BOEPD 24-hr IP: 613 BOEPD 8,342’ lateral length 4,050’ lateral length PXD -Mabee K #1H (WC B) U. Spraberry 24-hr IP: 1,572 BOEPD FANG (4 WC B wells) 6,671’
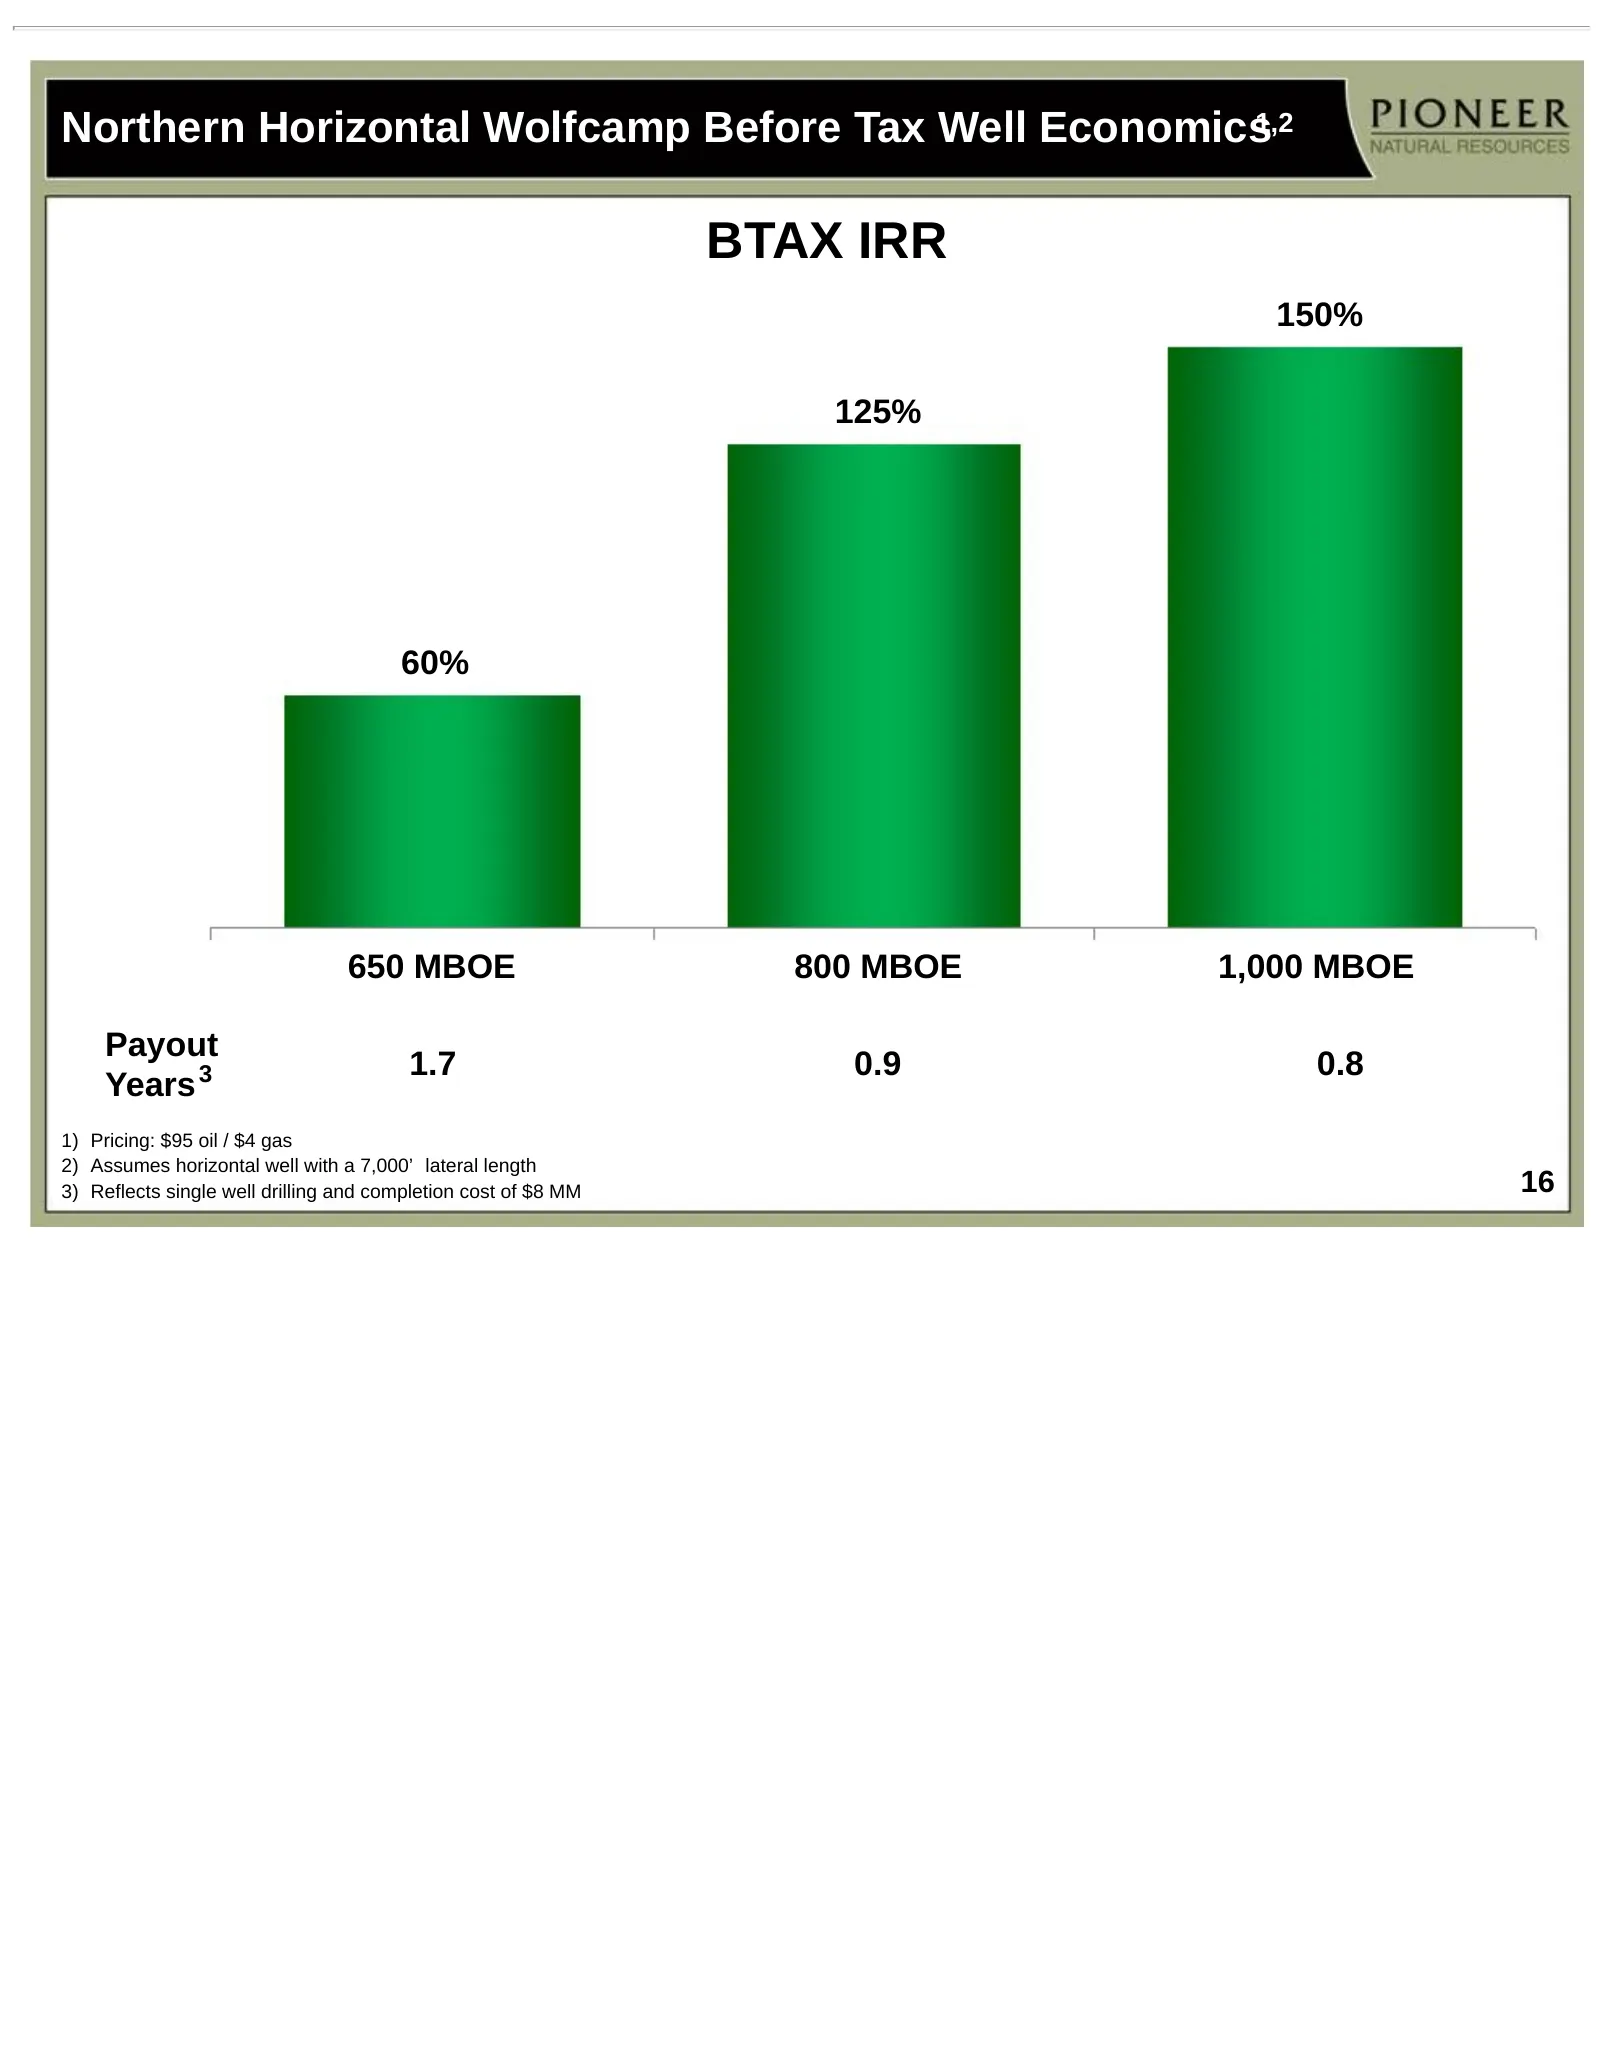
Slide 16: Northern Horizontal Wolfcamp Before Tax Well Economics
Northern Horizontal Wolfcamp Before Tax Well Economics1,2 BTAX IRR 150% 125% 60% 650 MBOE 800 MBOE 1,000 MBOE Payout 1.7 0.9 0.8 Years 3 1) Pricing: $95 oil / $4 gas 2) Assumes horizontal well with a 7,000’ lateral length 3) Reflects single well drilling and completion cost of $8 MM 16
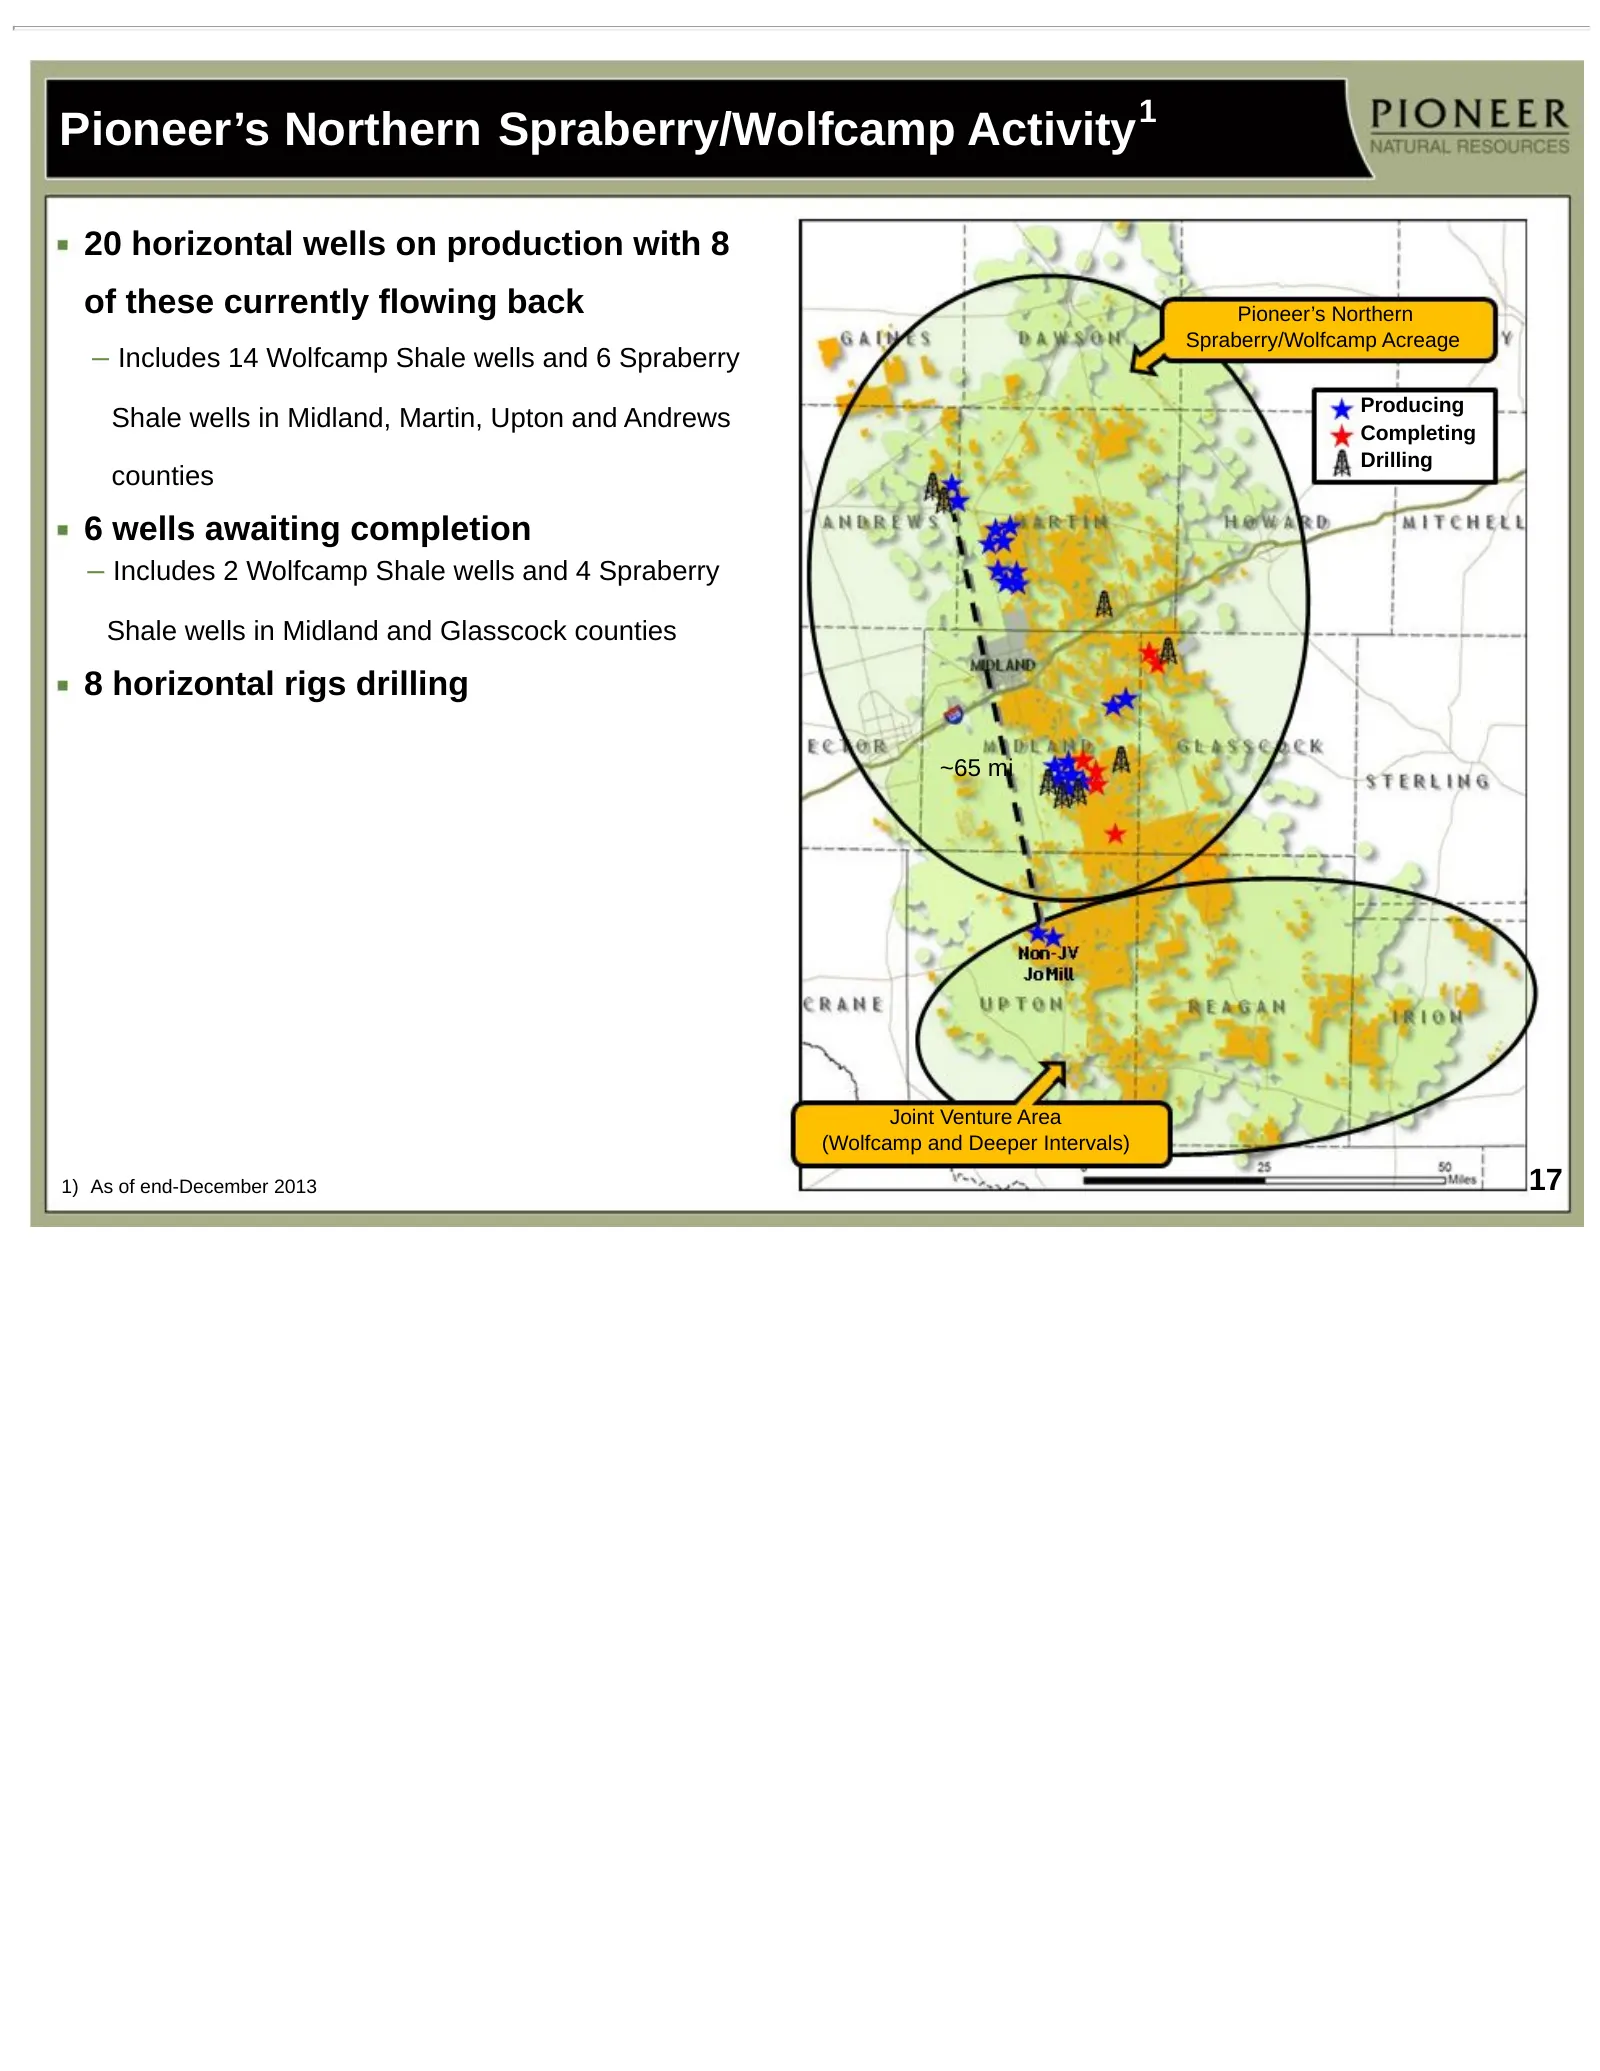
Slide 17: Pioneer's Northern Spraberry/Wolfcamp Activity
Pioneer’s Northern Spraberry/Wolfcamp Activity 1 20 horizontal wells on production with 8 of these currently flowing back Pioneer’s Northern Spraberry/Wolfcamp Acreage – Includes 14 Wolfcamp Shale wells and 6 Spraberry Producing Shale wells in Midland, Martin, Upton and Andrews Completing Drilling c
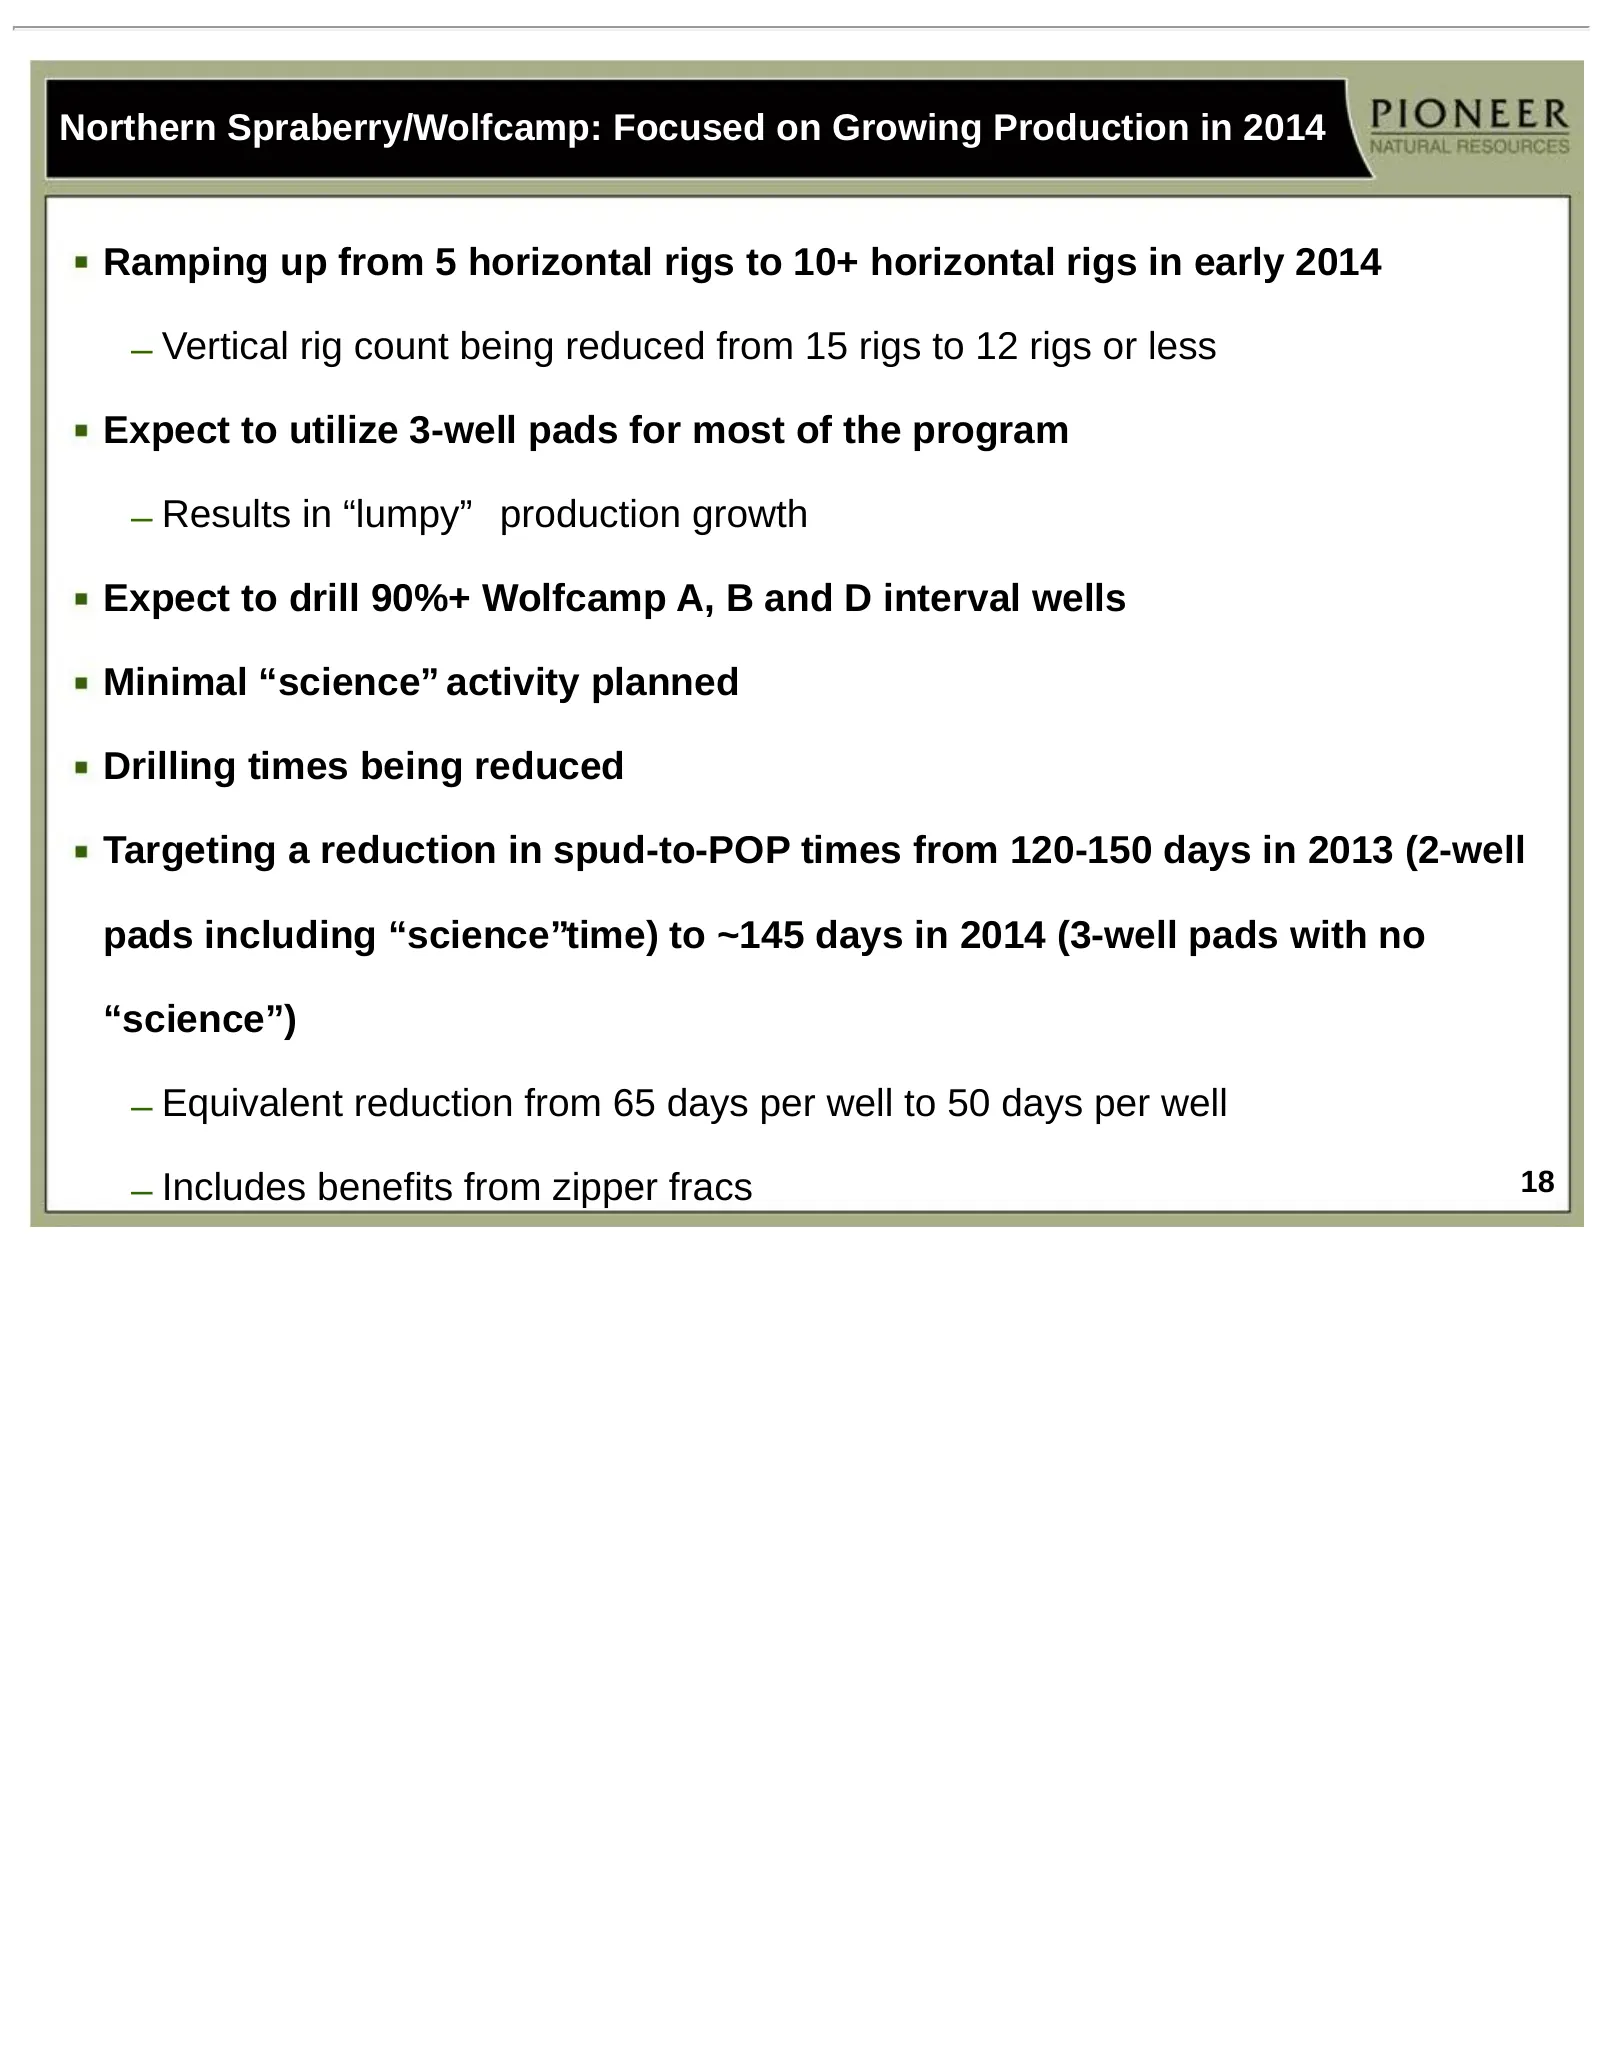
Slide 18: Northern Spraberry/Wolfcamp: Focused on Growing Production in 2014
Northern Spraberry/Wolfcamp: Focused on Growing Production in 2014 Ramping up from 5 horizontal rigs to 10+ horizontal rigs in early 2014 – Vertical rig count being reduced from 15 rigs to 12 rigs or less Expect to utilize 3-well pads for most of the program – Results in “lumpy” production growth Ex
Slide 19: 2013 Spraberry/Wolfcamp Shale Production Growth Range
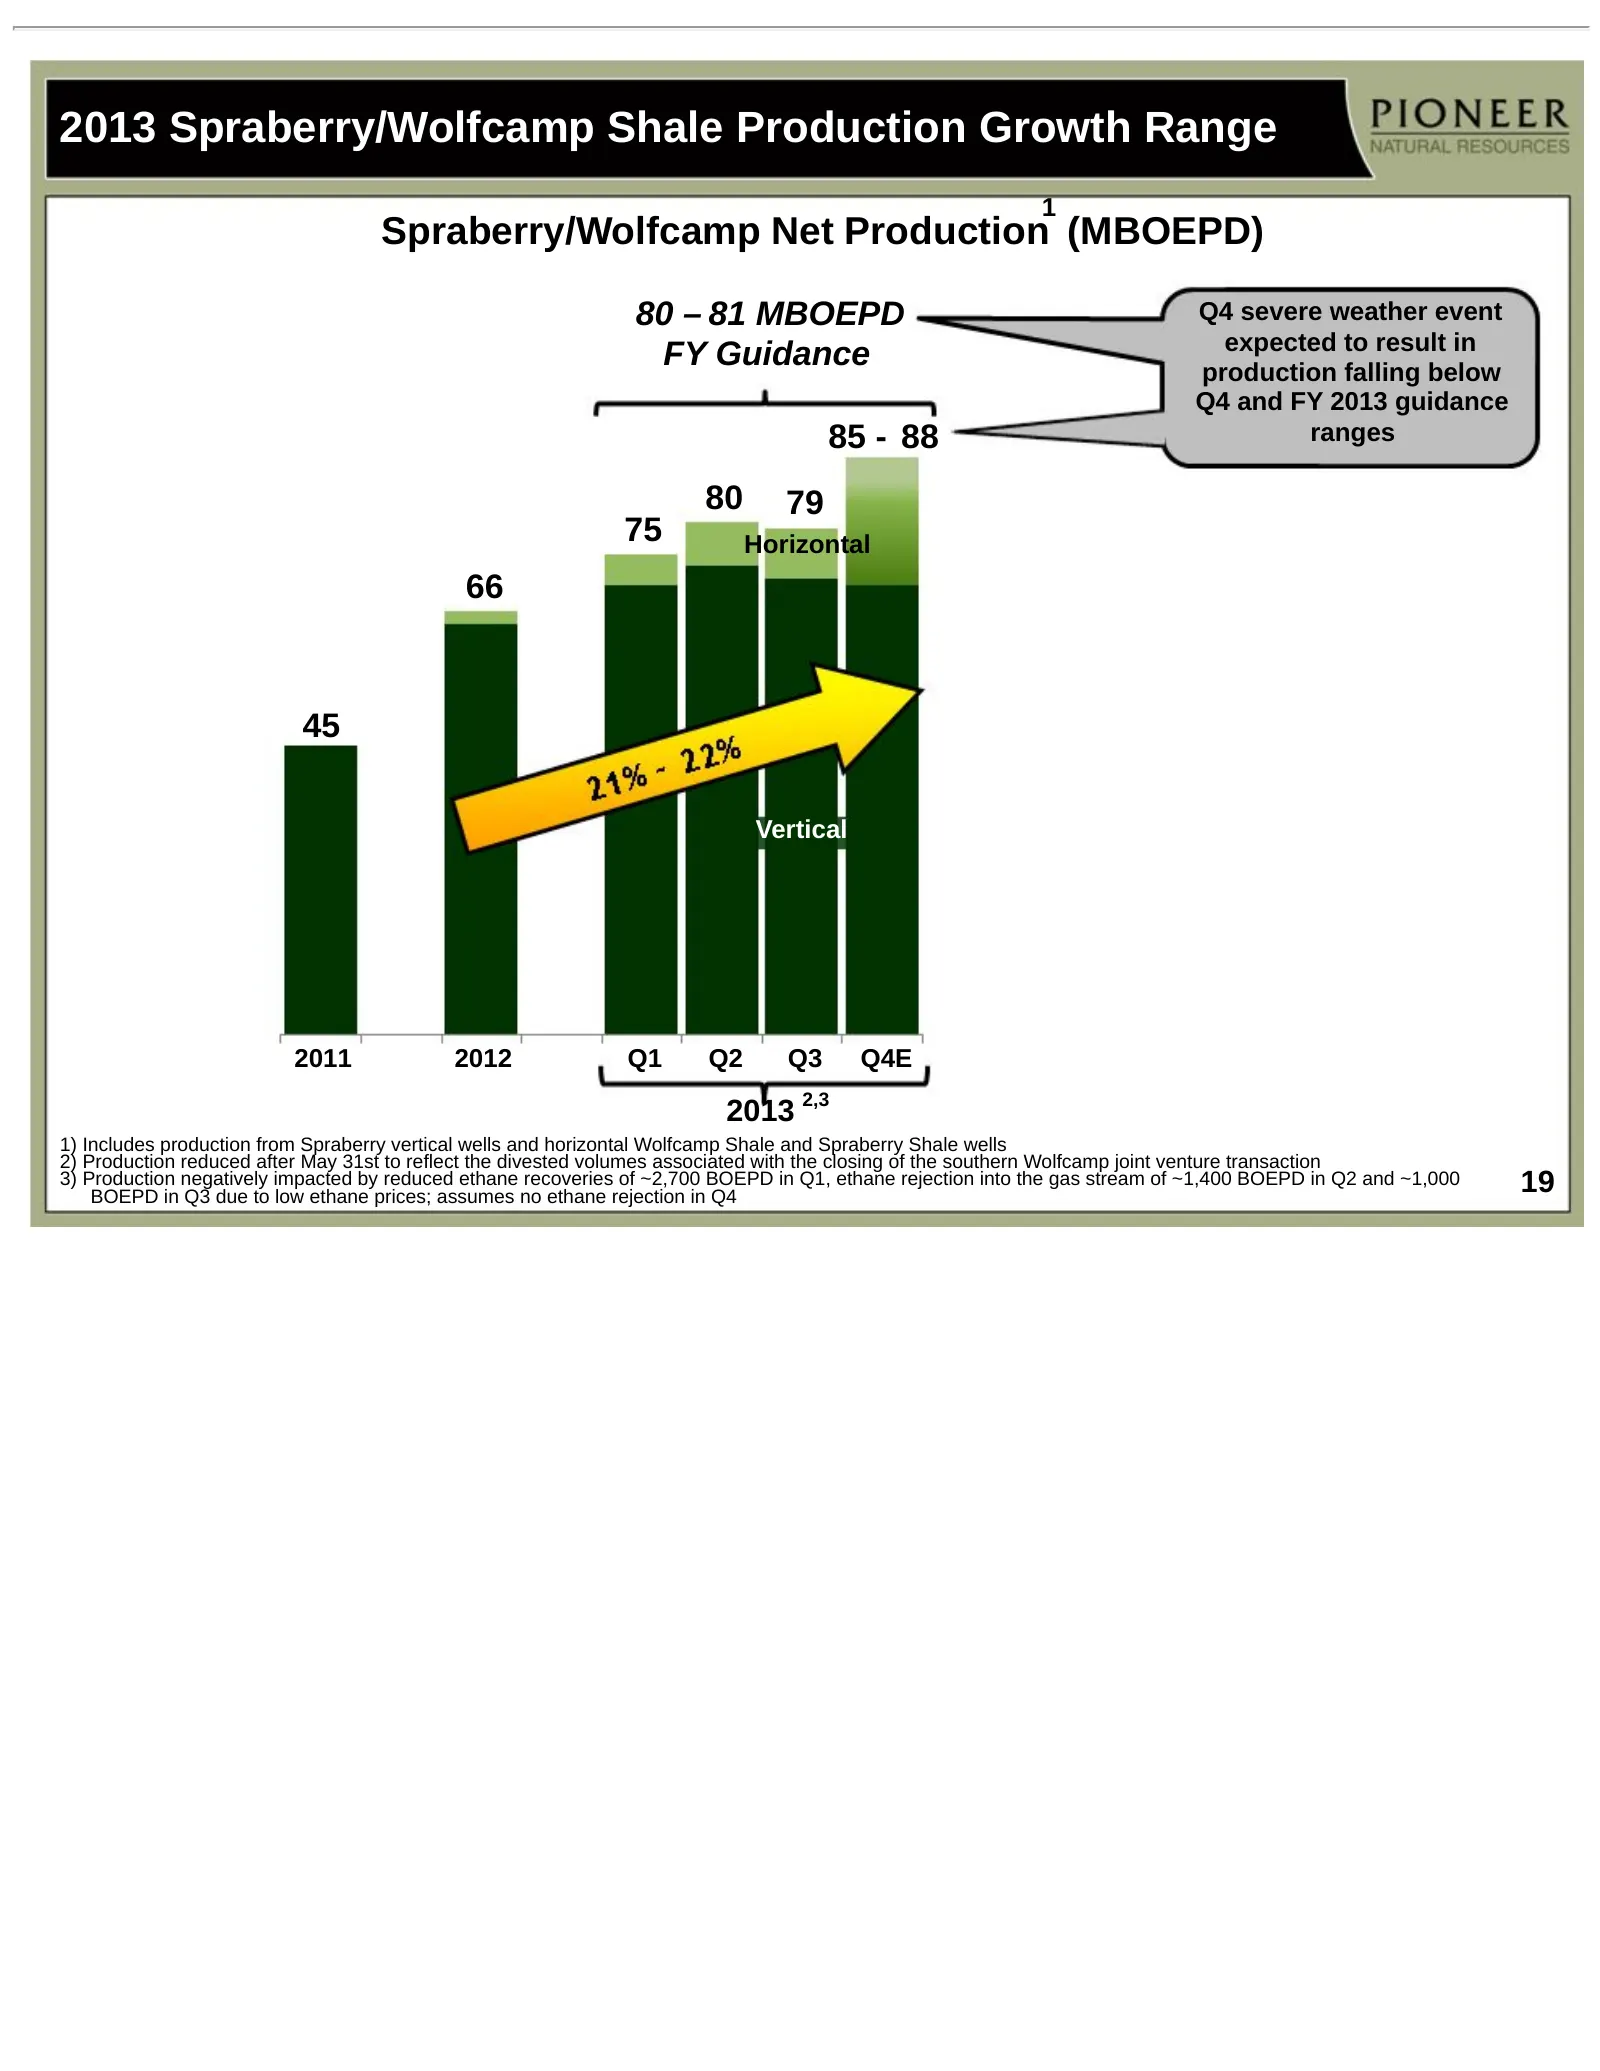
2013 Spraberry/Wolfcamp Shale Production Growth Range 1 Spraberry/Wolfcamp Net Production (MBOEPD) 80 – 81 MBOEPD Q4 severe weather event expected to result in FY Guidance production falling below Q4 and FY 2013 guidance 85 - 88 ranges 80 79 75 Horizontal 66 45 Vertical 2011 2012 Q1 Q2 Q3 Q4E 2,3 20
Slide 20: Severe Weather Disrupts Q4 Spraberry/Wolfcamp Production
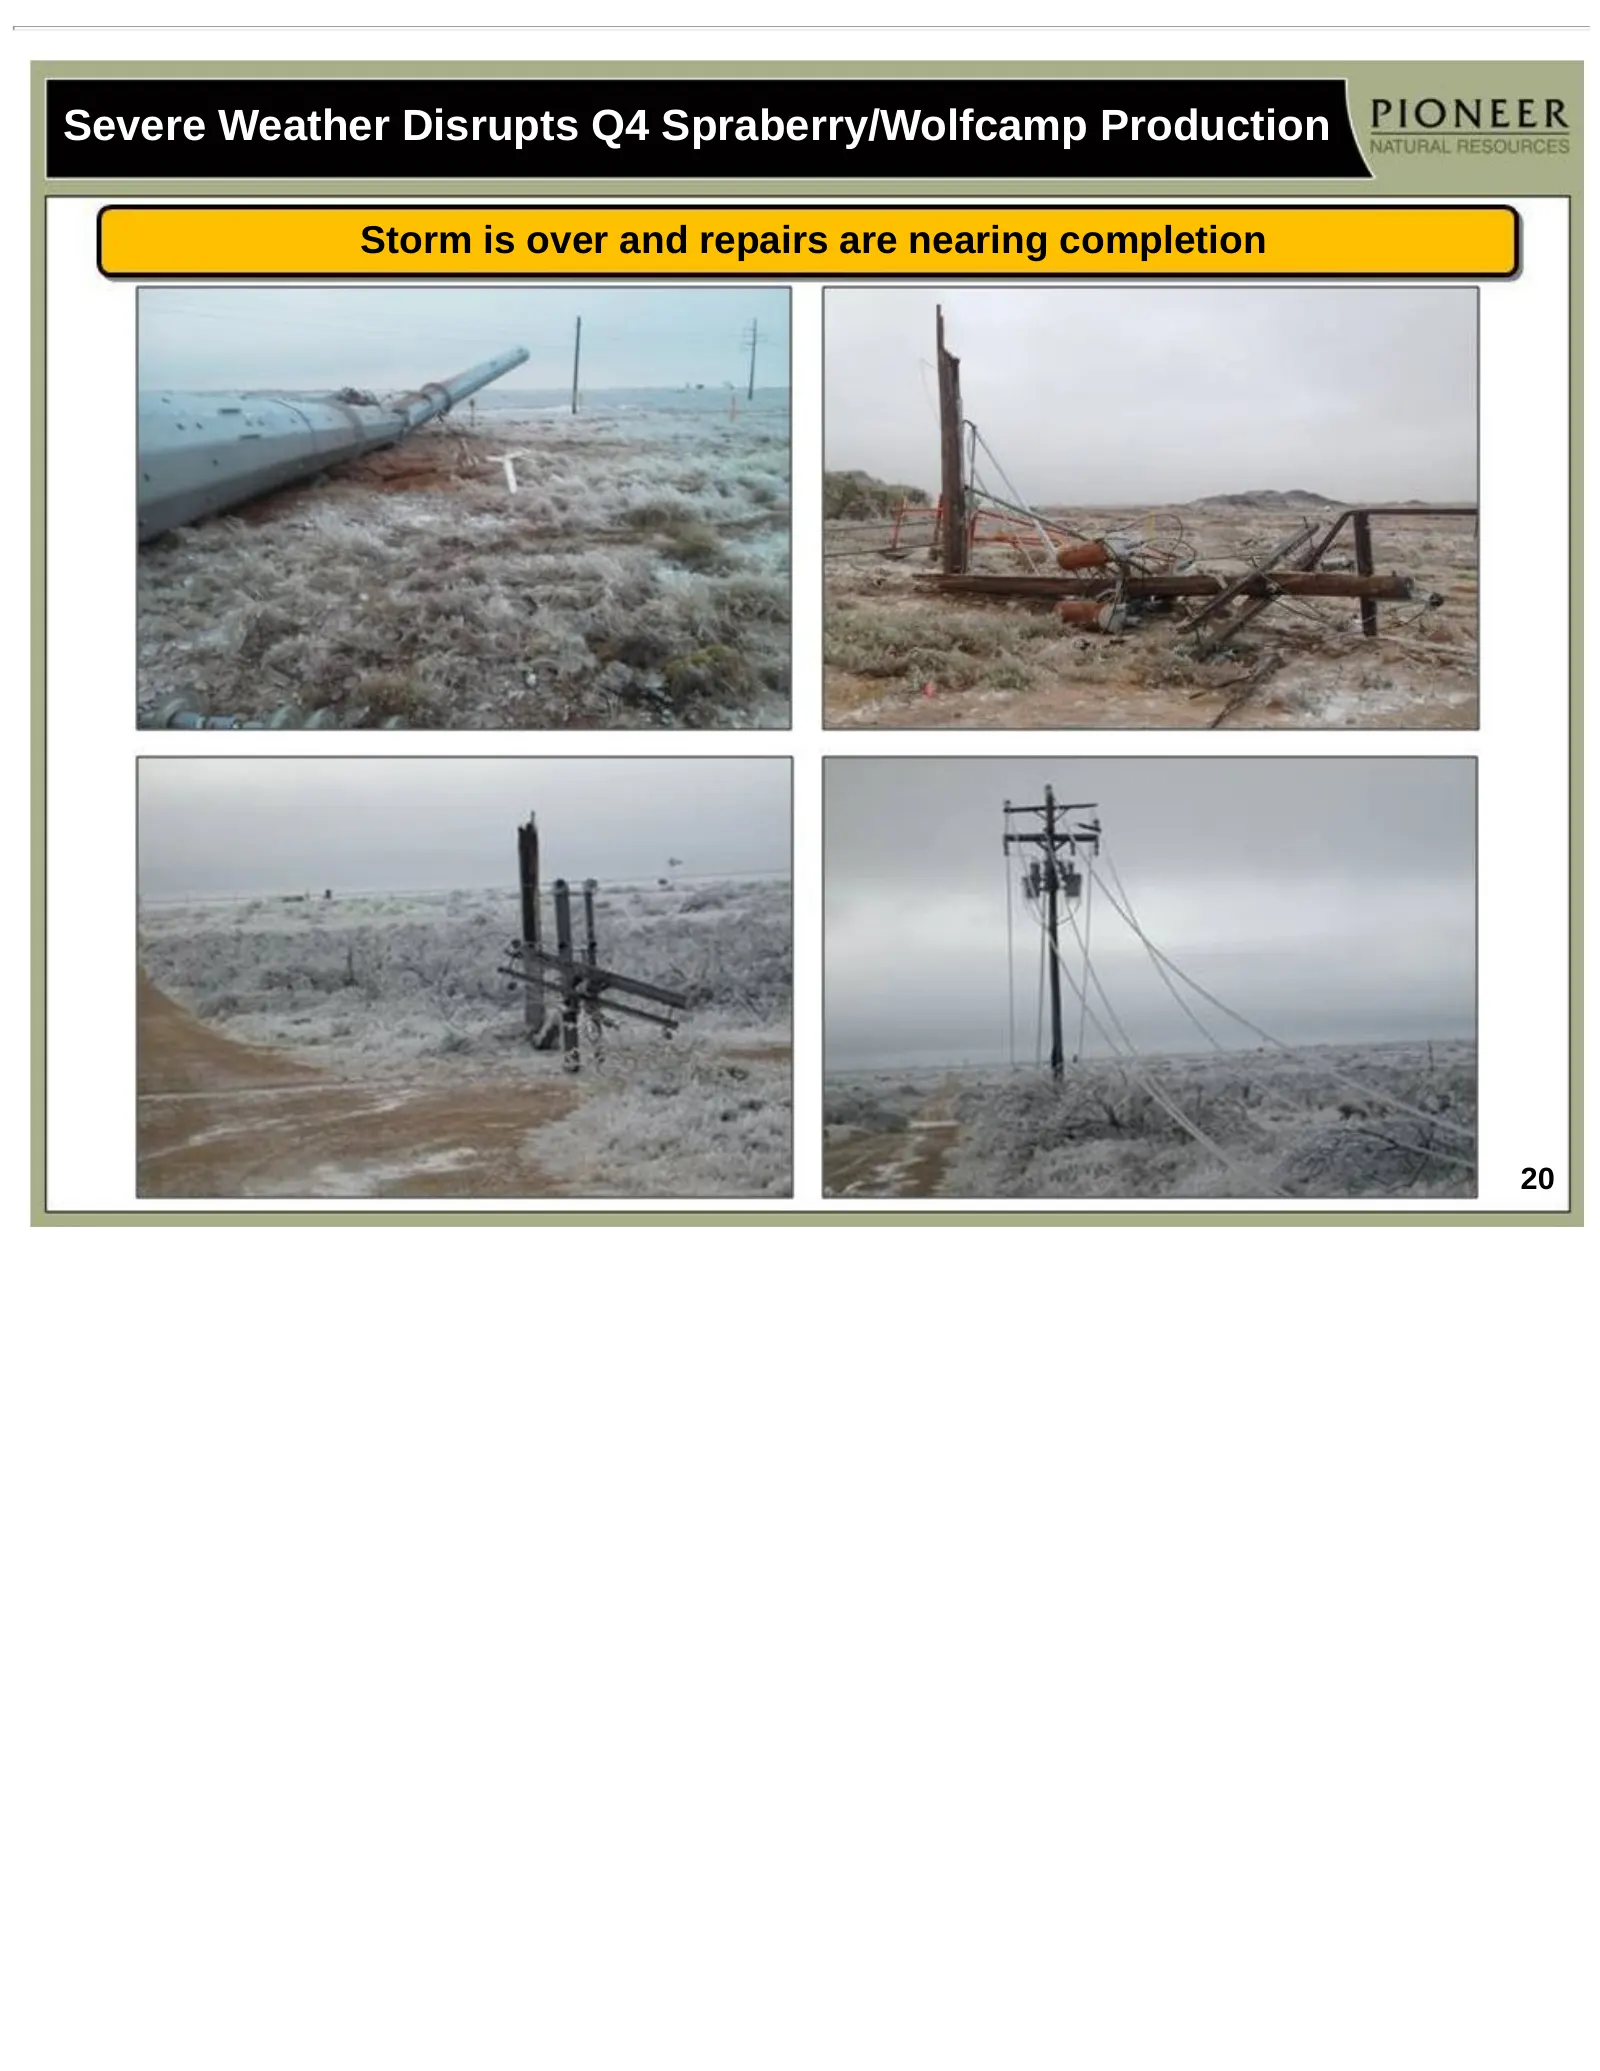
Severe Weather Disrupts Q4 Spraberry/Wolfcamp Production Storm is over and repairs are nearing completion 20
Slide 21: Eagle Ford Shale Downspacing Results (500' Well Spacing Tests)
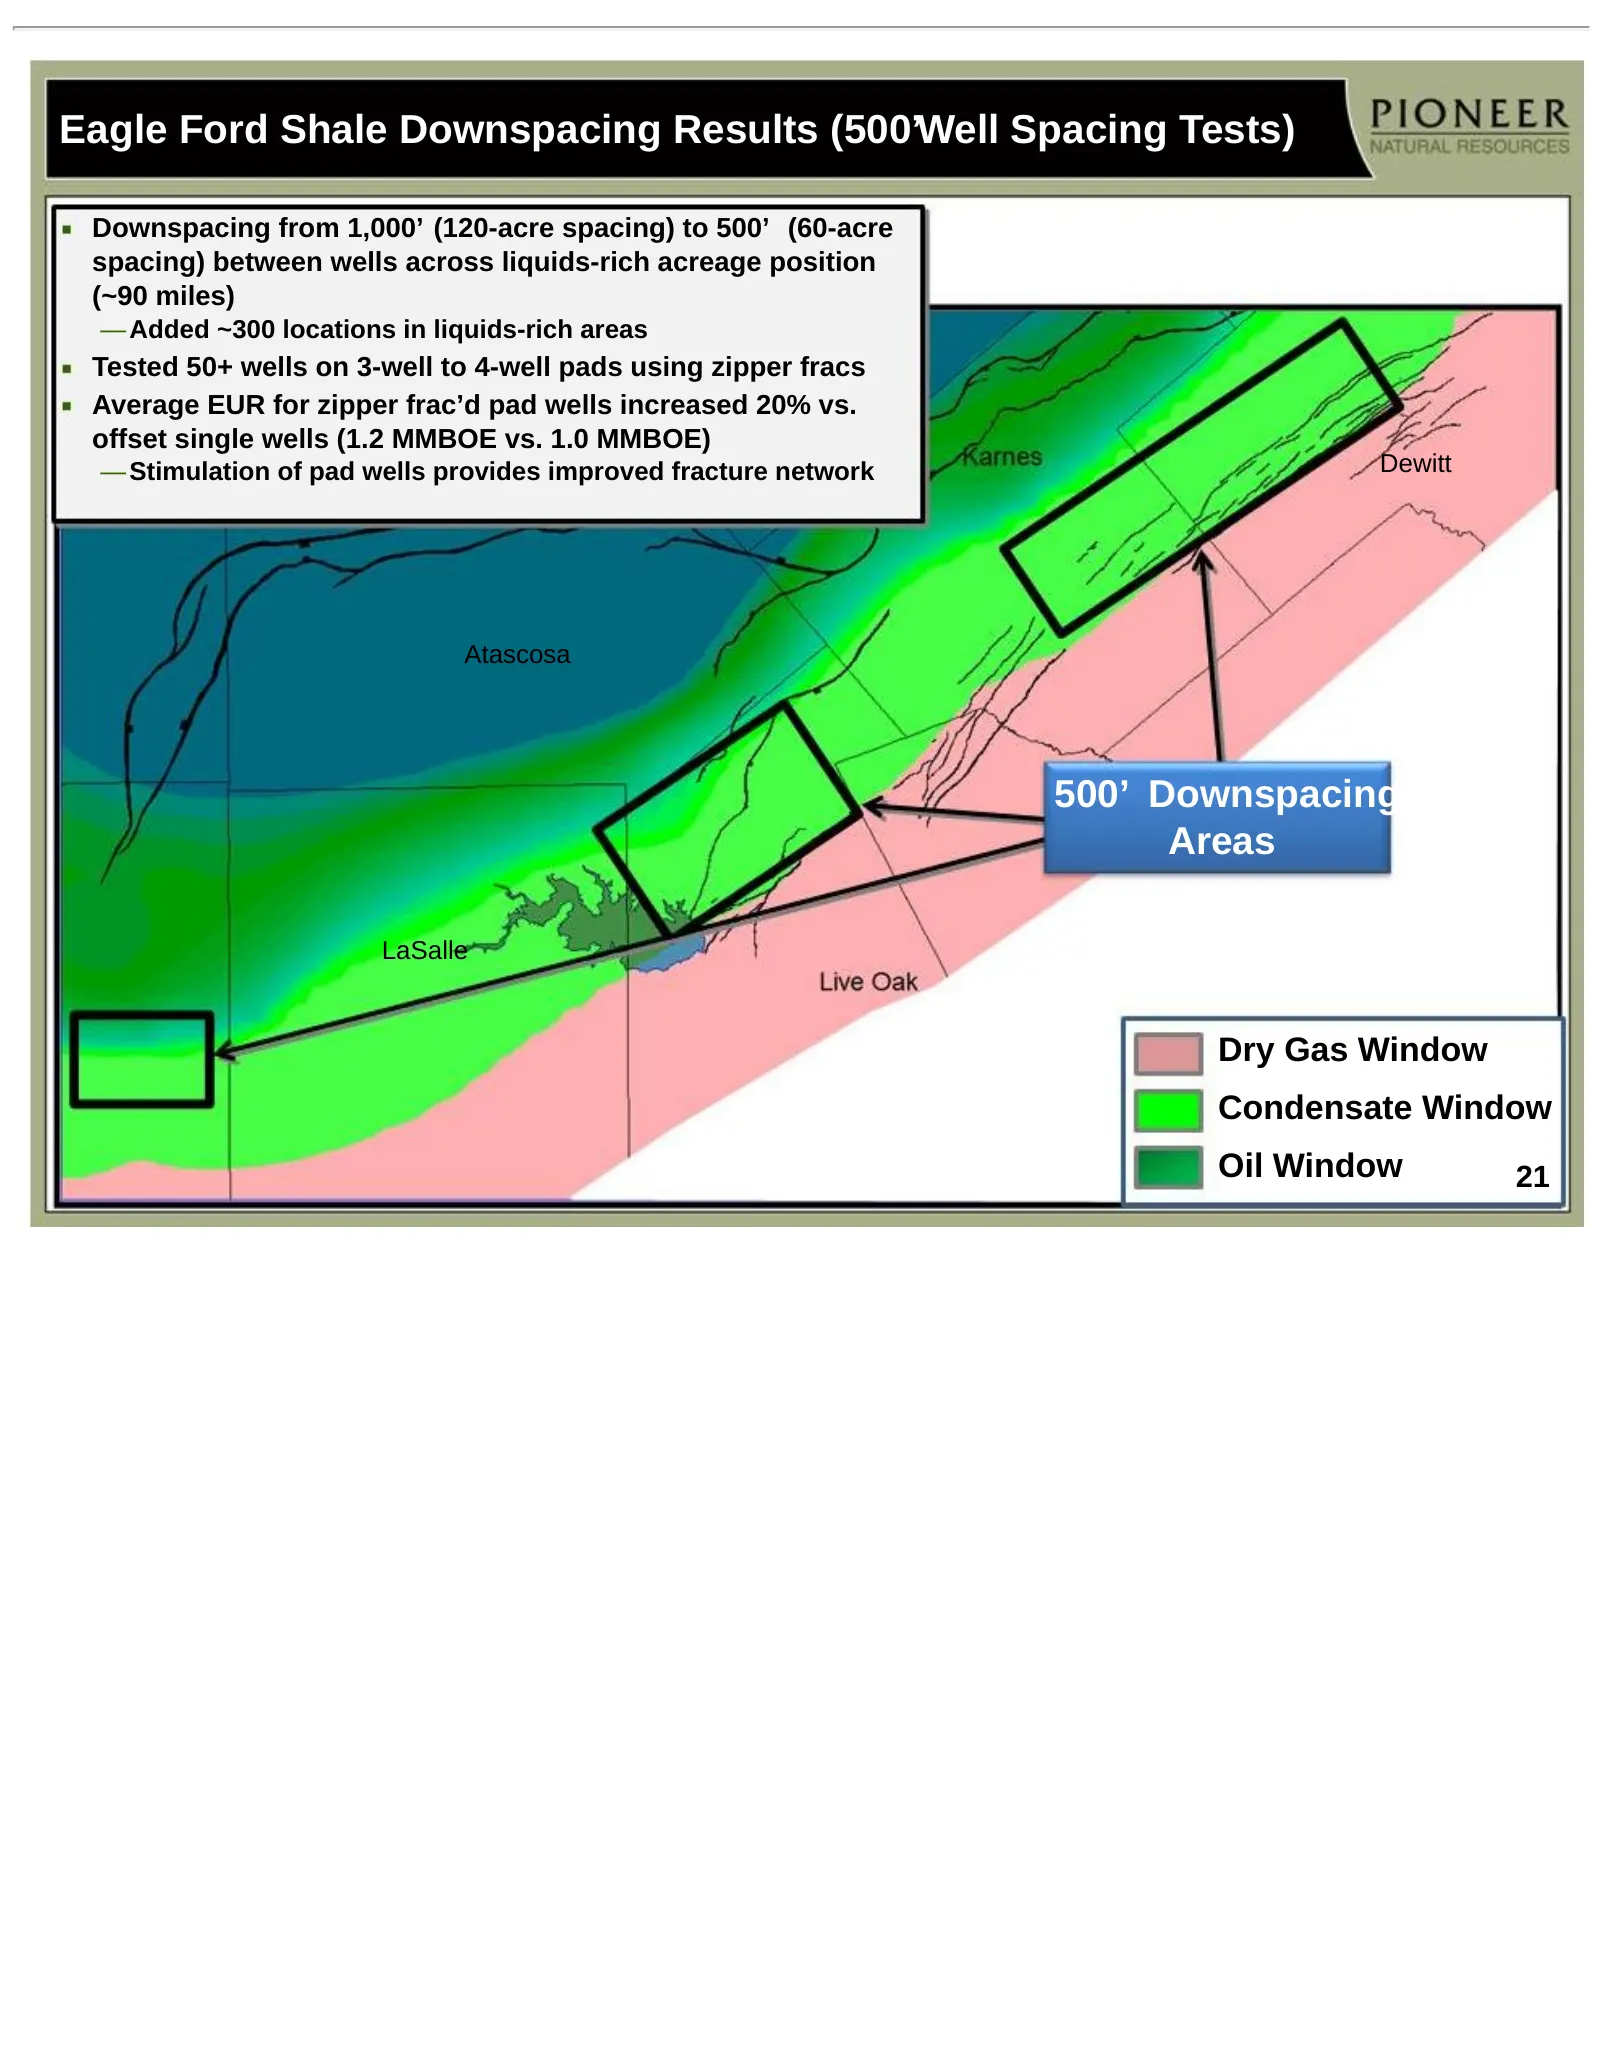
Eagle Ford Shale Downspacing Results (500’Well Spacing Tests) Downspacing from 1,000’ (120-acre spacing) to 500’ (60-acre spacing) between wells across liquids-rich acreage position (~90 miles) — Added ~300 locations in liquids-rich areas Tested 50+ wells on 3-well to 4-well pads using zipper fracs
Slide 22: Further Downspacing Tests Underway (Down to 300')
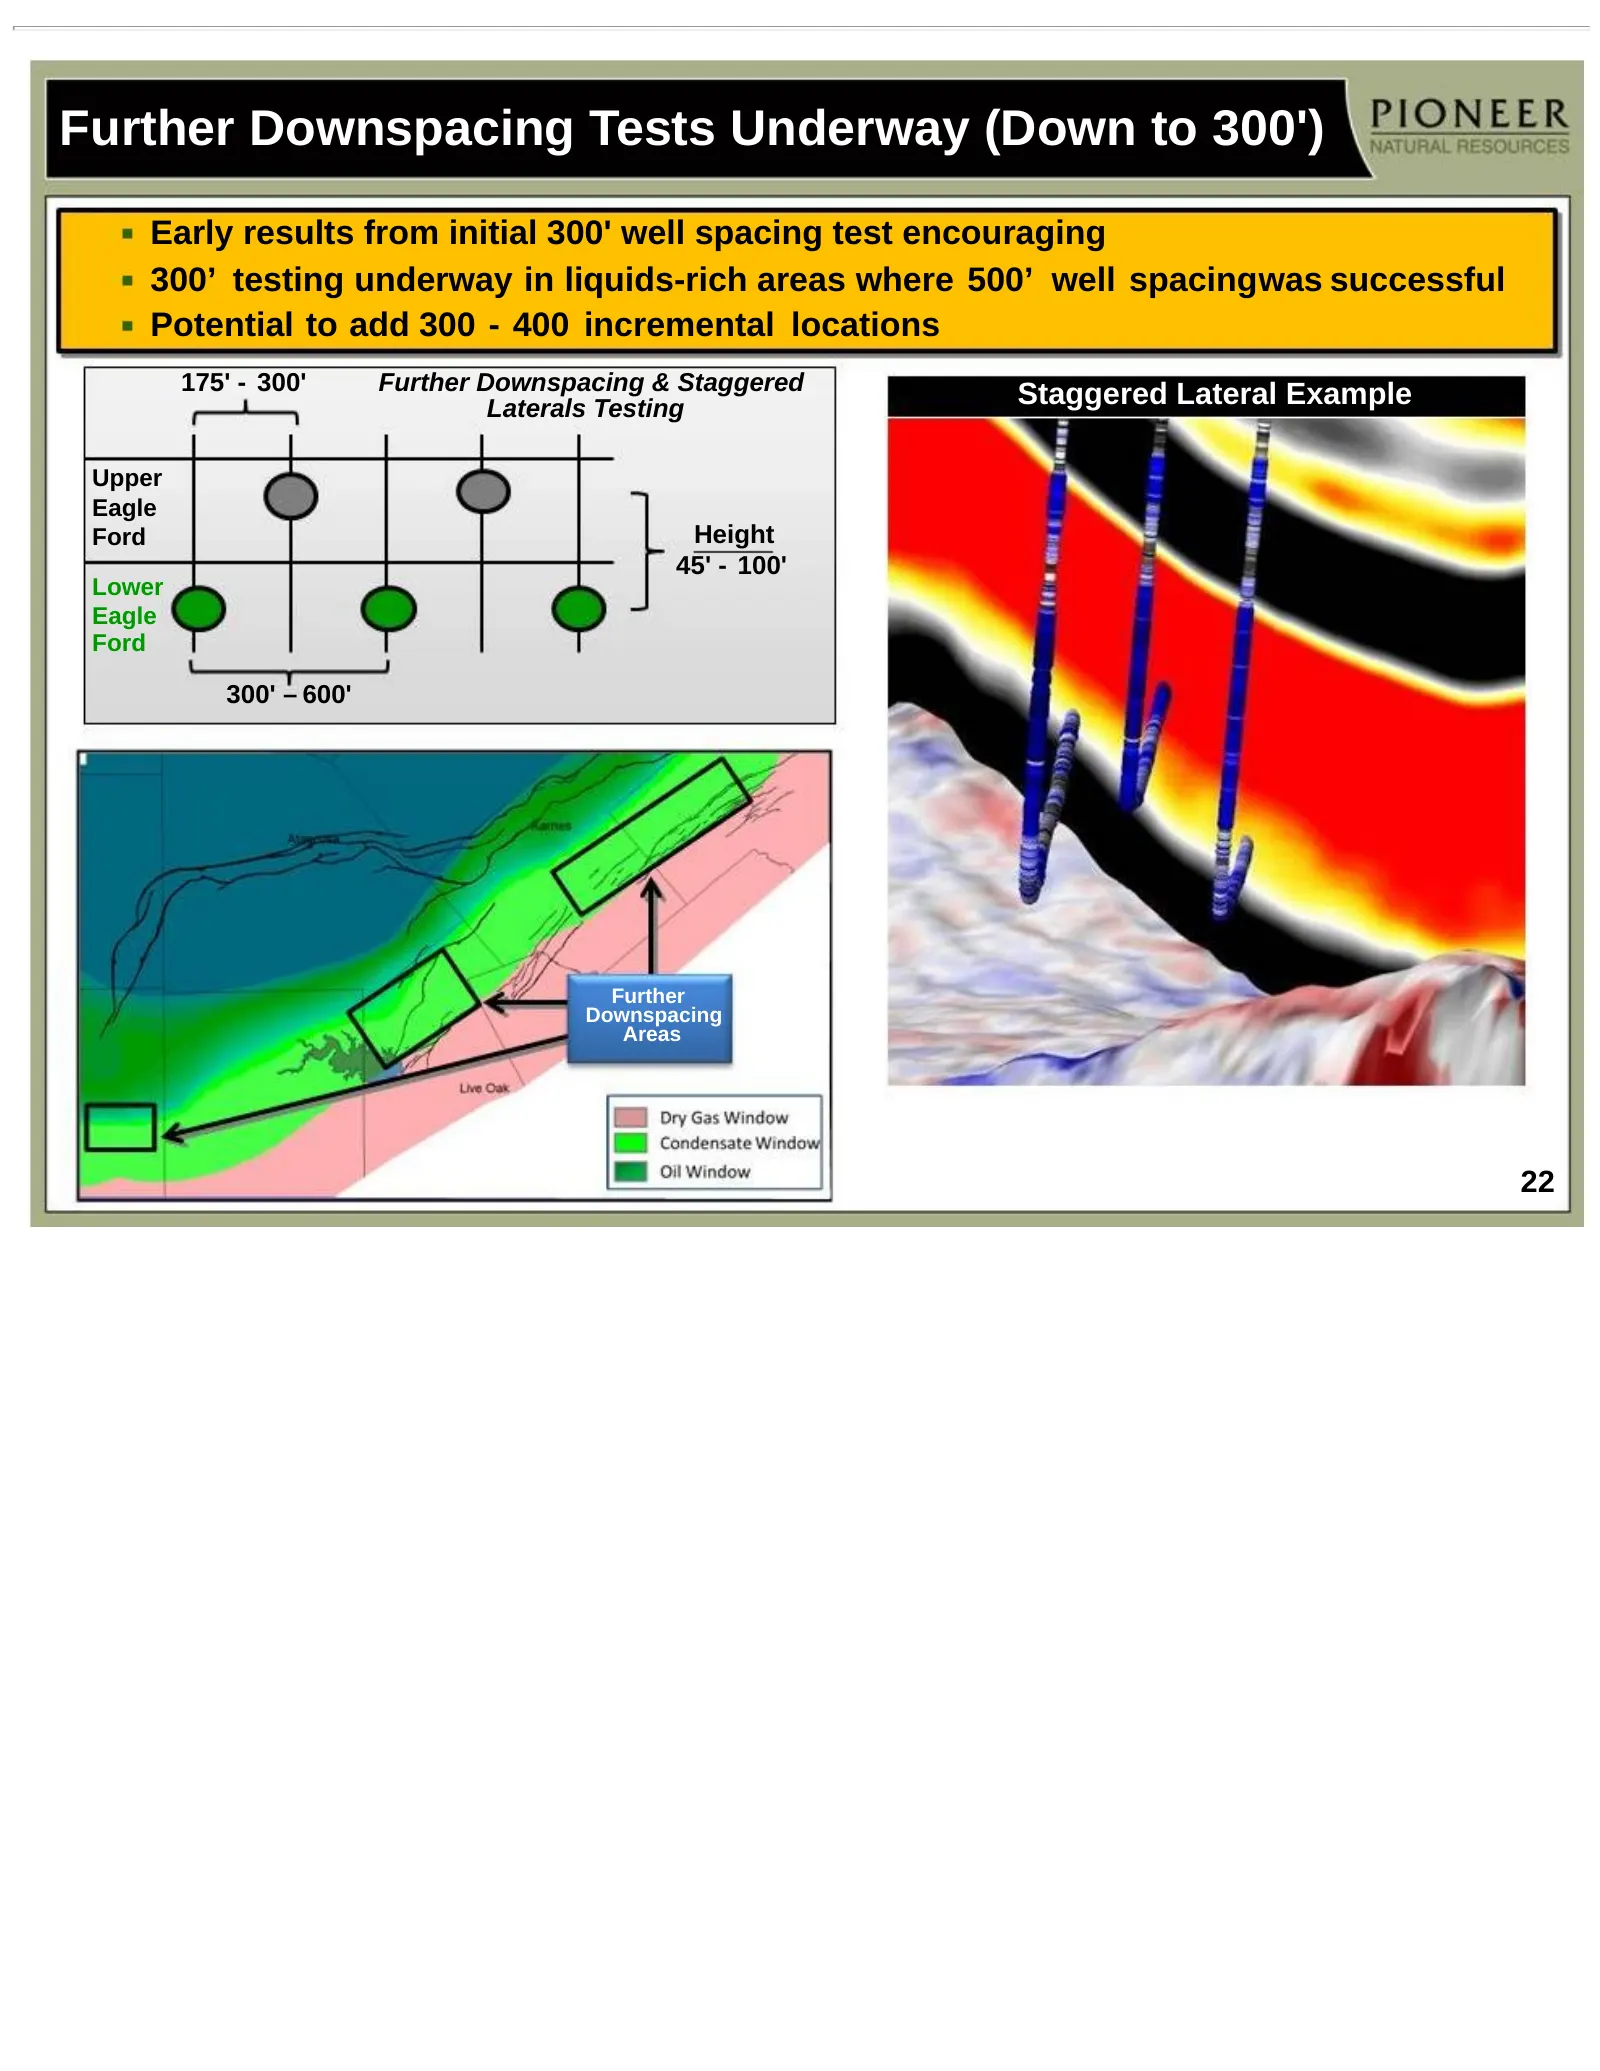
Further Downspacing Tests Underway (Down to 300') Early results from initial 300' well spacing test encouraging 300’ testing underway in liquids-rich areas where 500’ well spacingwas successful Potential to add 300 - 400 incremental locations 175' - 300' Further Downspacing & Staggered Laterals Test
Slide 23: Reducing 2013 Eagle Ford Shale Production Growth Range
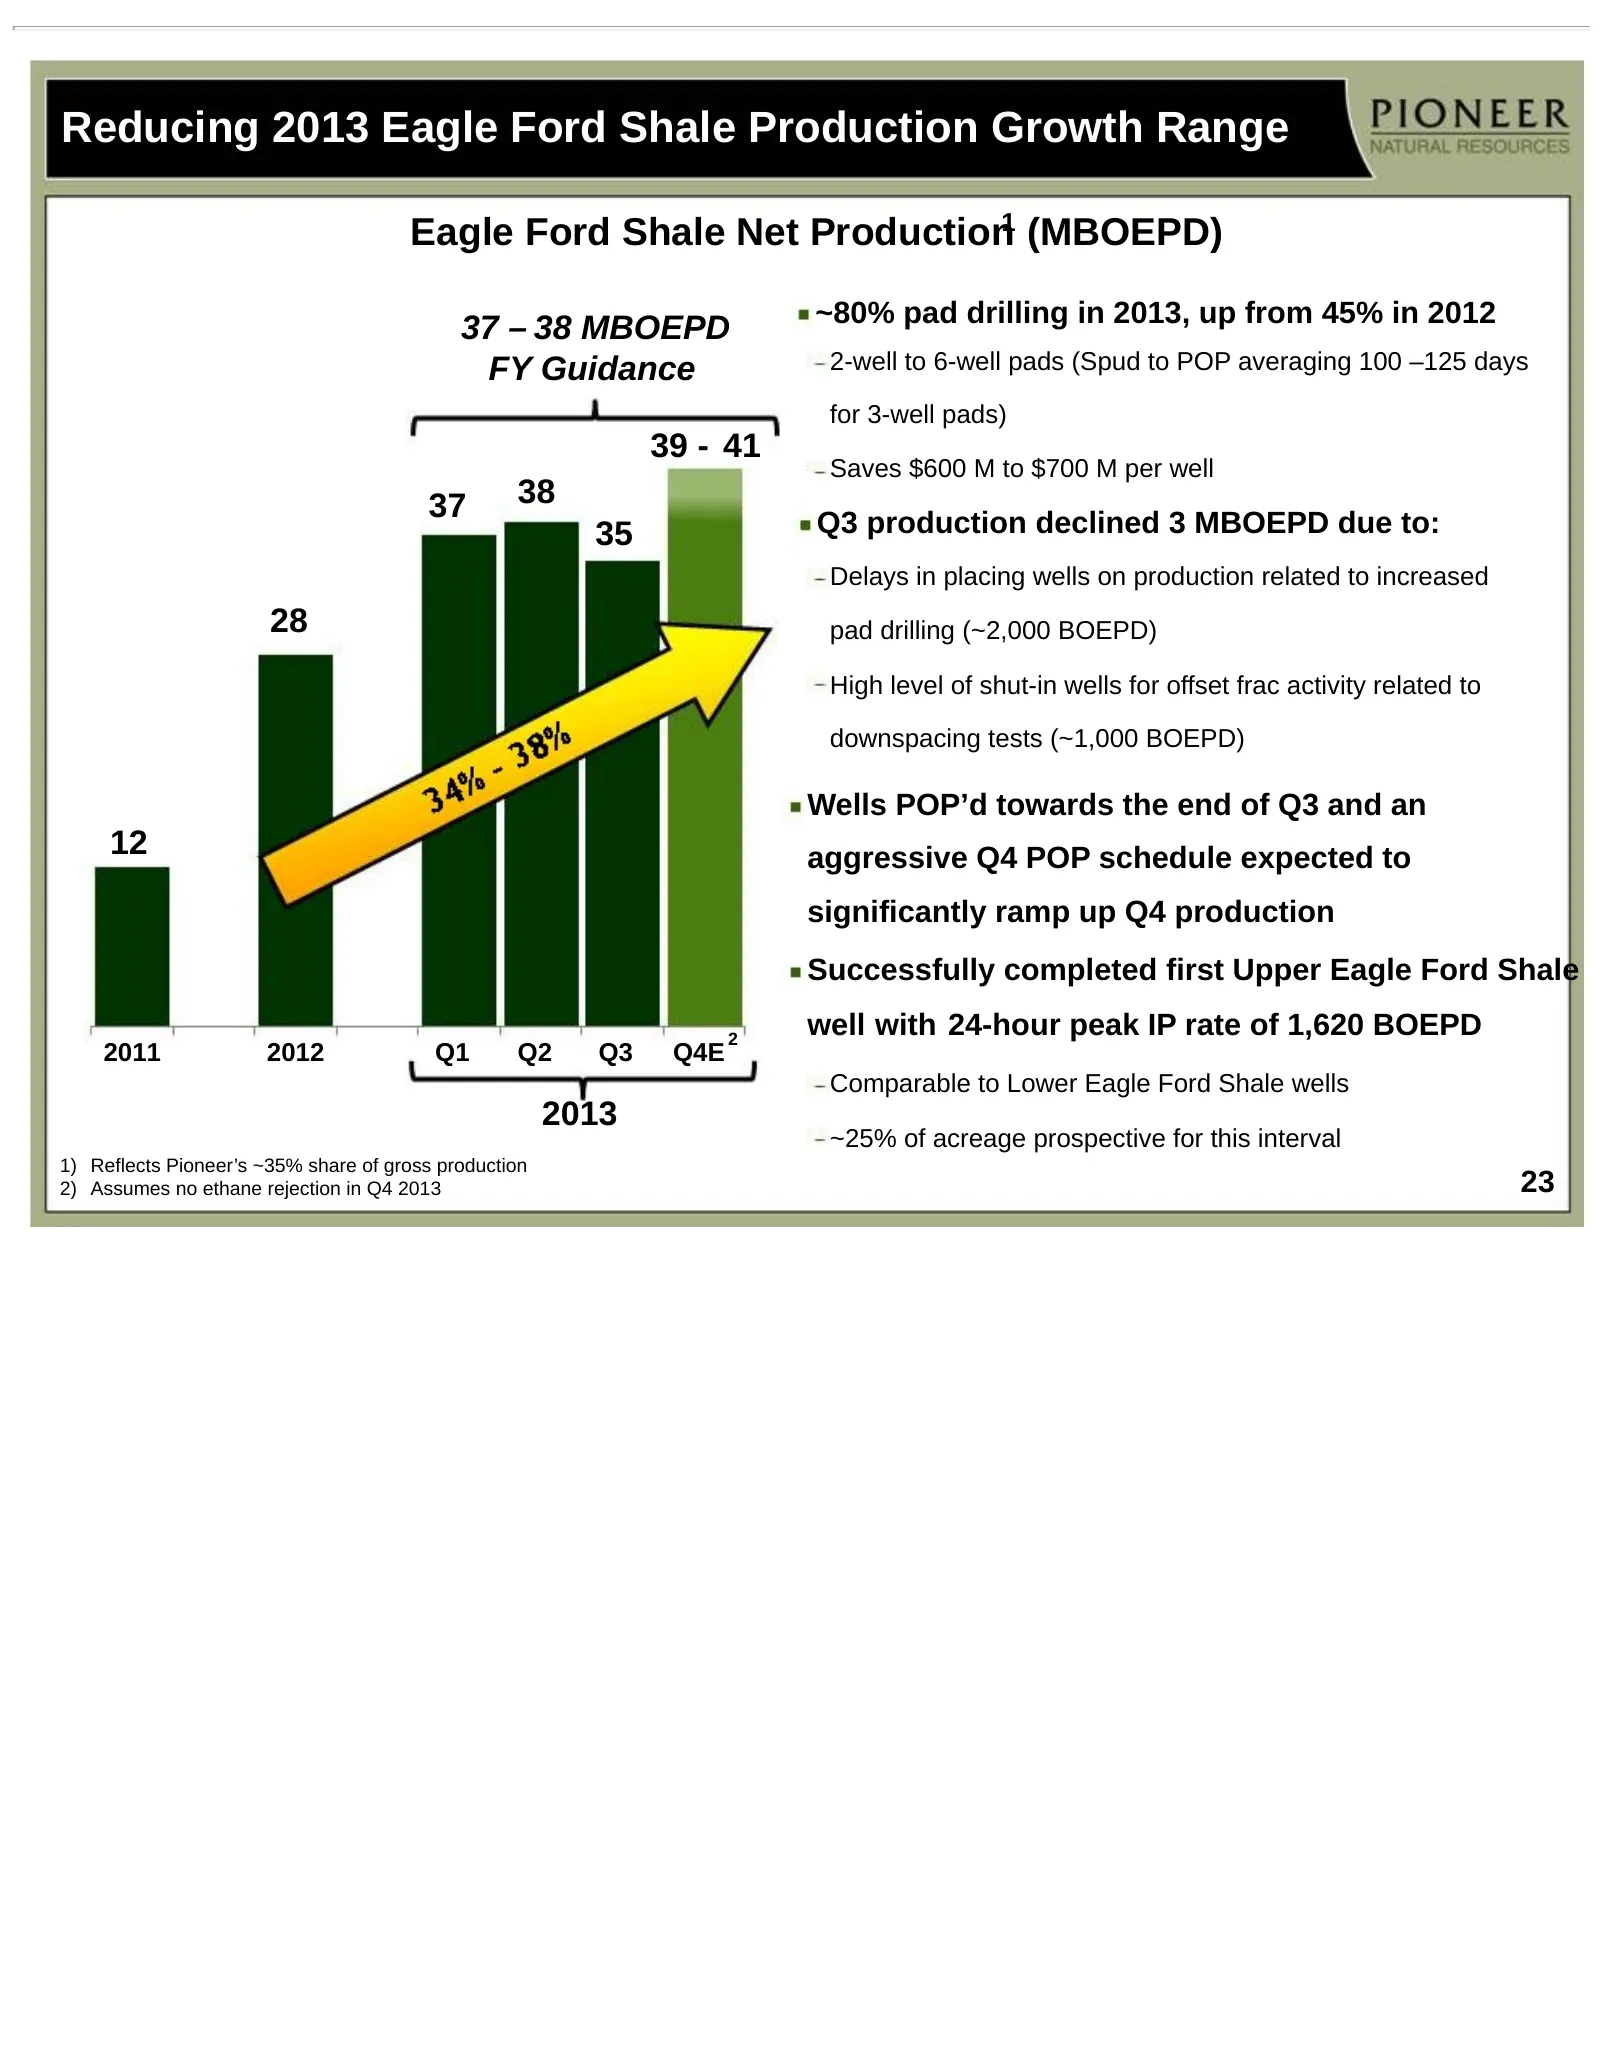
Reducing 2013 Eagle Ford Shale Production Growth Range Eagle Ford Shale Net Production1 (MBOEPD) ~80% pad drilling in 2013, up from 45% in 2012 37 – 38 MBOEPD FY Guidance 2-well to 6-well pads (Spud to POP averaging 100 –125 days for 3-well pads) 39 - 41 Saves $600 M to $700 M per well 37 38 35 Q3 p
Slide 24: PXD Investment Highlights
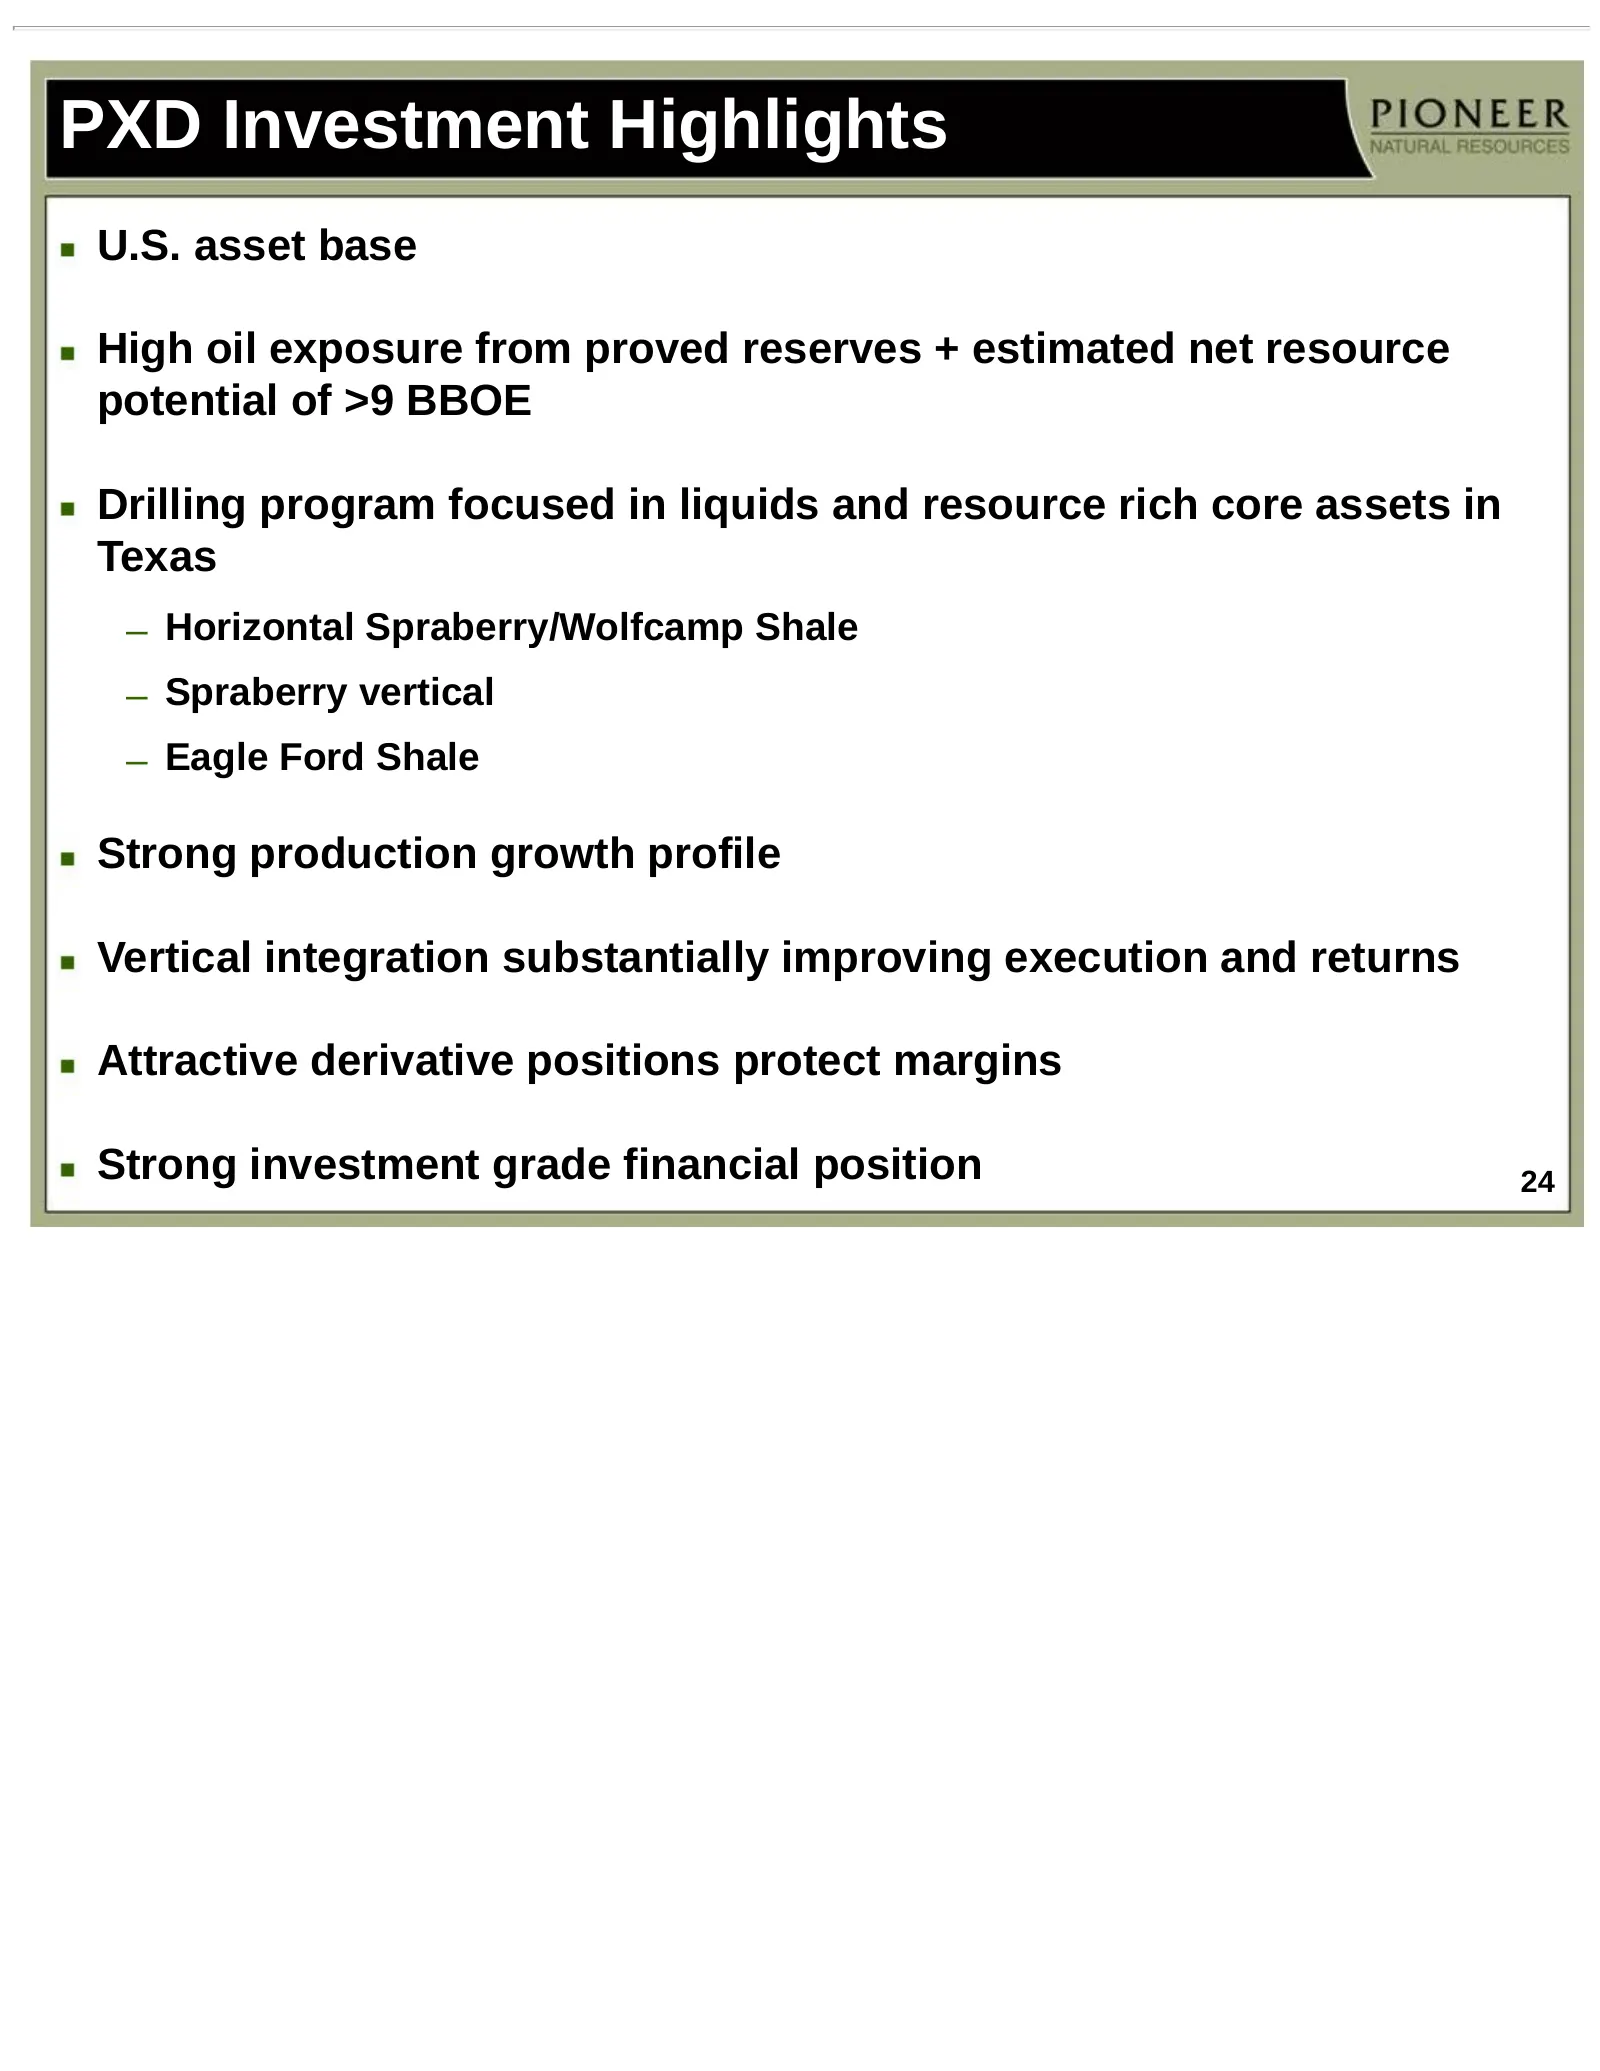
PXD Investment Highlights U.S. asset base High oil exposure from proved reserves + estimated net resource potential of >9 BBOE Drilling program focused in liquids and resource rich core assets in Texas – Horizontal Spraberry/Wolfcamp Shale – Spraberry vertical – Eagle Ford Shale Strong production gr
Slide 25: Appendix
Appendix
Slide 26: Pioneer – Large Independent U.S. E&P Company
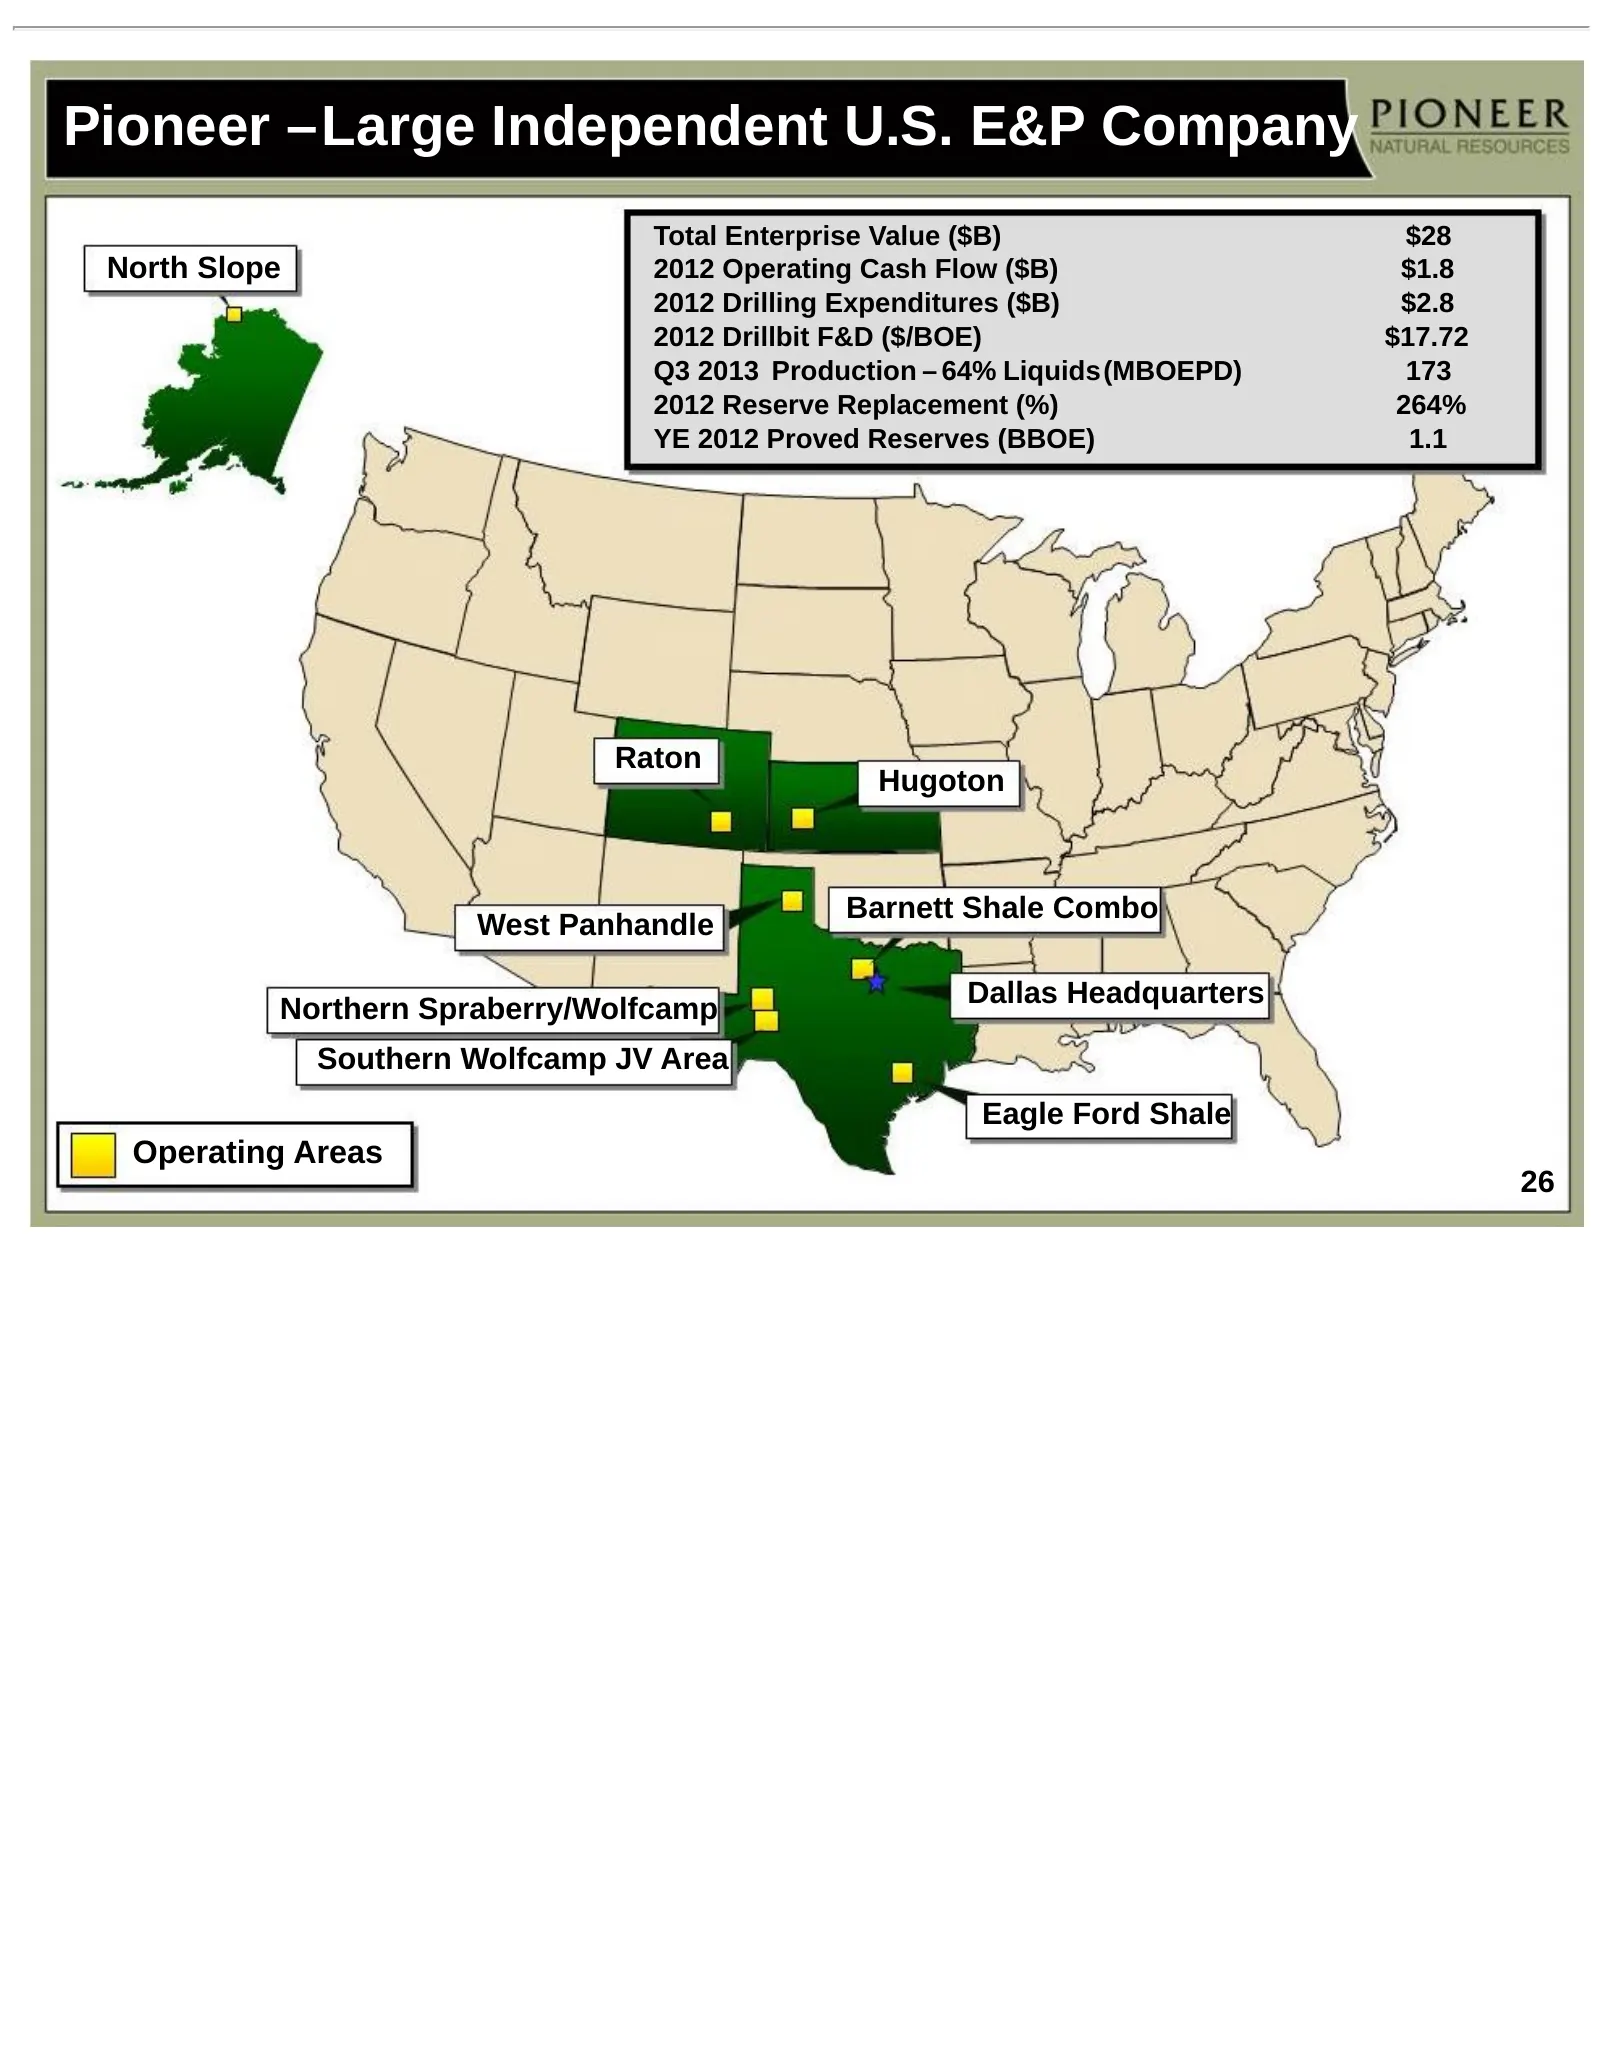
Pioneer –Large Independent U.S. E&P Company Total Enterprise Value ($B) $28 North Slope 2012 Operating Cash Flow ($B) $1.8 2012 Drilling Expenditures ($B) $2.8 2012 Drillbit F&D ($/BOE) $17.72 Q3 2013 Production – 64% Liquids(MBOEPD) 173 2012 Reserve Replacement (%) 264% YE 2012 Proved Reserves (BBO
Slide 27: Production (MBOEPD)
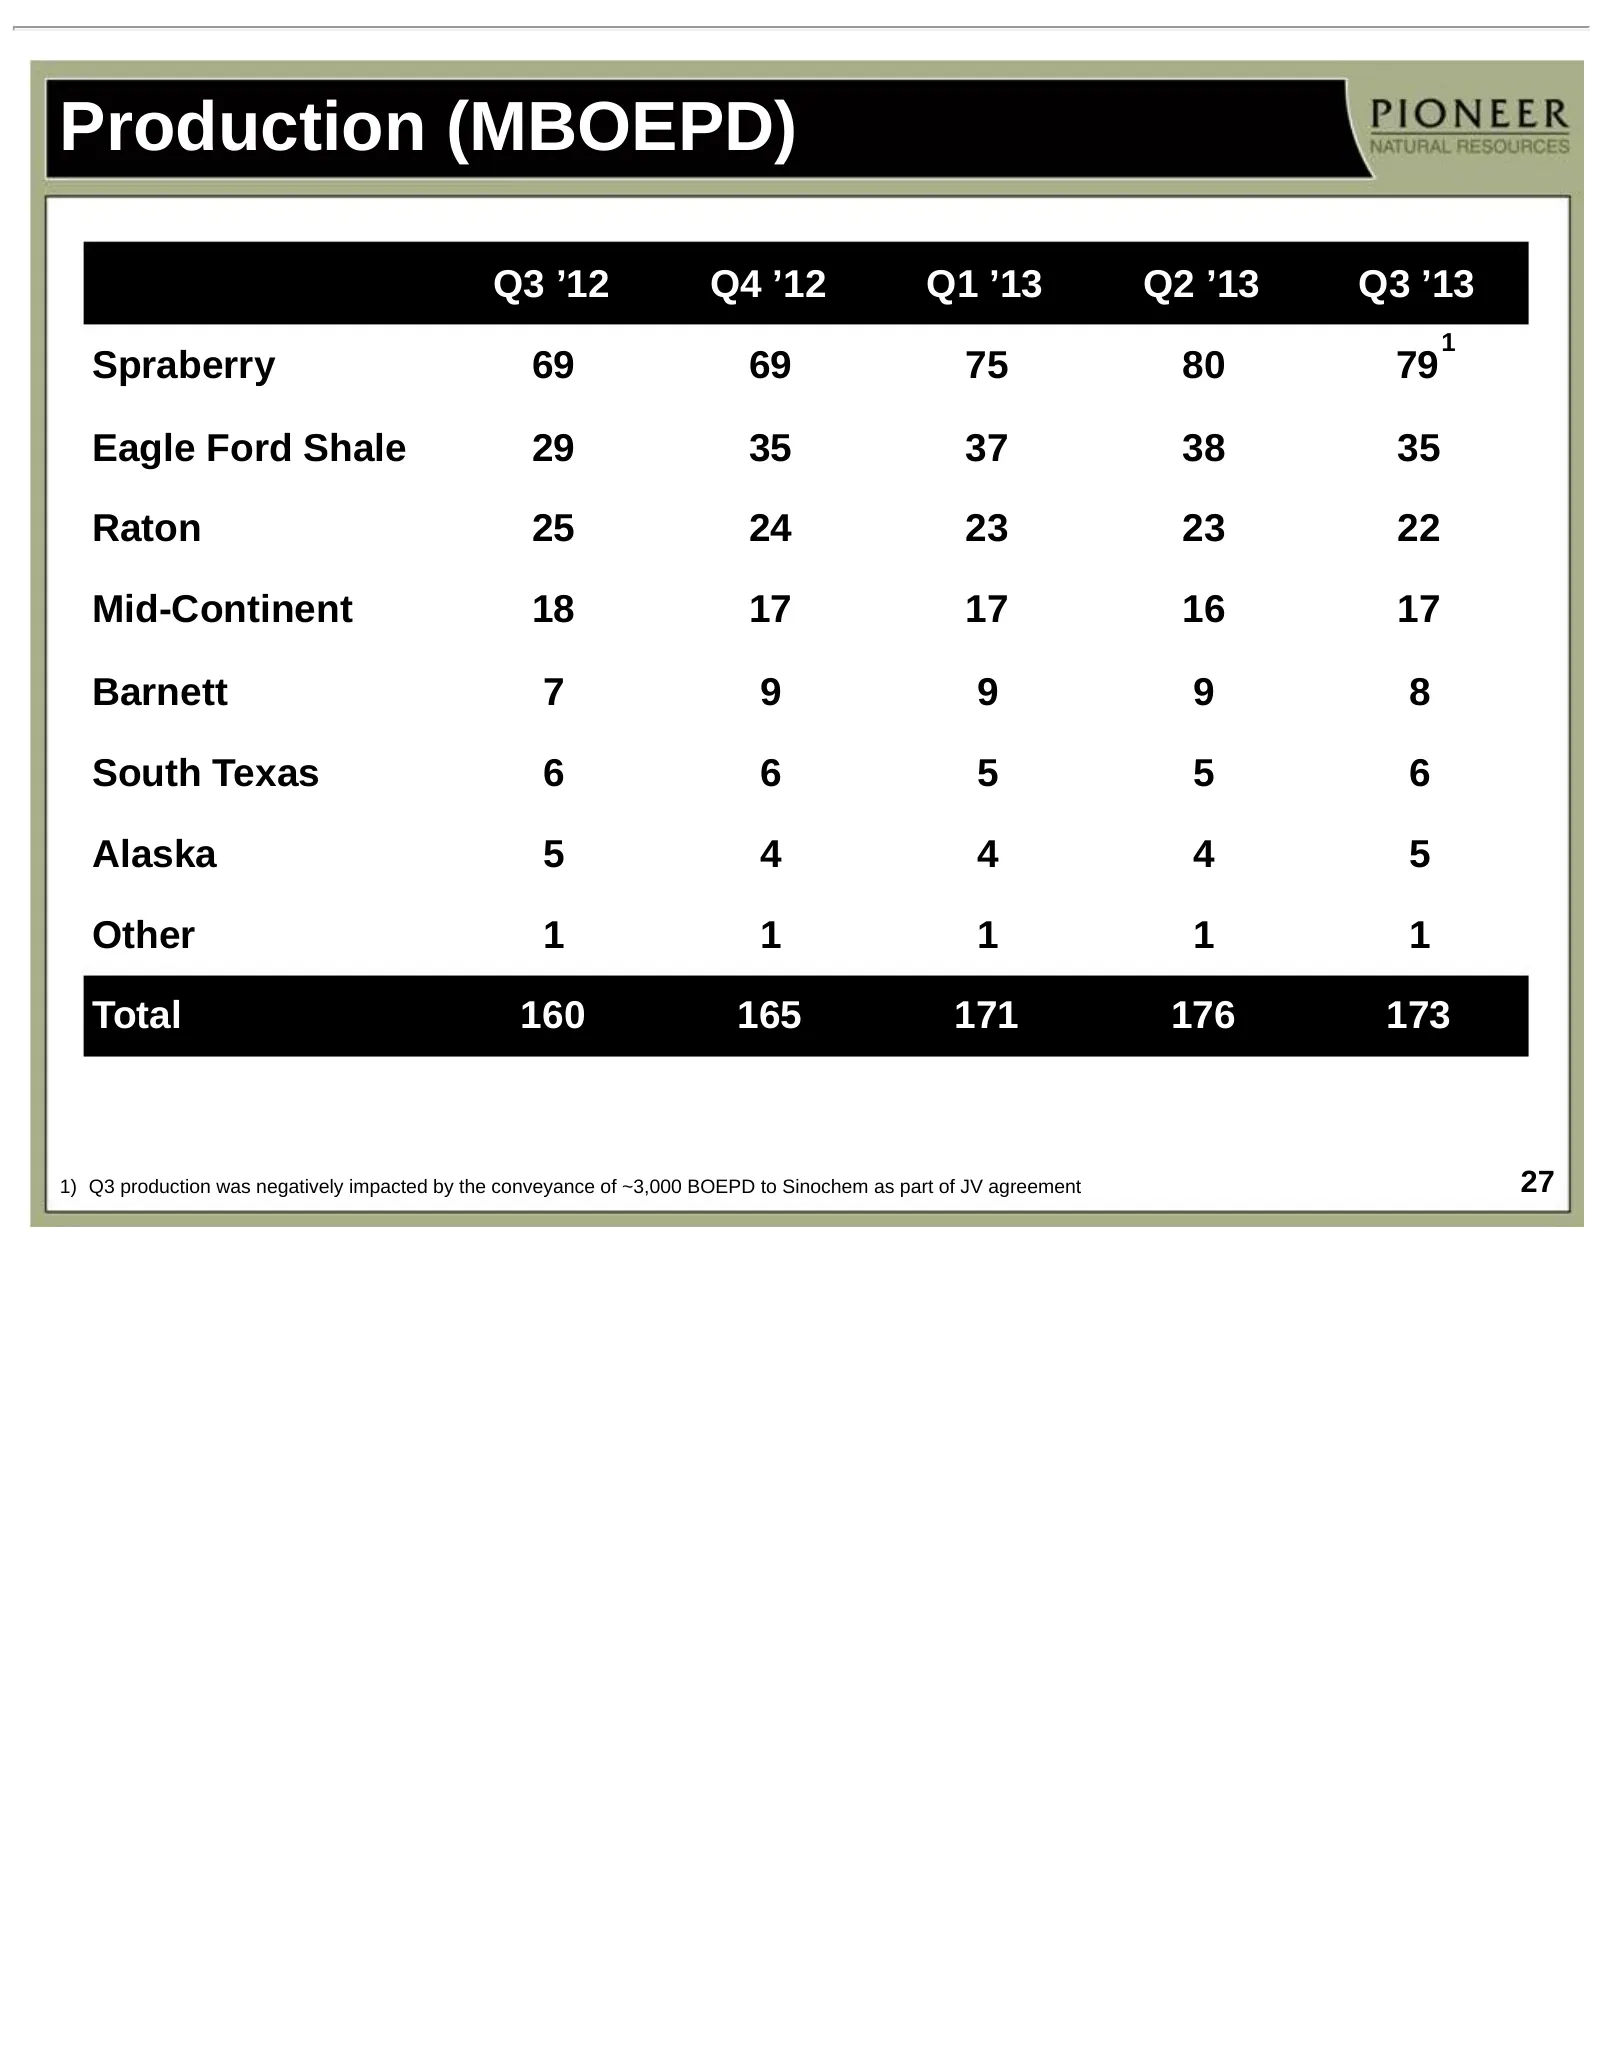
Production (MBOEPD) Q3 ’12 Q4 ’12 Q1 ’13 Q2 ’13 Q3 ’13 1 Spraberry 69 69 75 80 79 Eagle Ford Shale 29 35 37 38 35 Raton 25 24 23 23 22 Mid-Continent 18 17 17 16 17 Barnett 7 9 9 9 8 South Texas 6 6 5 5 6 Alaska 5 4 4 4 5 Other 1 1 1 1 1 Total 160 165 171 176 173 1) Q3 production was negatively impac
Slide 28: PXD Production By Commodity By Area
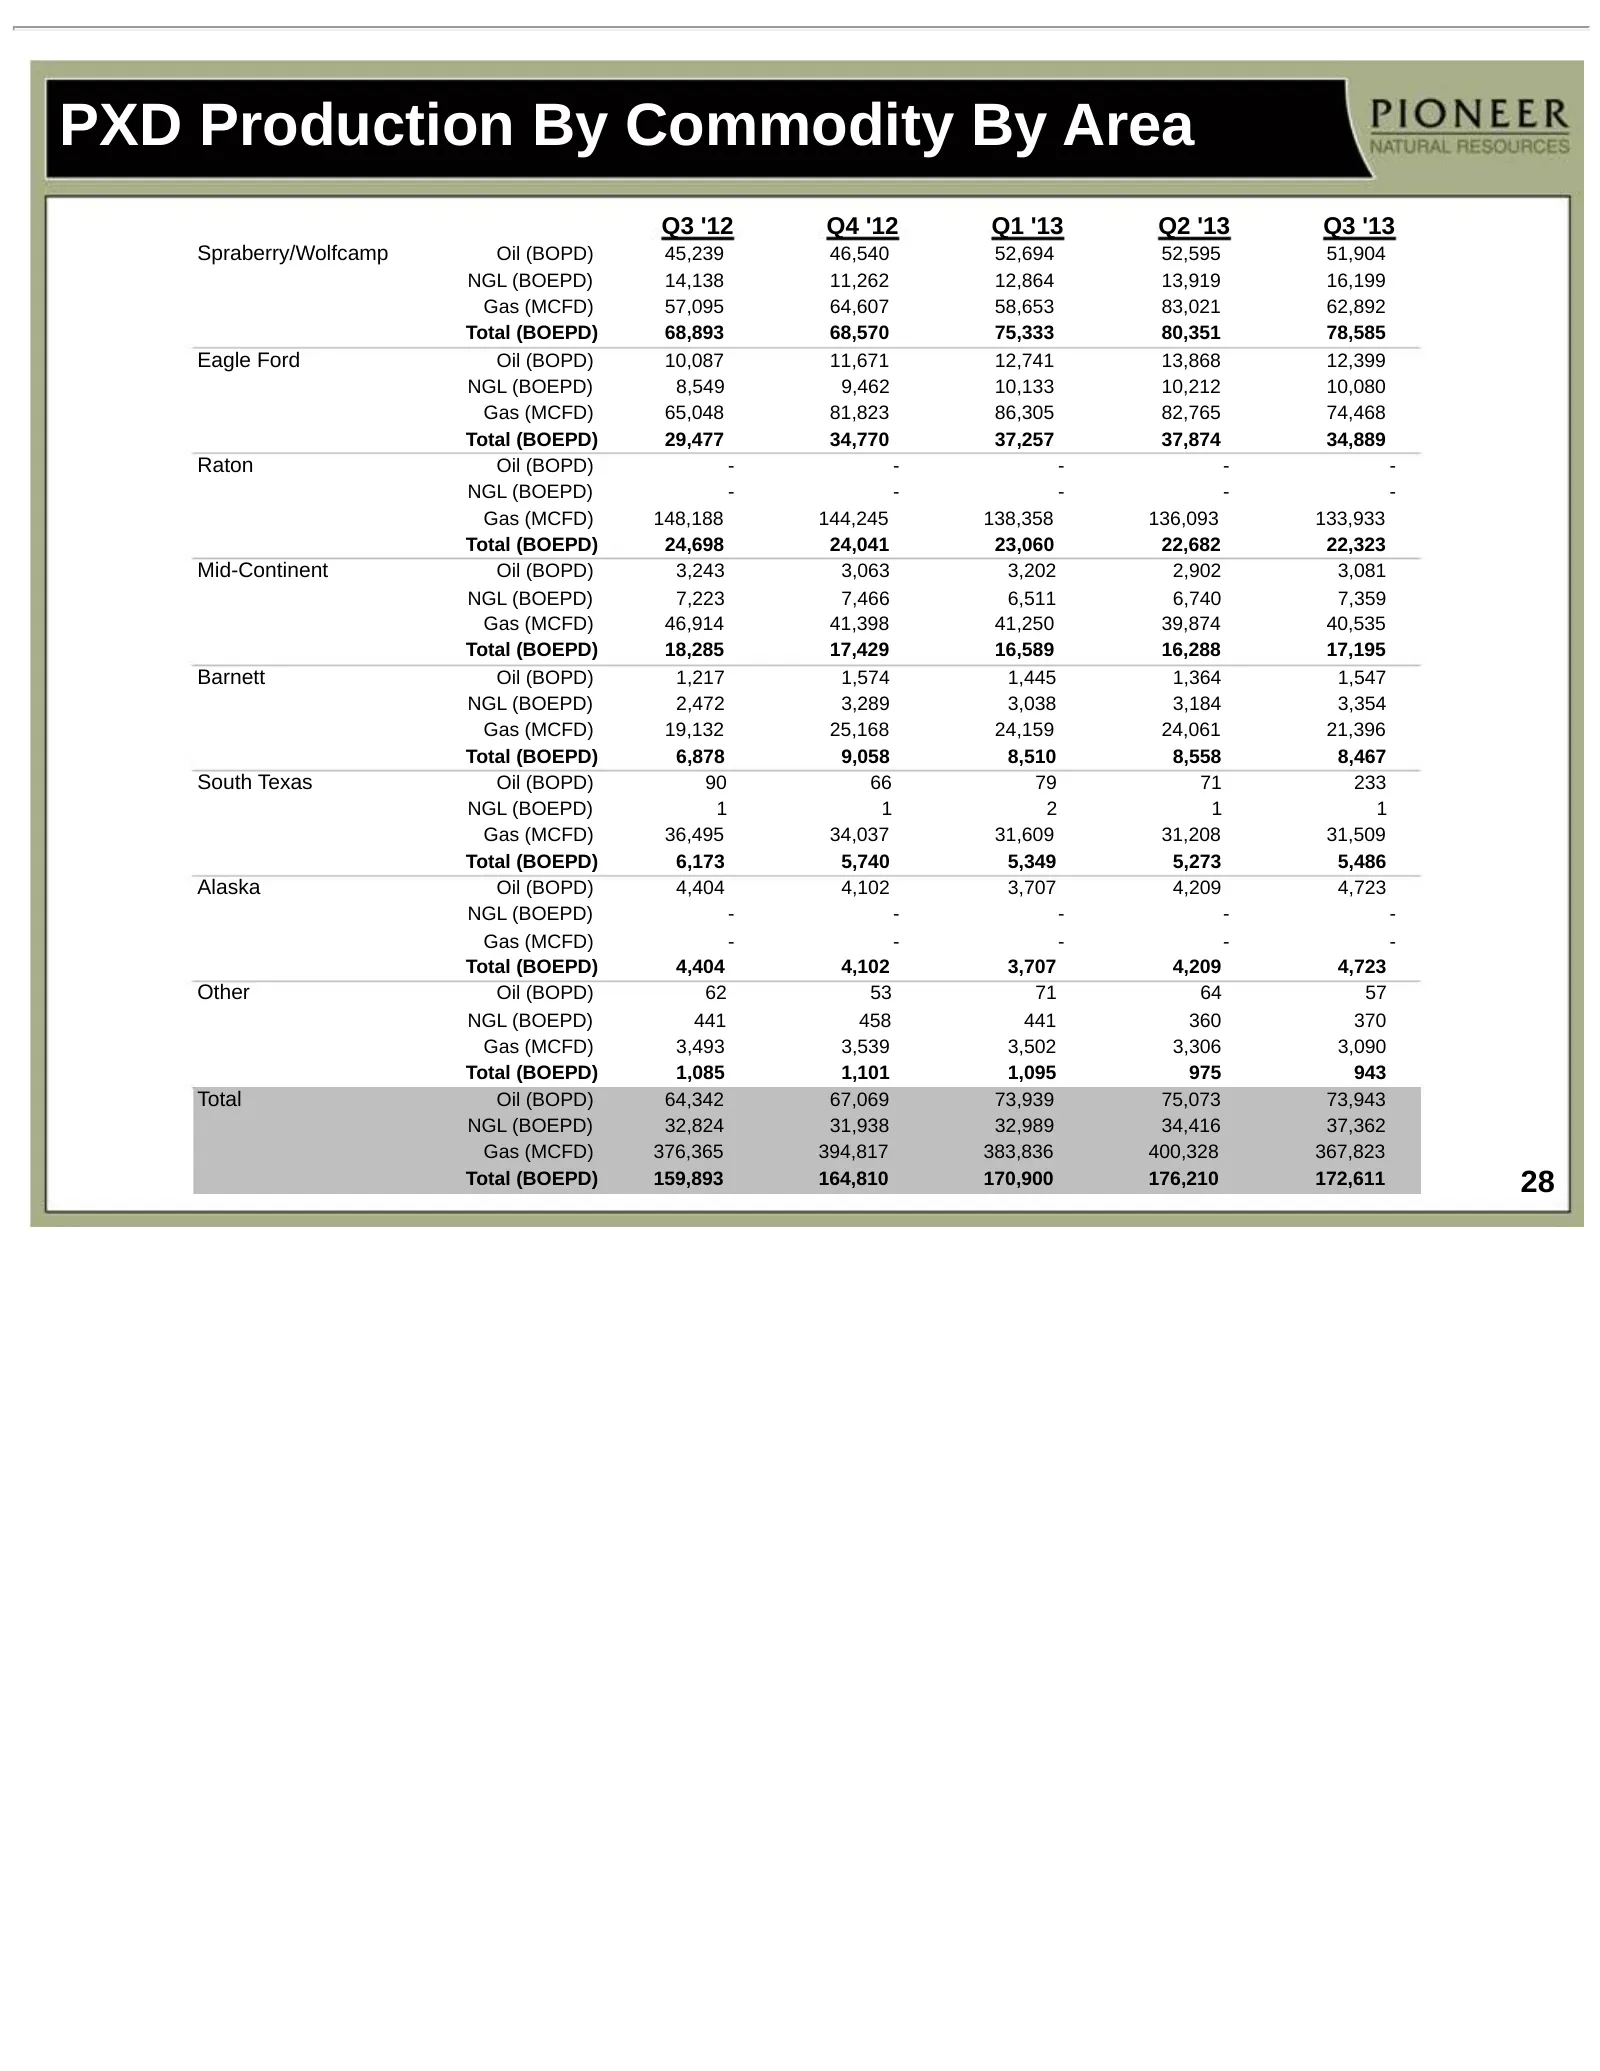
PXD Production By Commodity By Area Q3 '12 Q4 '12 Q1 '13 Q2 '13 Q3 '13 Spraberry/Wolfcamp Oil (BOPD) 45,239 46,540 52,694 52,595 51,904 NGL (BOEPD) 14,138 11,262 12,864 13,919 16,199 Gas (MCFD) 57,095 64,607 58,653 83,021 62,892 Total (BOEPD) 68,893 68,570 75,333 80,351 78,585 Eagle Ford Oil (BOPD)
Slide 29: Production Costs (per BOE)
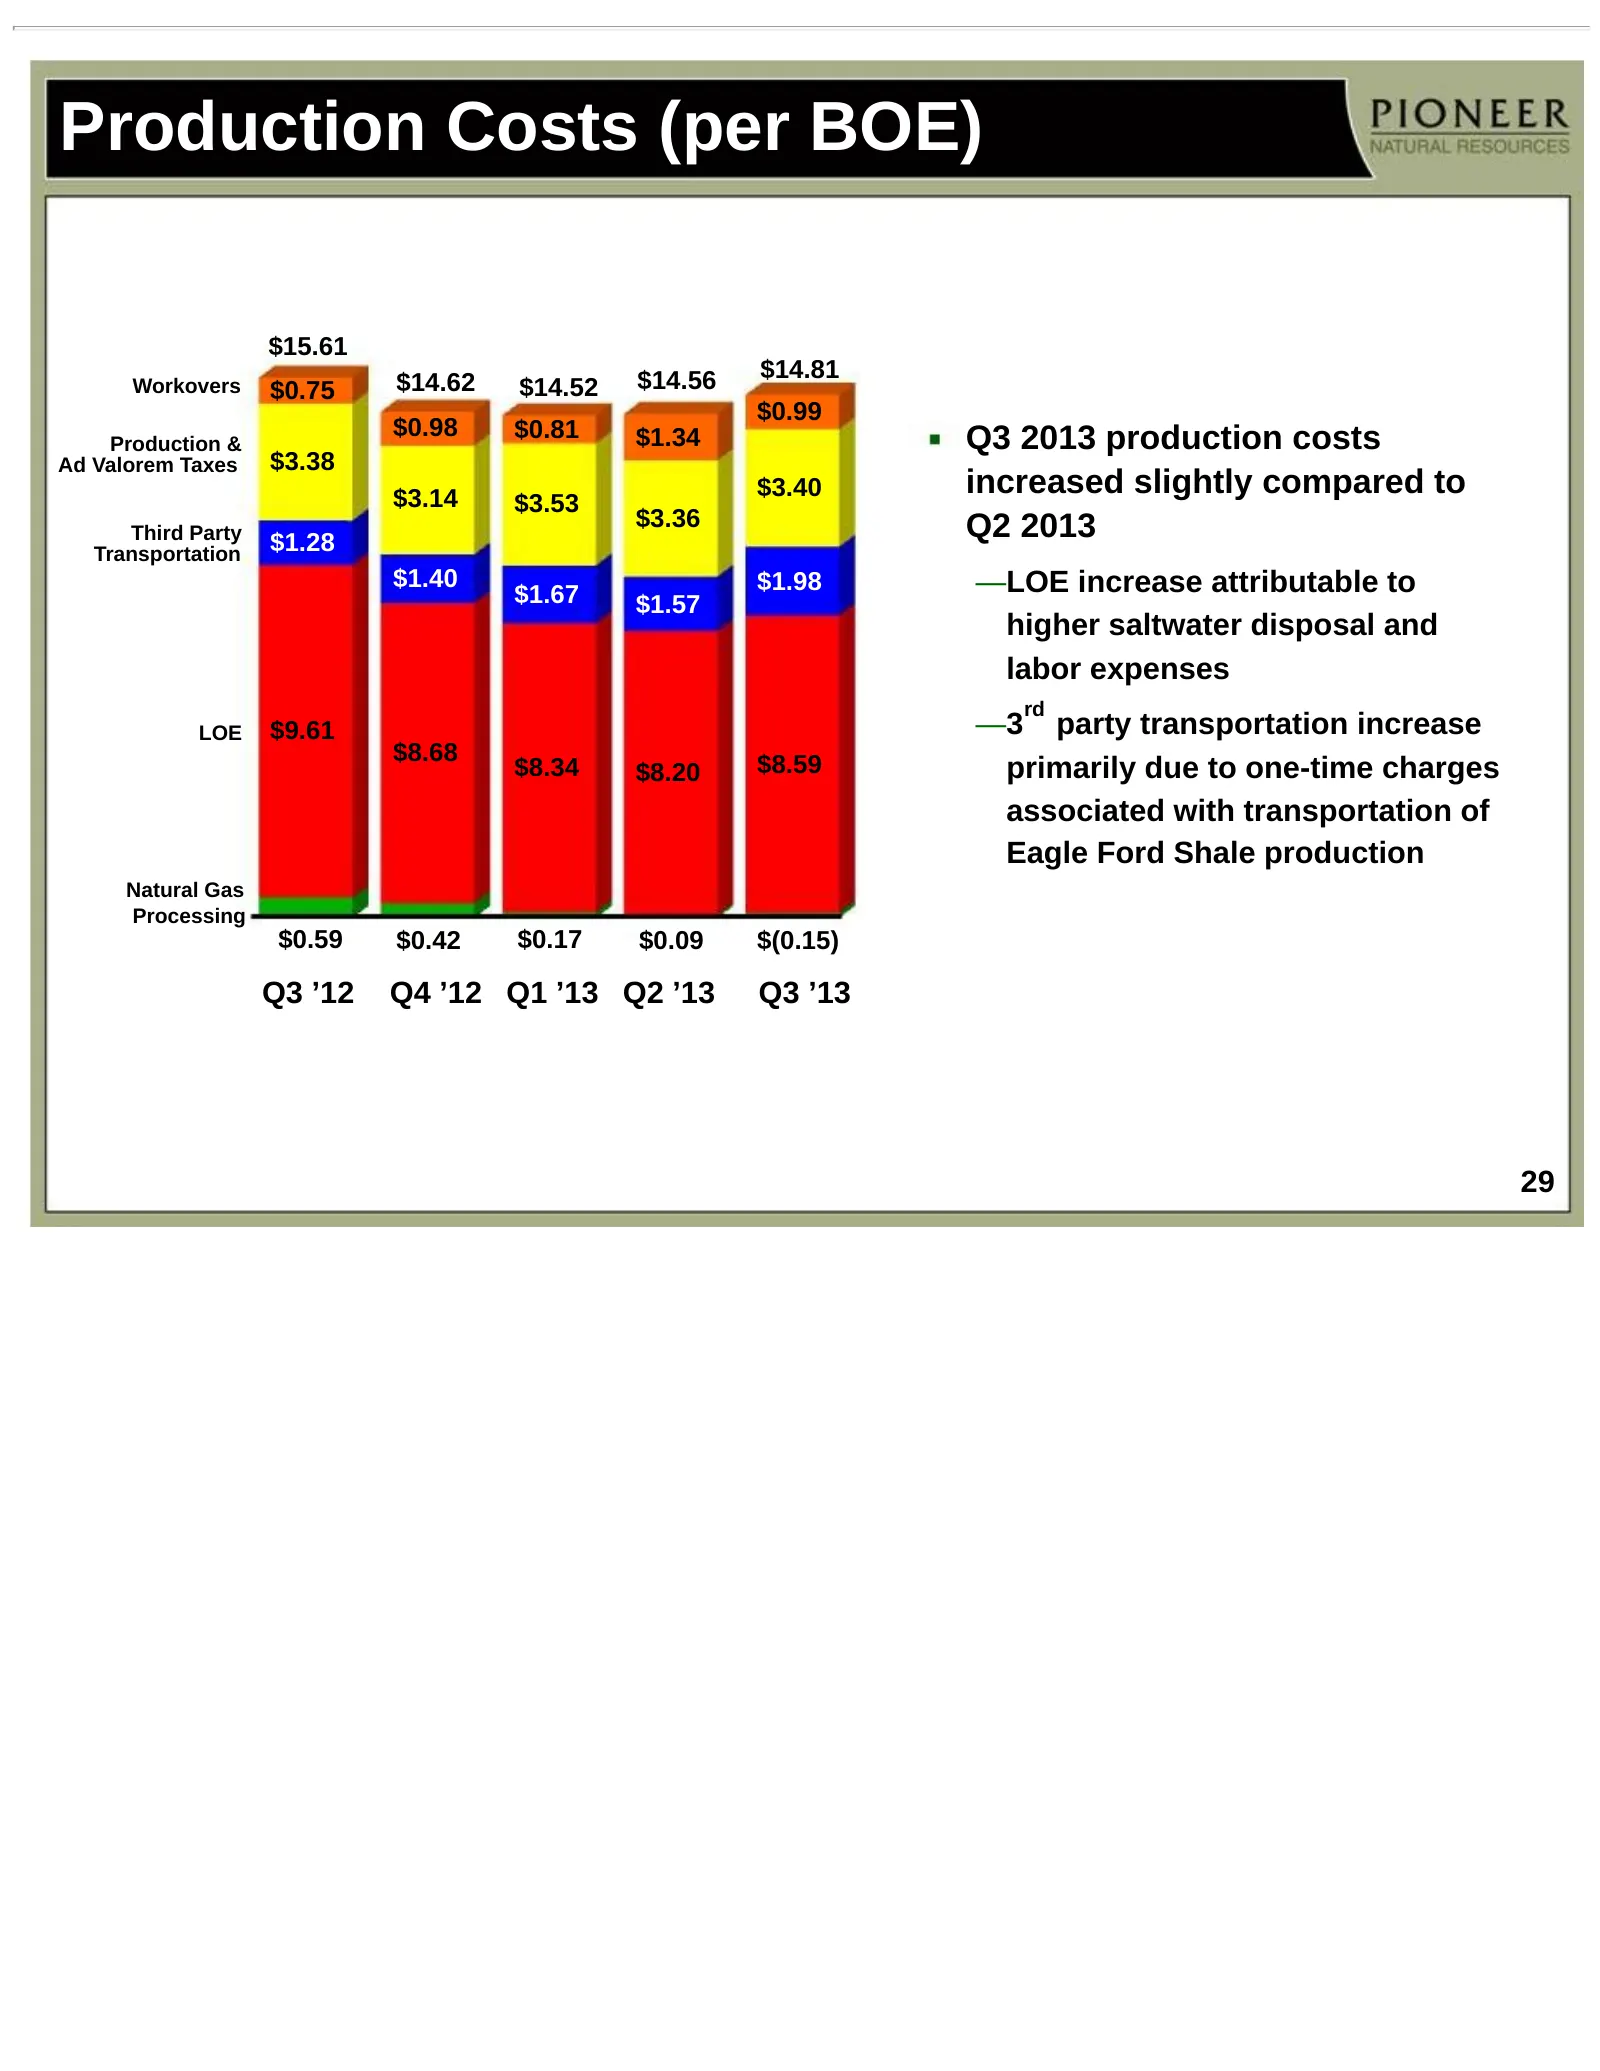
Production Costs (per BOE) $15.61 $14.56 $14.81 Workovers $0.75 $14.62 $14.52 $0.99 $0.98 $0.81 Production & $1.34 Q3 2013 production costs Ad Valorem Taxes $3.38 $3.14 $3.40 increased slightly compared to $3.53 $3.36 Q2 2013 Third Party Transportation $1.28 $1.40 $1.98 —LOE increase attributable to
Slide 30: Derivative Philosophy
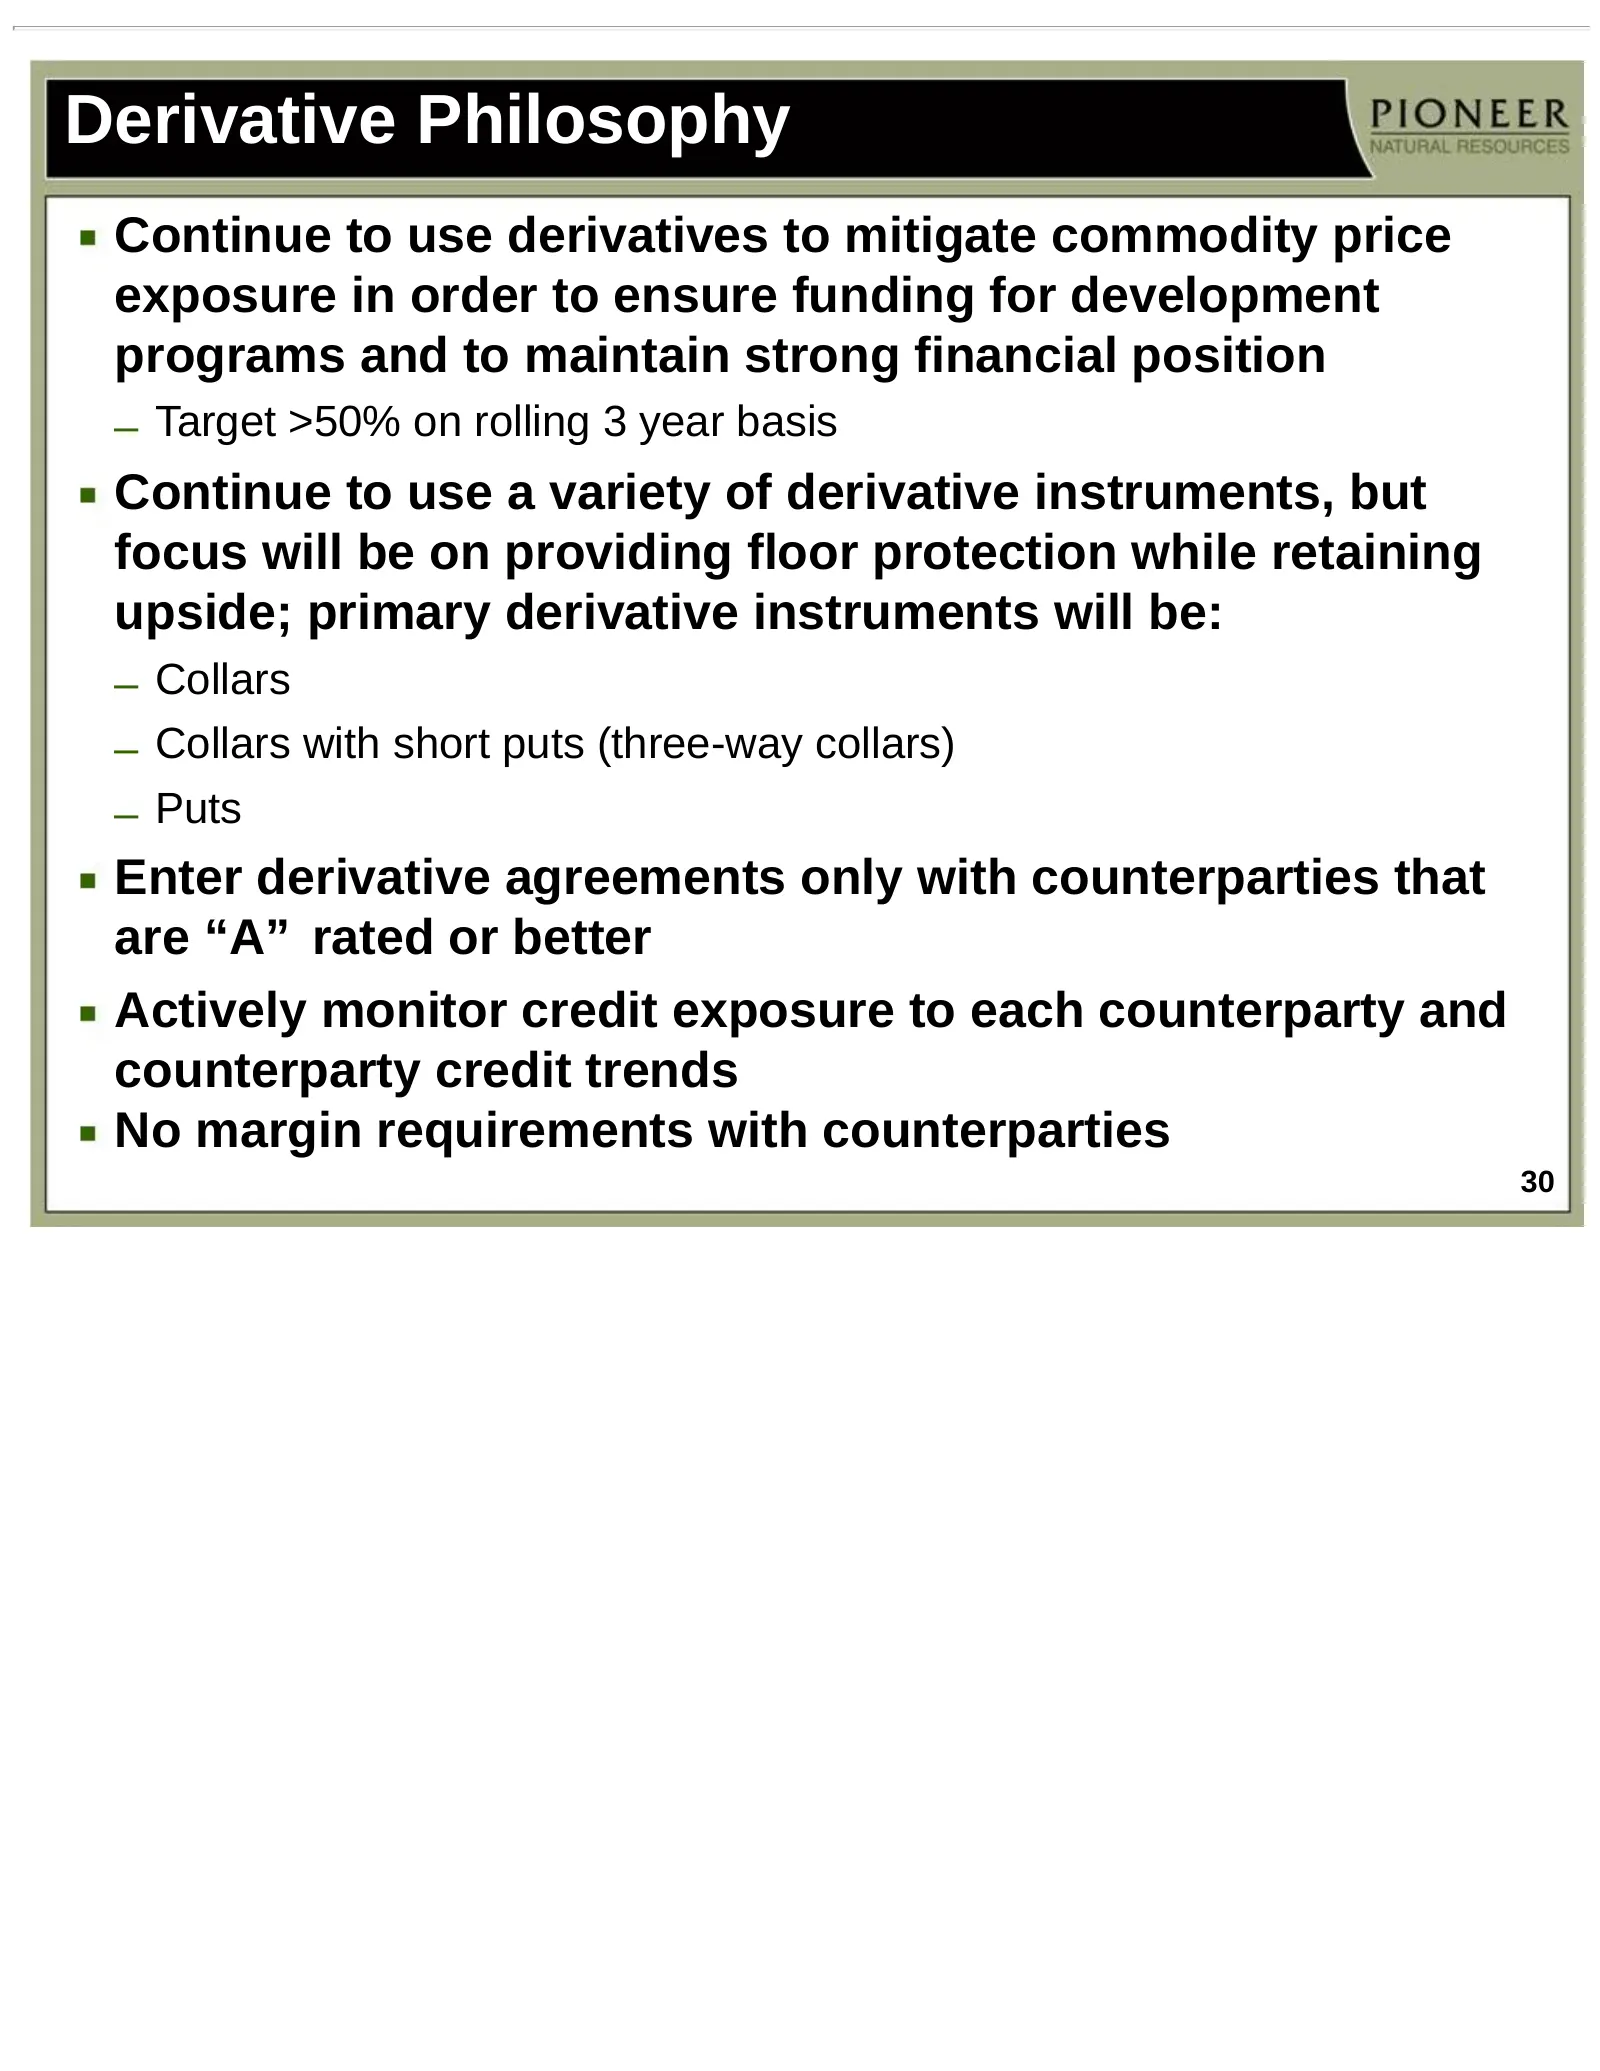
Derivative Philosophy Continue to use derivatives to mitigate commodity price exposure in order to ensure funding for development programs and to maintain strong financial position – Target >50% on rolling 3 year basis Continue to use a variety of derivative instruments, but focus will be on providi
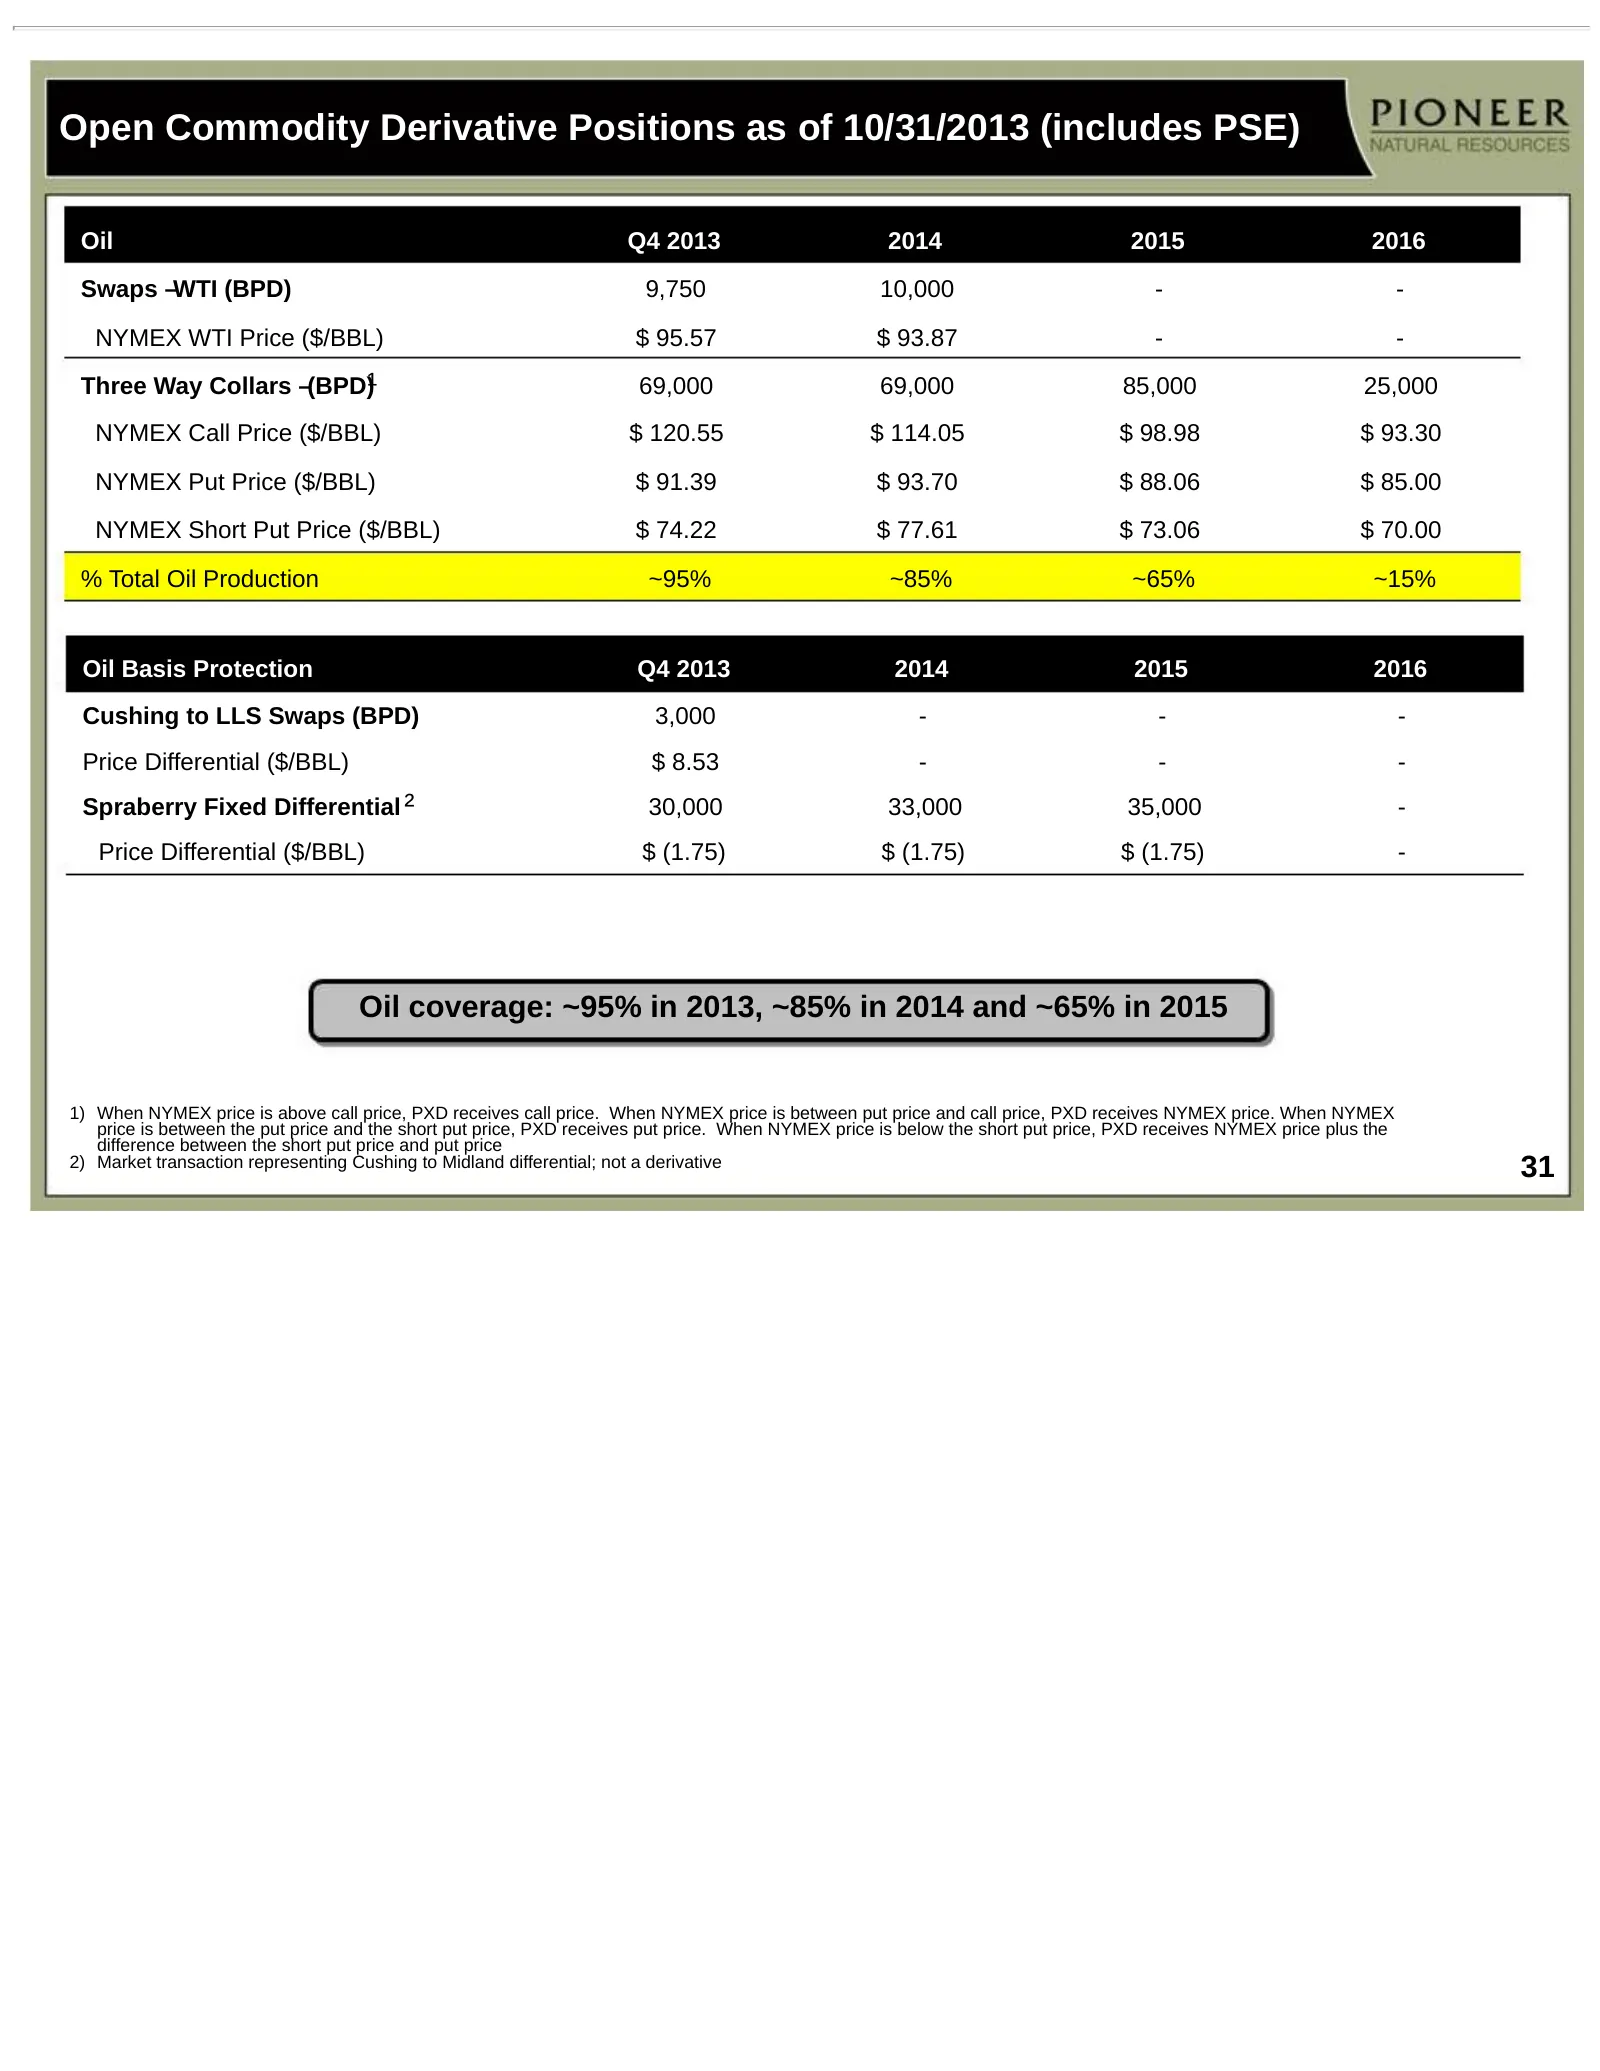
Slide 31: Open Commodity Derivative Positions as of 10/31/2013 (includes PSE)
Open Commodity Derivative Positions as of 10/31/2013 (includes PSE) Oil Q4 2013 2014 2015 2016 Swaps –WTI (BPD) 9,750 10,000 - - NYMEX WTI Price ($/BBL) $ 95.57 $ 93.87 - - Three Way Collars –(BPD)¹ 69,000 69,000 85,000 25,000 NYMEX Call Price ($/BBL) $ 120.55 $ 114.05 $ 98.98 $ 93.30 NYMEX Put Pric
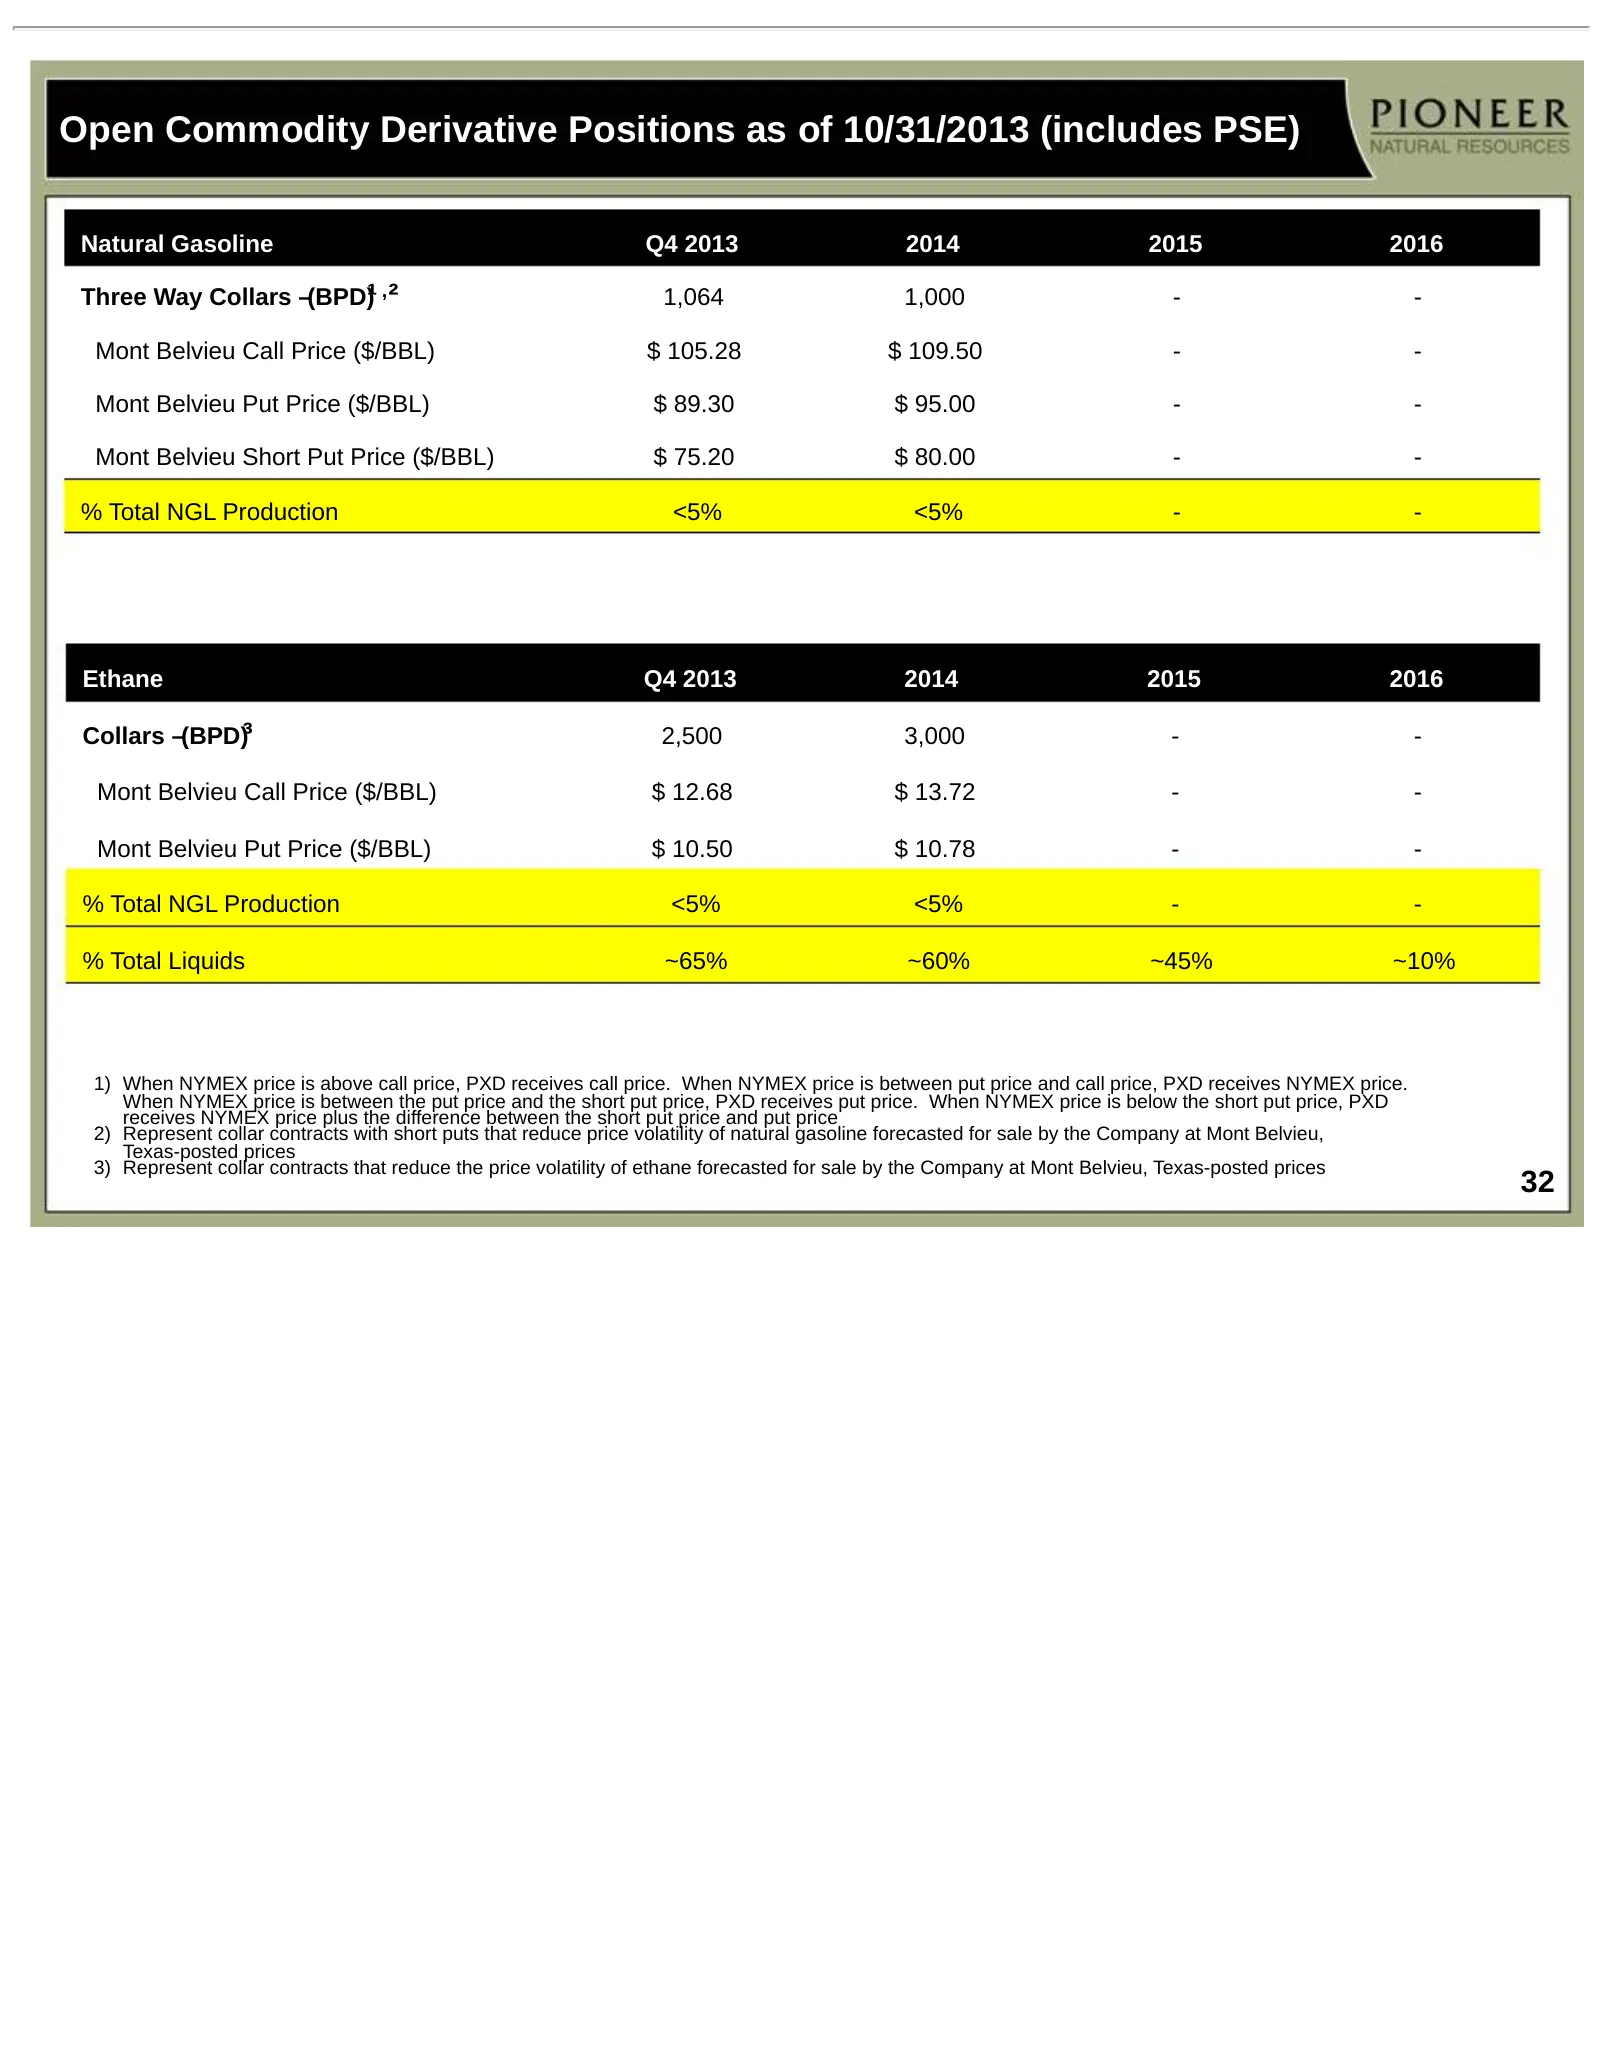
Slide 32: Open Commodity Derivative Positions as of 10/31/2013 (includes PSE)
Open Commodity Derivative Positions as of 10/31/2013 (includes PSE) Natural Gasoline Q4 2013 2014 2015 2016 Three Way Collars –(BPD)¹ , ² 1,064 1,000 - - Mont Belvieu Call Price ($/BBL) $ 105.28 $ 109.50 - - Mont Belvieu Put Price ($/BBL) $ 89.30 $ 95.00 - - Mont Belvieu Short Put Price ($/BBL) $ 75
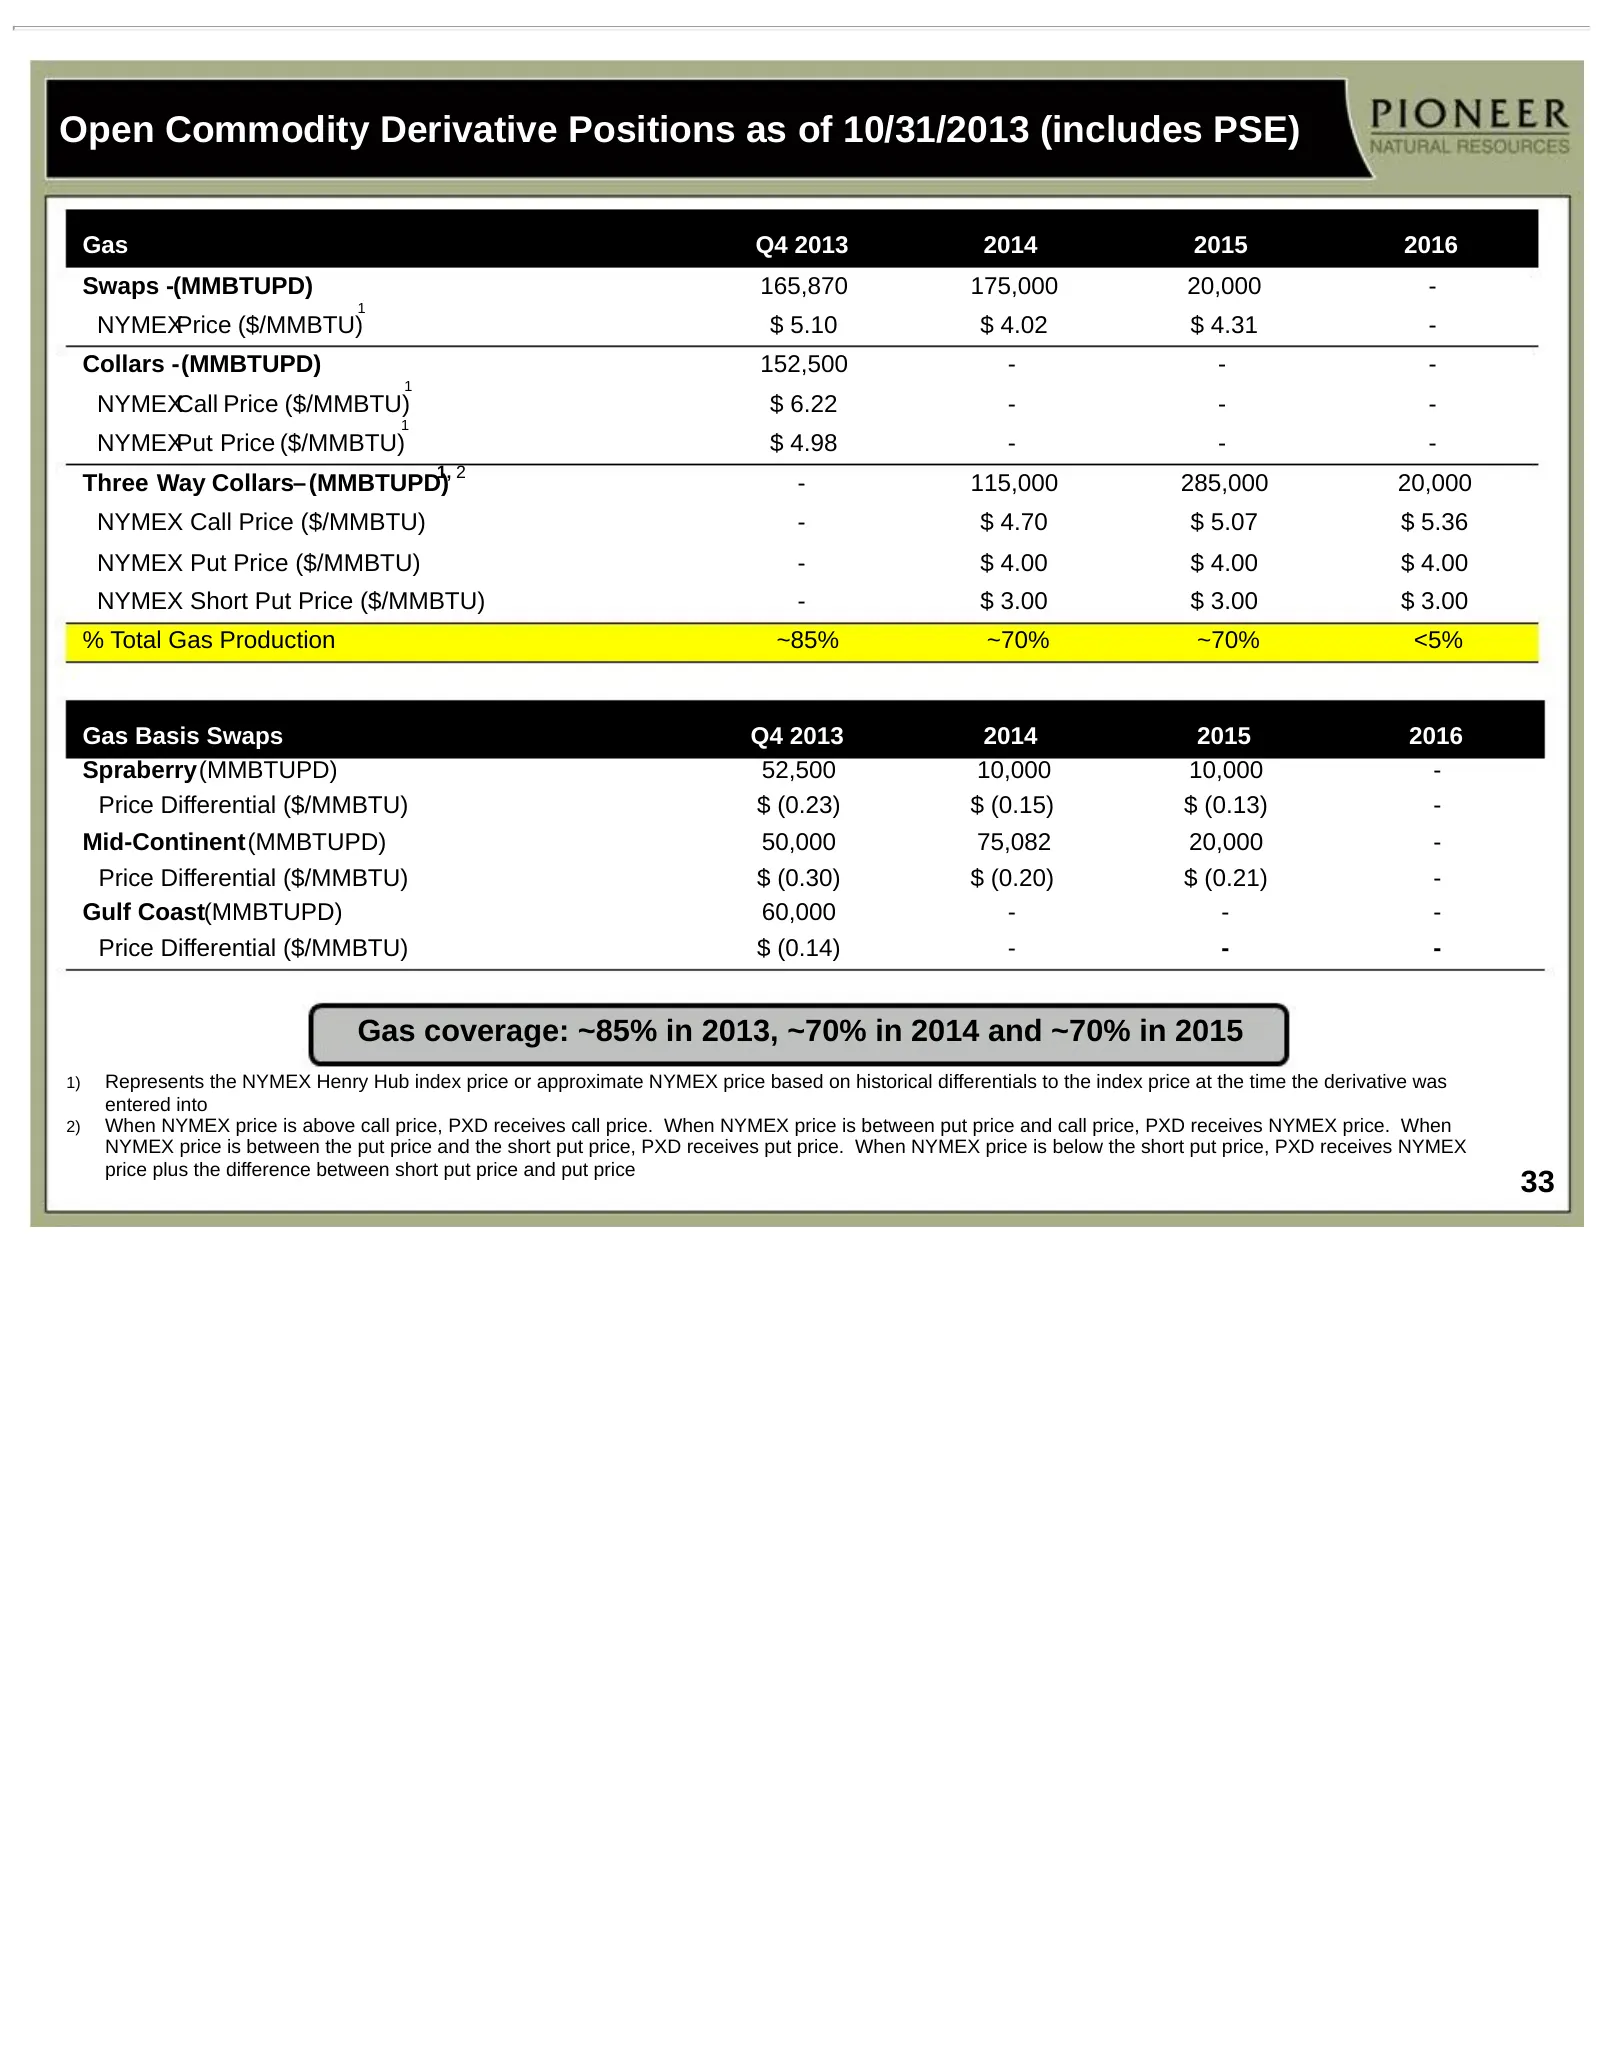
Slide 33: Open Commodity Derivative Positions as of 10/31/2013 (includes PSE)
Open Commodity Derivative Positions as of 10/31/2013 (includes PSE) Gas Q4 2013 2014 2015 2016 Swaps -(MMBTUPD) 165,870 175,000 20,000 - 1 NYMEXPrice ($/MMBTU) $ 5.10 $ 4.02 $ 4.31 - Collars -(MMBTUPD) 152,500 - - - 1 NYMEXCall Price ($/MMBTU) $ 6.22 - - - 1 NYMEXPut Price ($/MMBTU) $ 4.98 - - - 1,
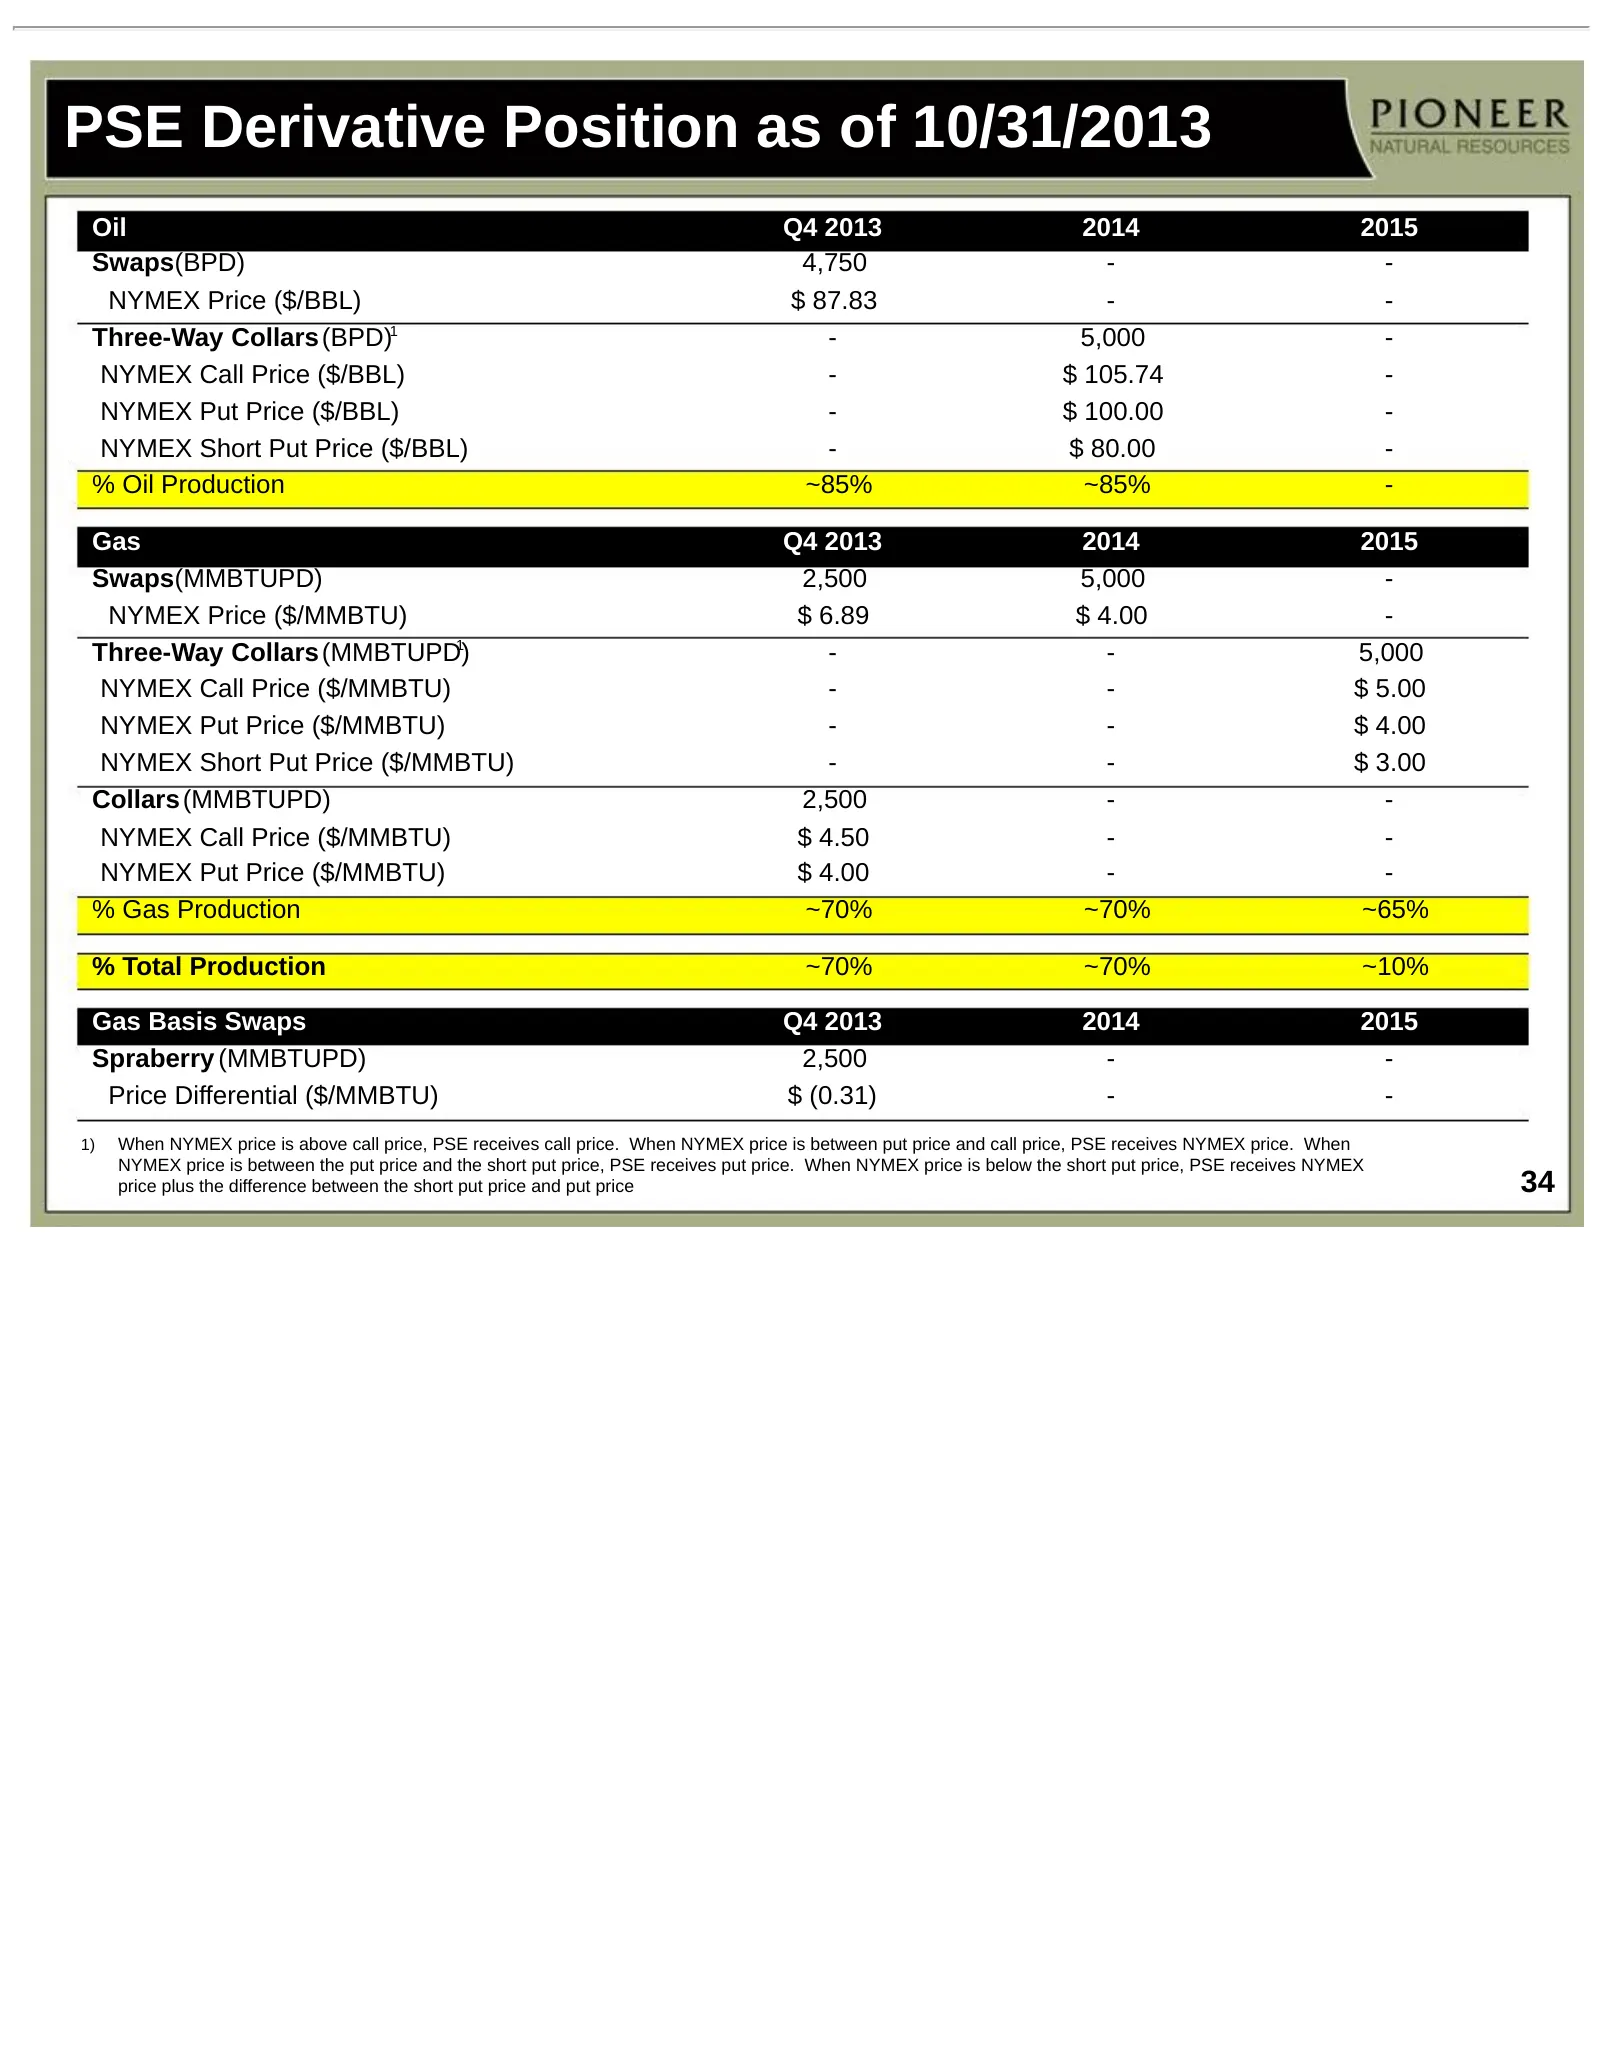
Slide 34: PSE Derivative Position as of 10/31/2013
PSE Derivative Position as of 10/31/2013 Oil Q4 2013 2014 2015 Swaps(BPD) 4,750 - - NYMEX Price ($/BBL) $ 87.83 - - Three-Way Collars (BPD)1 - 5,000 - NYMEX Call Price ($/BBL) - $ 105.74 - NYMEX Put Price ($/BBL) - $ 100.00 - NYMEX Short Put Price ($/BBL) - $ 80.00 - % Oil Production ~85% ~85% - Gas
Slide 35: Three-Way Collars ($75 by $90 by $135 example)
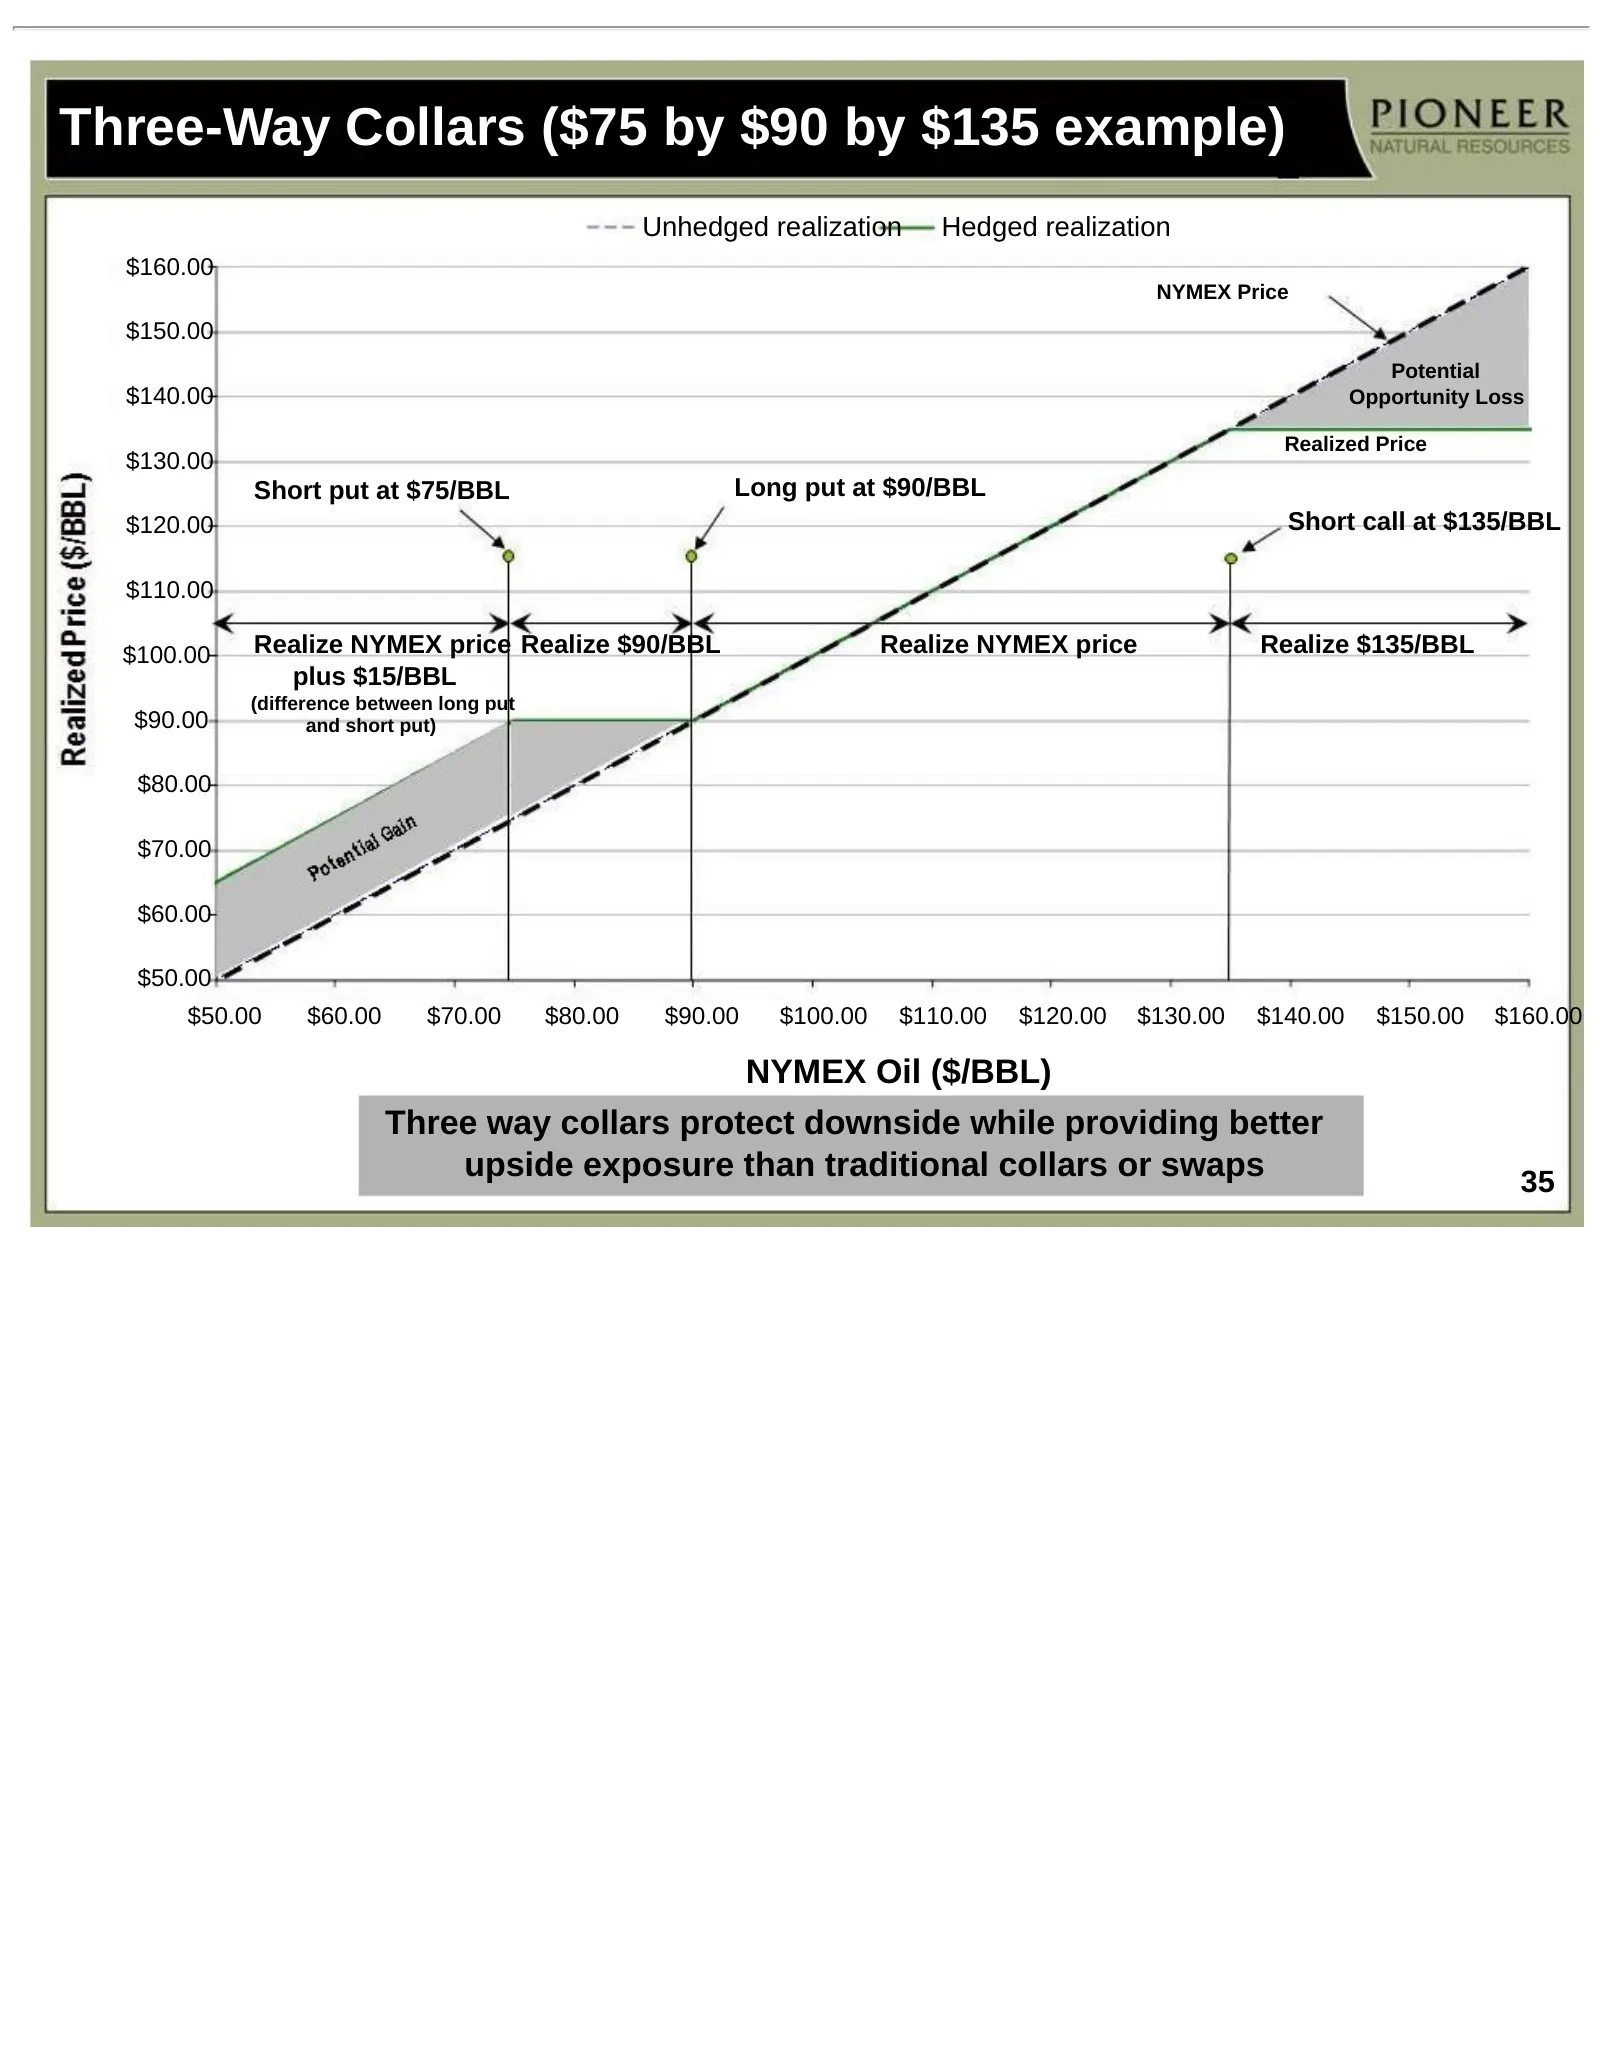
Three-Way Collars ($75 by $90 by $135 example) Unhedged realization Hedged realization $160.00 NYMEX Price $150.00 Potential $140.00 Opportunity Loss Realized Price $130.00 Short put at $75/BBL Long put at $90/BBL $120.00 Short call at $135/BBL $110.00 $100.00 Realize NYMEX price Realize $90/BBL Rea
Slide 36: Experienced Senior Management Team
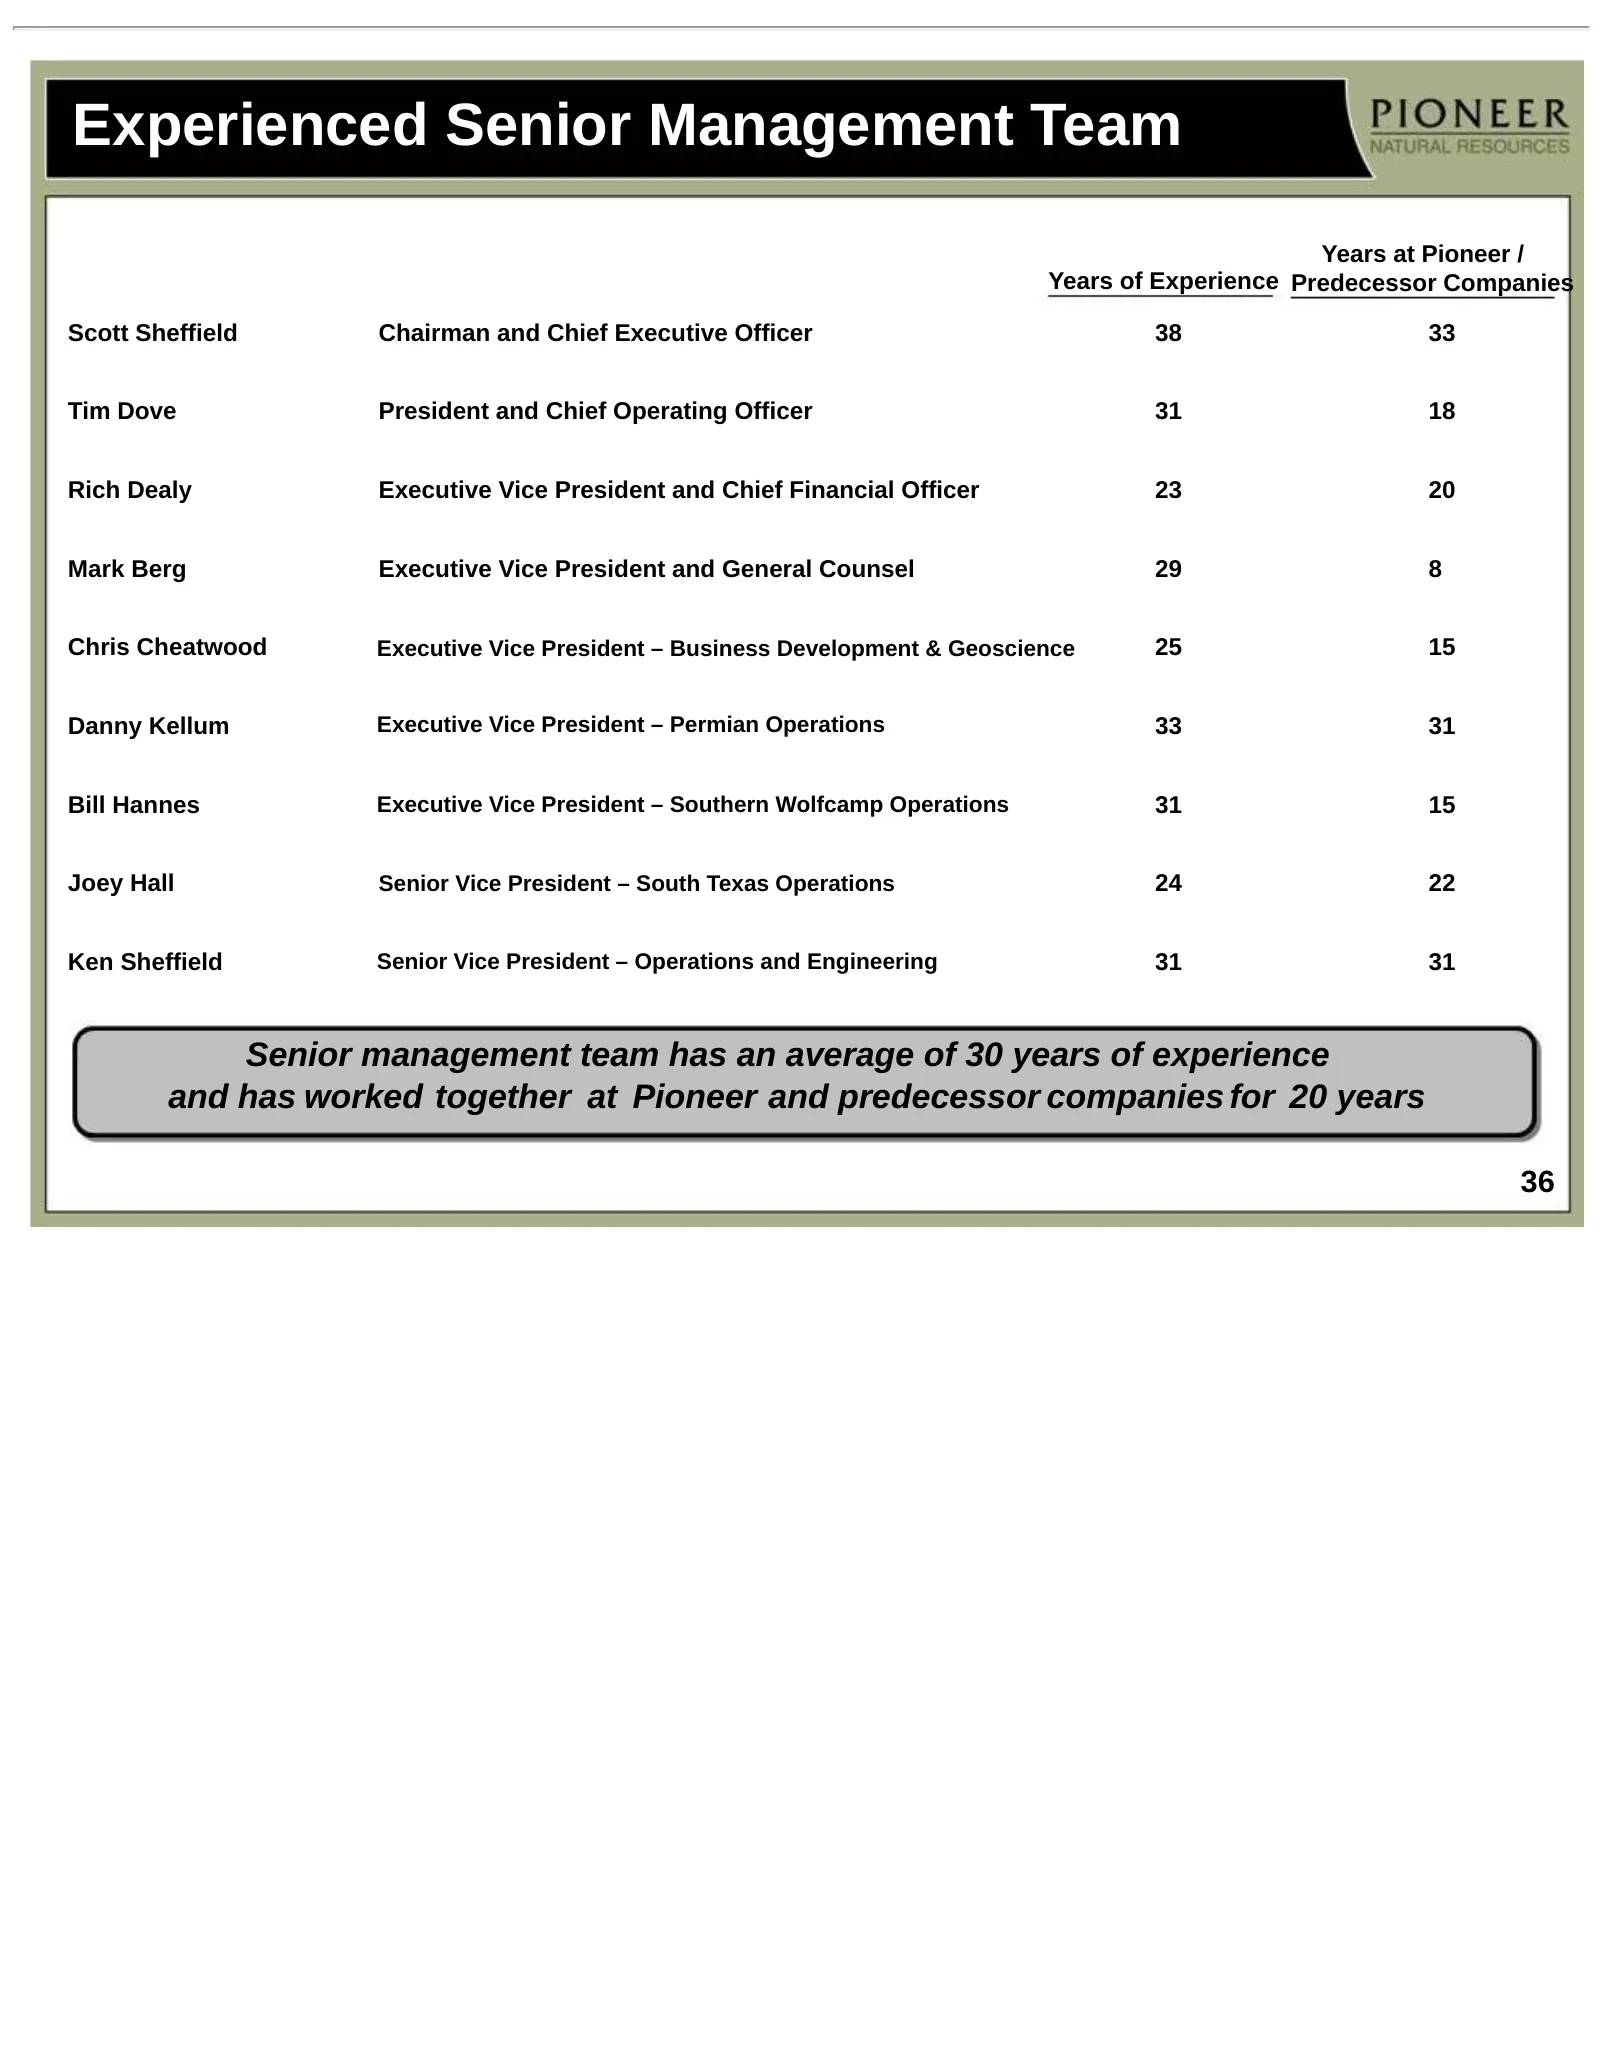
Experienced Senior Management Team Years at Pioneer / Years of Experience Predecessor Companies Scott Sheffield Chairman and Chief Executive Officer 38 33 Tim Dove President and Chief Operating Officer 31 18 Rich Dealy Executive Vice President and Chief Financial Officer 23 20 Mark Berg Executive Vi
Slide 37: Strong Stock Price Performance Demonstrates Successful Strategy Shift
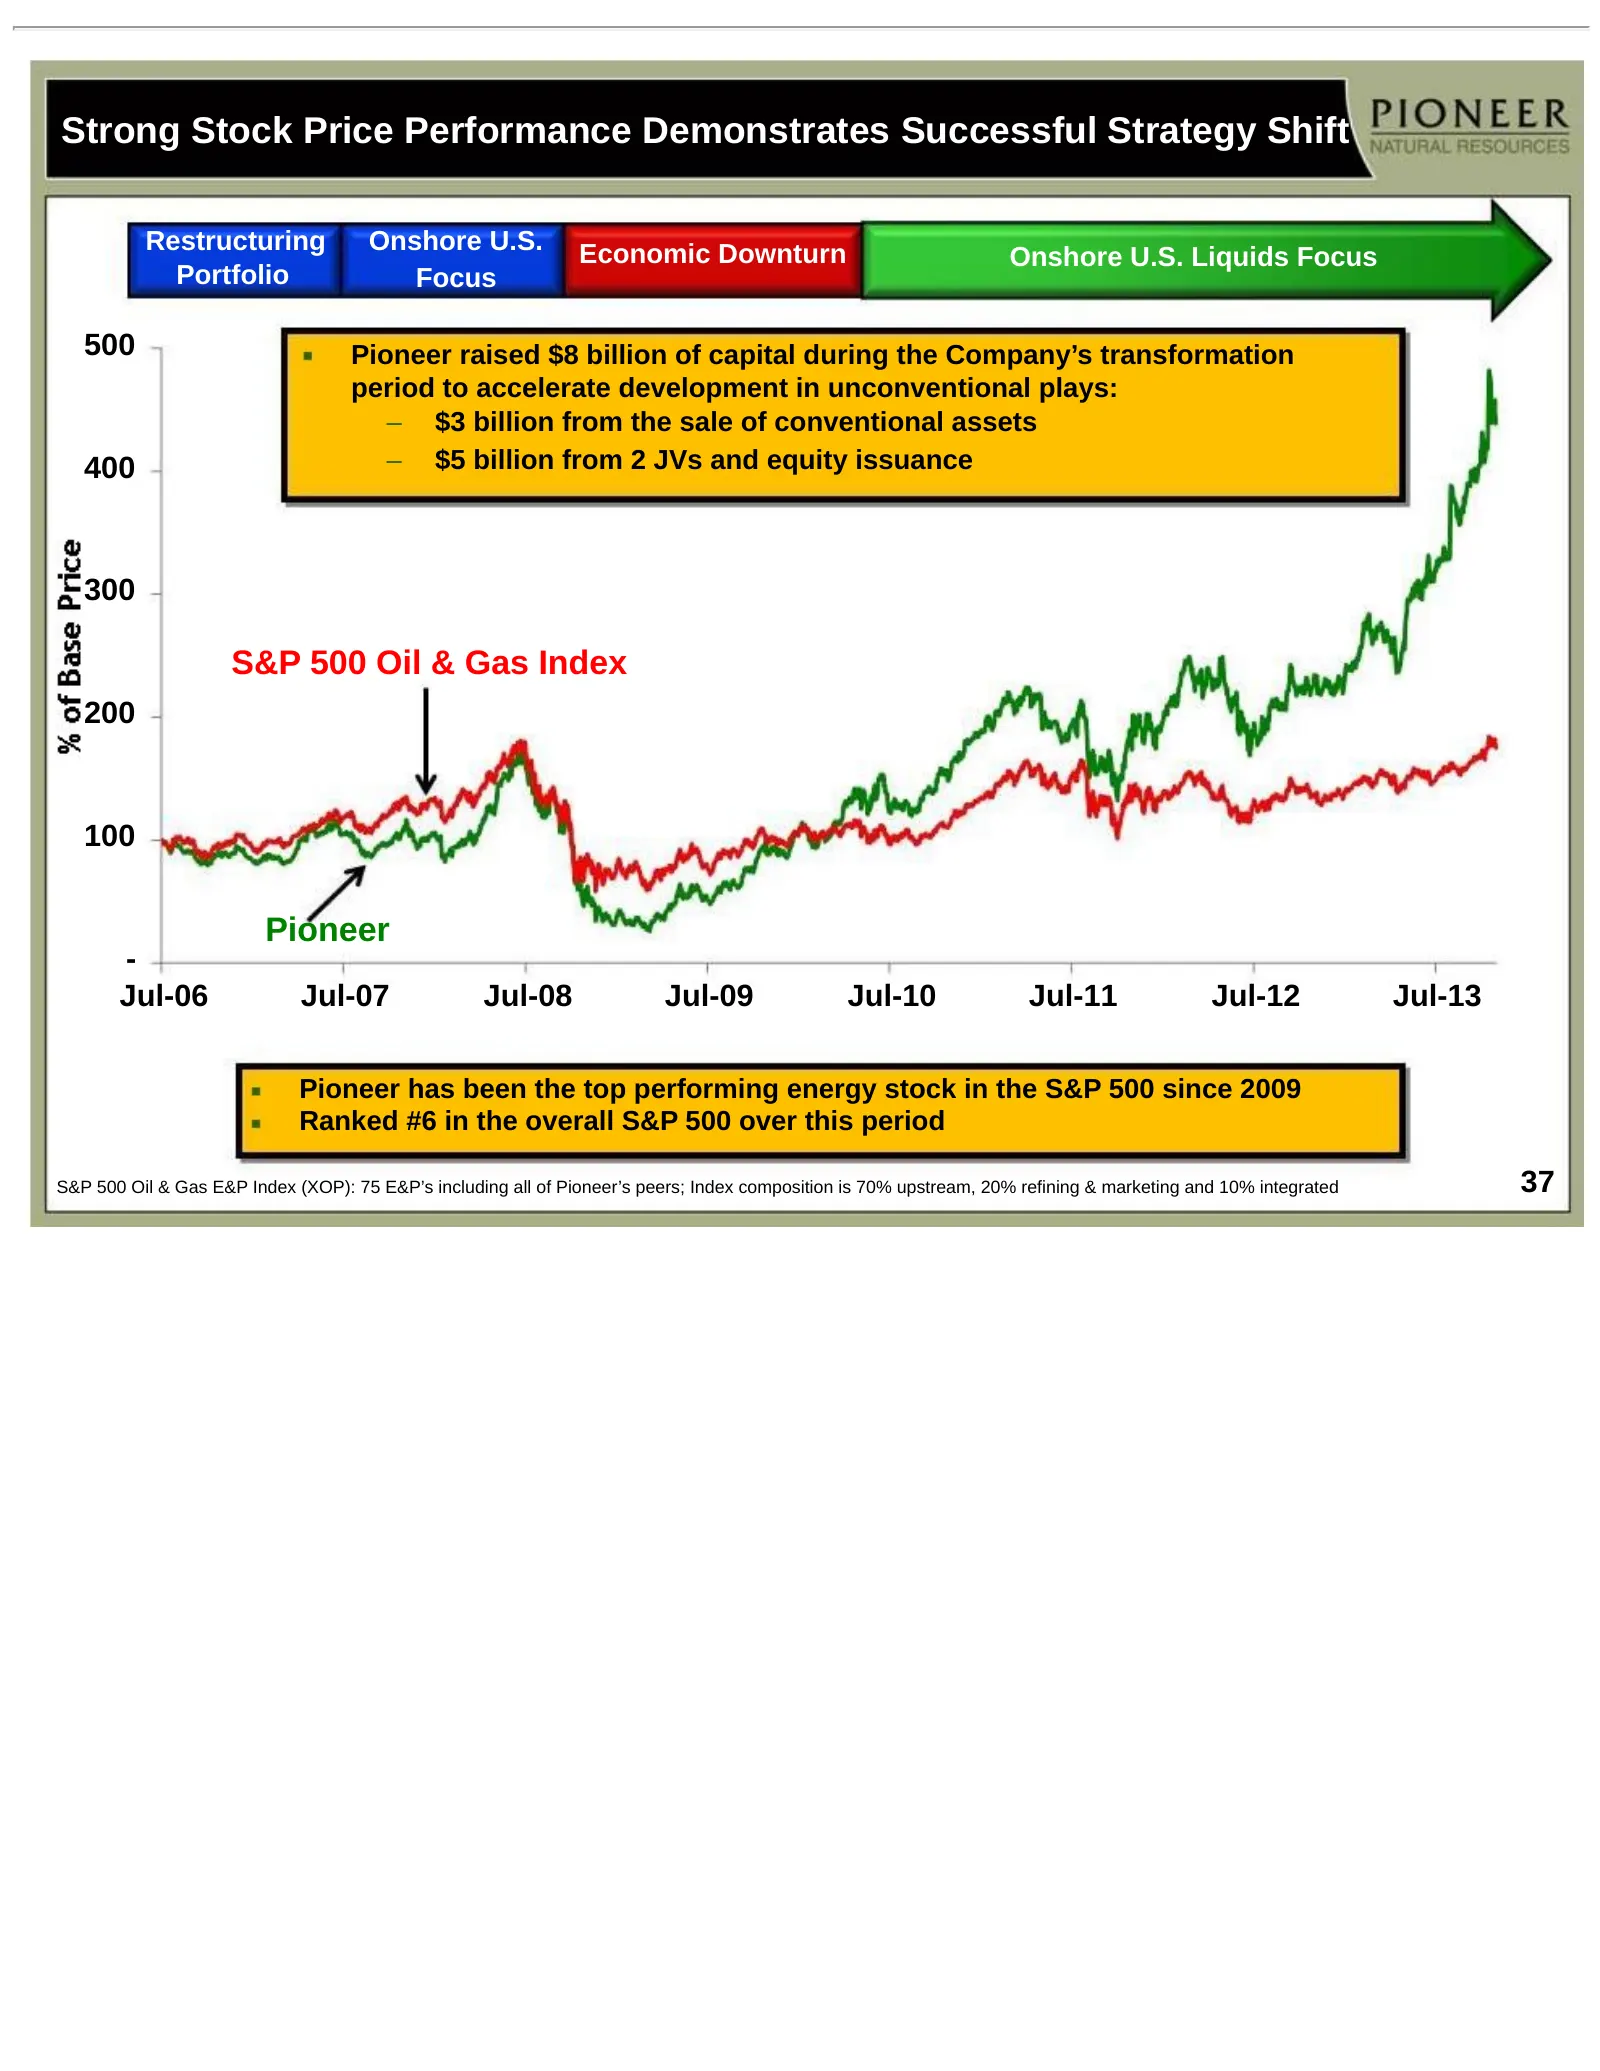
Strong Stock Price Performance Demonstrates Successful Strategy Shift Restructuring Onshore U.S. Economic Downturn Onshore U.S. Liquids Focus Portfolio Focus 500 Pioneer raised $8 billion of capital during the Company’s transformation period to accelerate development in unconventional plays: – $3 bi
Slide 38: Strong 2012 Reserve Additions
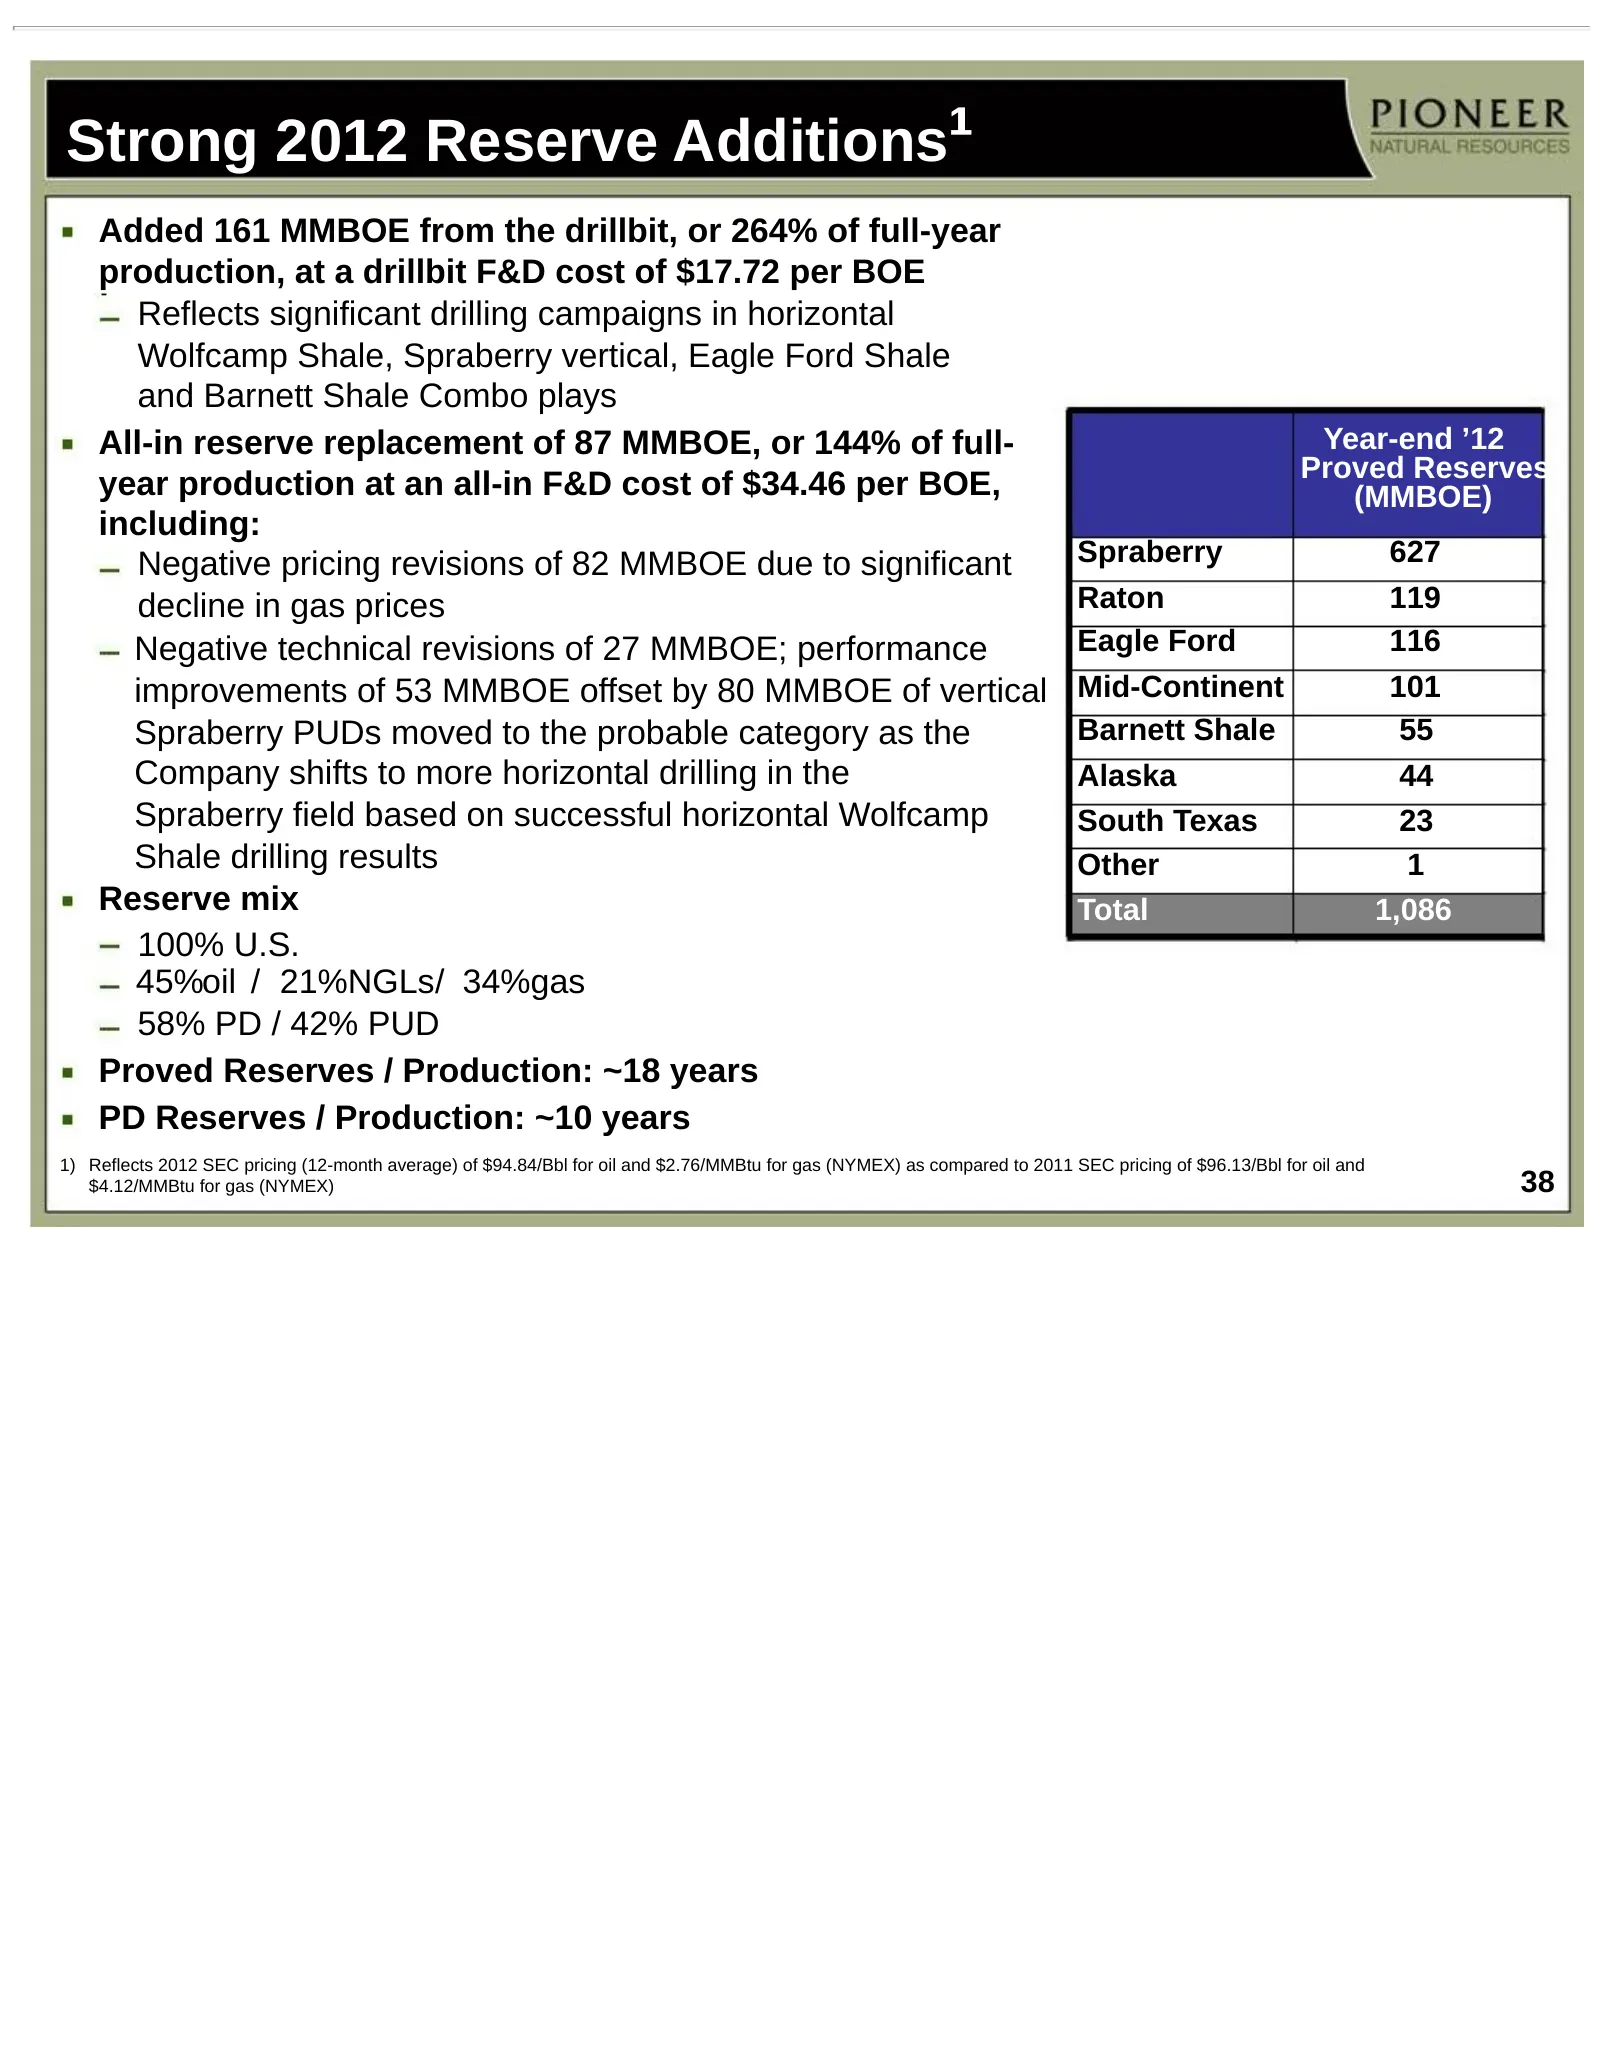
Strong 2012 Reserve Additions¹ Added 161 MMBOE from the drillbit, or 264% of full-year production, at a drillbit F&D cost of $17.72 per BOE Reflects significant drilling campaigns in horizontal Wolfcamp Shale, Spraberry vertical, Eagle Ford Shale and Barnett Shale Combo plays All-in reserve replacem
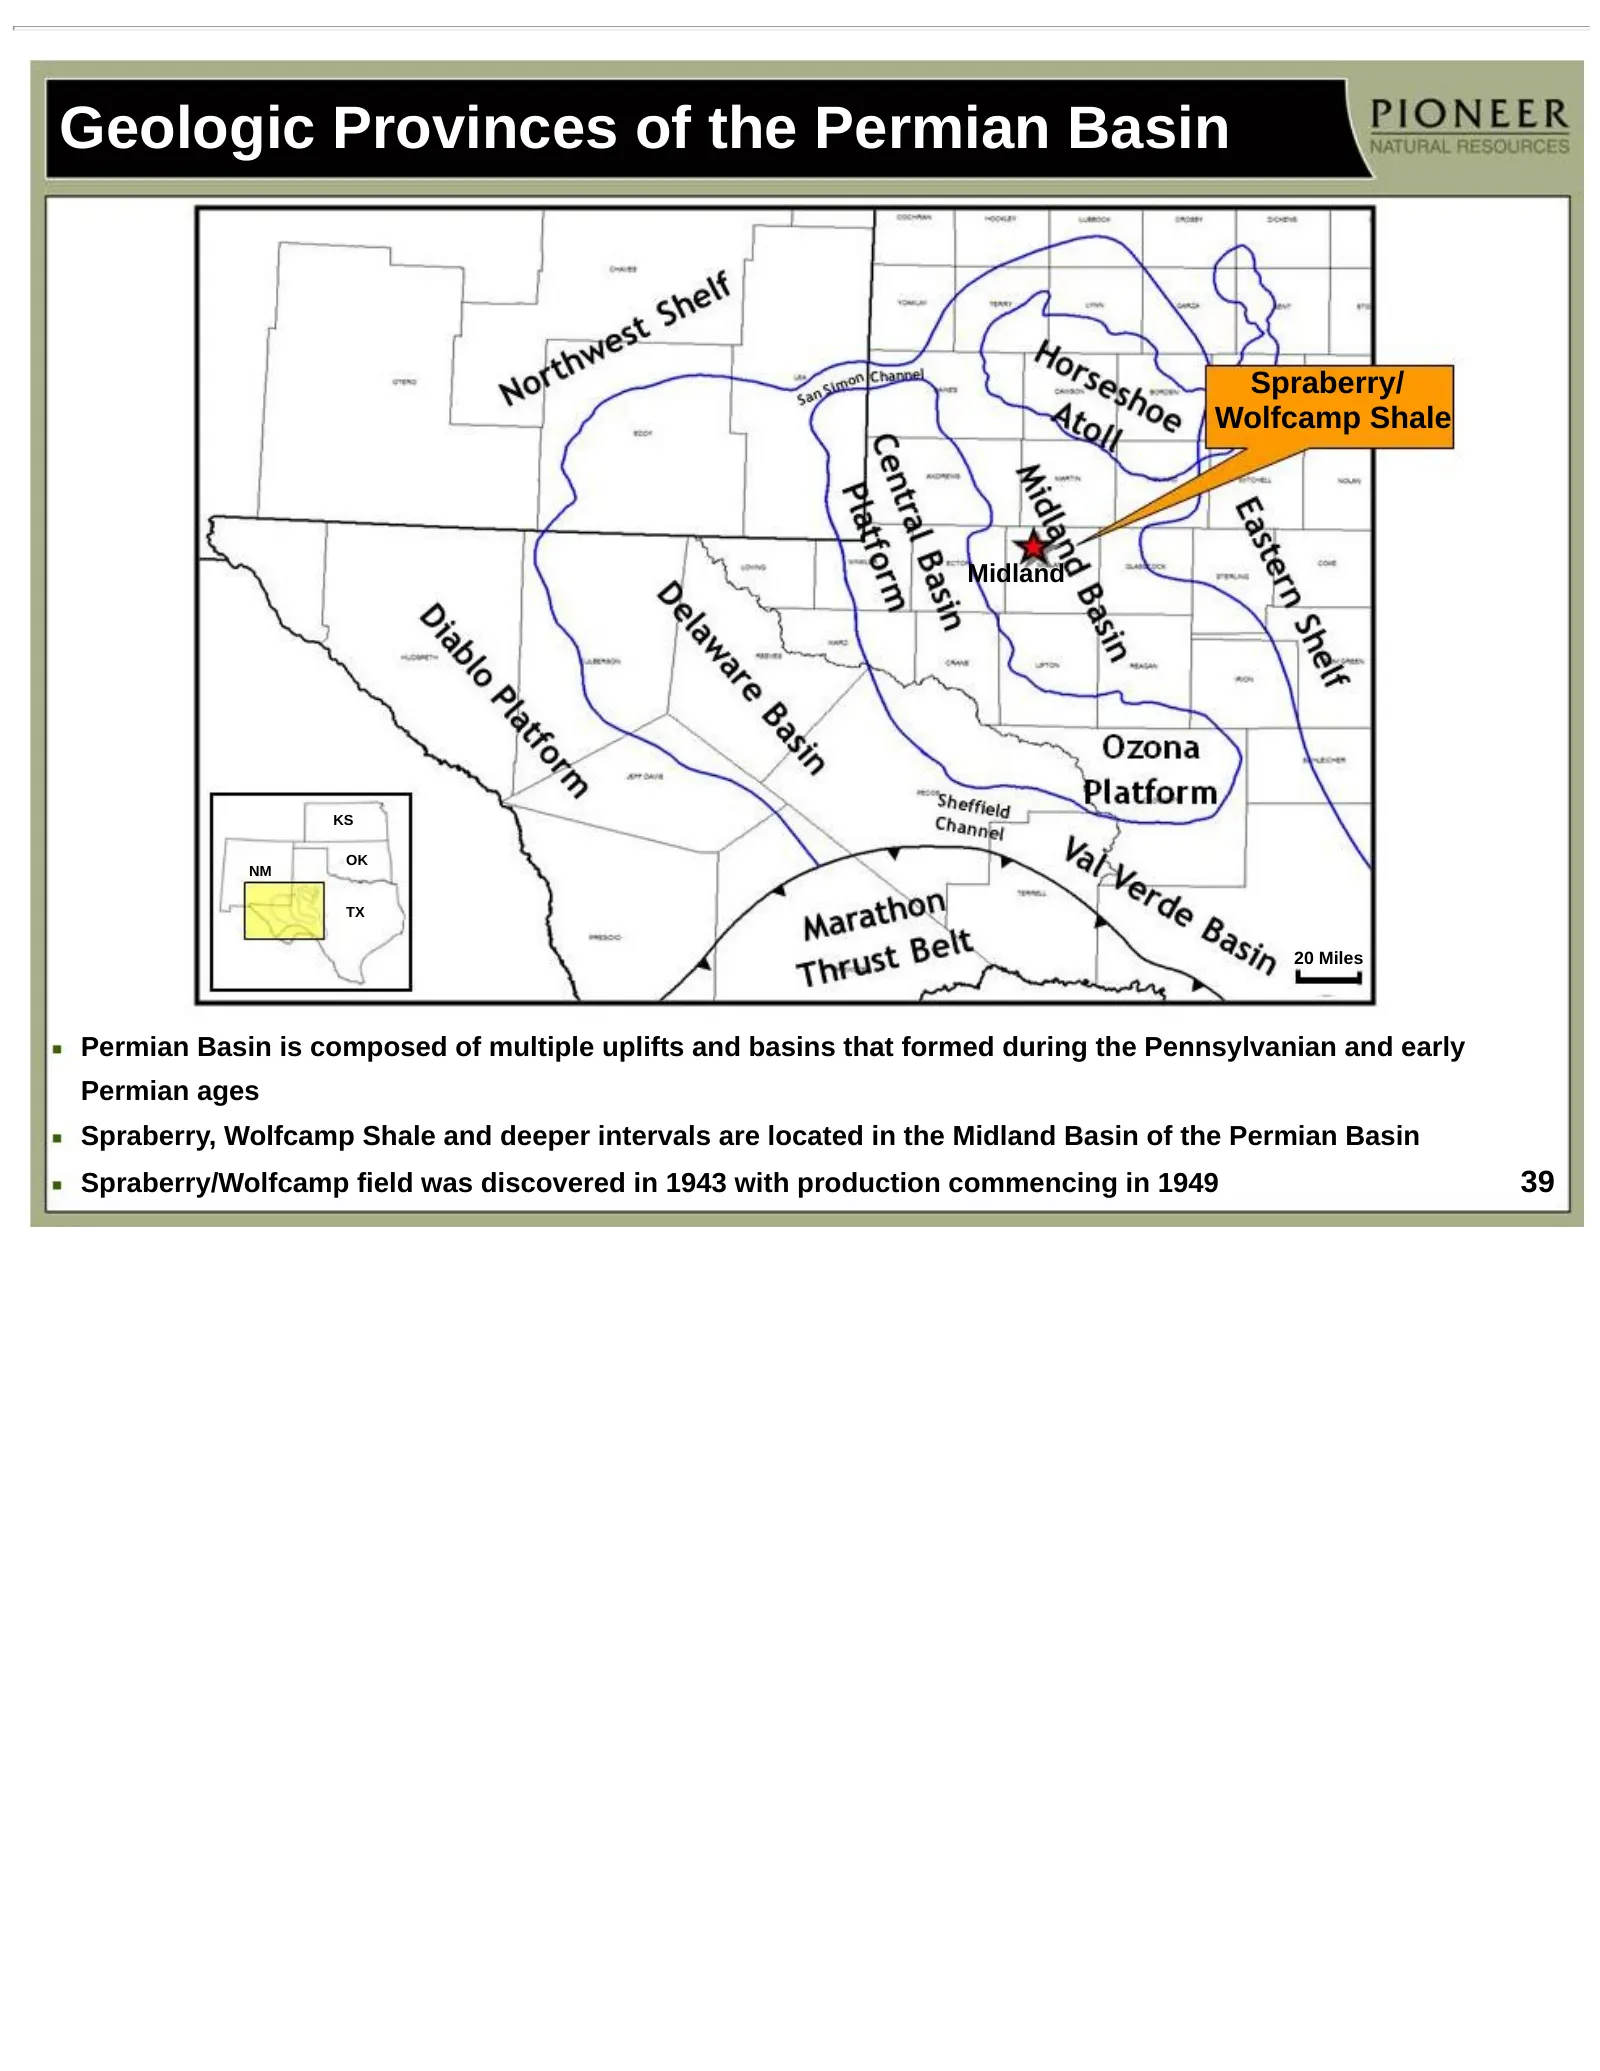
Slide 39: Geologic Provinces of the Permian Basin
Geologic Provinces of the Permian Basin Spraberry/ Wolfcamp Shale Midland KS OK NM TX 20 Miles Permian Basin is composed of multiple uplifts and basins that formed during the Pennsylvanian and early Permian ages Spraberry, Wolfcamp Shale and deeper intervals are located in the Midland Basin of the P
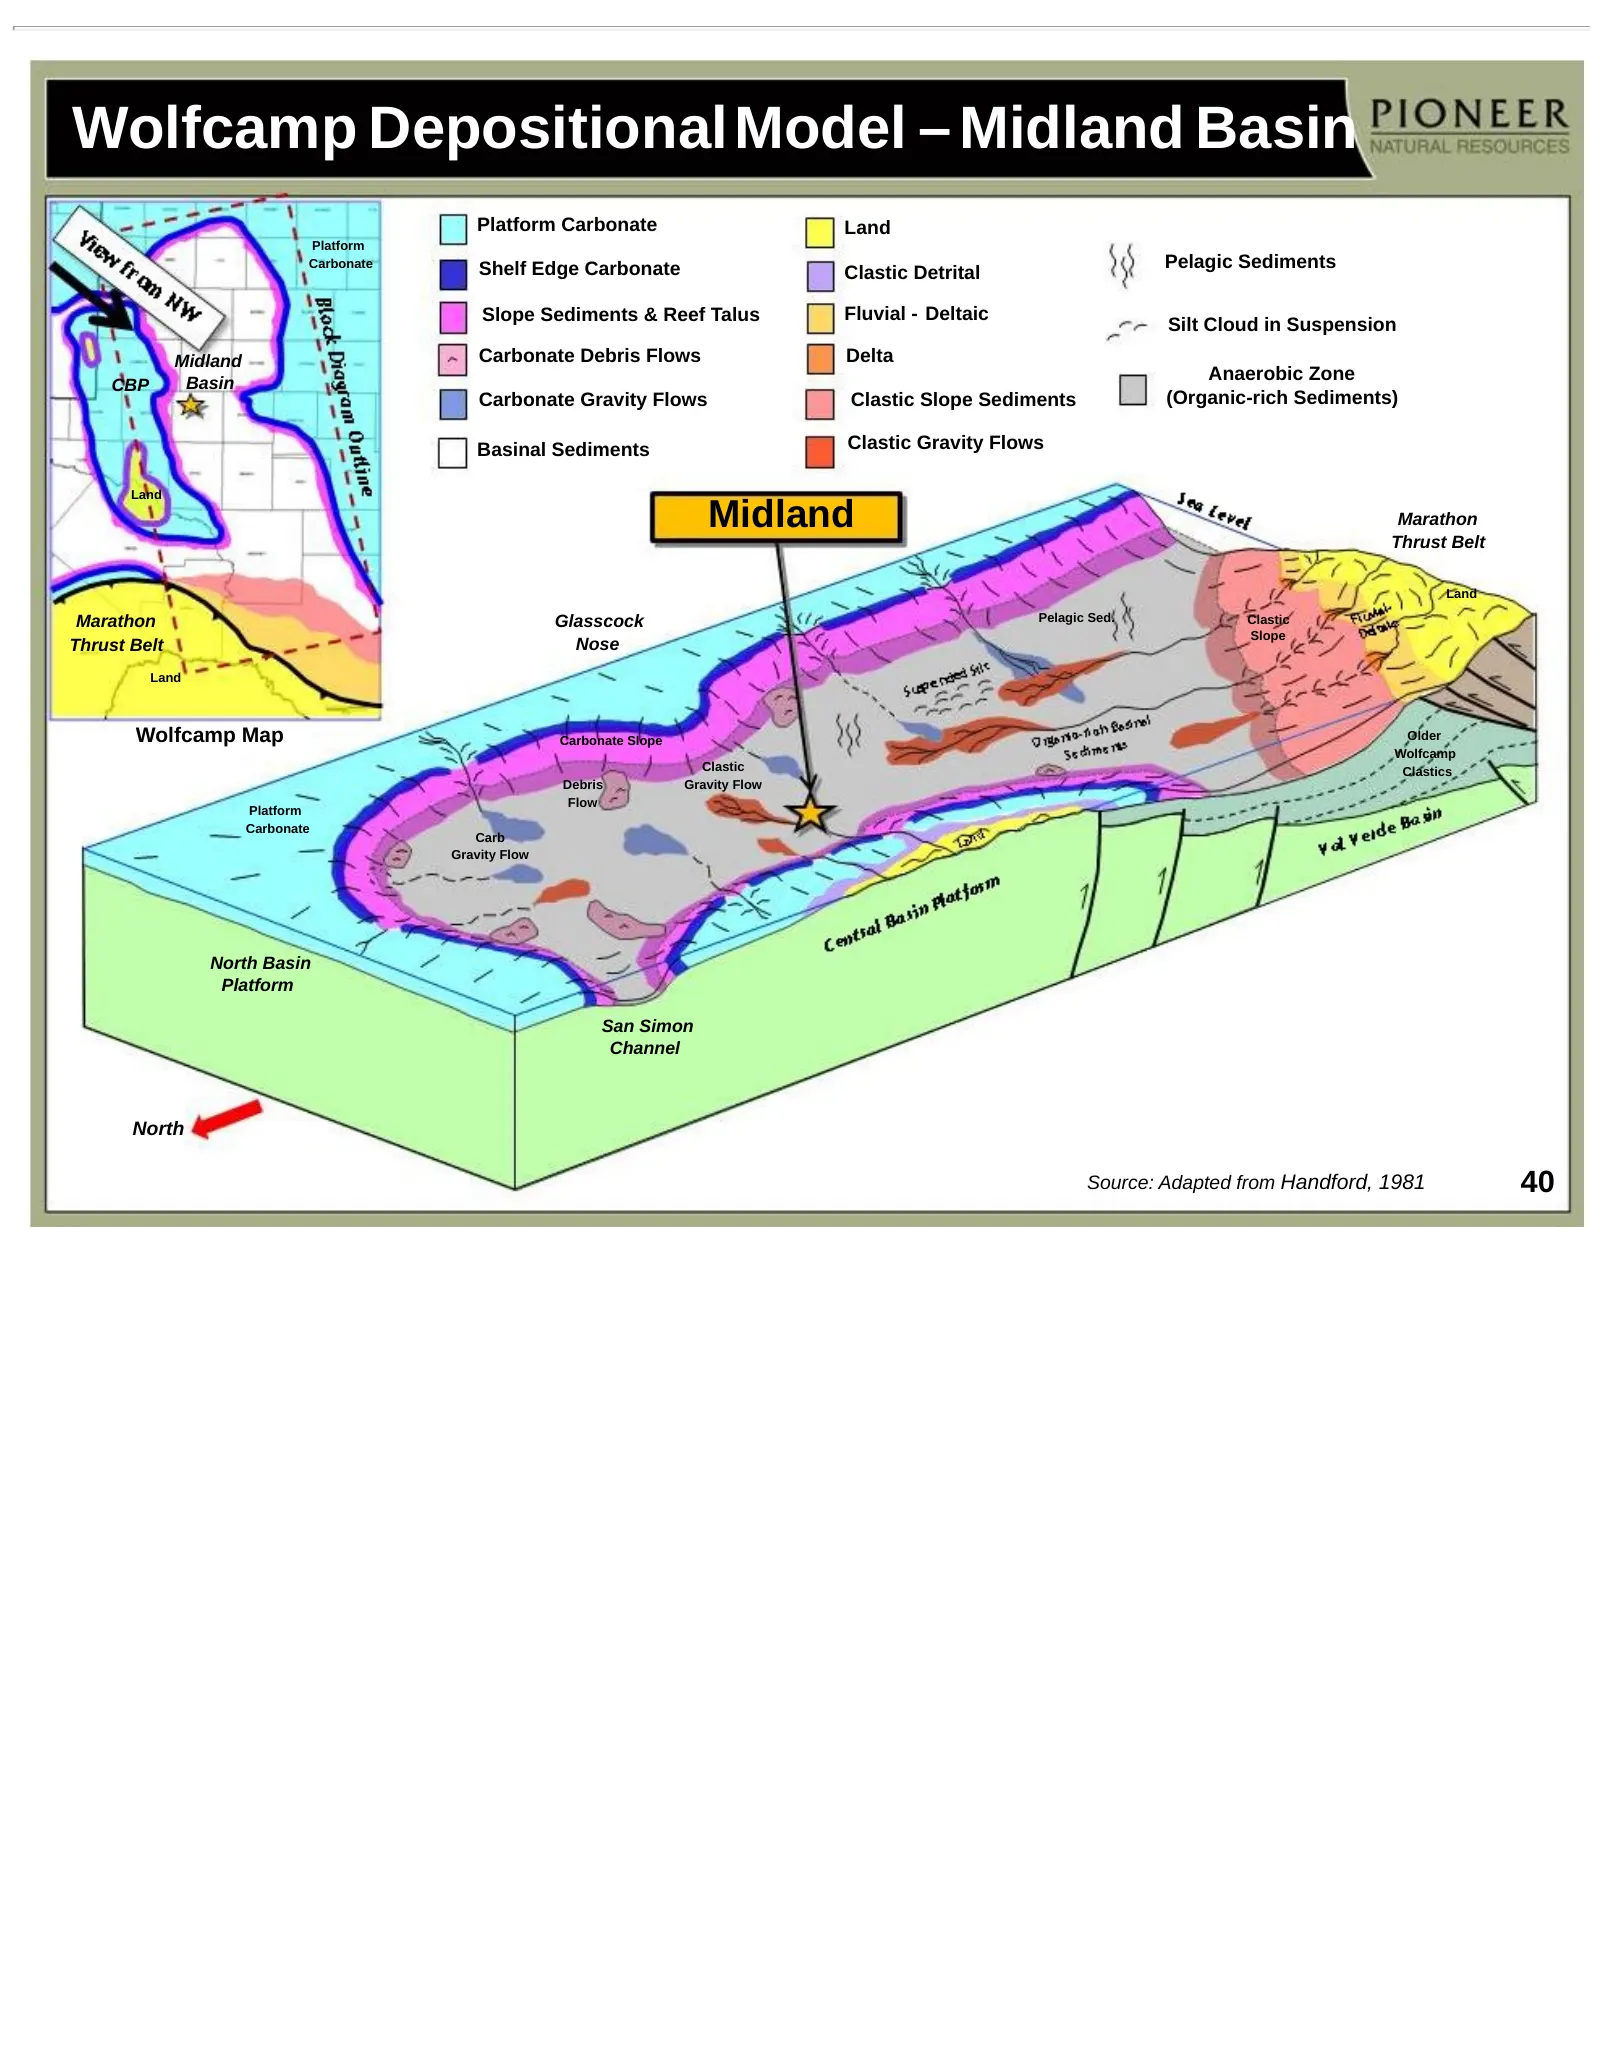
Slide 40: Wolfcamp Depositional Model – Midland Basin
Wolfcamp Depositional Model – Midland Basin Platform Carbonate Land Platform Carbonate Shelf Edge Carbonate Pelagic Sediments Clastic Detrital Slope Sediments & Reef Talus Fluvial - Deltaic Silt Cloud in Suspension Midland Carbonate Debris Flows Delta Anaerobic Zone CBP Basin Carbonate Gravity Flows
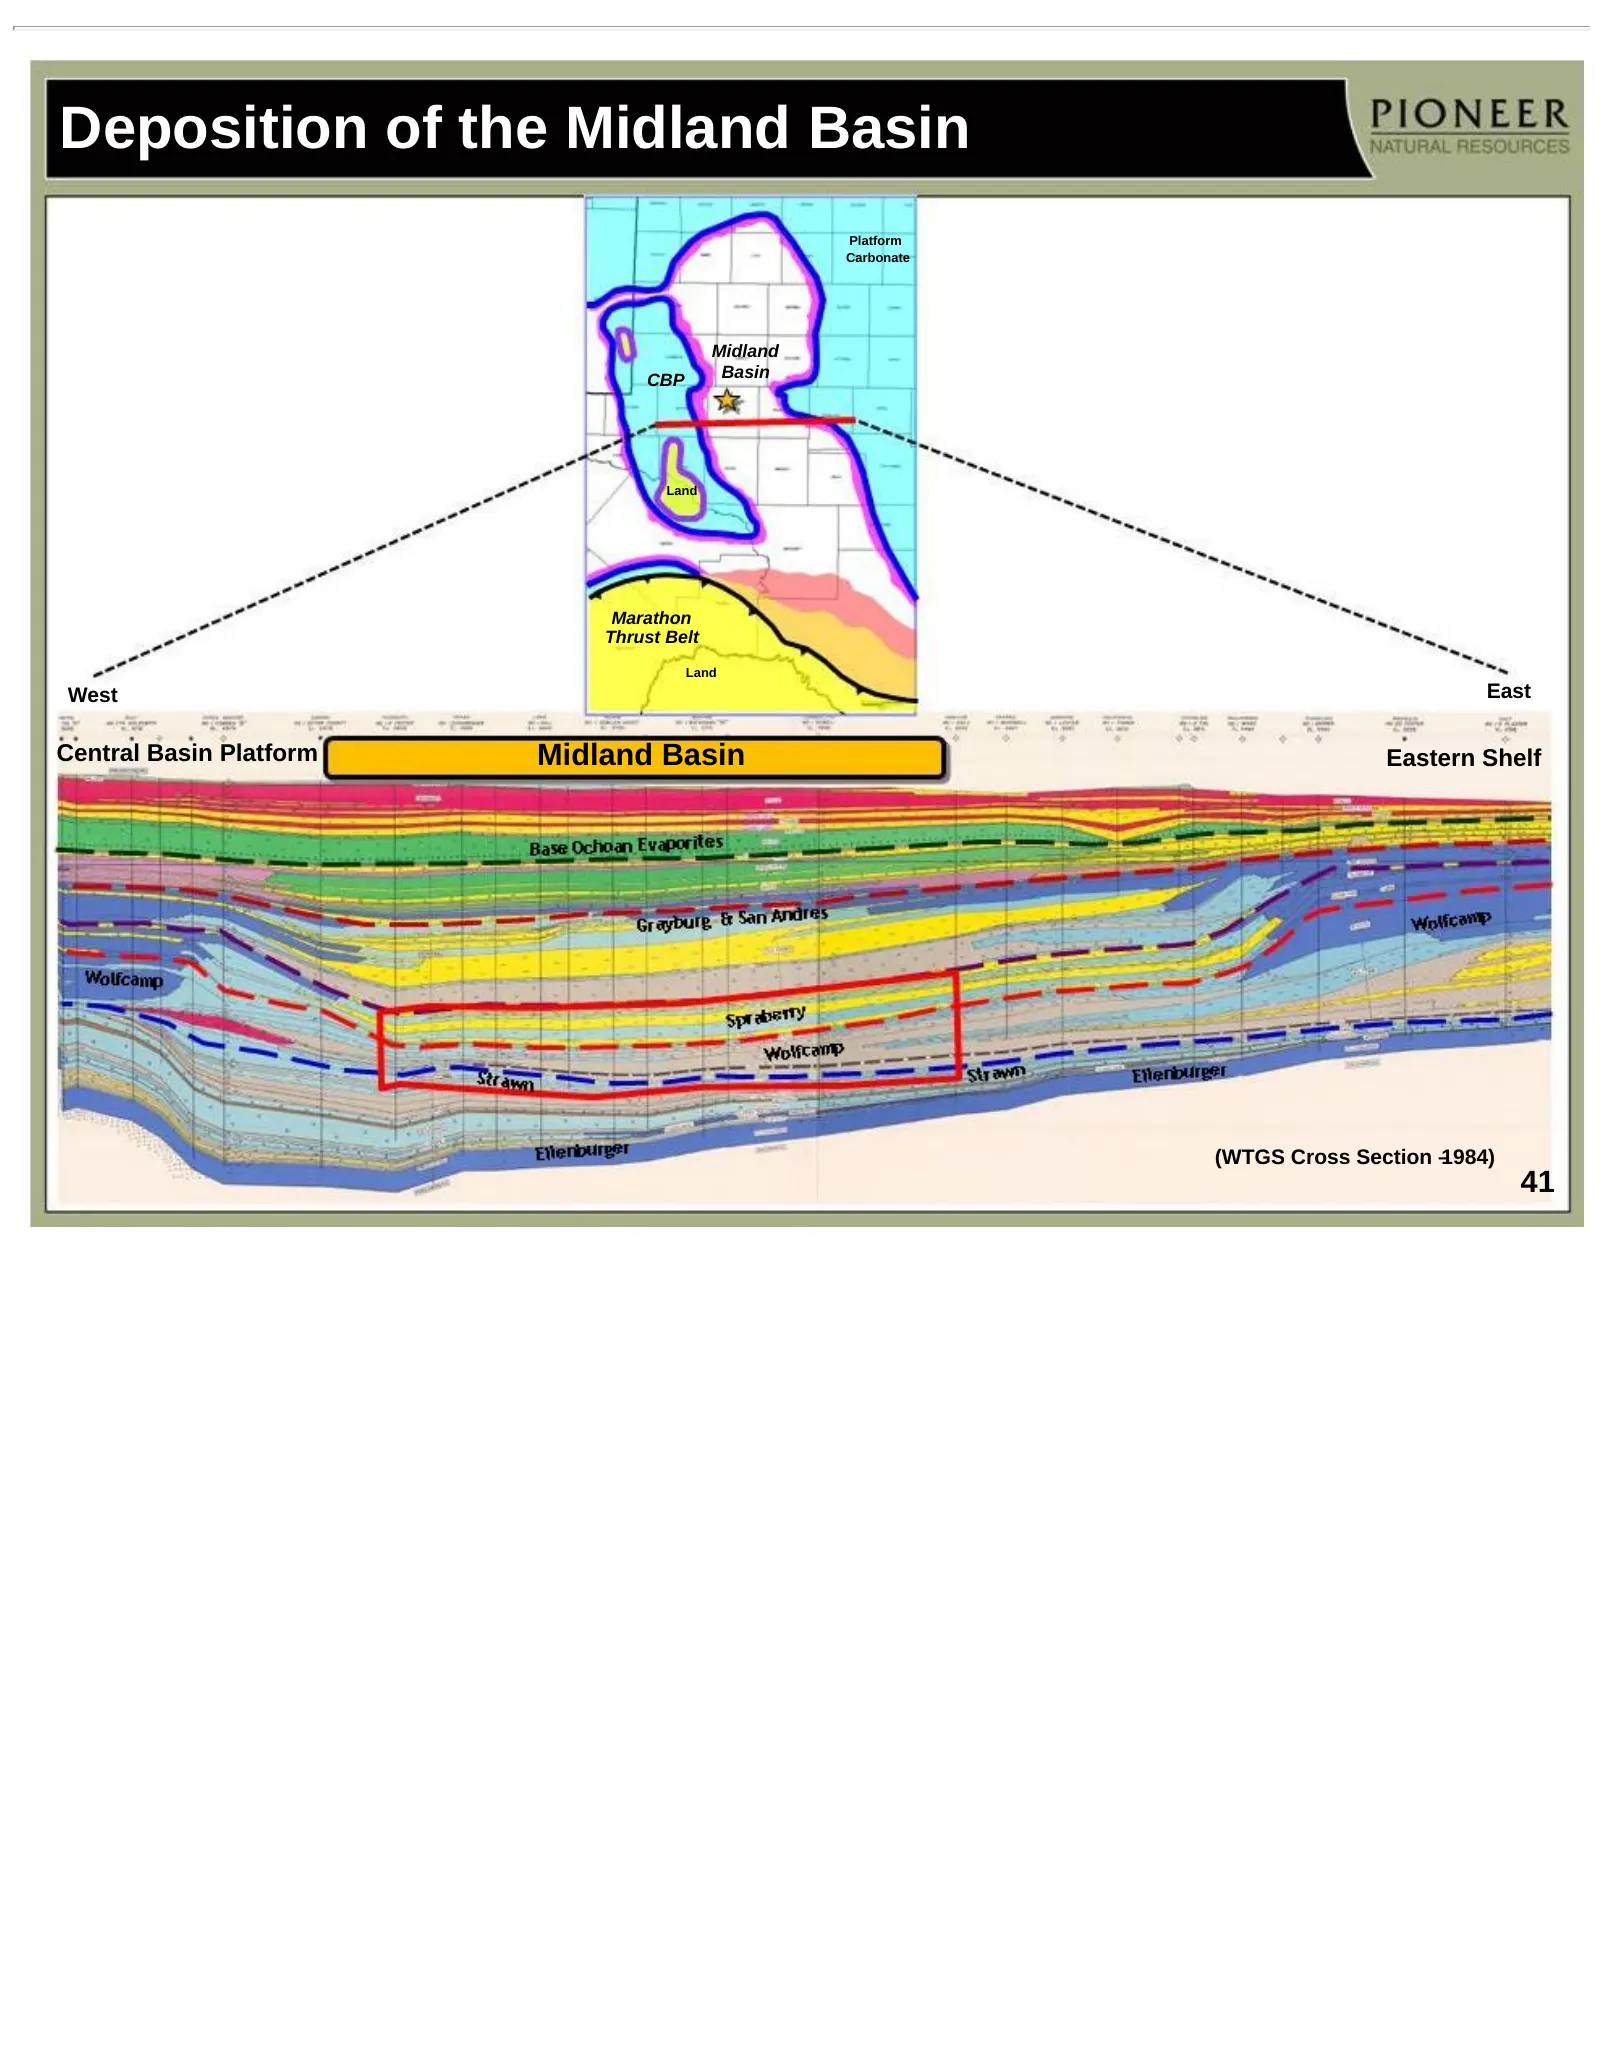
Slide 41: Deposition of the Midland Basin
Deposition of the Midland Basin Platform Carbonate Midland CBP Basin Land Marathon Thrust Belt Land West East Central Basin Platform Midland Basin Eastern Shelf (WTGS Cross Section –1984) 41
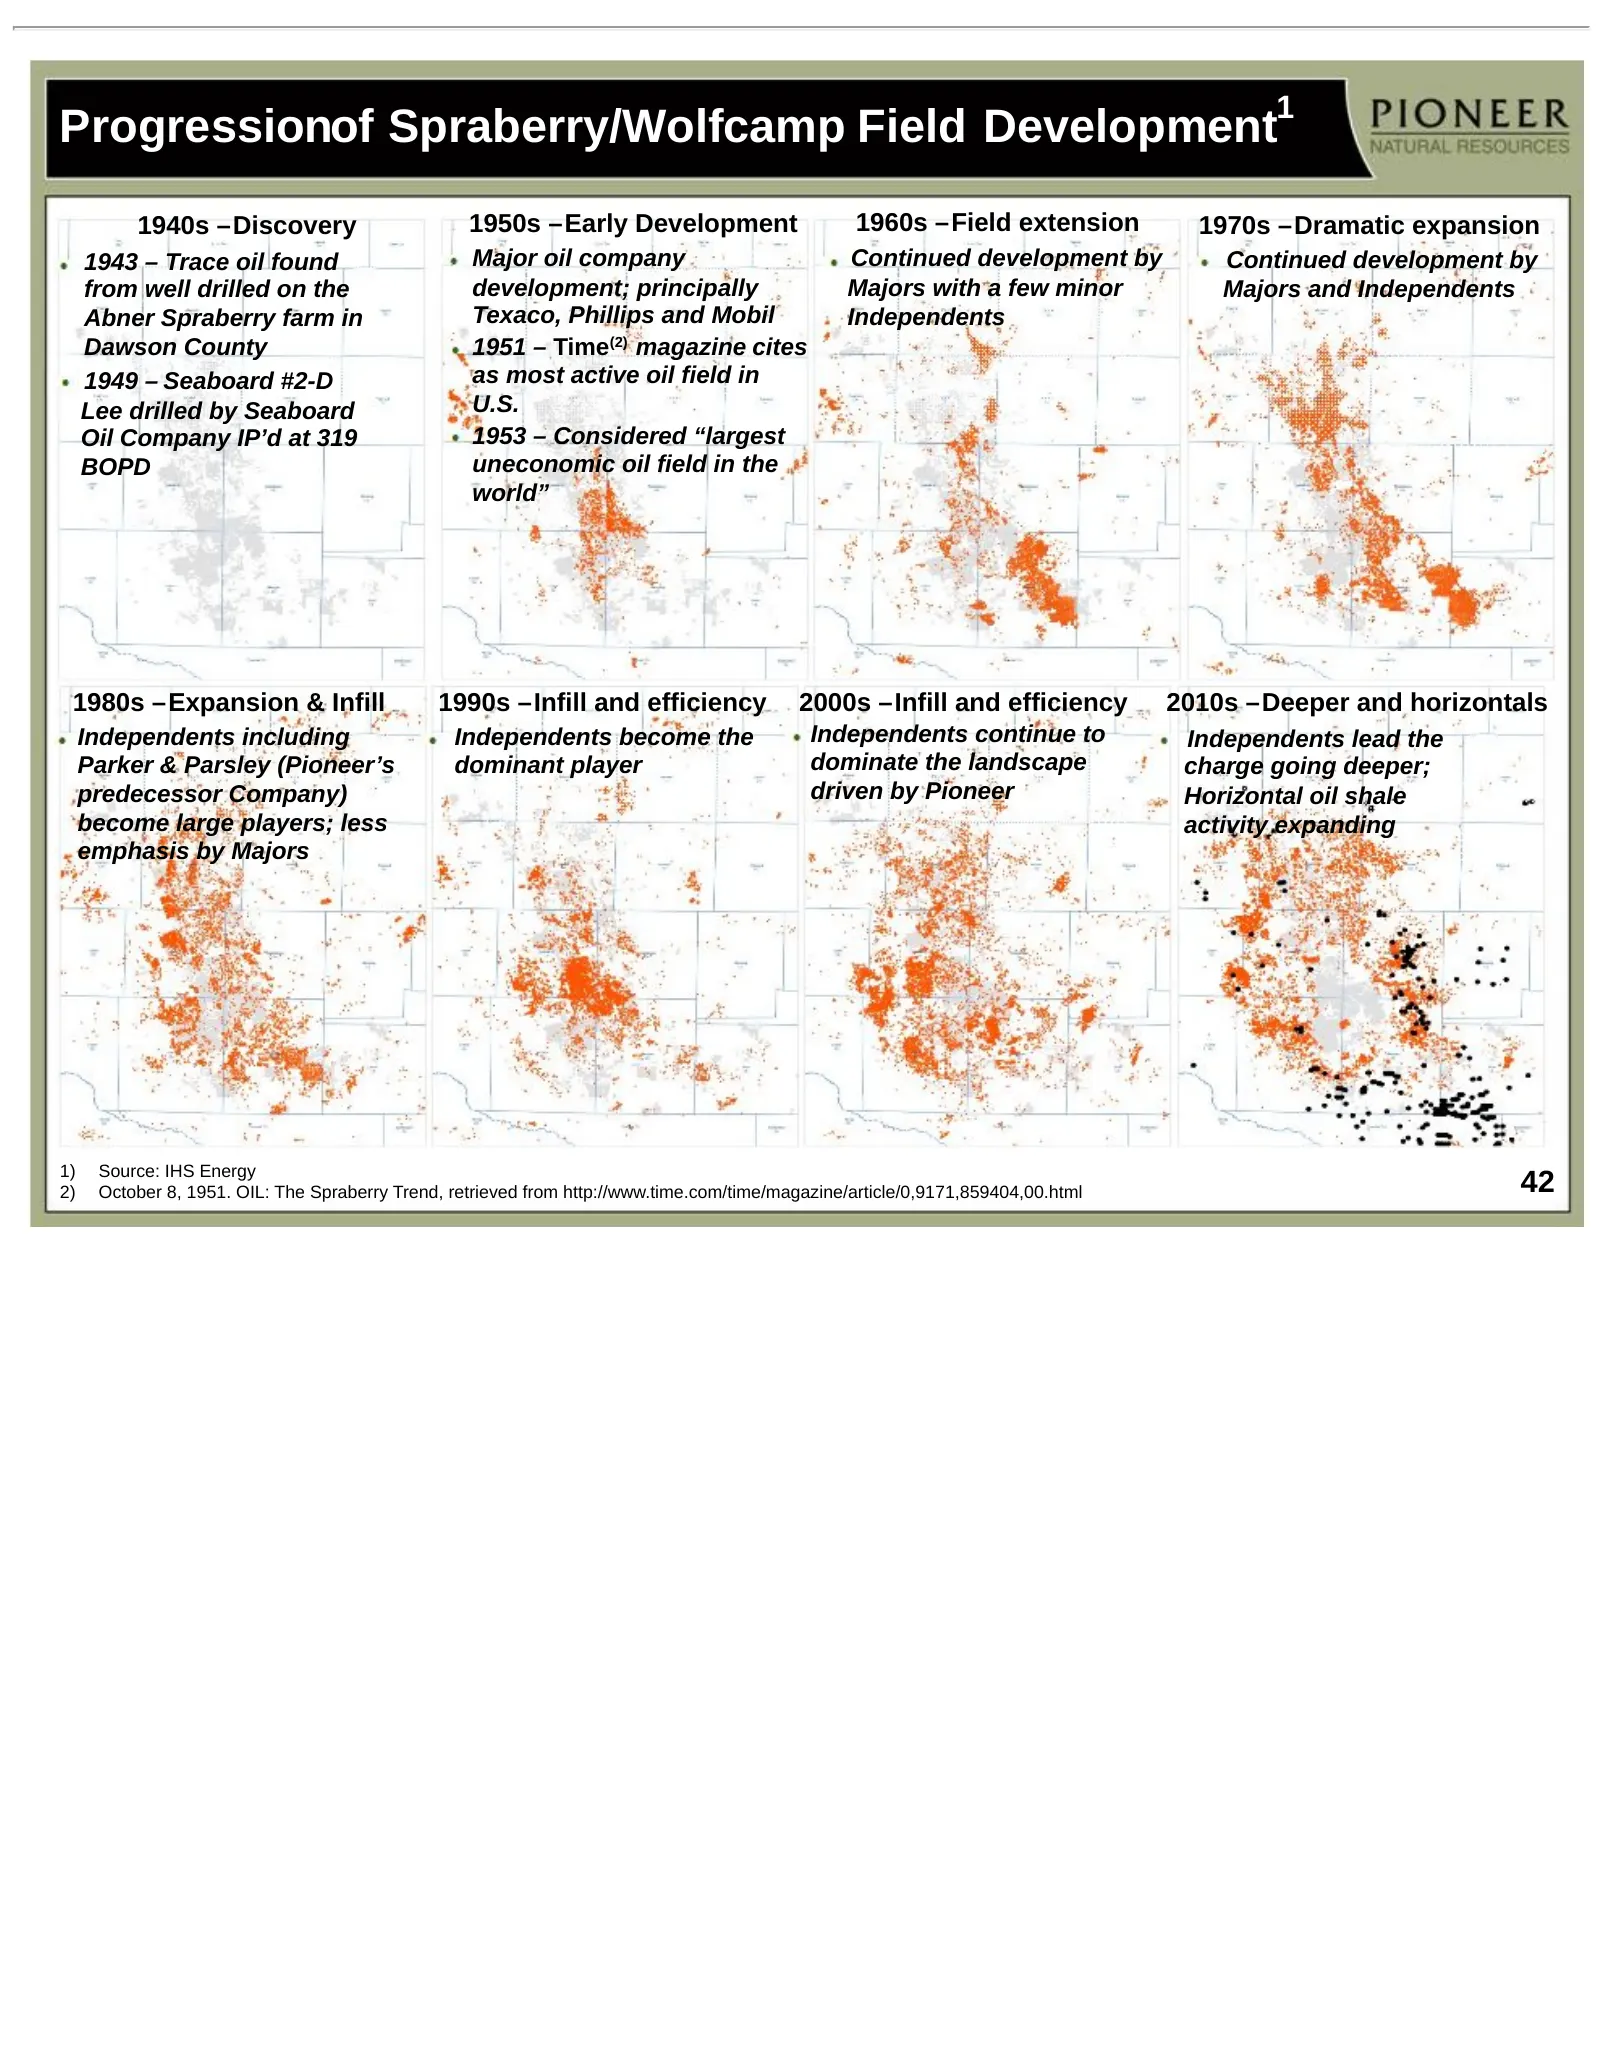
Slide 42: Progression of Spraberry/Wolfcamp Field Development
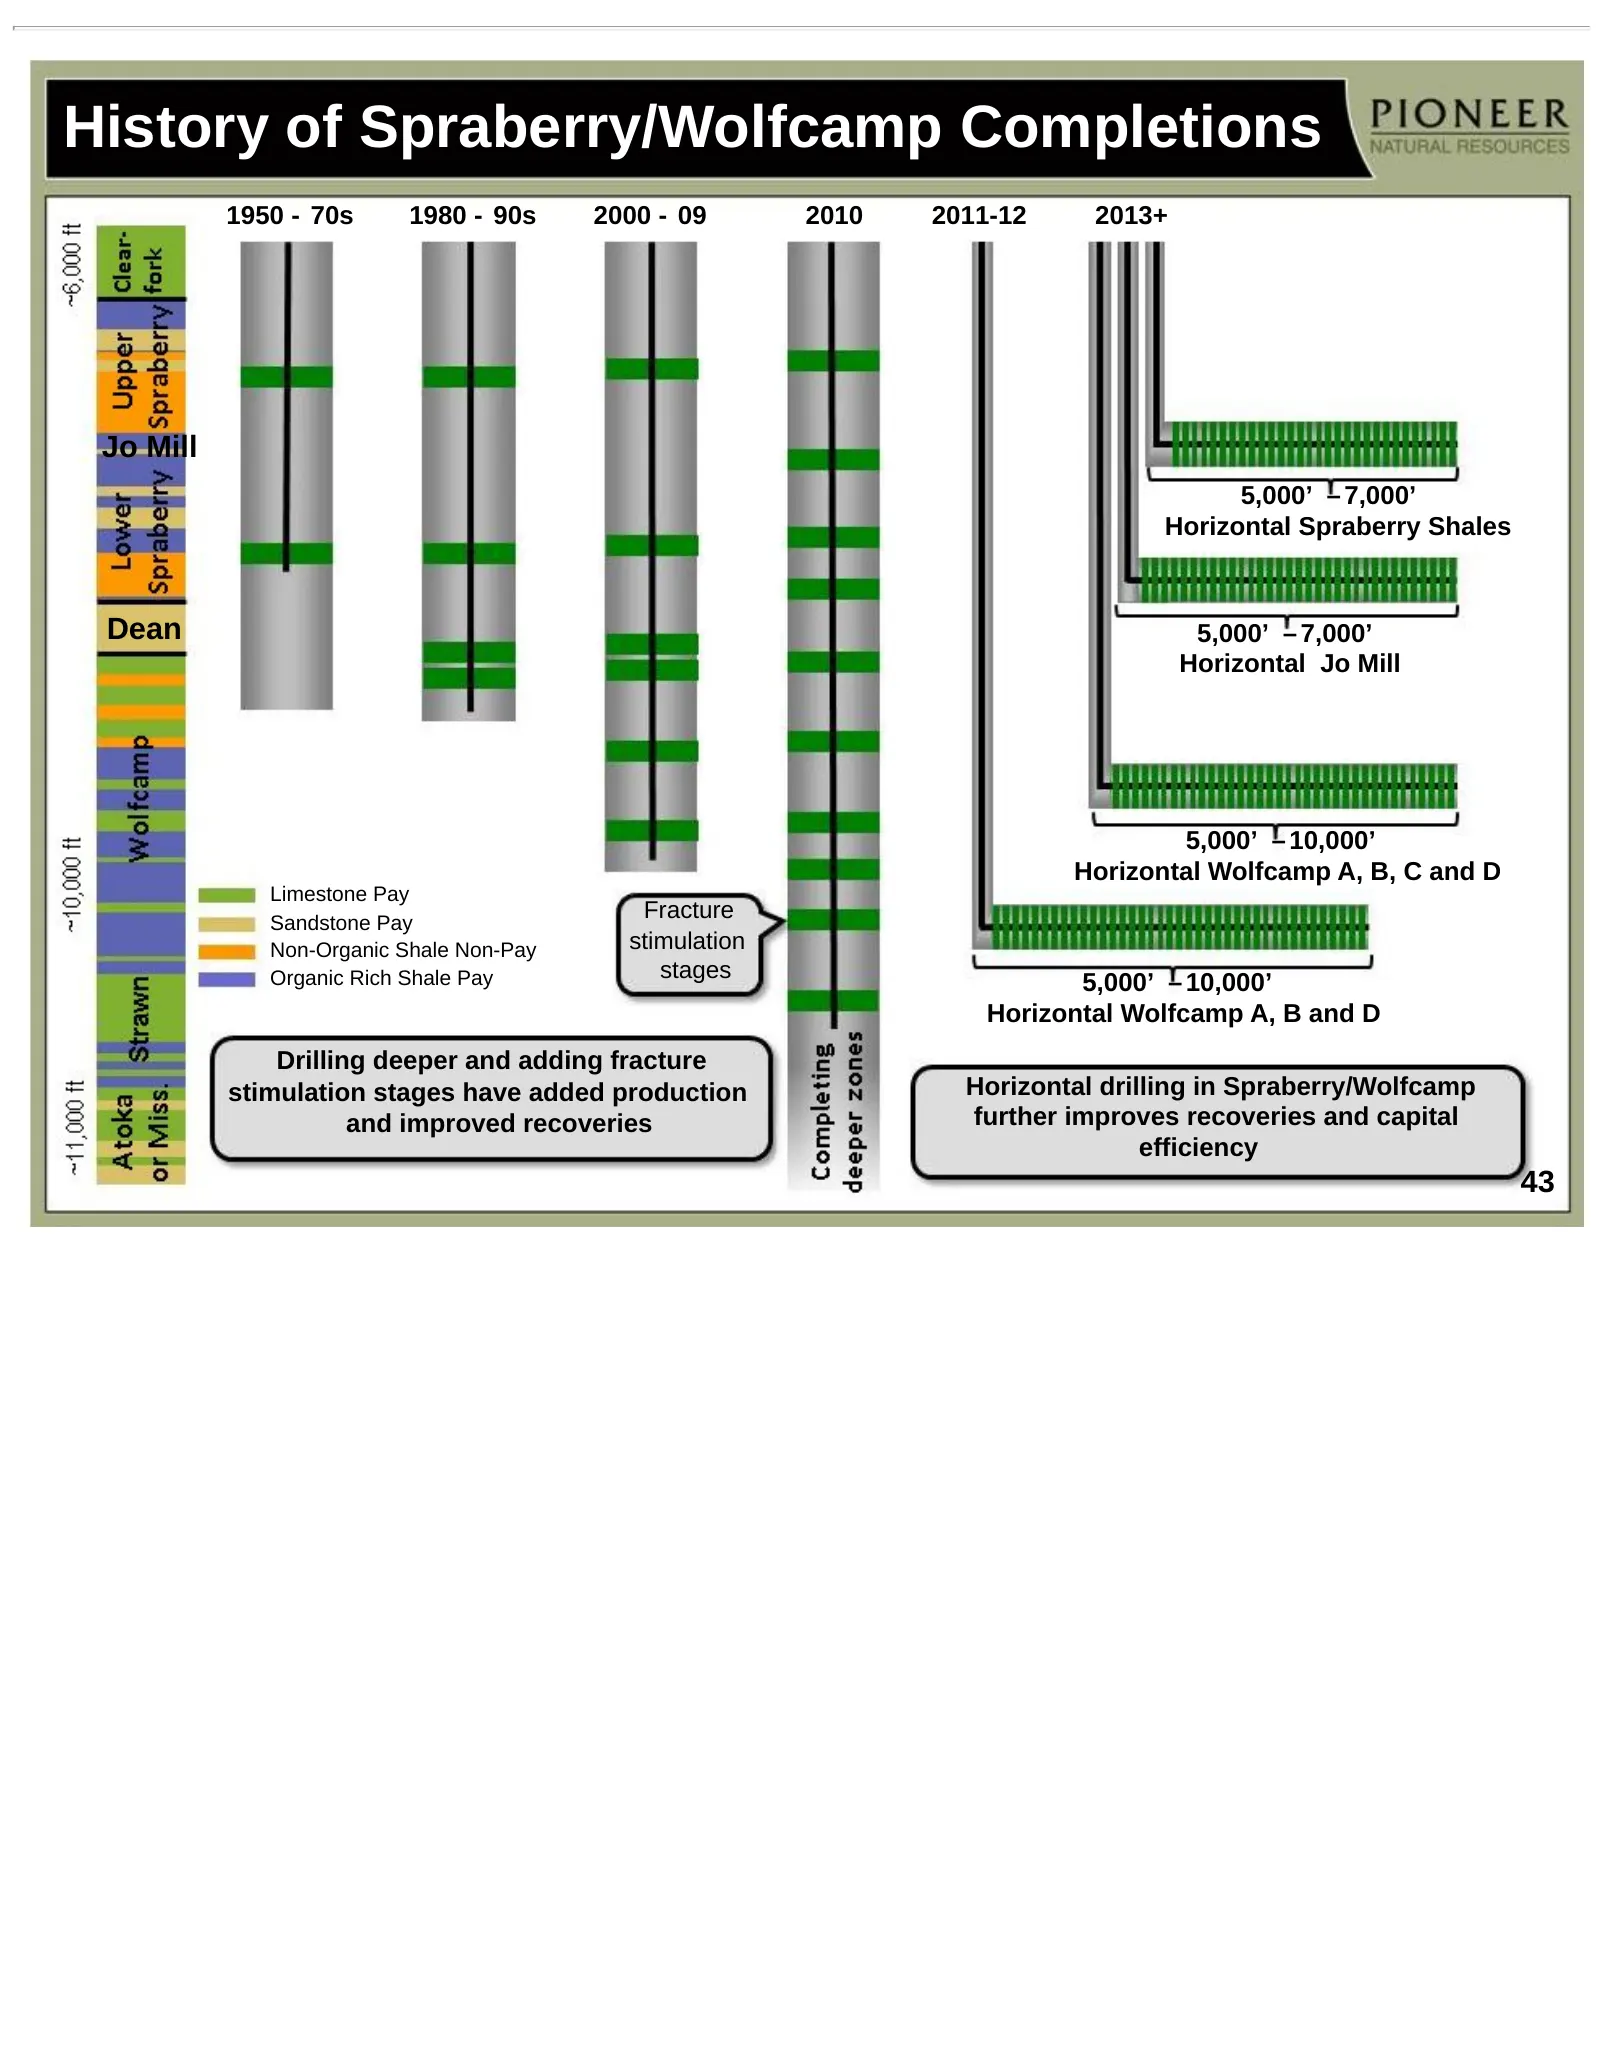
1 Progressionof Spraberry/Wolfcamp Field Development 1940s –Discovery 1950s –Early Development 1960s –Field extension 1970s –Dramatic expansion 1943 – Trace oil found Major oil company Continued development by Continued development by from well drilled on the development; principally Majors with a f
Slide 43: History of Spraberry/Wolfcamp Completions
History of Spraberry/Wolfcamp Completions 1950 - 70s 1980 - 90s 2000 - 09 2010 2011-12 2013+ Jo Mill 5,000’ – 7,000’ Horizontal Spraberry Shales Dean 5,000’ – 7,000’ Horizontal Jo Mill 5,000’ – 10,000’ Horizontal Wolfcamp A, B, C and D Limestone Pay Sandstone Pay Fracture Non-Organic Shale Non-Pay s
Slide 44: Spraberry/Wolfcamp Rig Count
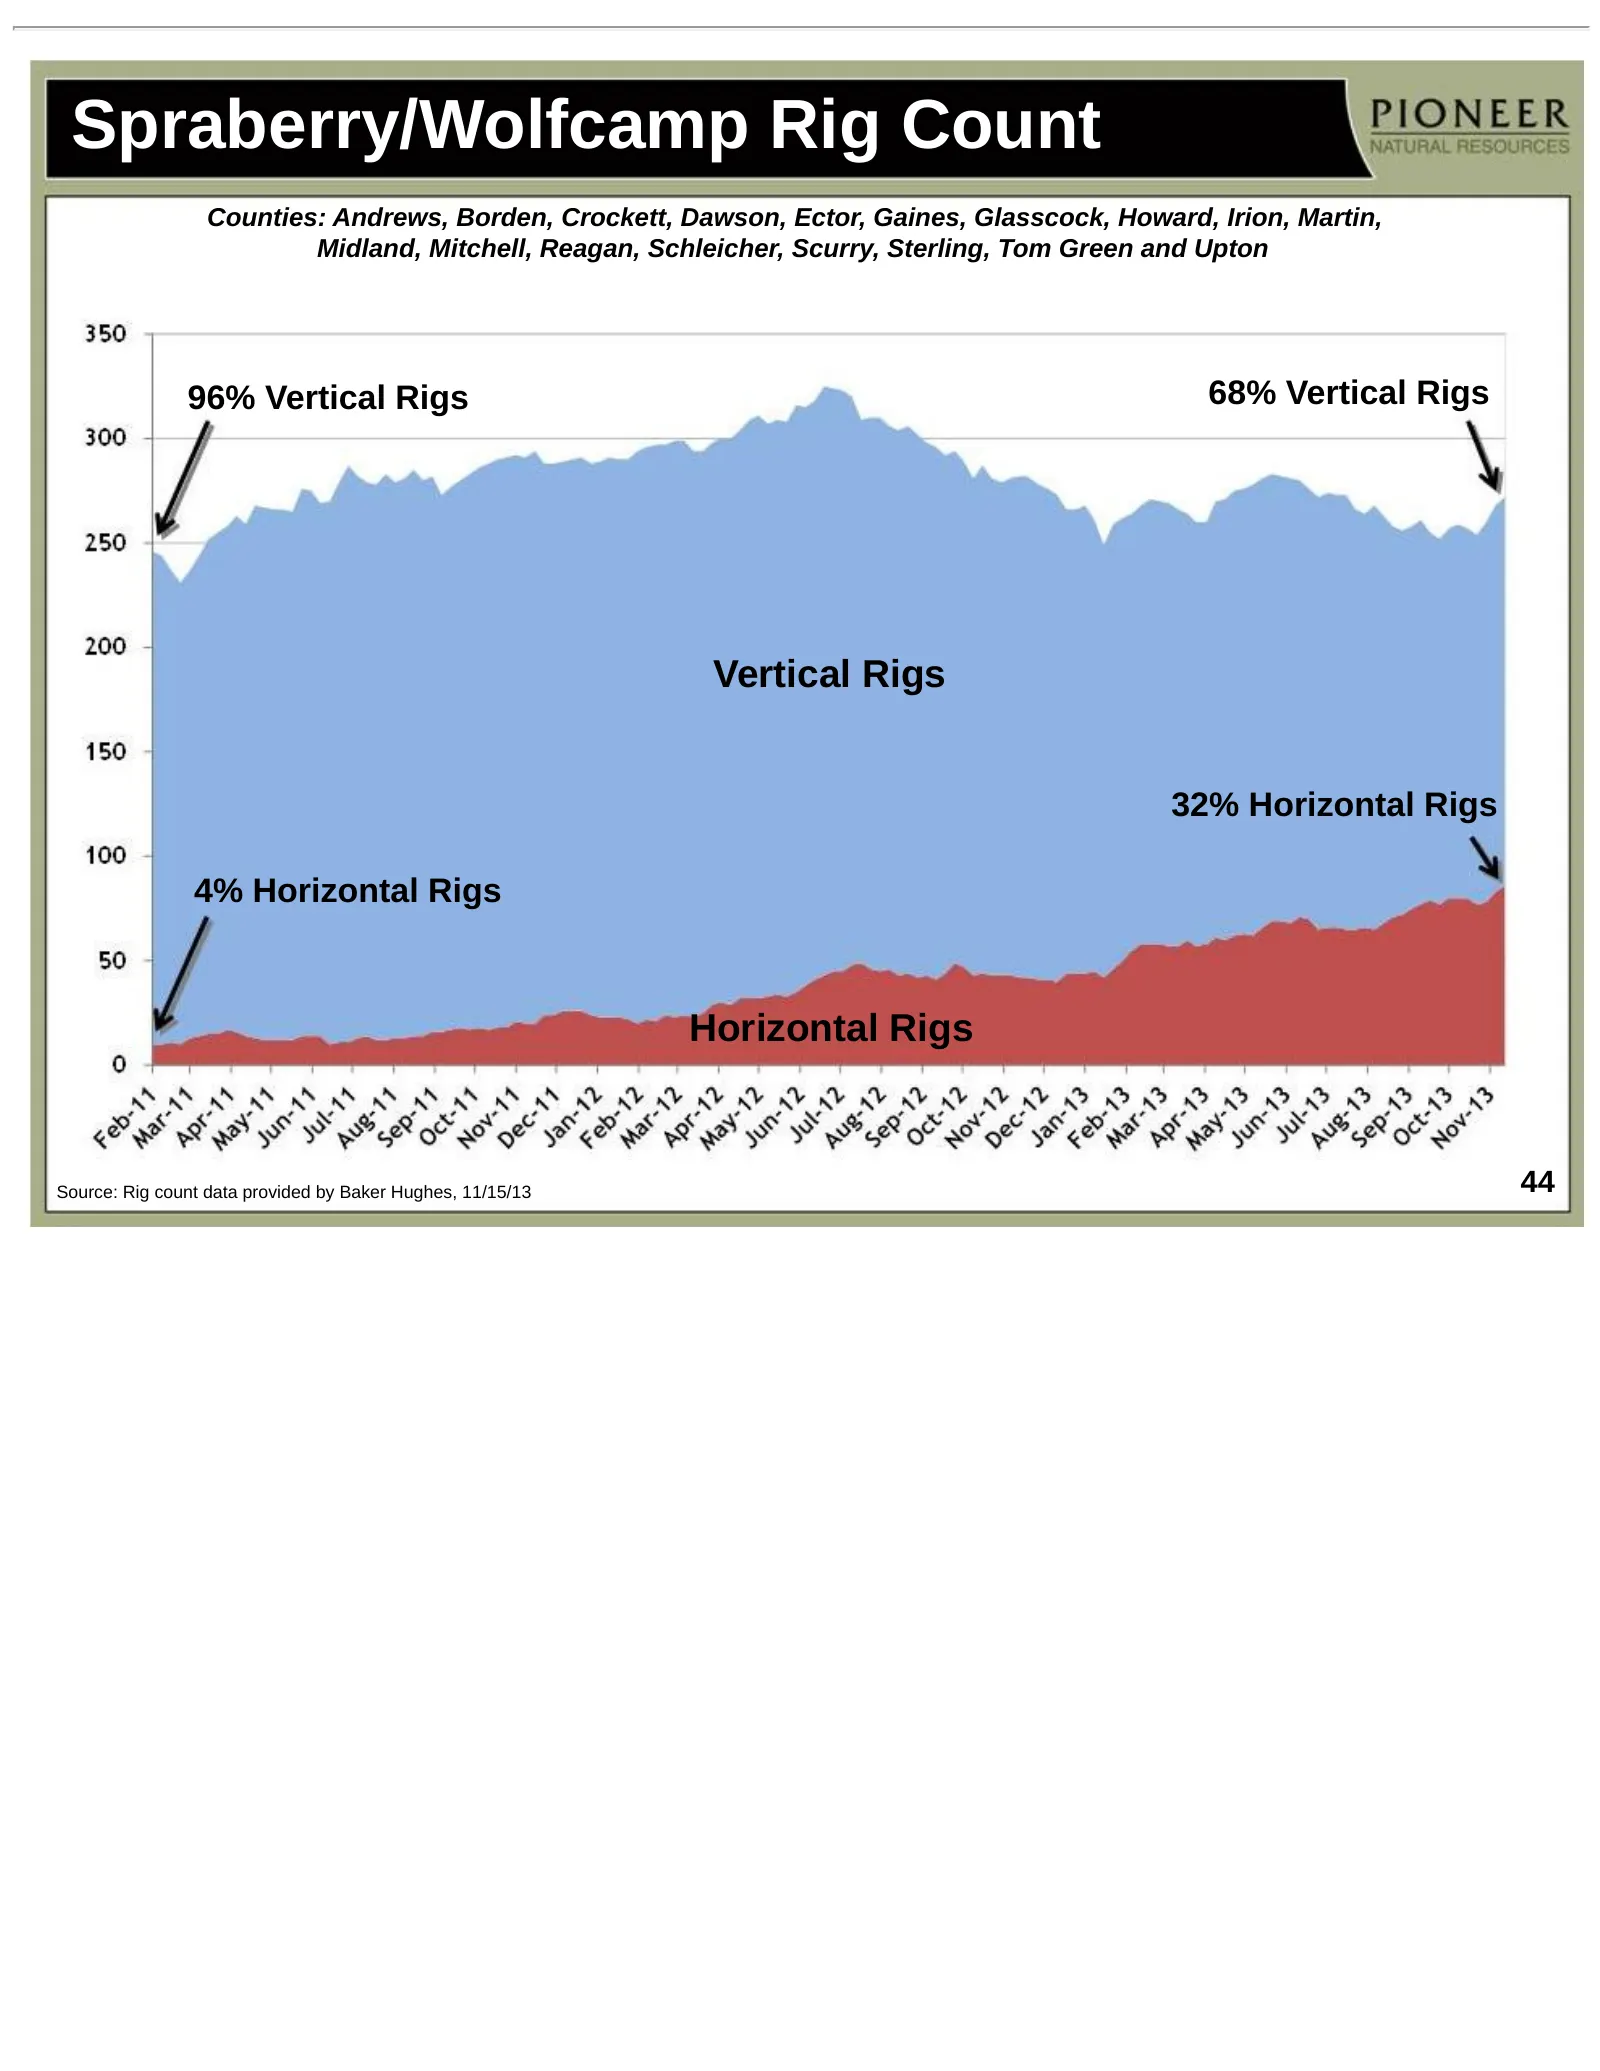
Spraberry/Wolfcamp Rig Count Counties: Andrews, Borden, Crockett, Dawson, Ector, Gaines, Glasscock, Howard, Irion, Martin, Midland, Mitchell, Reagan, Schleicher, Scurry, Sterling, Tom Green and Upton 96% Vertical Rigs 68% Vertical Rigs Vertical Rigs 32% Horizontal Rigs 4% Horizontal Rigs Horizontal
Slide 45: Major U.S. Shale Play Comparisons
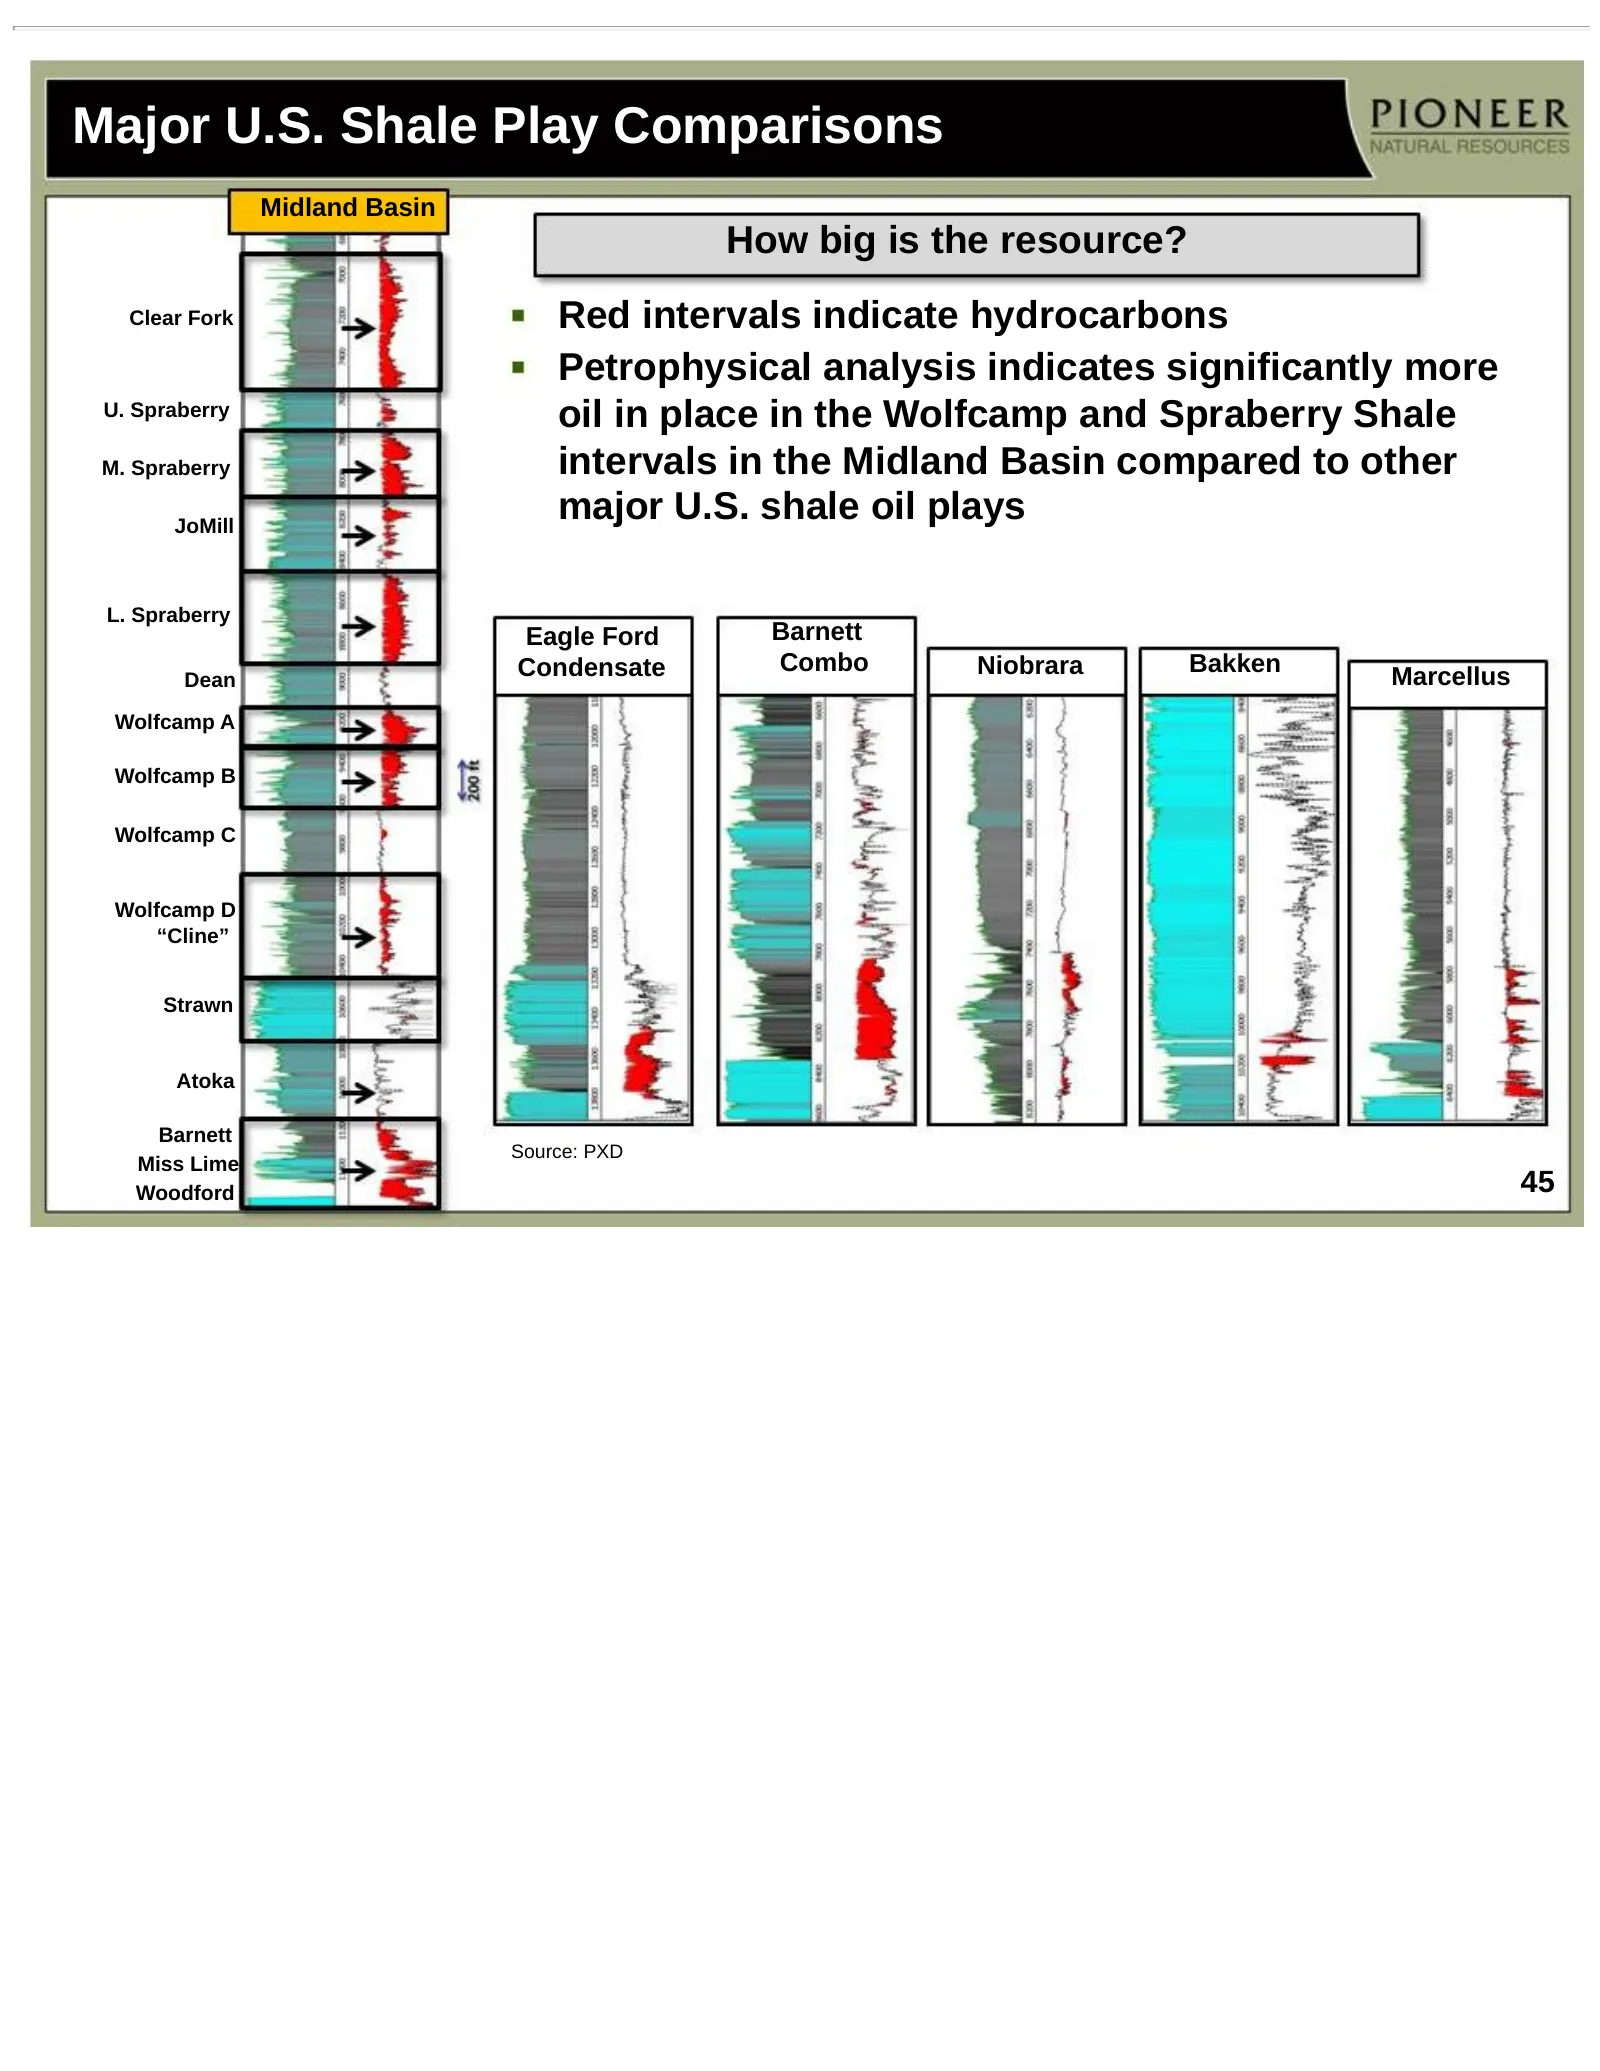
Major U.S. Shale Play Comparisons Midland Basin How big is the resource? Clear Fork Red intervals indicate hydrocarbons Petrophysical analysis indicates significantly more U. Spraberry oil in place in the Wolfcamp and Spraberry Shale M. Spraberry intervals in the Midland Basin compared to other JoMi
Slide 46: Wolfcamp Comparison to Other Major U.S. Oil Shale Plays
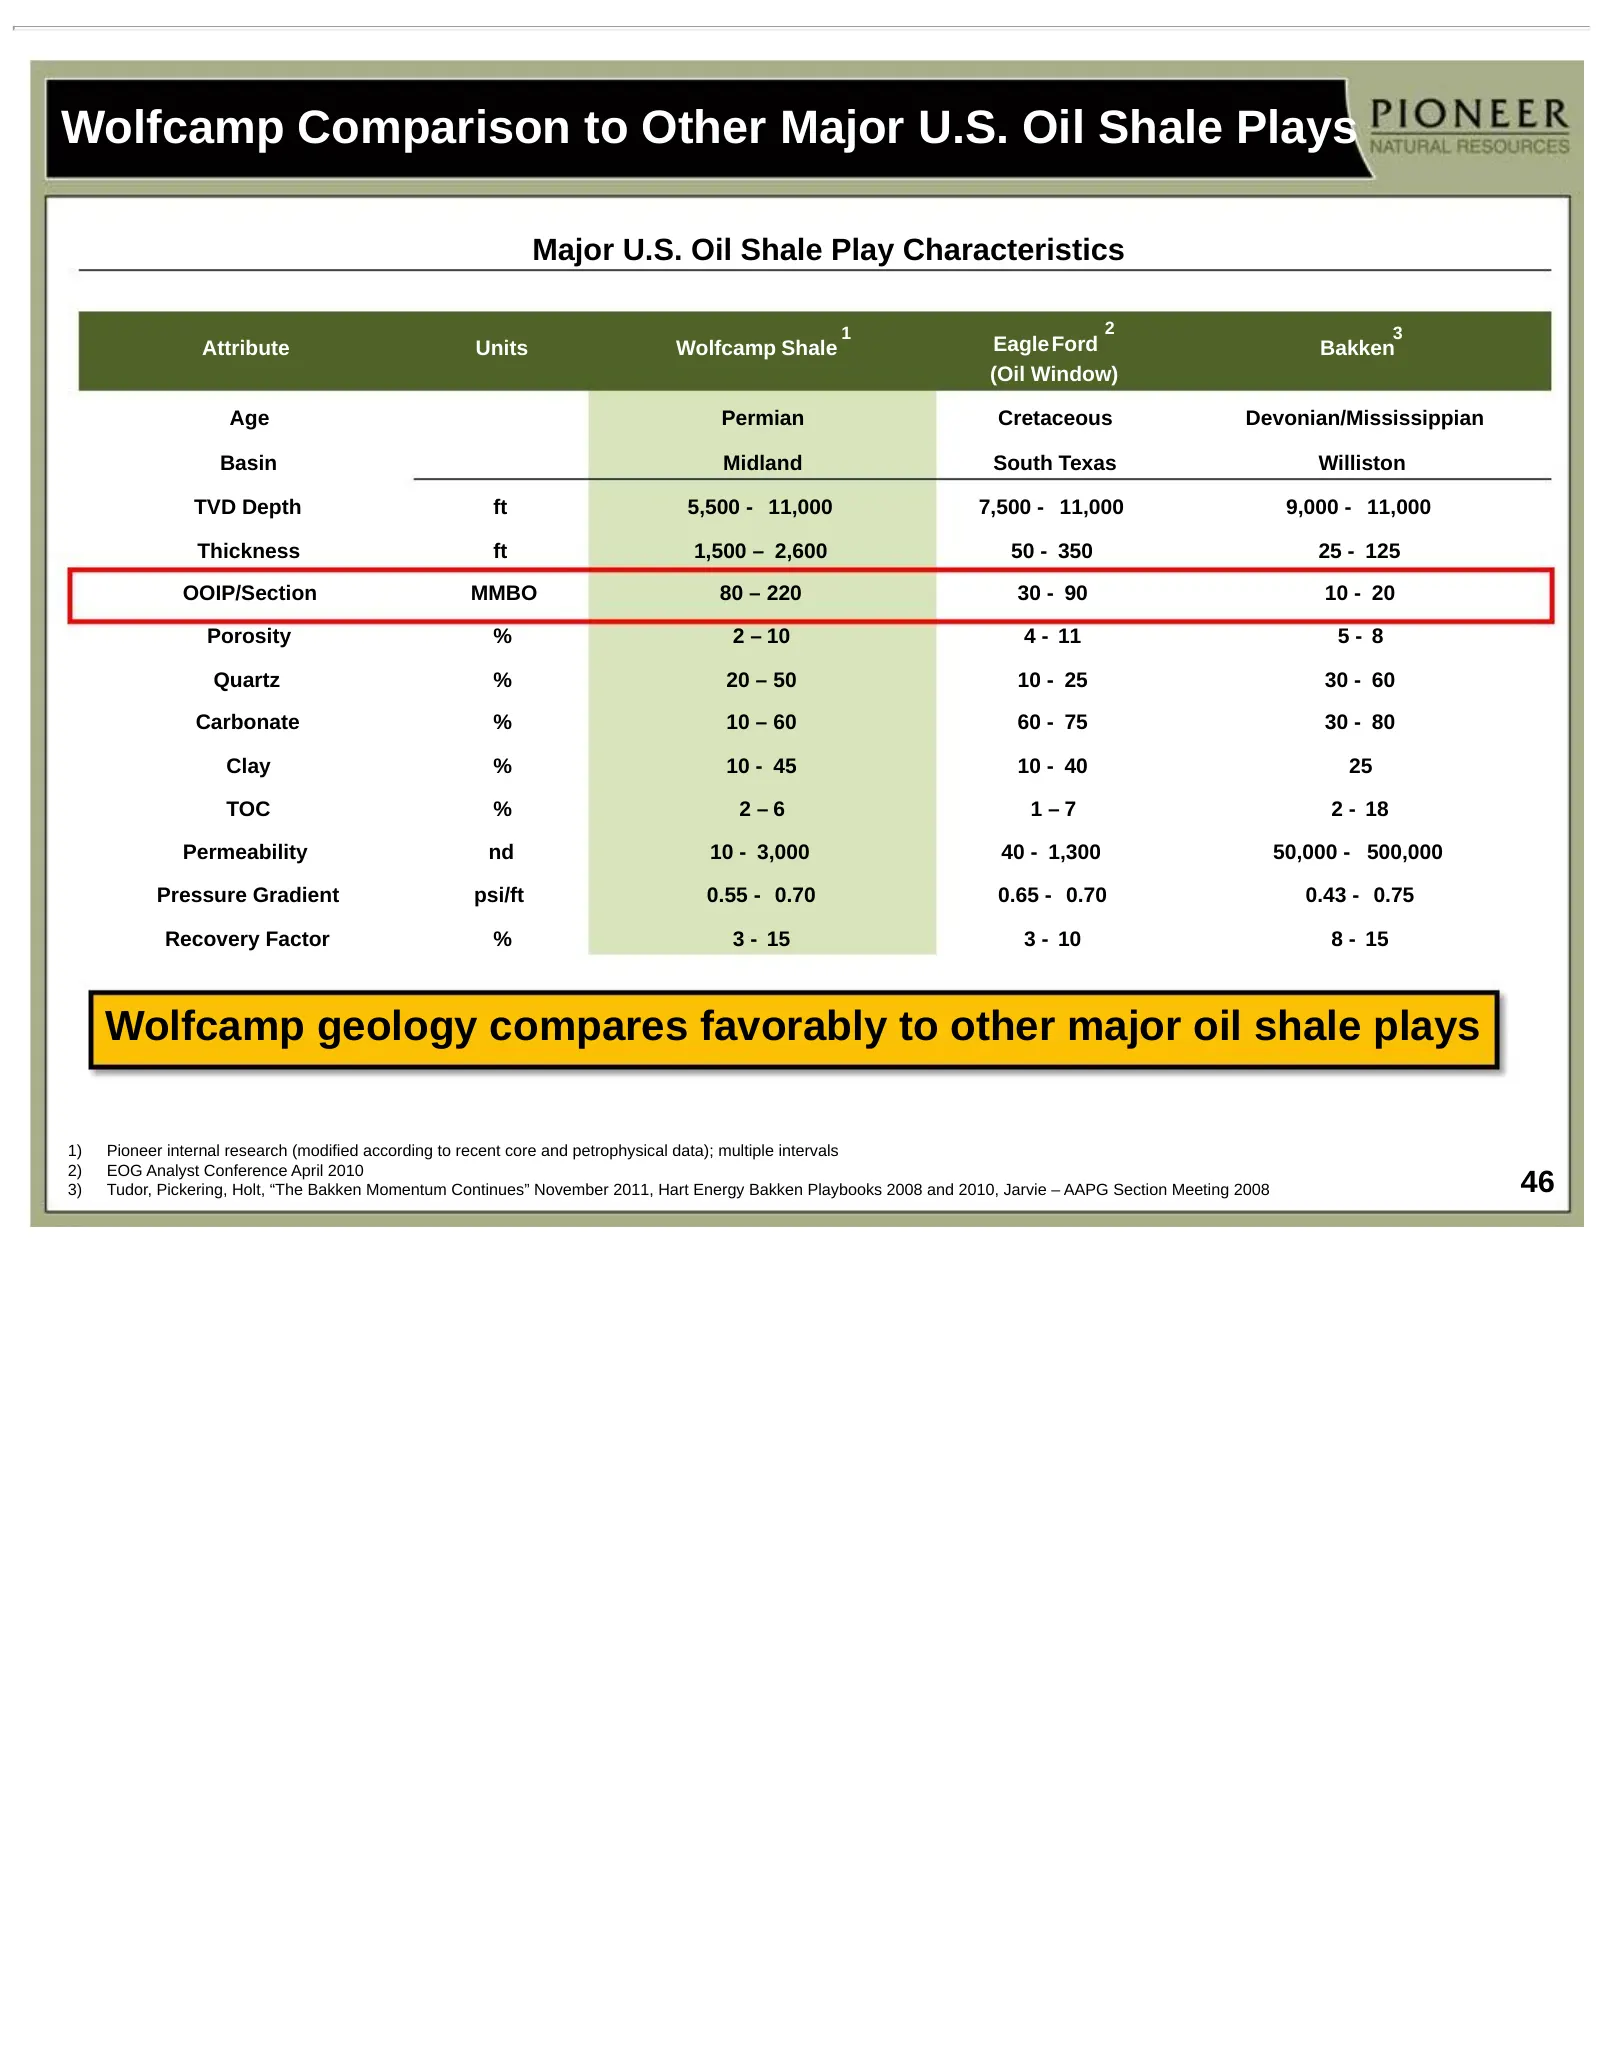
Wolfcamp Comparison to Other Major U.S. Oil Shale Plays Major U.S. Oil Shale Play Characteristics 1 2 3 Attribute Units Wolfcamp Shale Eagle Ford Bakken (Oil Window) Age Permian Cretaceous Devonian/Mississippian Basin Midland South Texas Williston TVD Depth ft 5,500 - 11,000 7,500 - 11,000 9,000 - 1
Slide 47: Wolfcamp B Interval Prospectivity Map
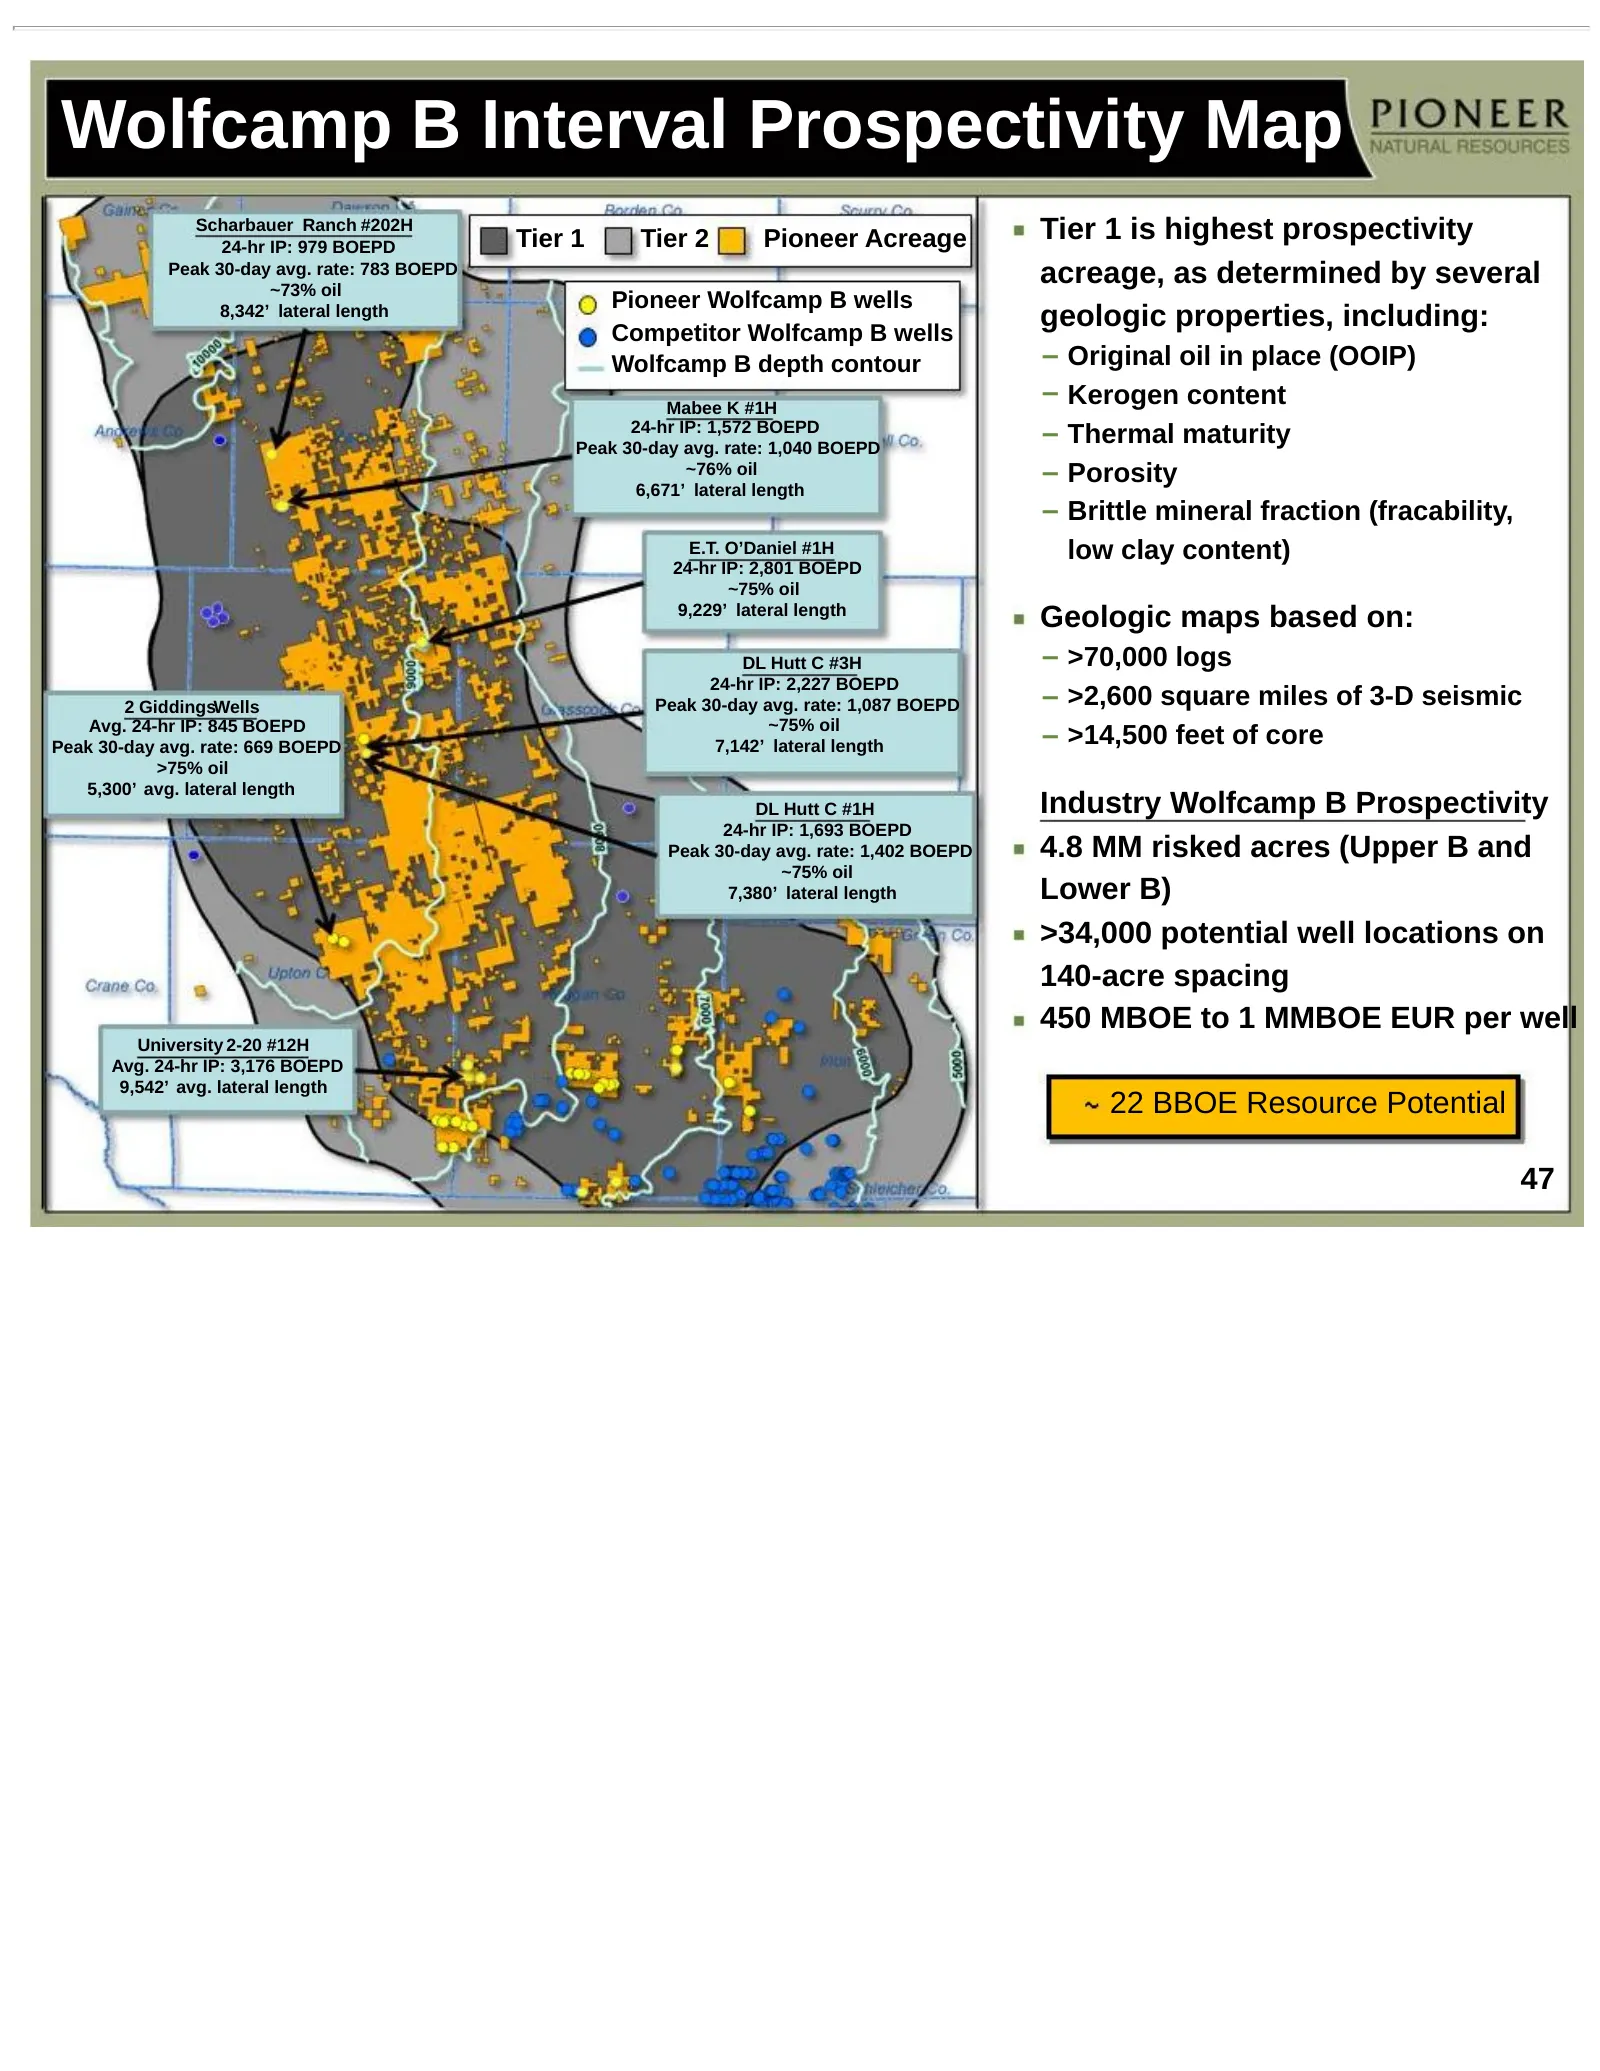
Wolfcamp B Interval Prospectivity Map Scharbauer Ranch #202H 24-hr IP: 979 BOEPD Tier 1 Tier 2 Pioneer Acreage Tier 1 is highest prospectivity Peak 30-day avg. rate: 783 BOEPD ~73% oil acreage, as determined by several Pioneer Wolfcamp B wells 8,342’ lateral length Competitor Wolfcamp B wells geolog
Slide 48: 50 BBOE Recoverable Resource Potential by Industry
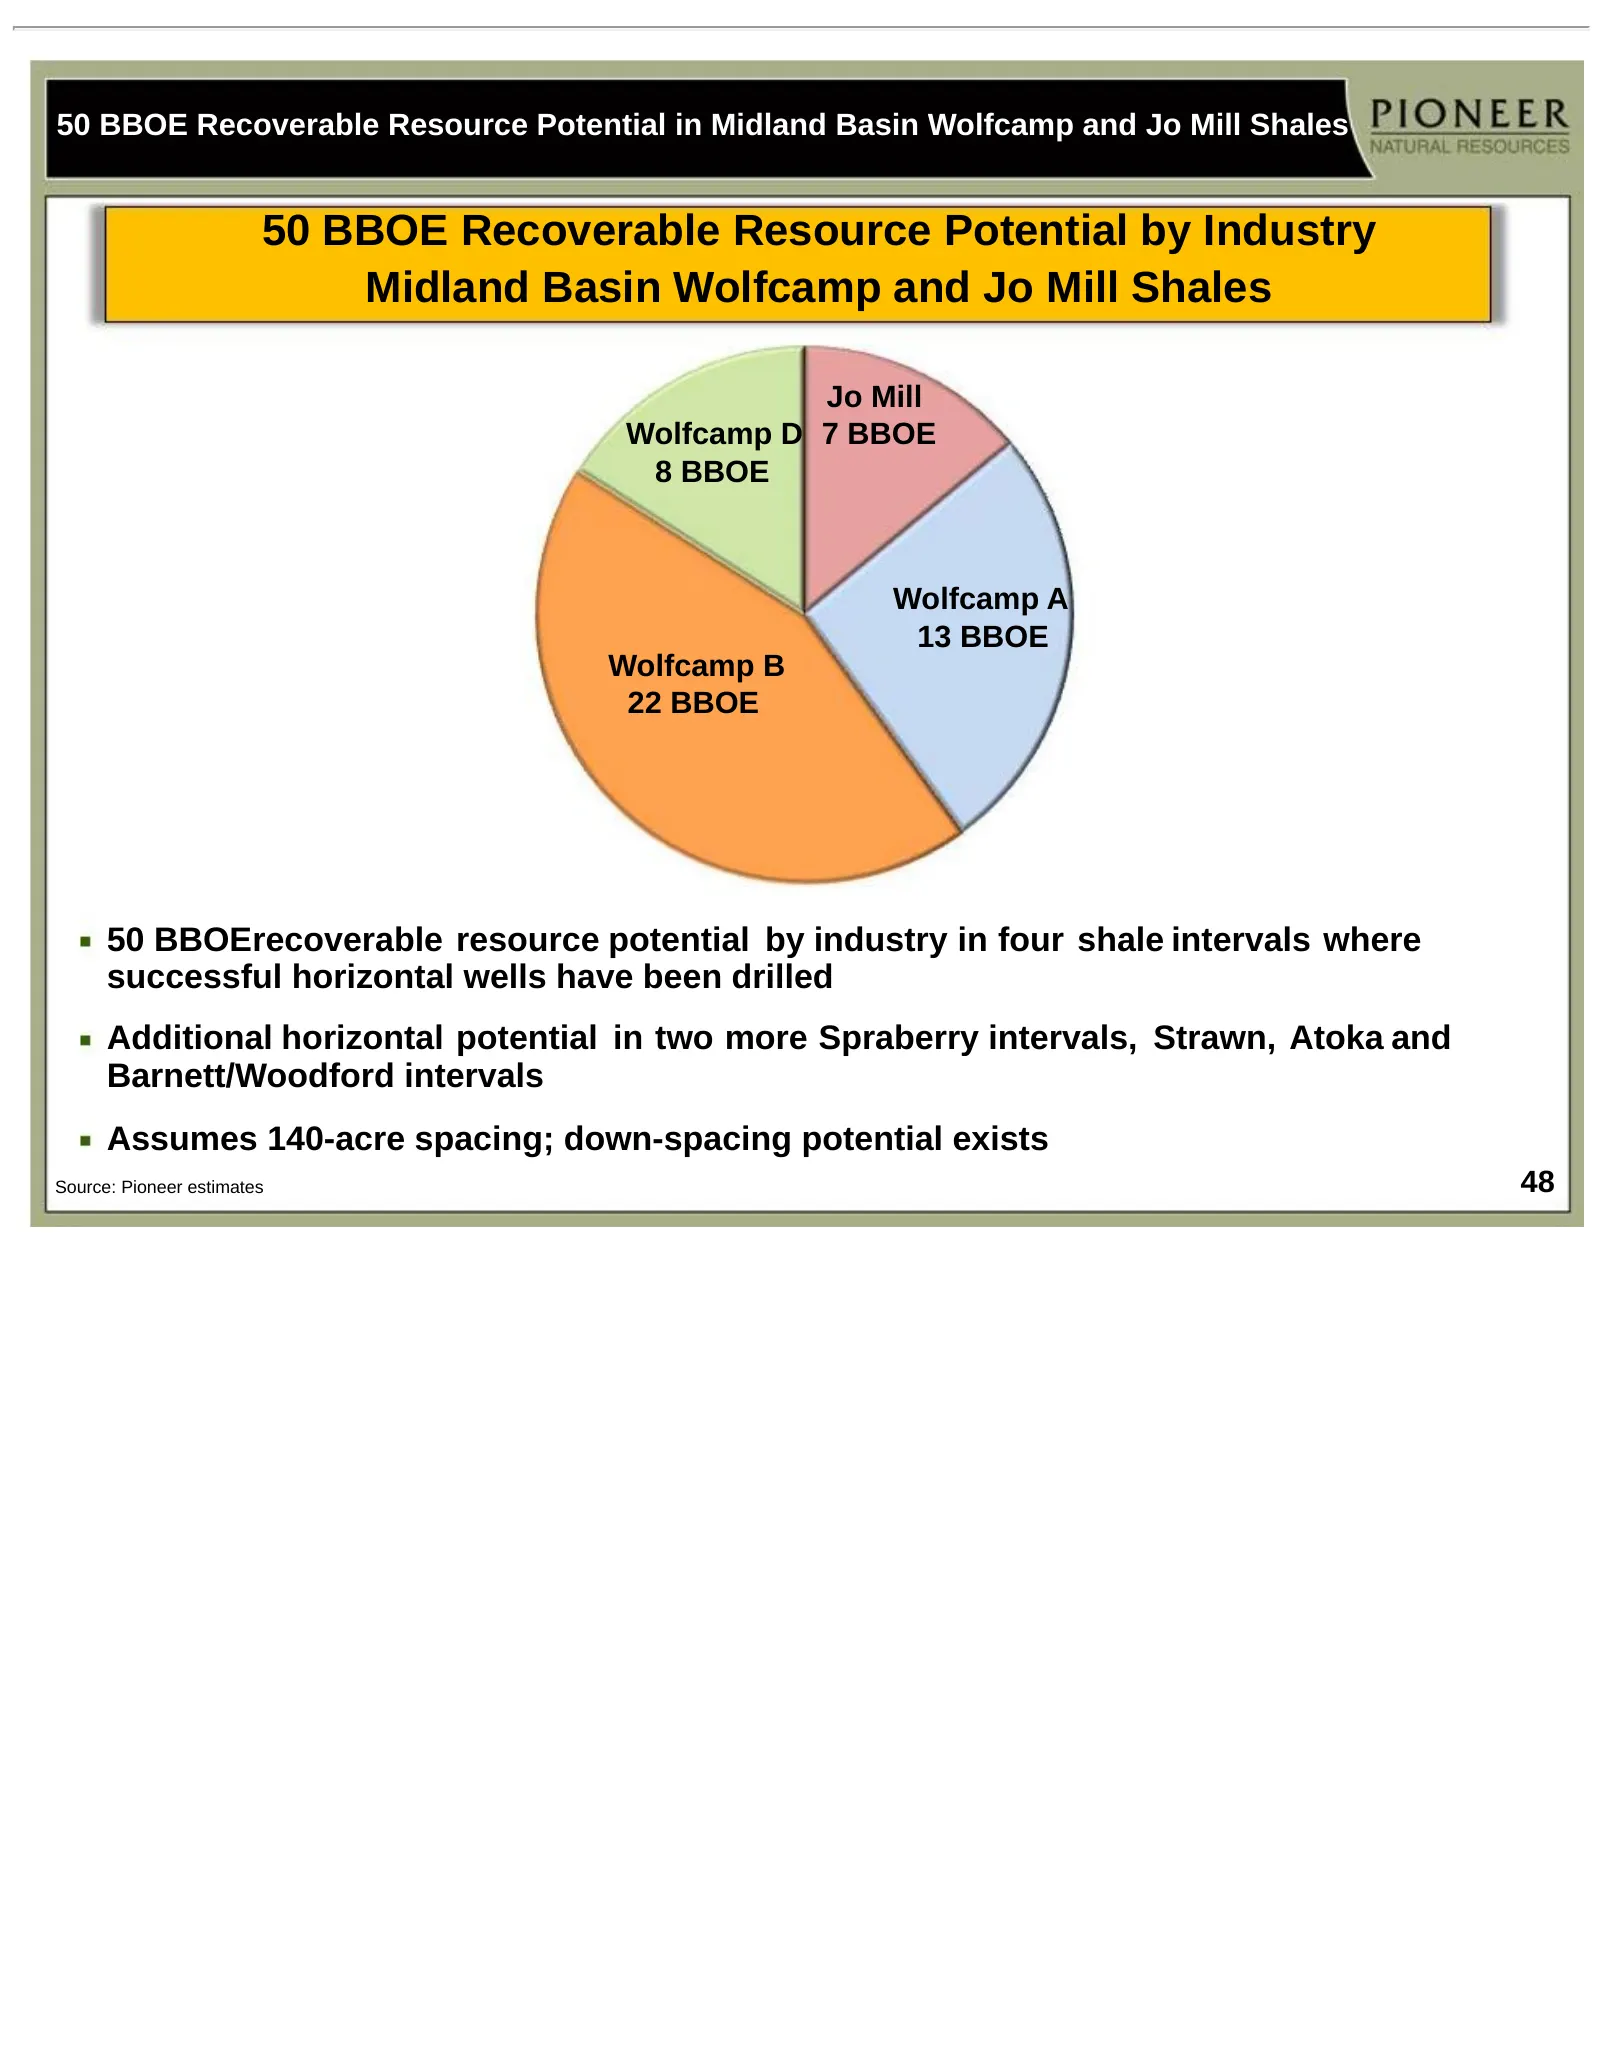
50 BBOE Recoverable Resource Potential in Midland Basin Wolfcamp and Jo Mill Shales 50 BBOE Recoverable Resource Potential by Industry Midland Basin Wolfcamp and Jo Mill Shales Jo Mill Wolfcamp D 7 BBOE 8 BBOE Wolfcamp A 13 BBOE Wolfcamp B 22 BBOE 50 BBOErecoverable resource potential by industry in
Slide 49: Largest Oil Fields Worldwide
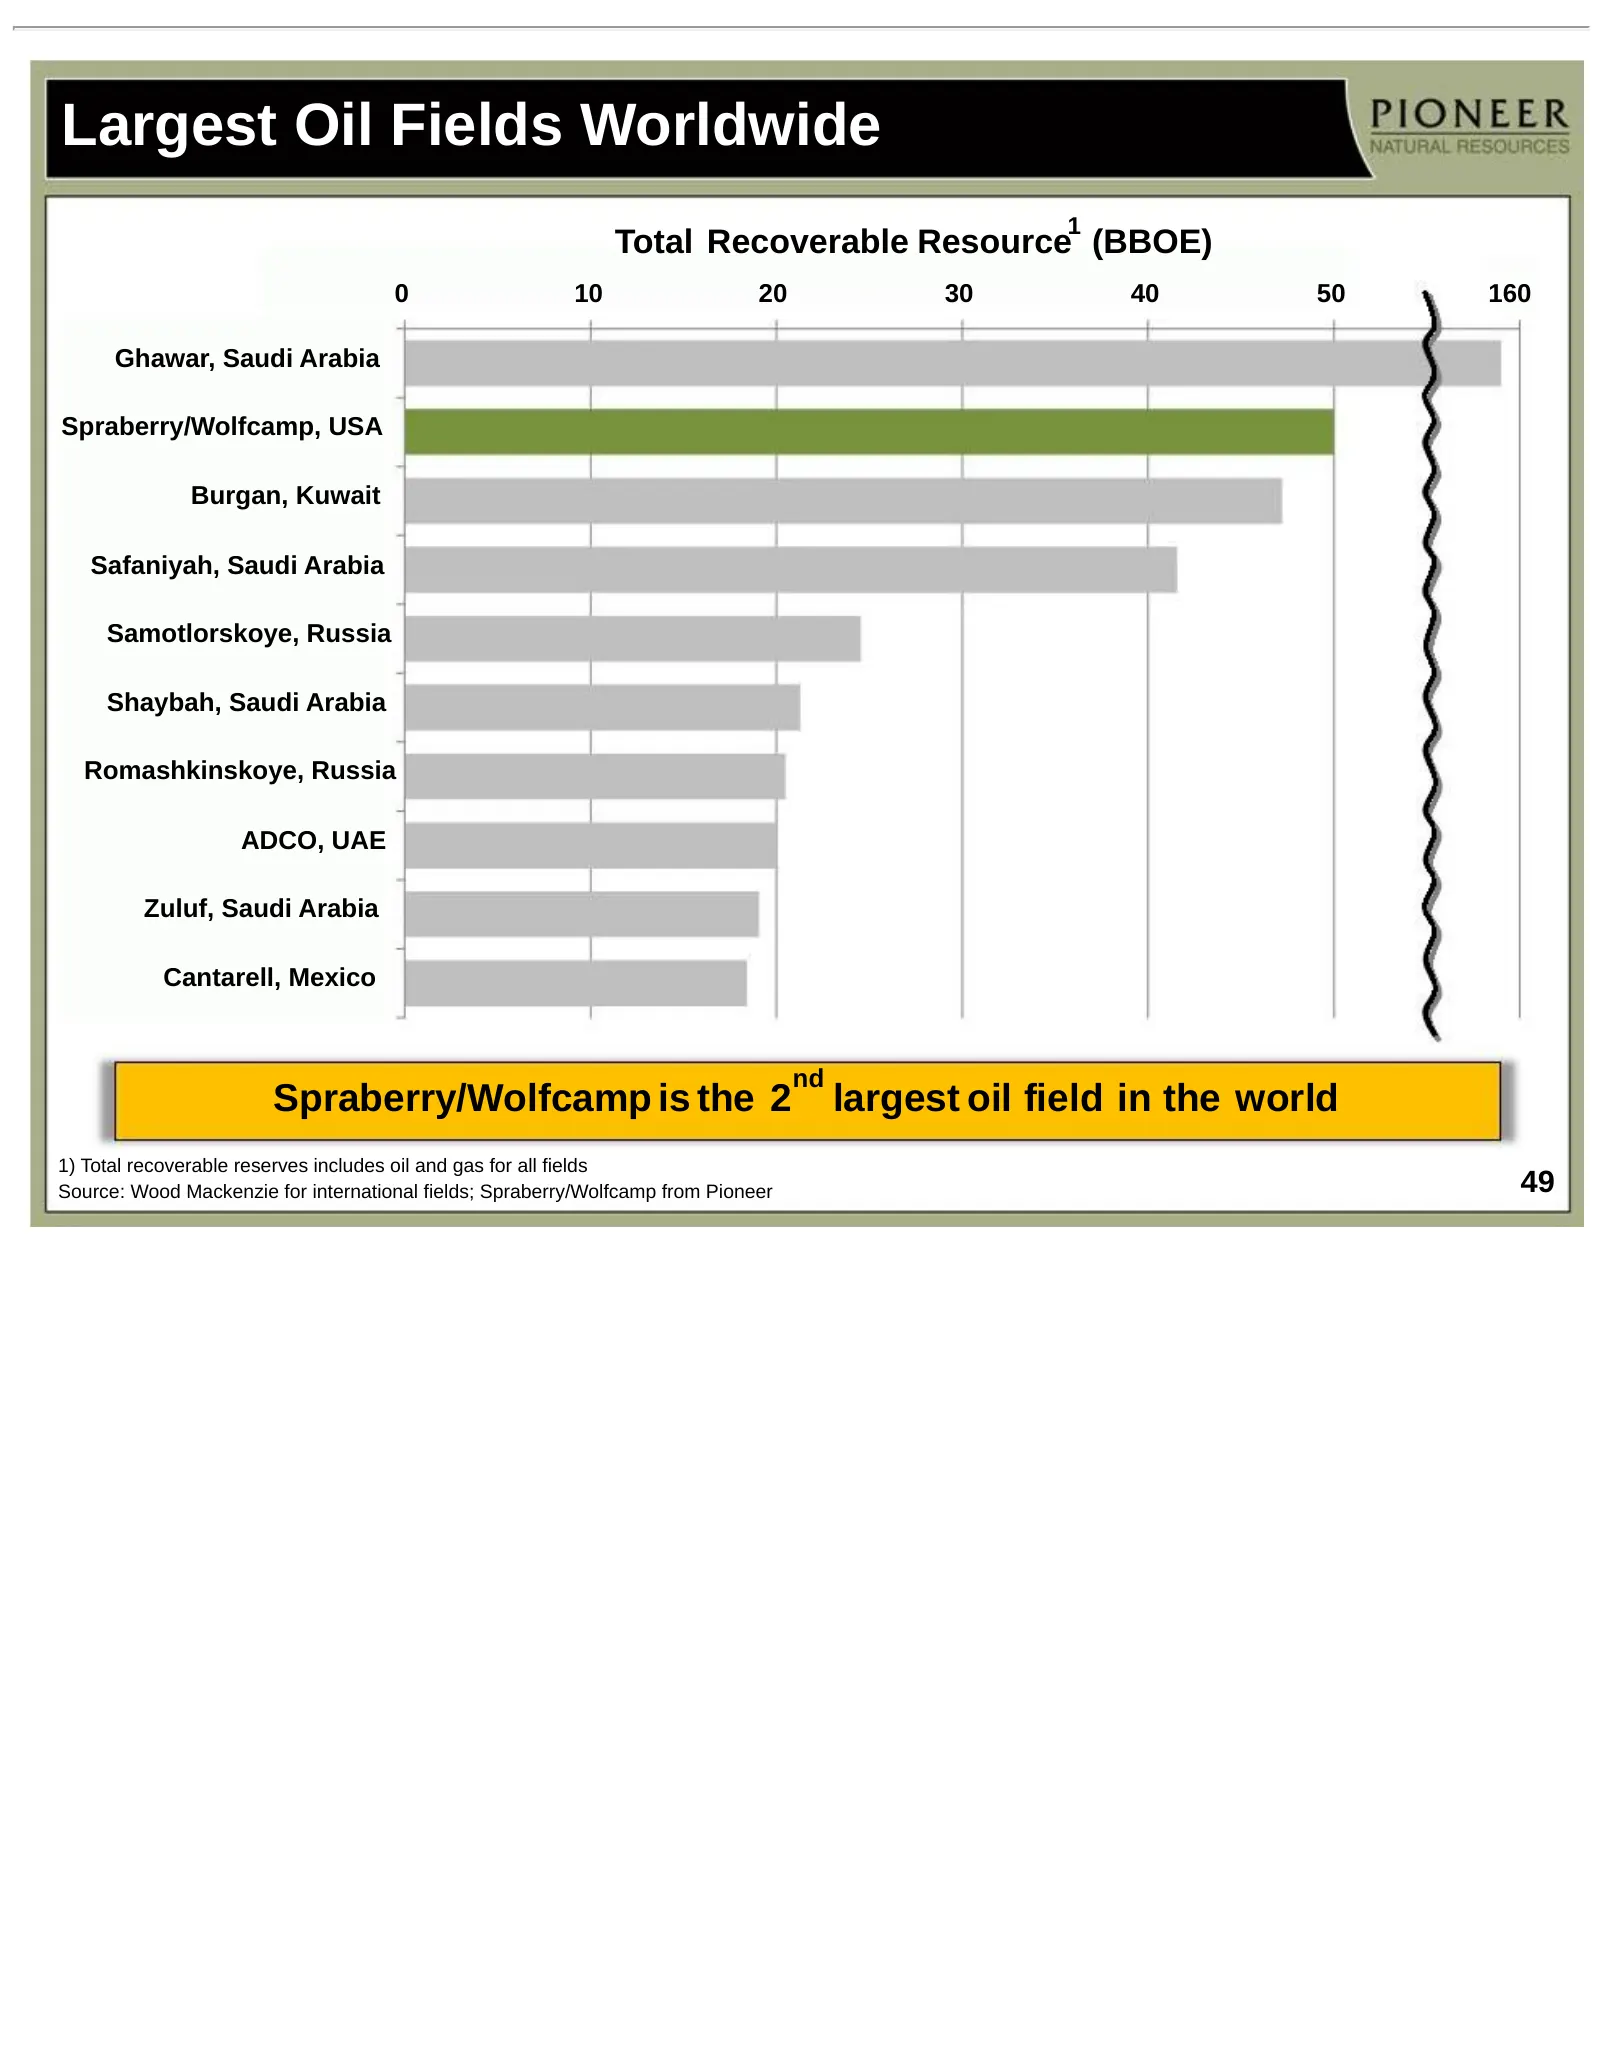
Largest Oil Fields Worldwide 1 Total Recoverable Resource (BBOE) 0 10 20 30 40 50 160 Ghawar, Saudi Arabia Spraberry/Wolfcamp, USA Burgan, Kuwait Safaniyah, Saudi Arabia Samotlorskoye, Russia Shaybah, Saudi Arabia Romashkinskoye, Russia ADCO, UAE Zuluf, Saudi Arabia Cantarell, Mexico nd Spraberry/Wo
Slide 50: Largest U.S. Oil Fields
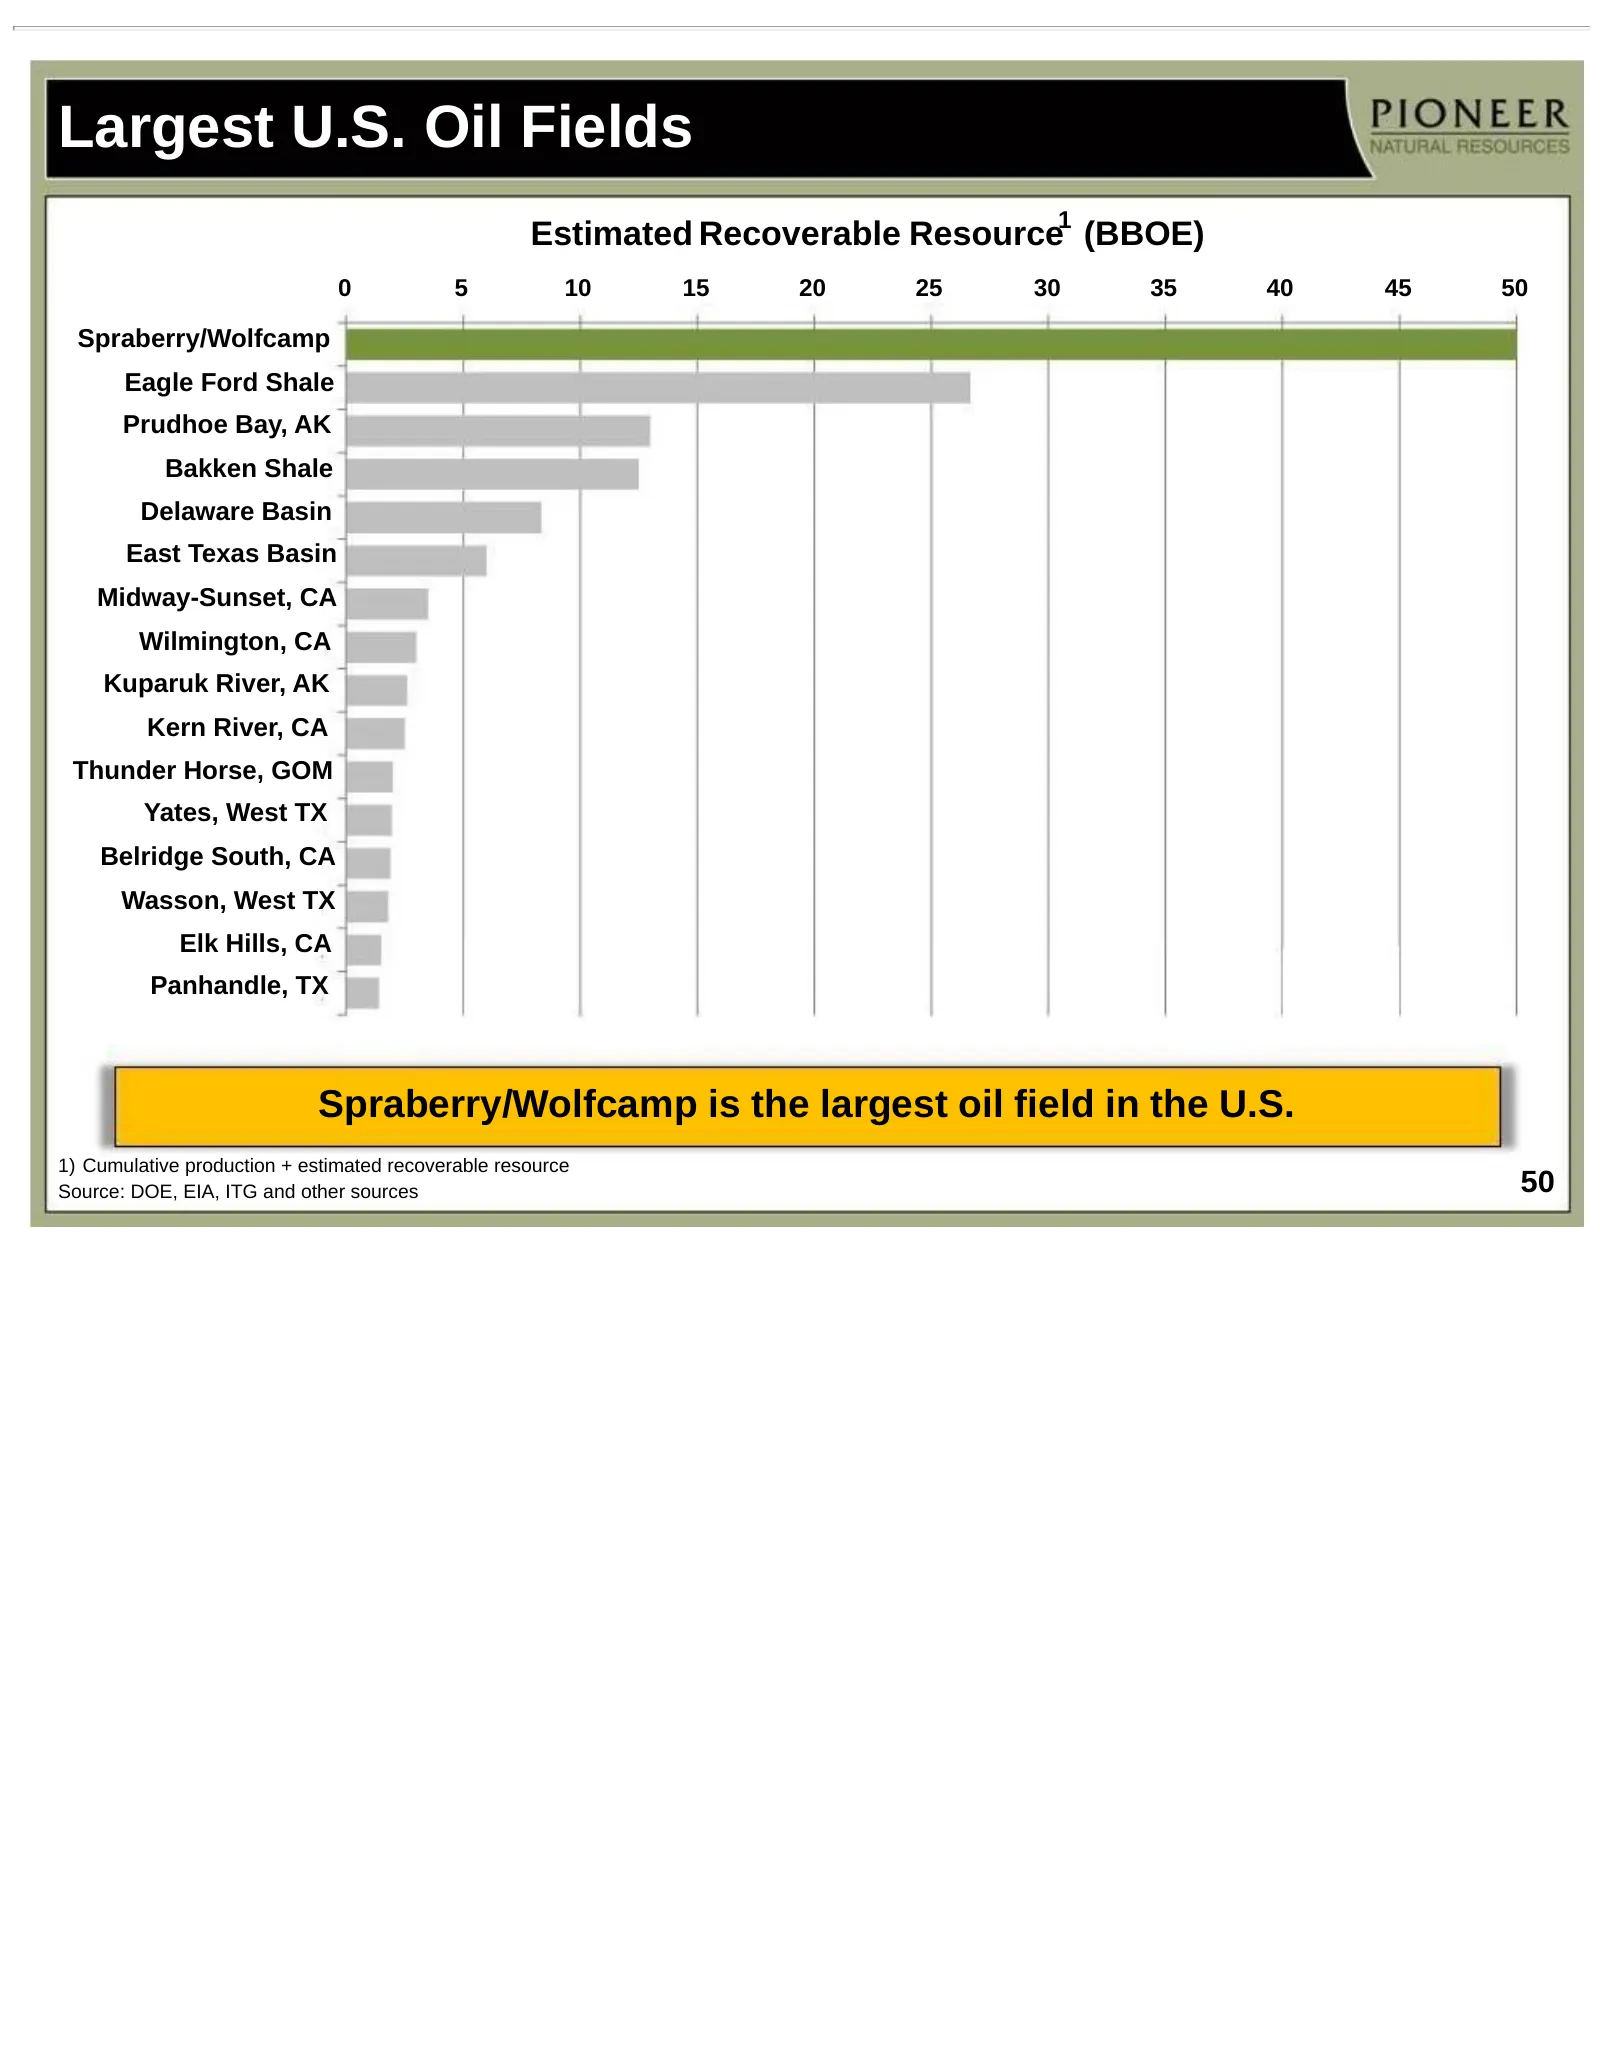
Largest U.S. Oil Fields 1 Estimated Recoverable Resource (BBOE) 0 5 10 15 20 25 30 35 40 45 50 Spraberry/Wolfcamp Eagle Ford Shale Prudhoe Bay, AK Bakken Shale Delaware Basin East Texas Basin Midway-Sunset, CA Wilmington, CA Kuparuk River, AK Kern River, CA Thunder Horse, GOM Yates, West TX Belridge
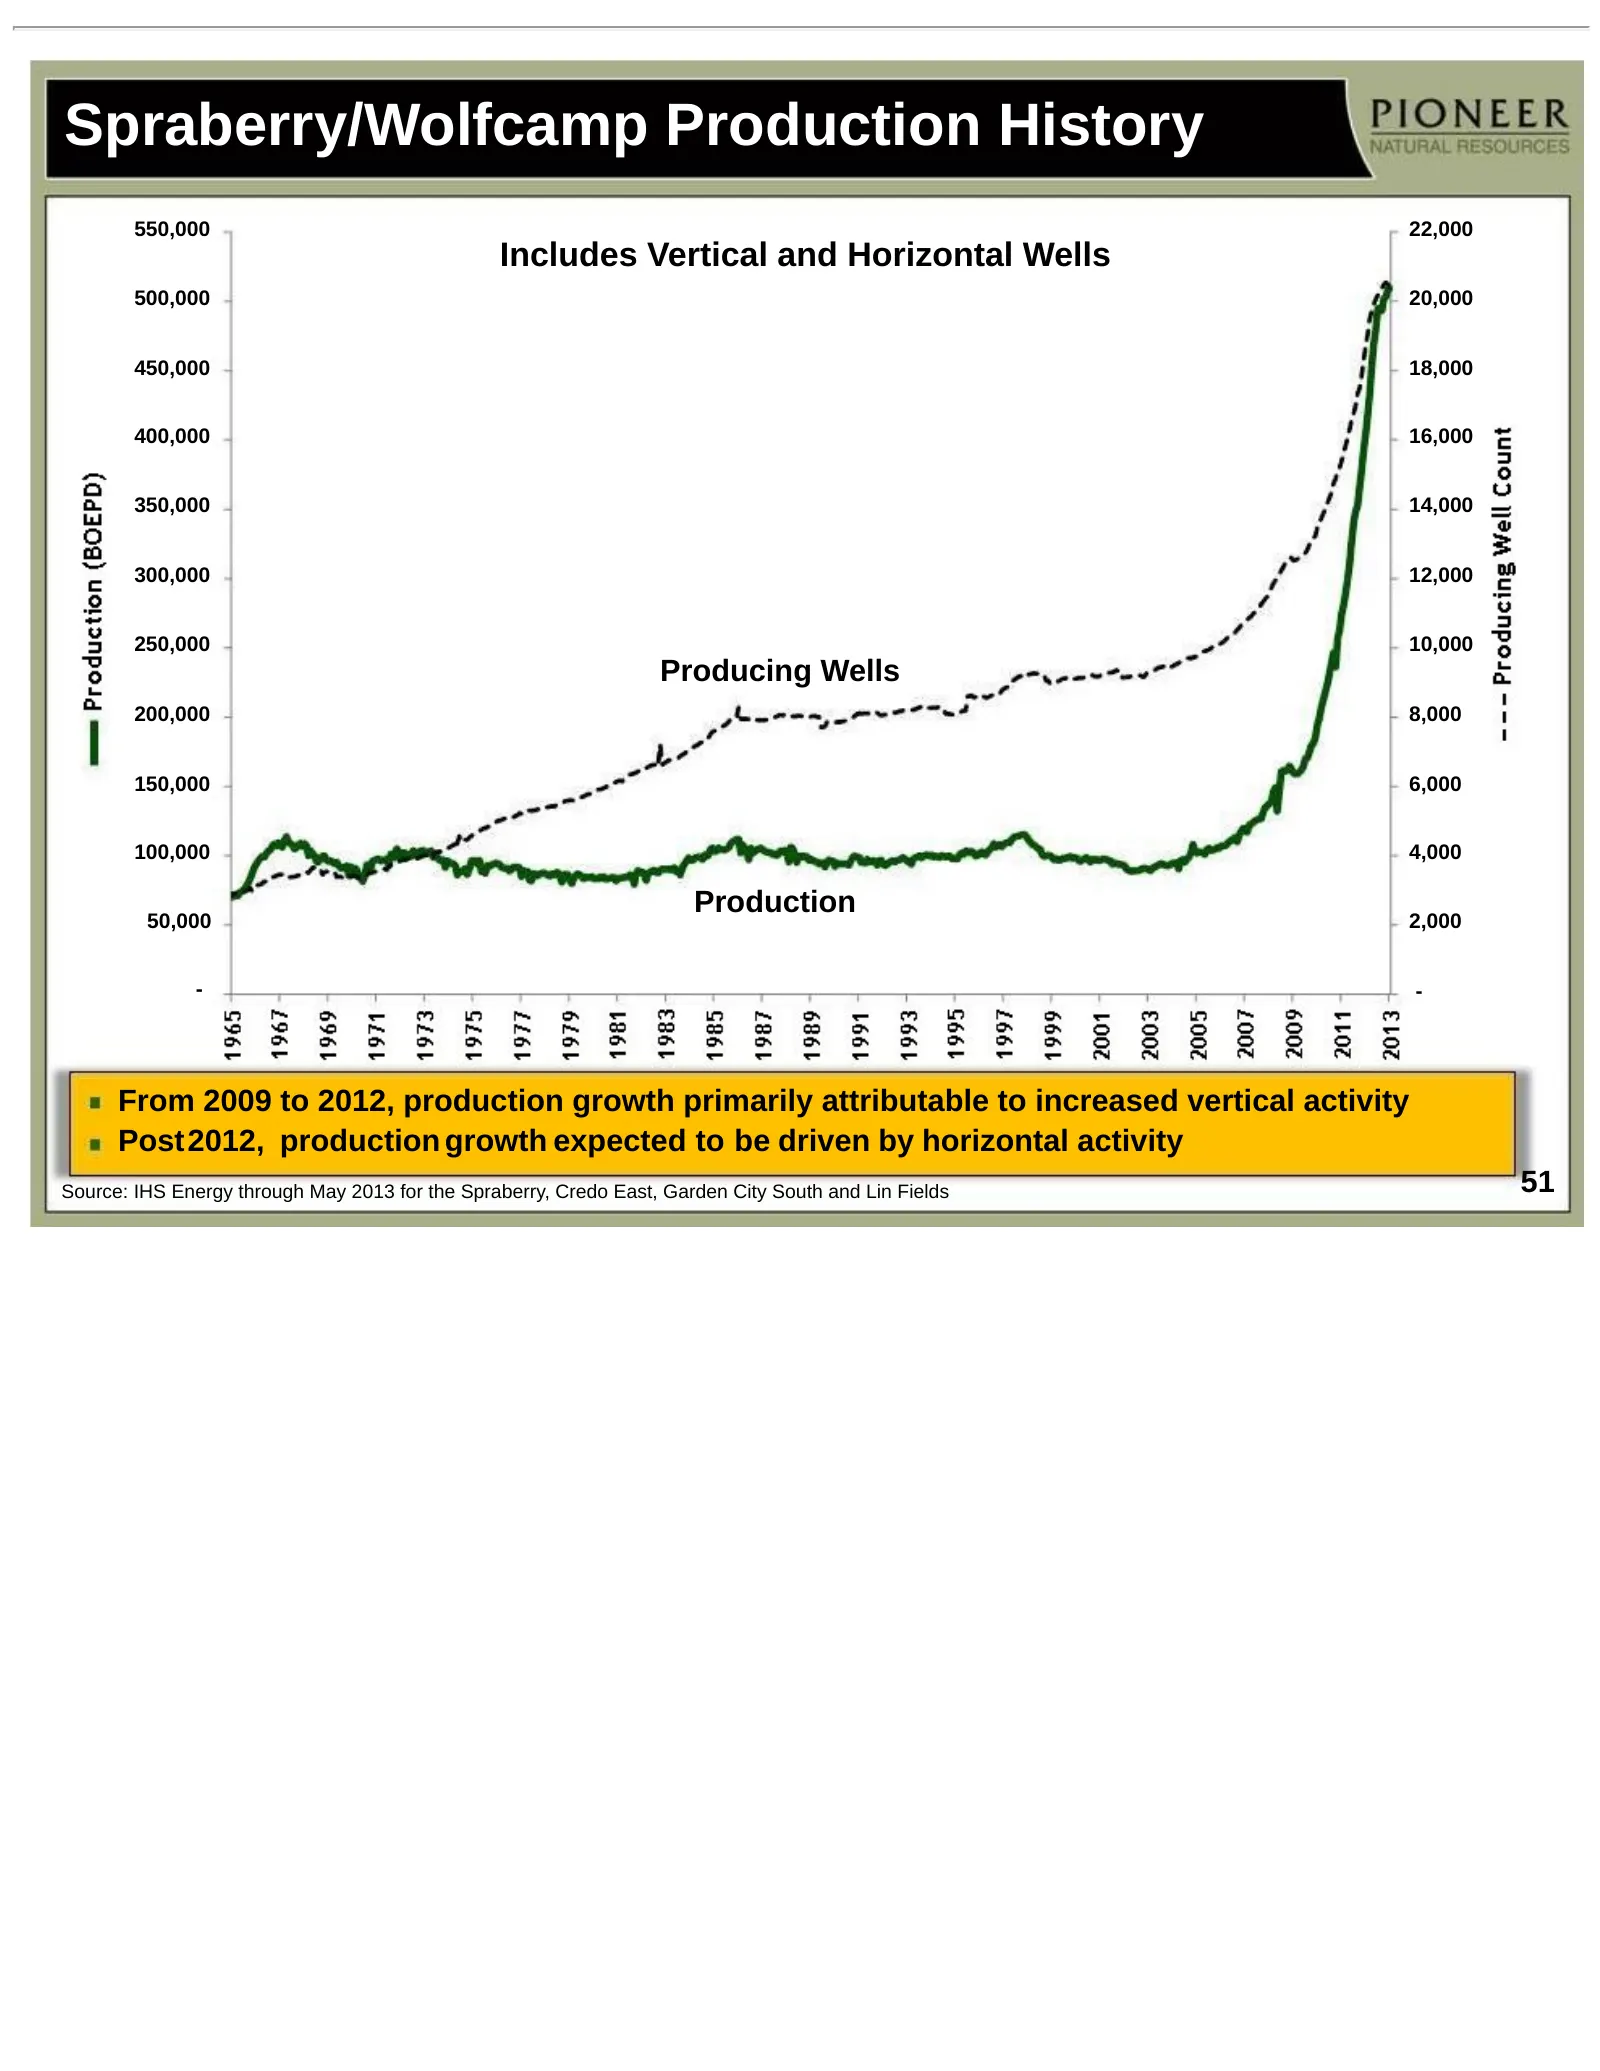
Slide 51: Spraberry/Wolfcamp Production History
Spraberry/Wolfcamp Production History 550,000 22,000 Includes Vertical and Horizontal Wells 500,000 20,000 450,000 18,000 400,000 16,000 350,000 14,000 300,000 12,000 250,000 10,000 Producing Wells 200,000 8,000 150,000 6,000 100,000 4,000 Production 50,000 2,000 - - From 2009 to 2012, production gr
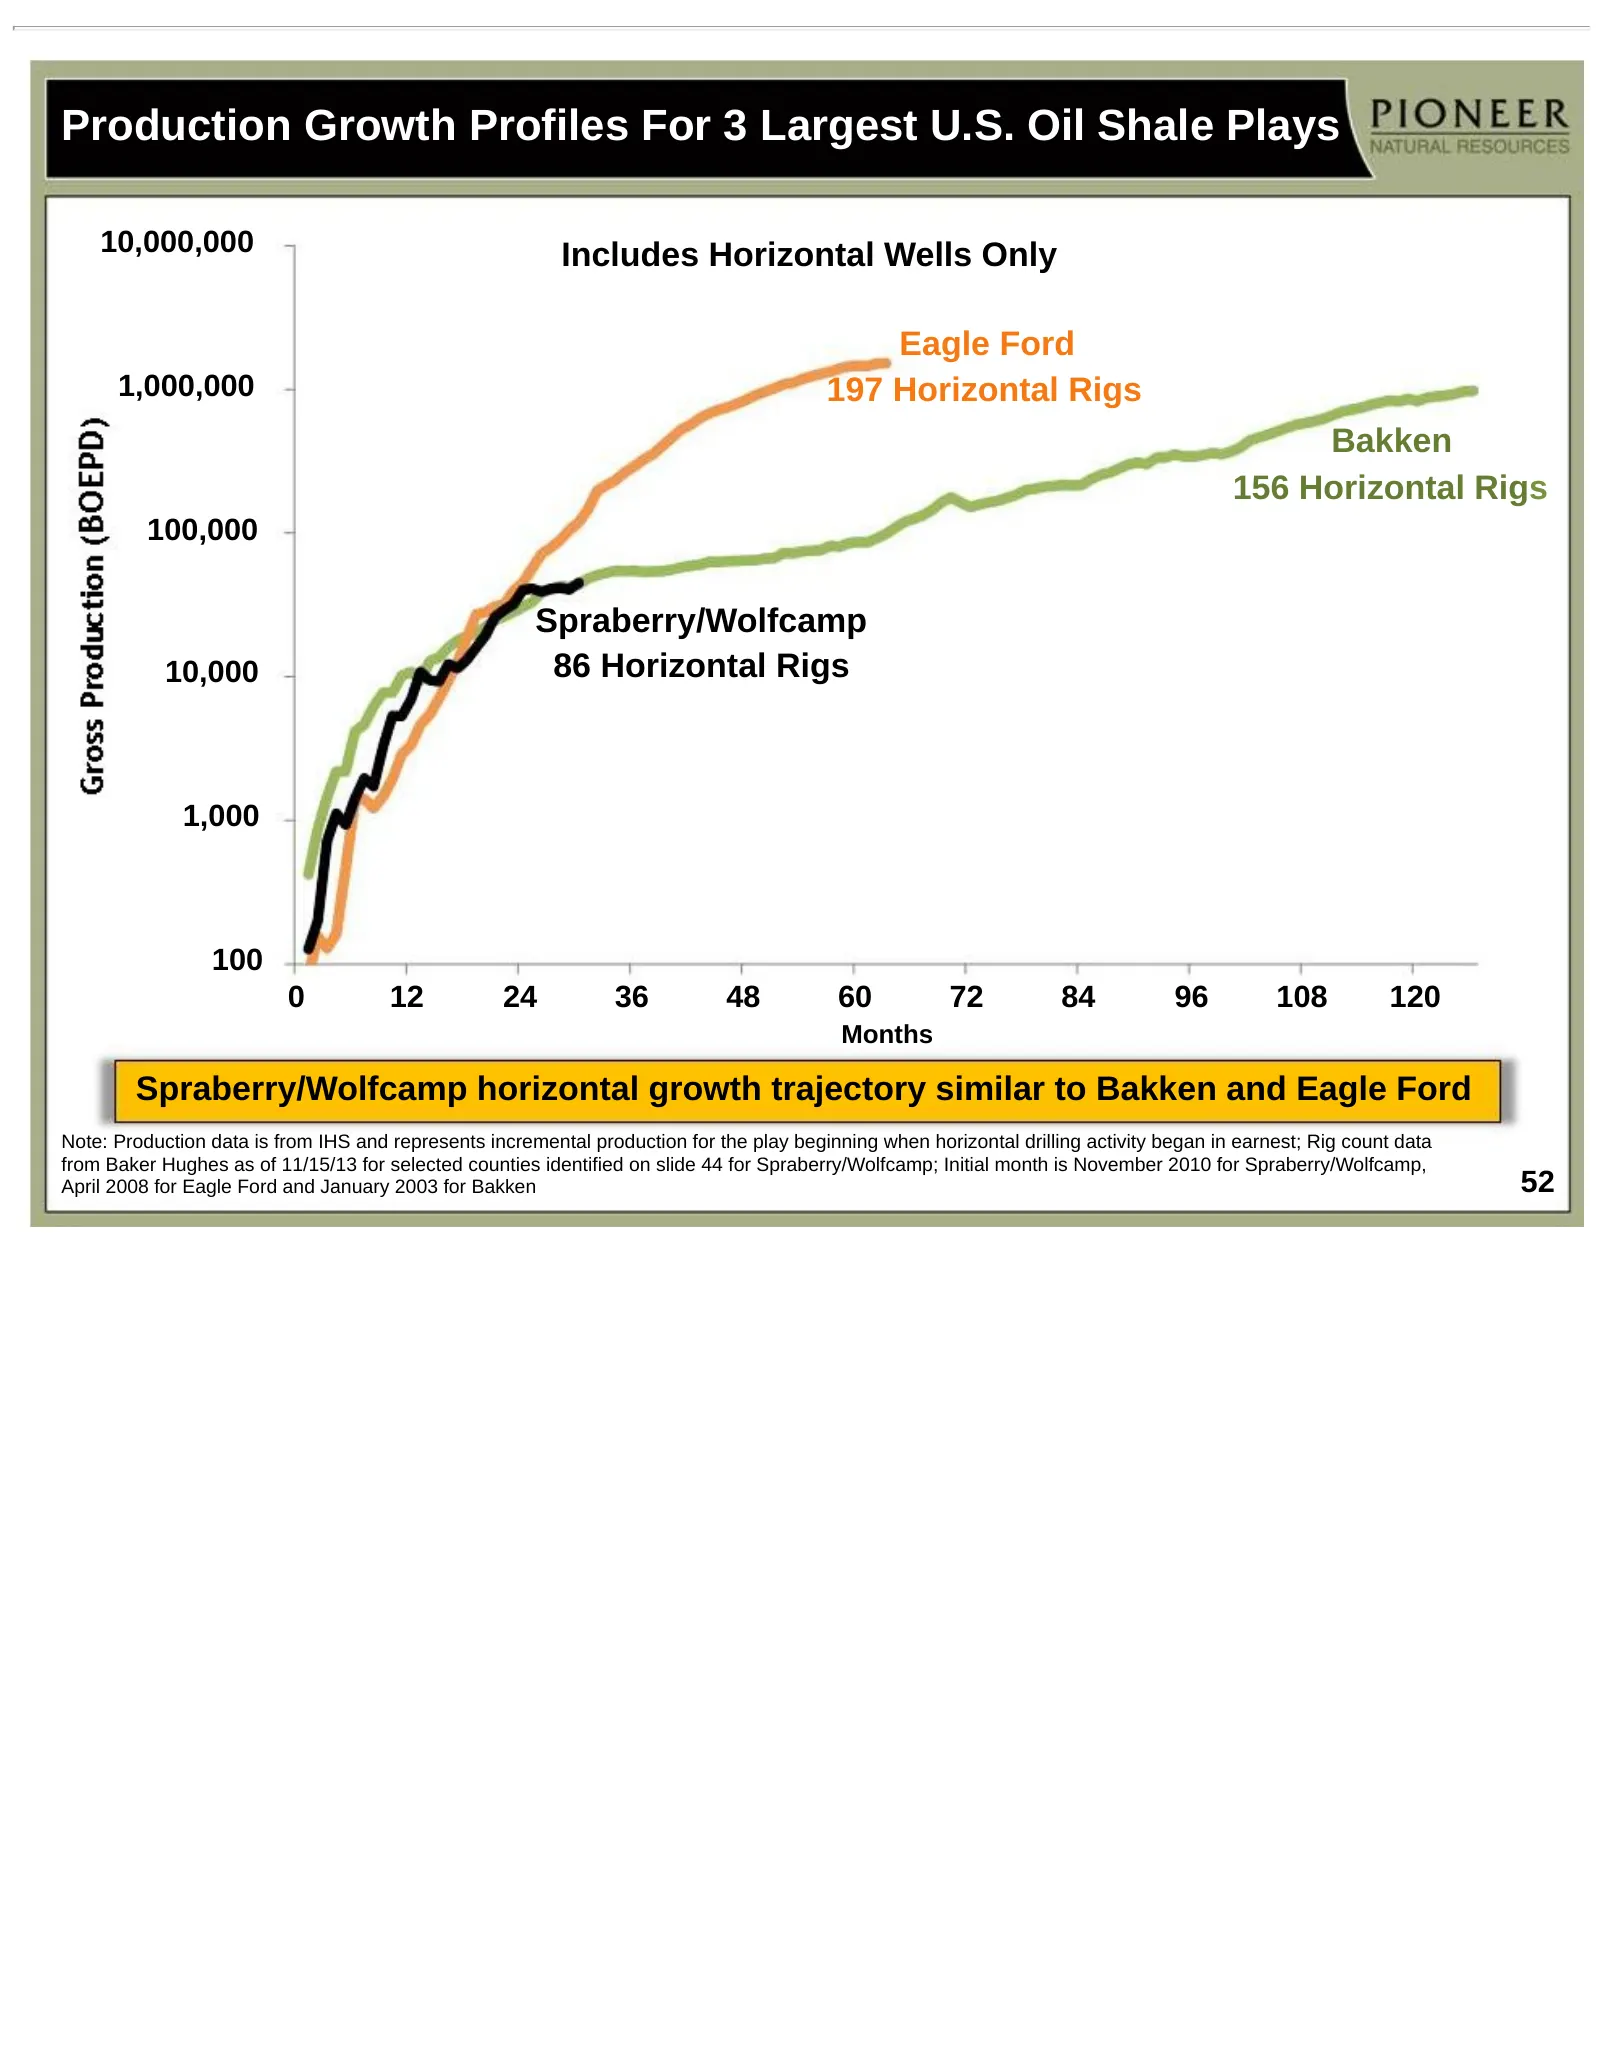
Slide 52: Production Growth Profiles For Largest U.S. Oil Shale Plays
Production Growth Profiles For 3 Largest U.S. Oil Shale Plays 10,000,000 Includes Horizontal Wells Only Eagle Ford 1,000,000 197 Horizontal Rigs Bakken 156 Horizontal Rigs 100,000 Spraberry/Wolfcamp 10,000 86 Horizontal Rigs 1,000 100 0 12 24 36 48 60 72 84 96 108 120 Months Spraberry/Wolfcamp horiz
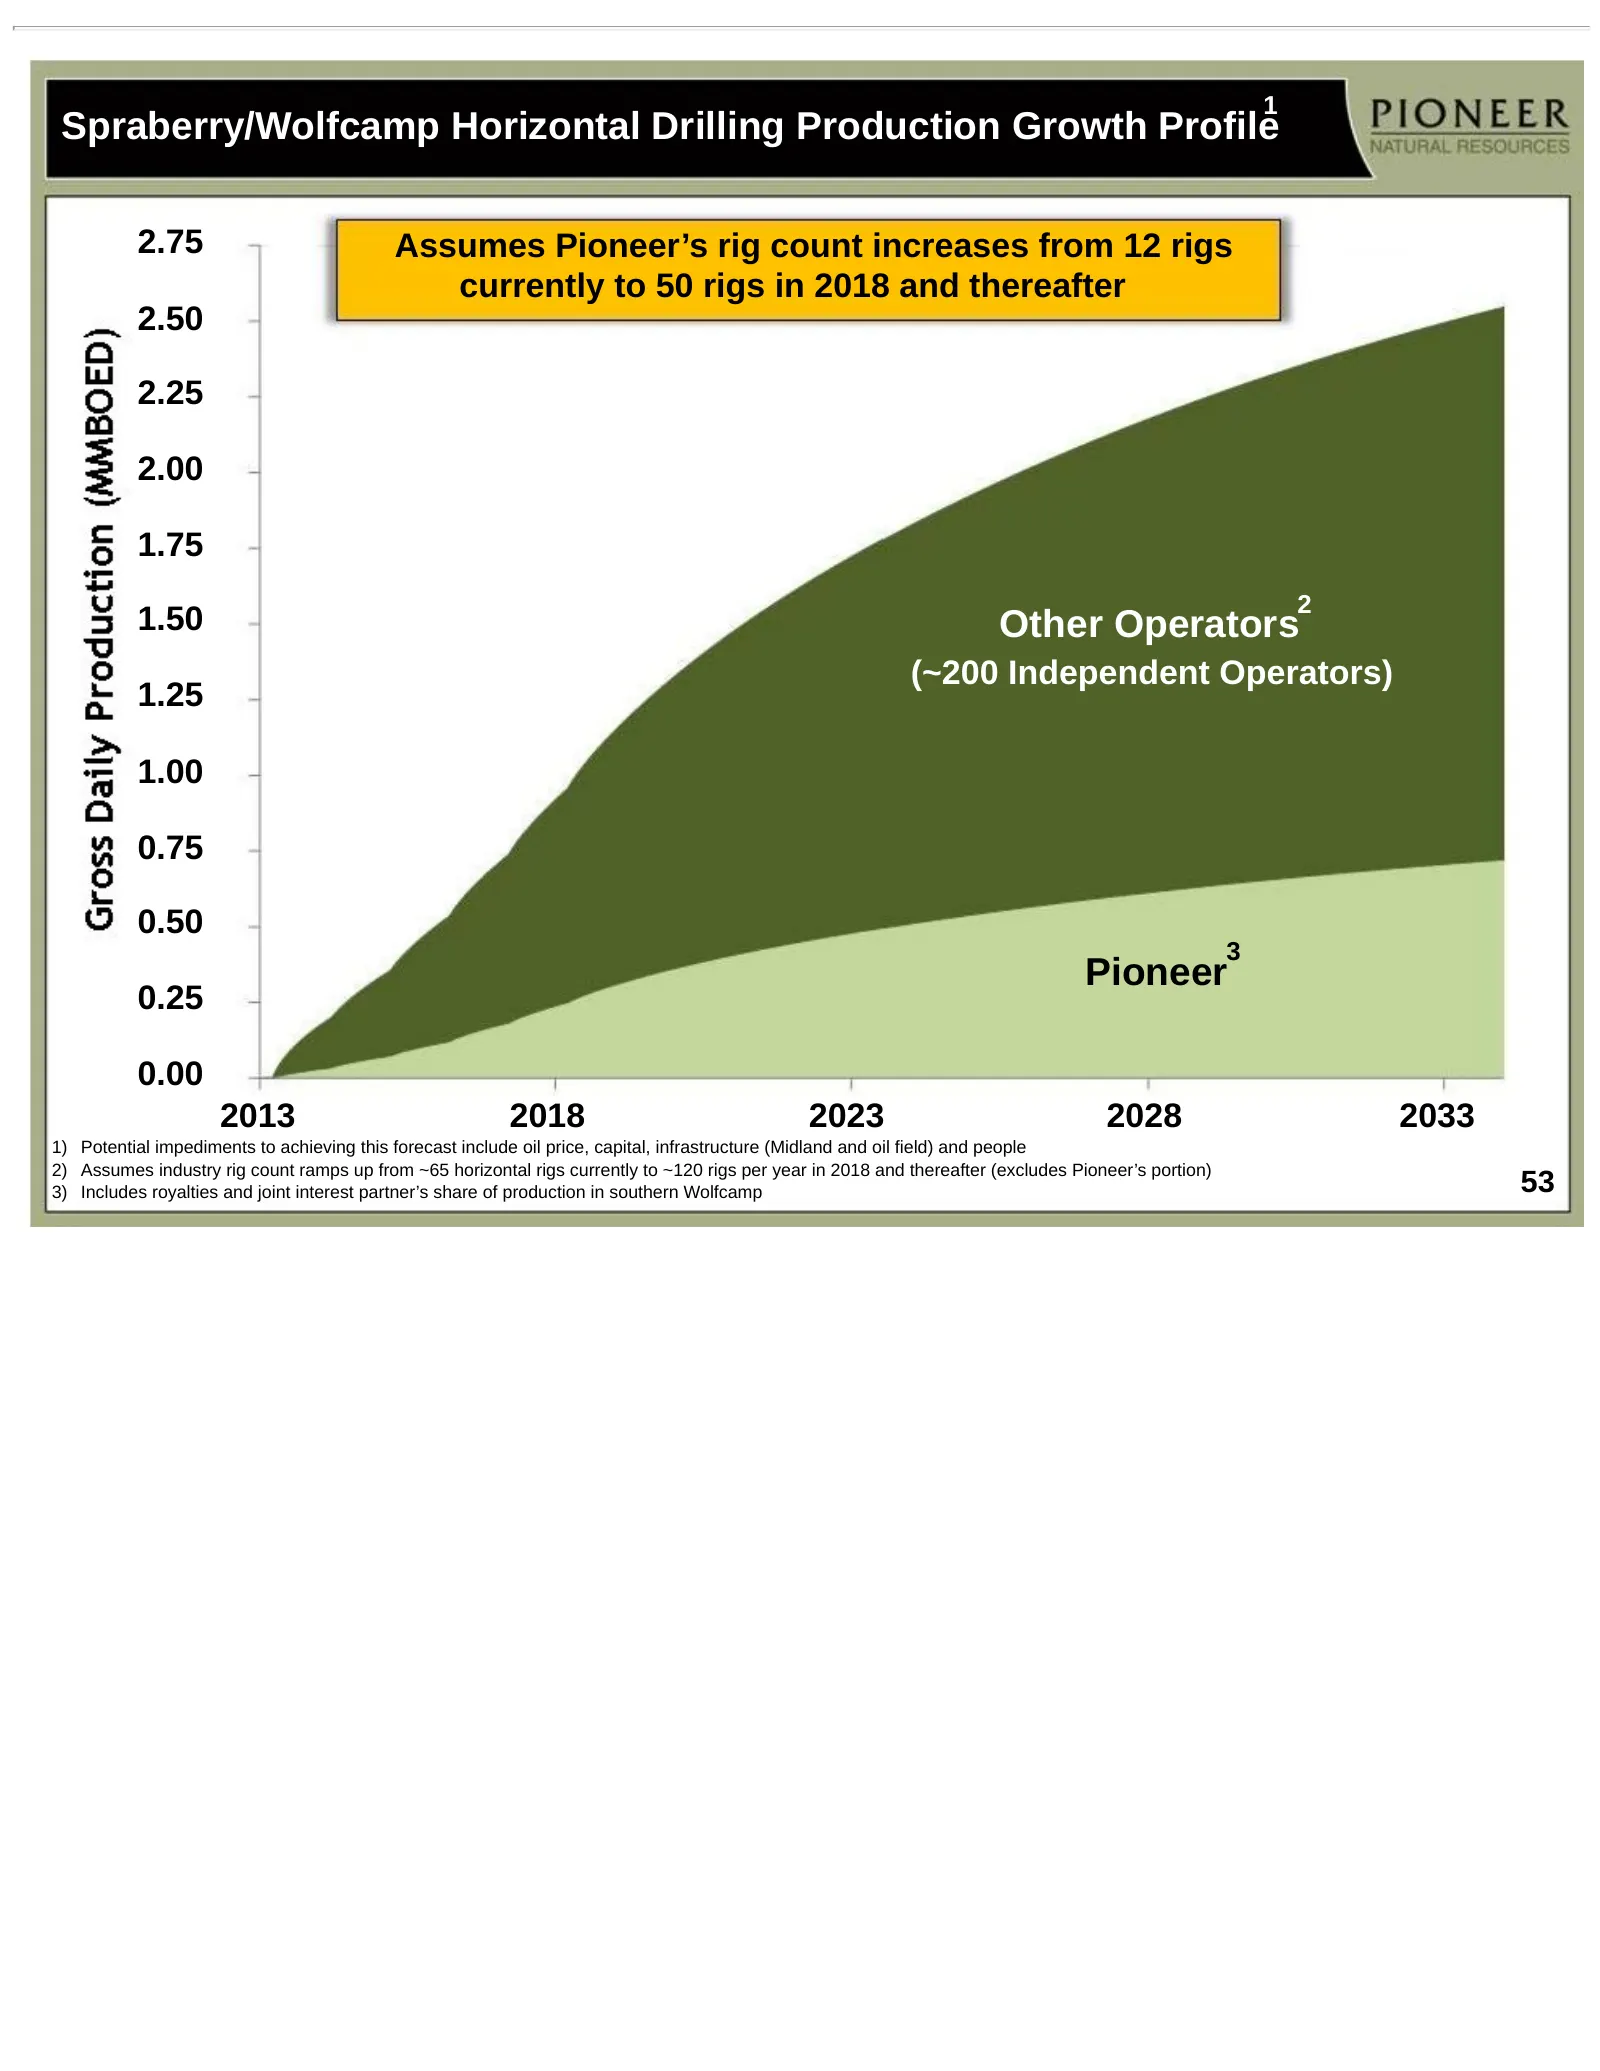
Slide 53: Spraberry/Wolfcamp Horizontal Drilling Production Growth Profile
1 Spraberry/Wolfcamp Horizontal Drilling Production Growth Profile 2.75 Assumes Pioneer’s rig count increases from 12 rigs currently to 50 rigs in 2018 and thereafter 2.50 2.25 2.00 1.75 2 1.50 Other Operators (~200 Independent Operators) 1.25 1.00 0.75 0.50 3 Pioneer 0.25 0.00 2013 2018 2023 2028 2
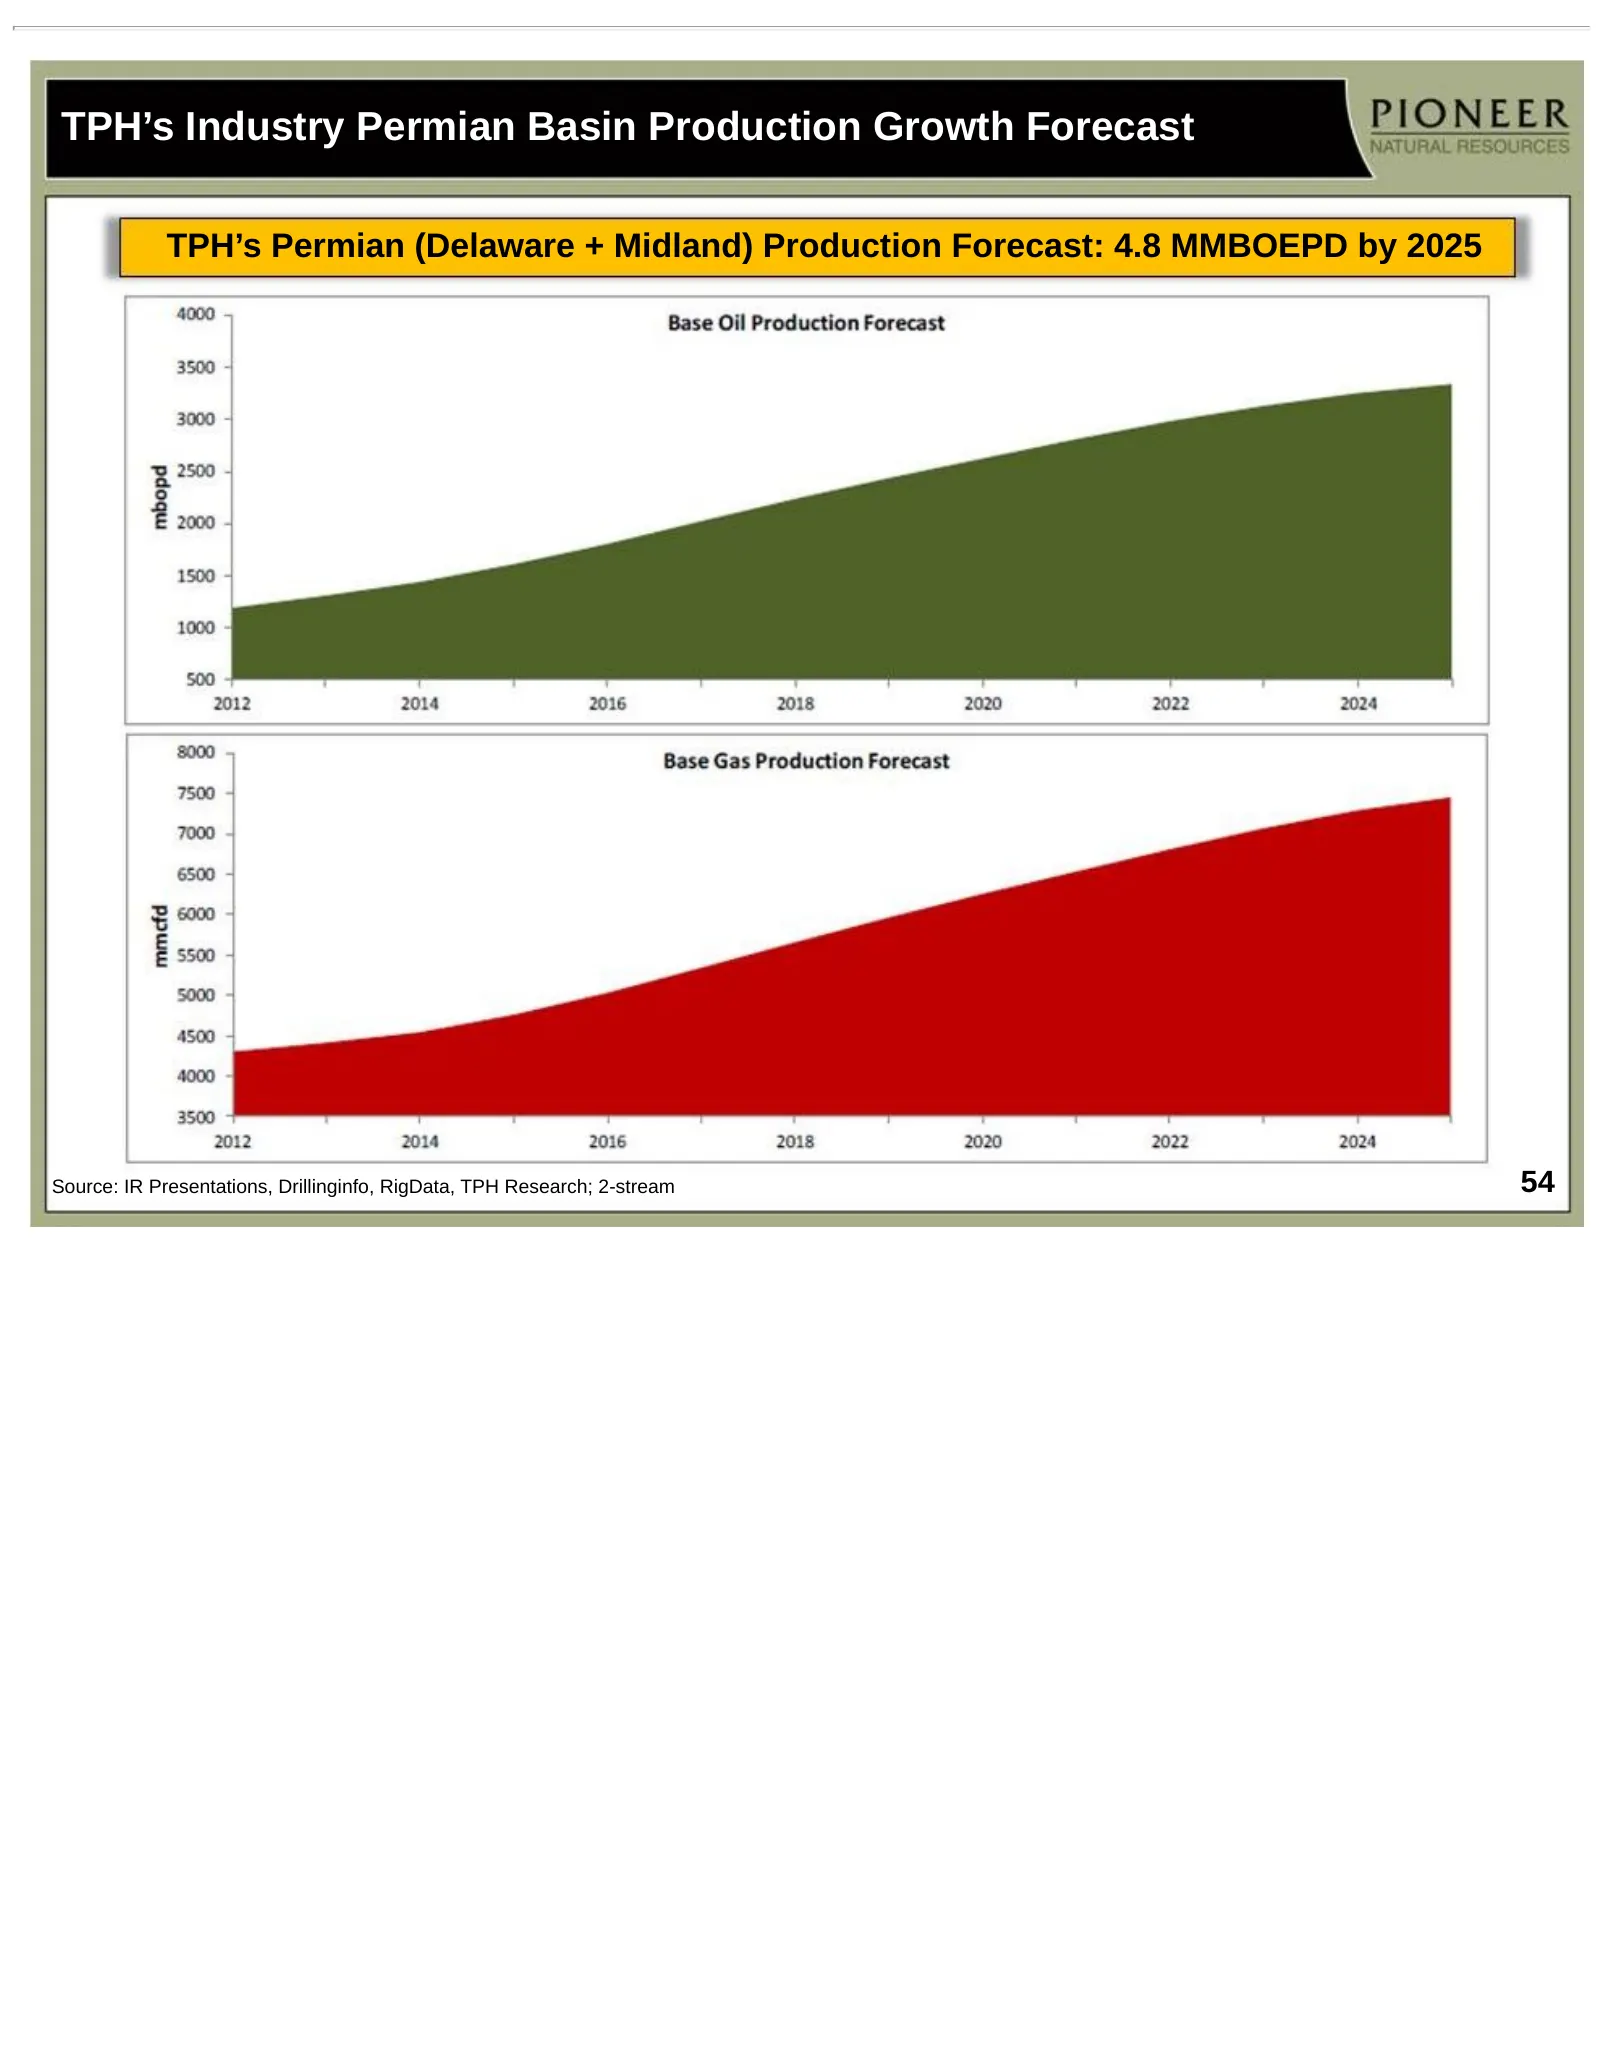
Slide 54: TPH's Industry Permian Basin Production Growth Forecast
TPH’s Industry Permian Basin Production Growth Forecast TPH’s Permian (Delaware + Midland) Production Forecast: 4.8 MMBOEPD by 2025 Source: IR Presentations, Drillinginfo, RigData, TPH Research; 2-stream 54
Slide 55: JV Agreement with Sinochem
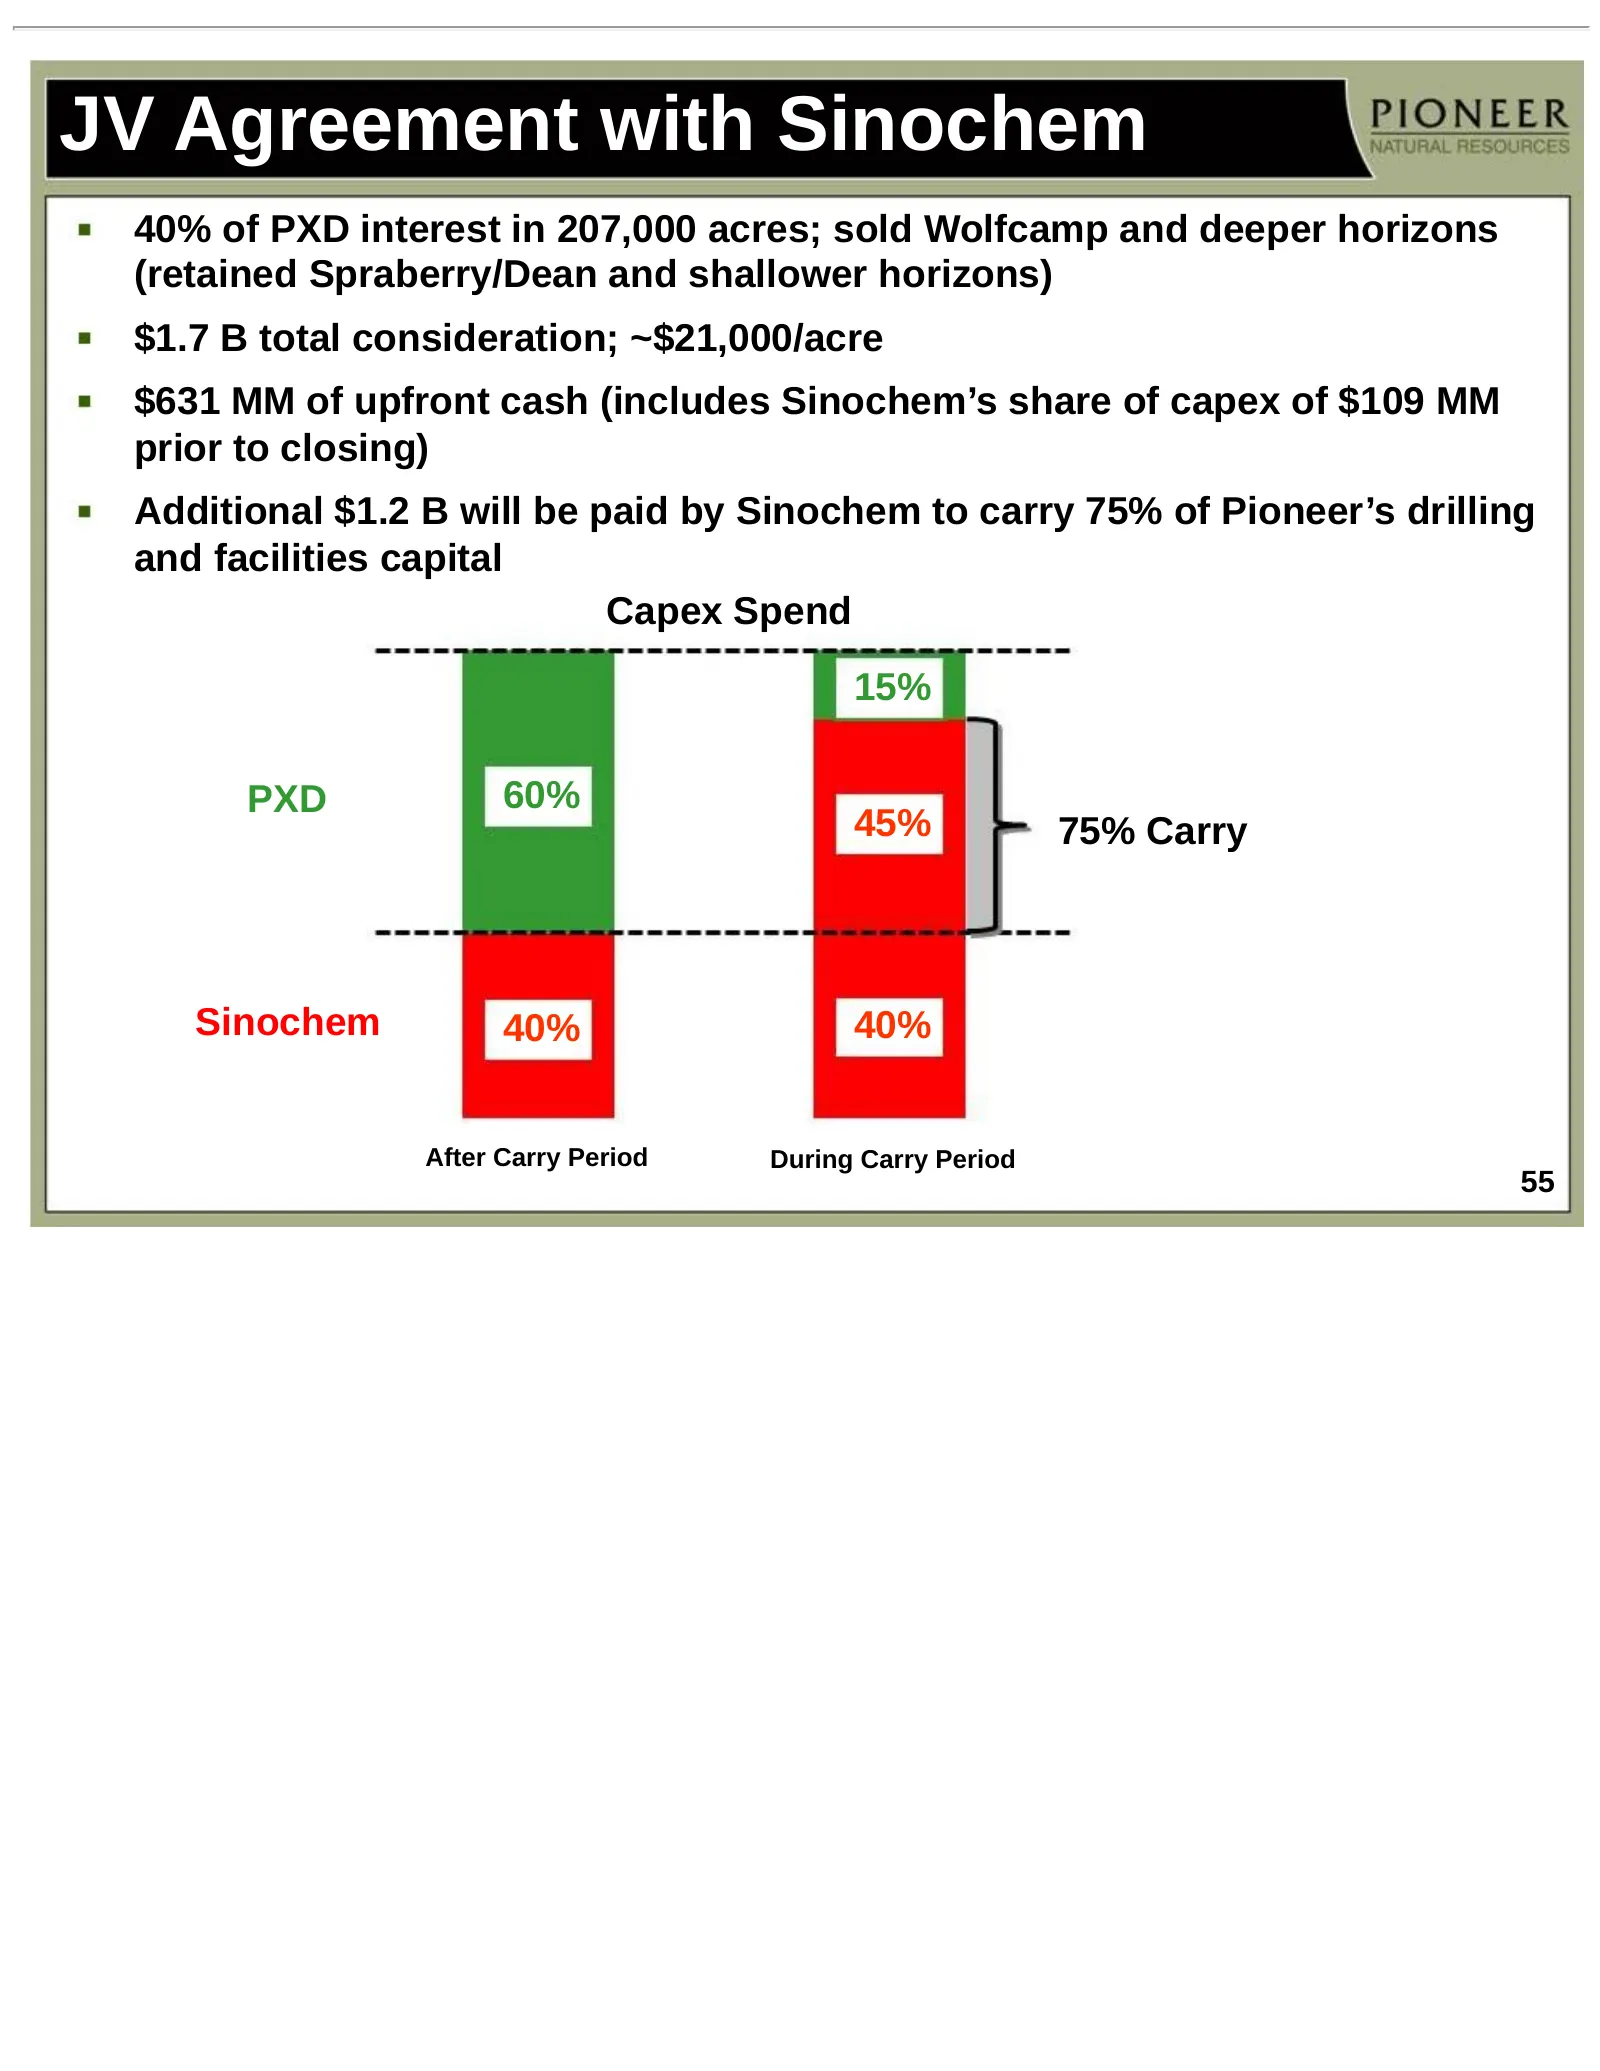
JV Agreement with Sinochem 40% of PXD interest in 207,000 acres; sold Wolfcamp and deeper horizons (retained Spraberry/Dean and shallower horizons) $1.7 B total consideration; ~$21,000/acre $631 MM of upfront cash (includes Sinochem’s share of capex of $109 MM prior to closing) Additional $1.2 B wil
Slide 56: Southern Wolfcamp JV Drilling Performance Improving
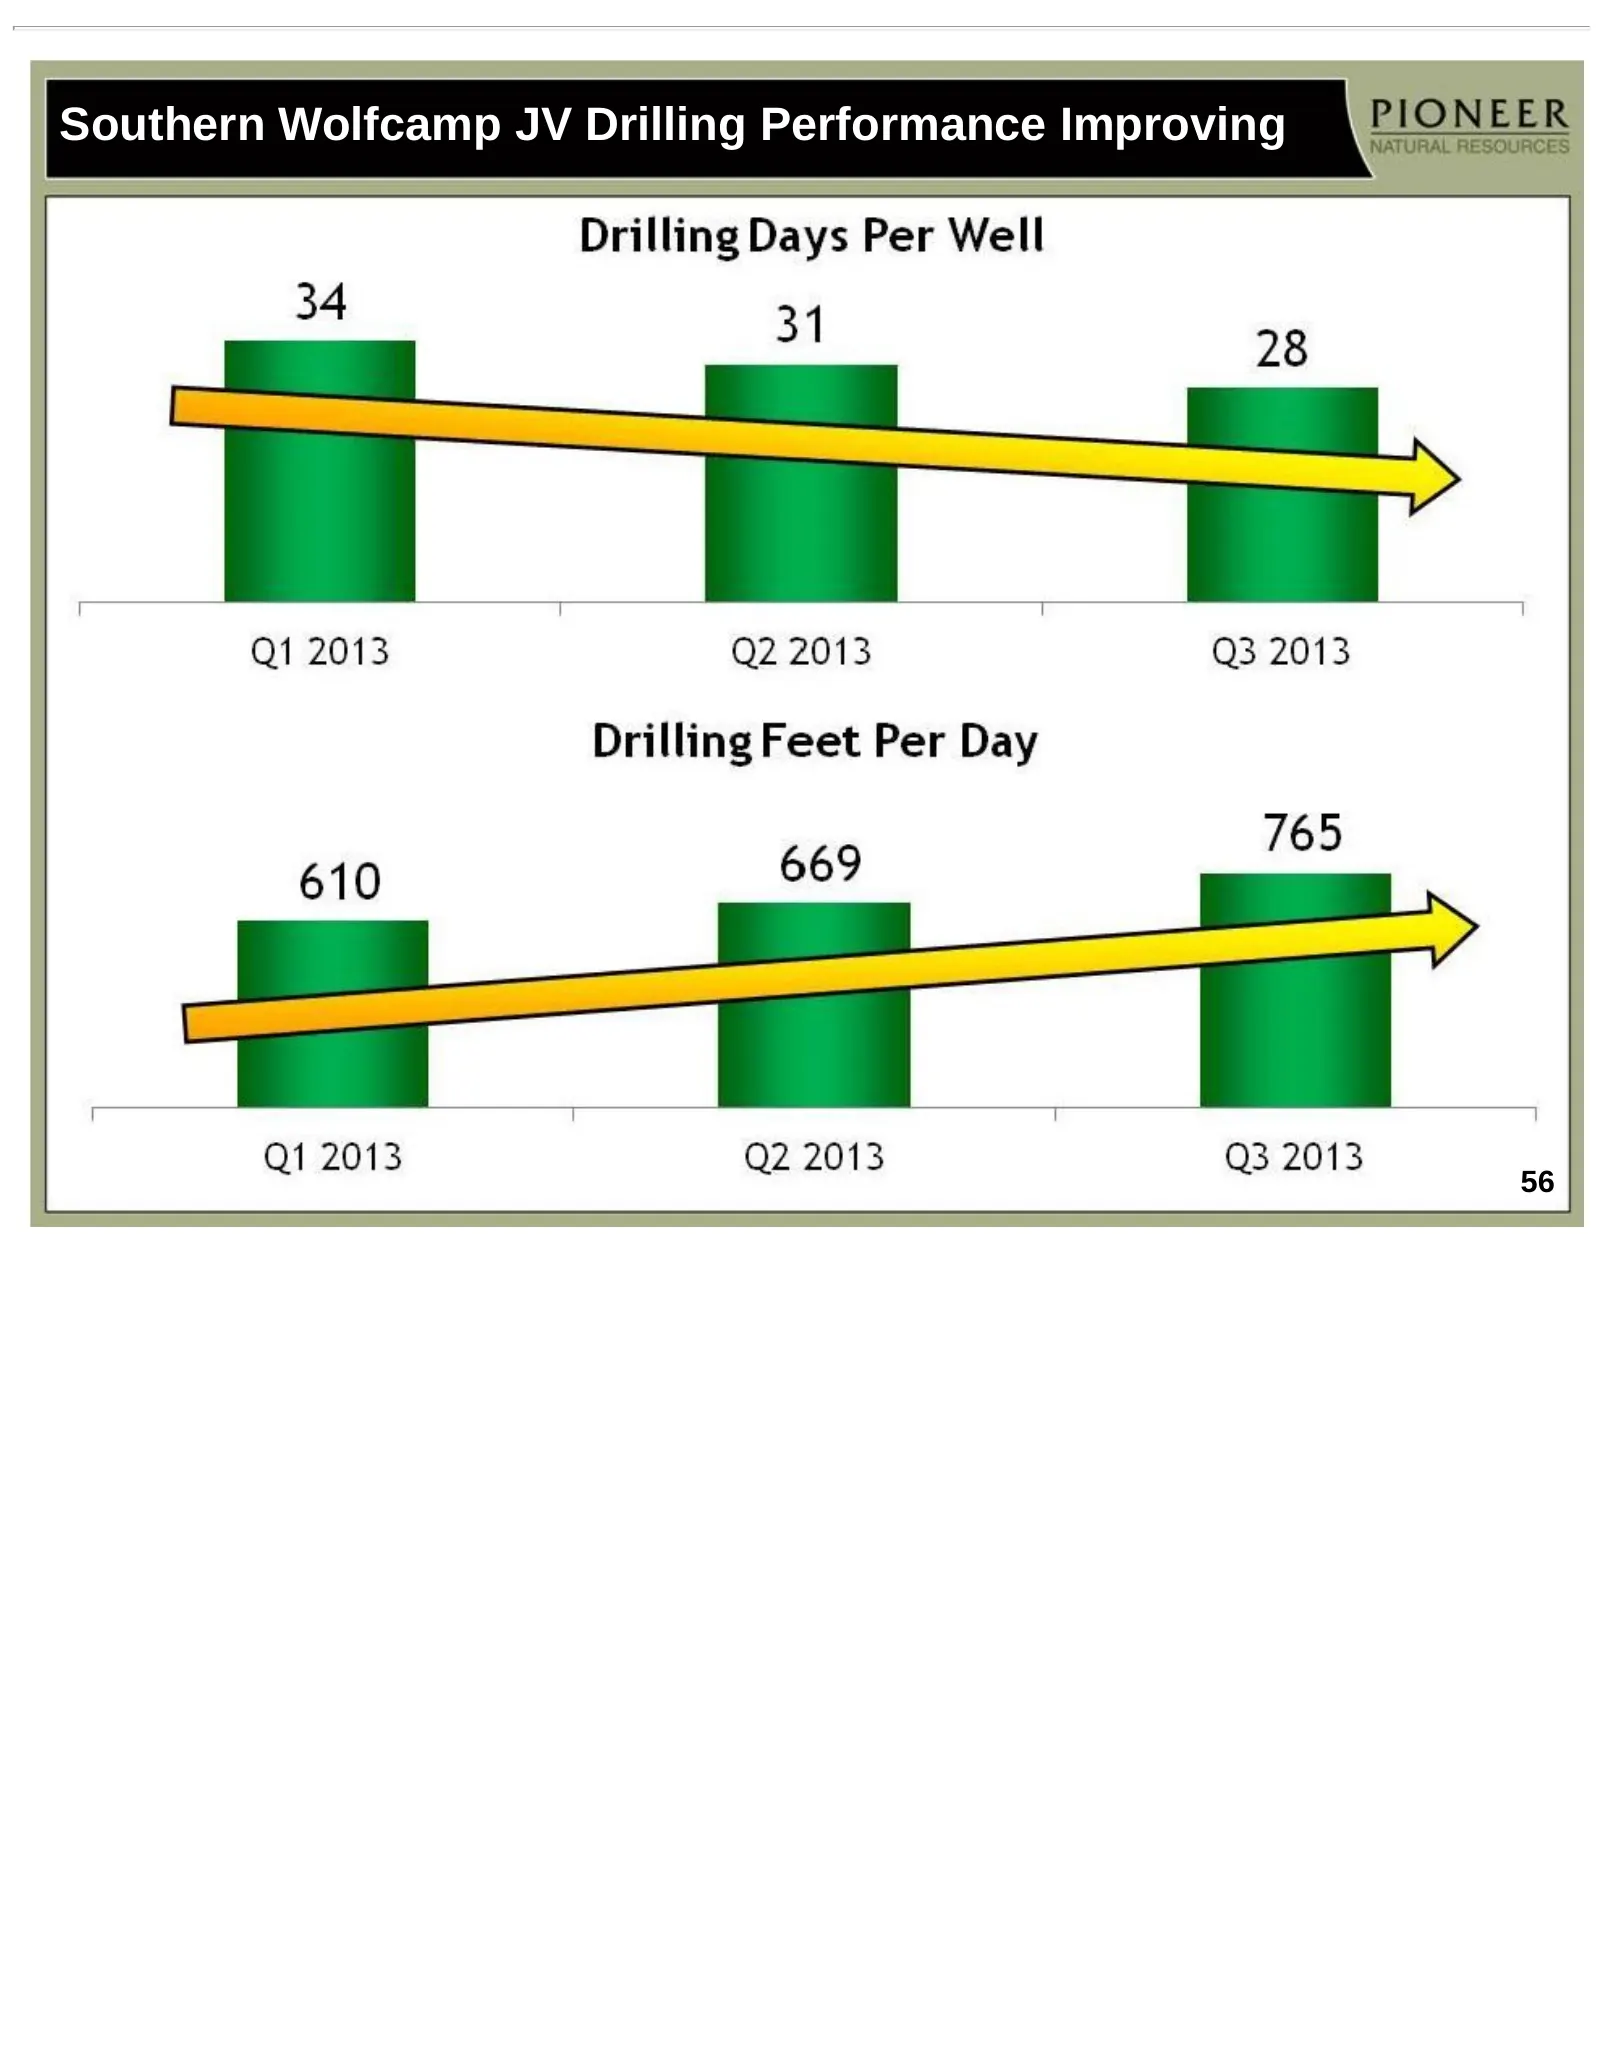
Southern Wolfcamp JV Drilling Performance Improving 56
Slide 57: Southern Wolfcamp JV Completion Costs Being Reduced
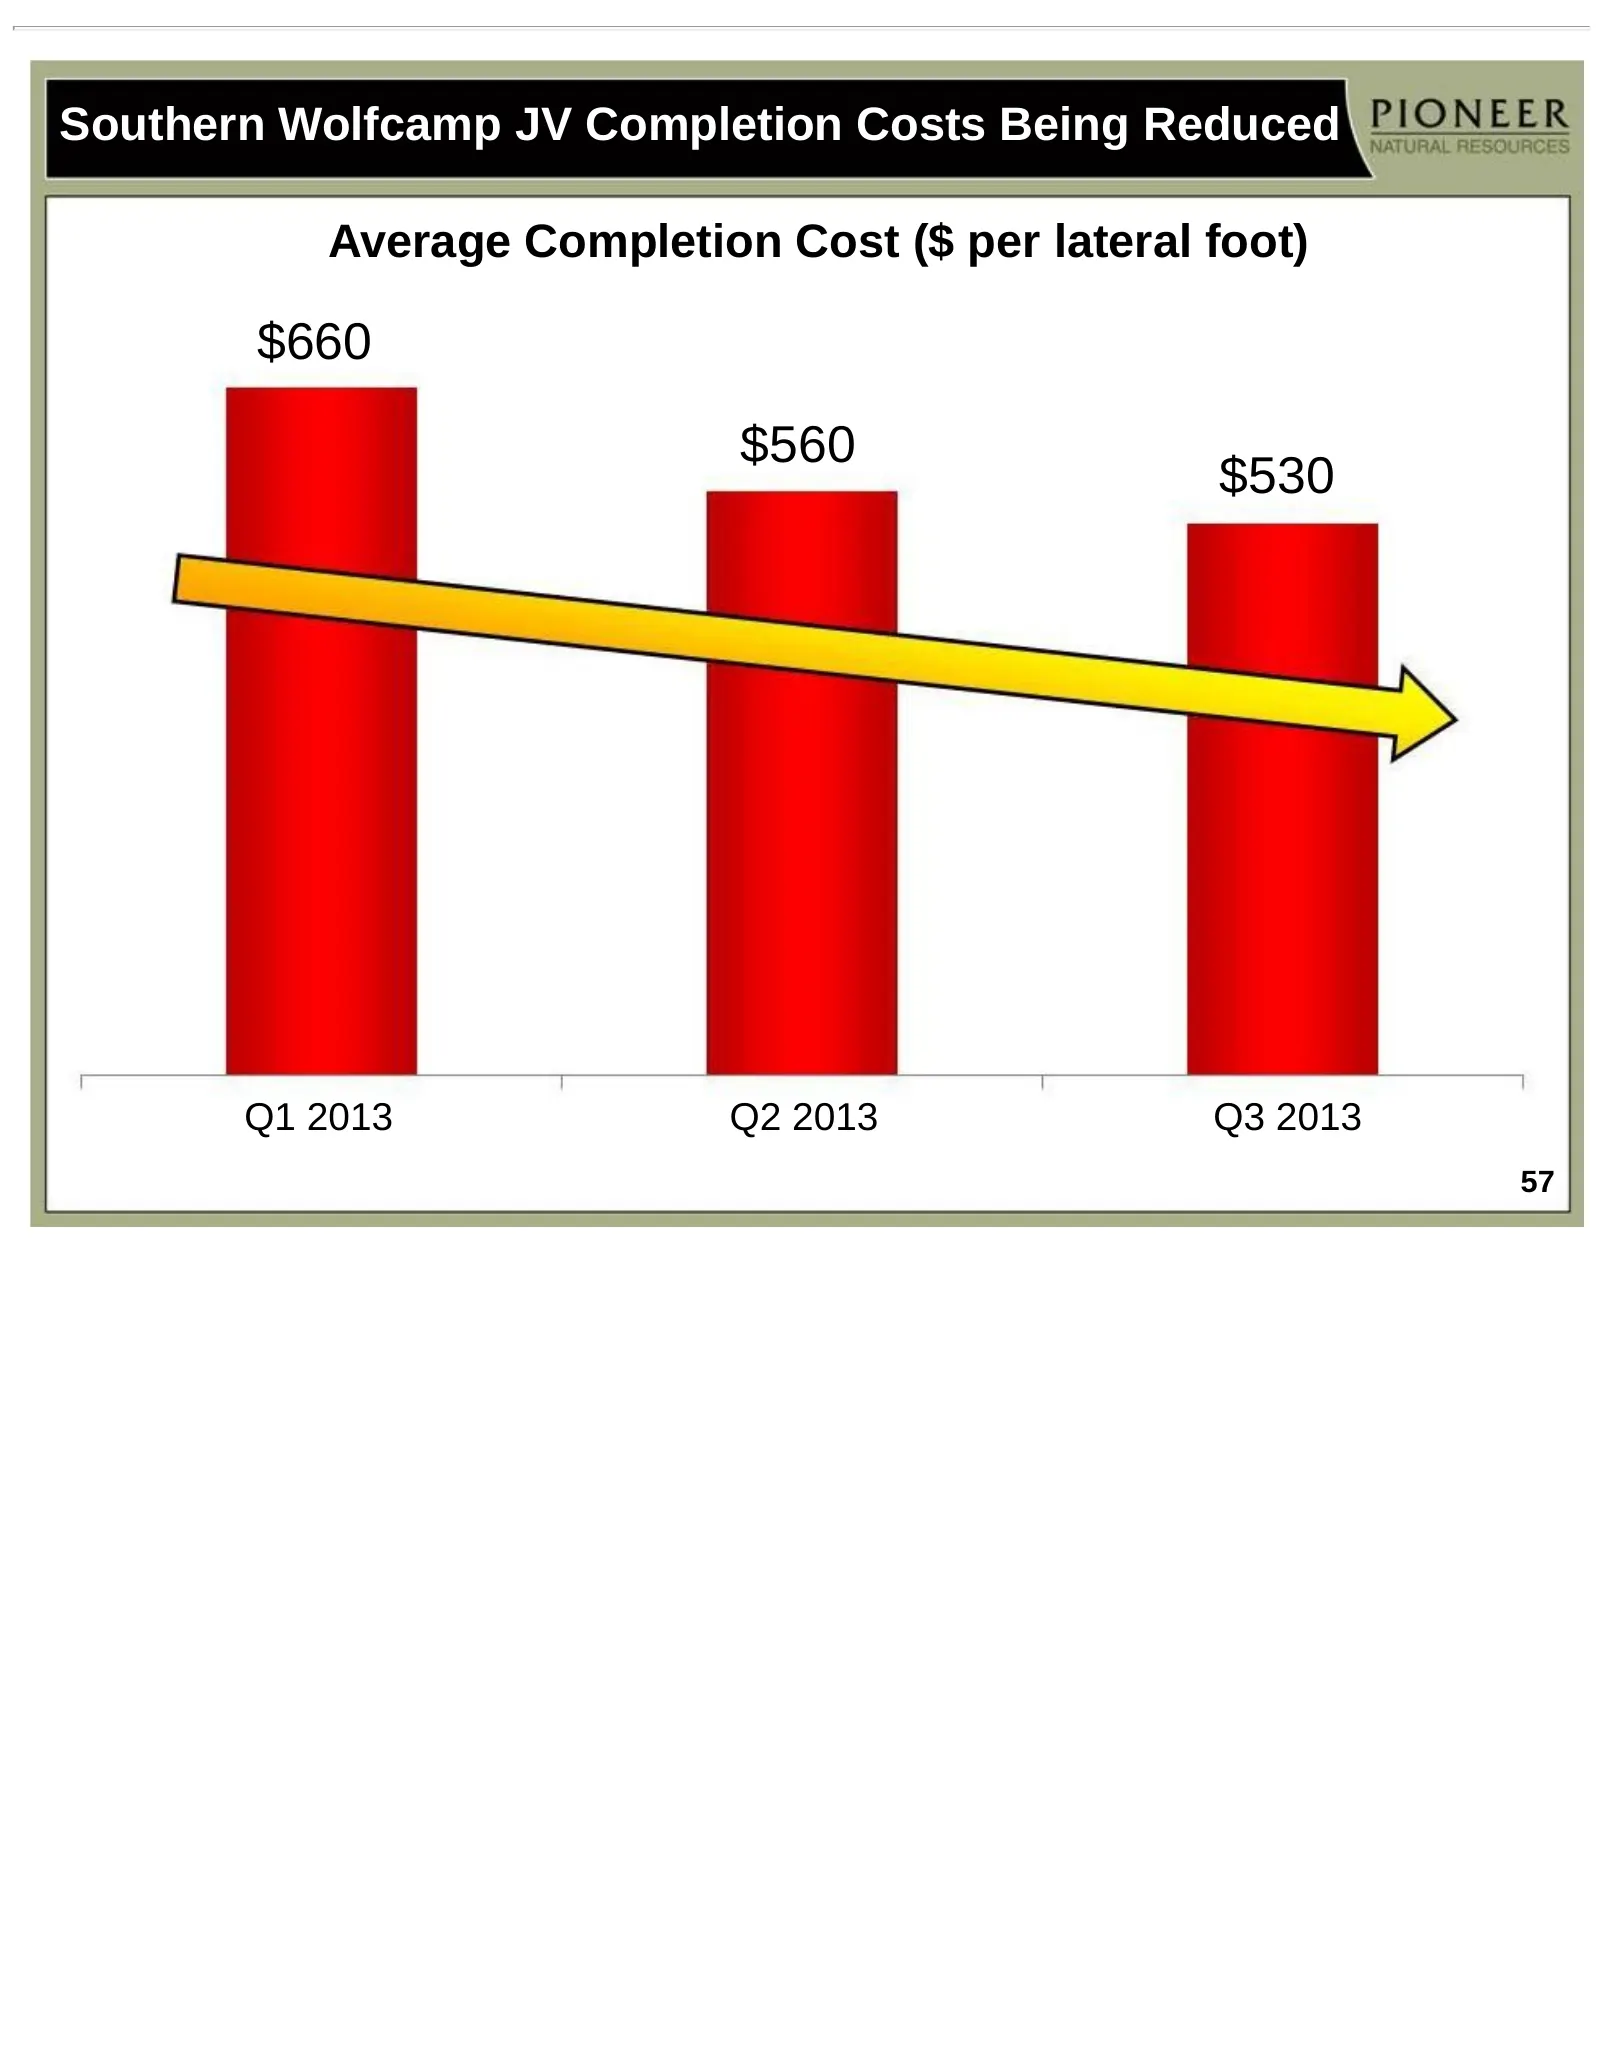
Southern Wolfcamp JV Completion Costs Being Reduced Average Completion Cost ($ per lateral foot) $660 $560 $530 Q1 2013 Q2 2013 Q3 2013 57
Slide 58: Frac Design Changes Over Time
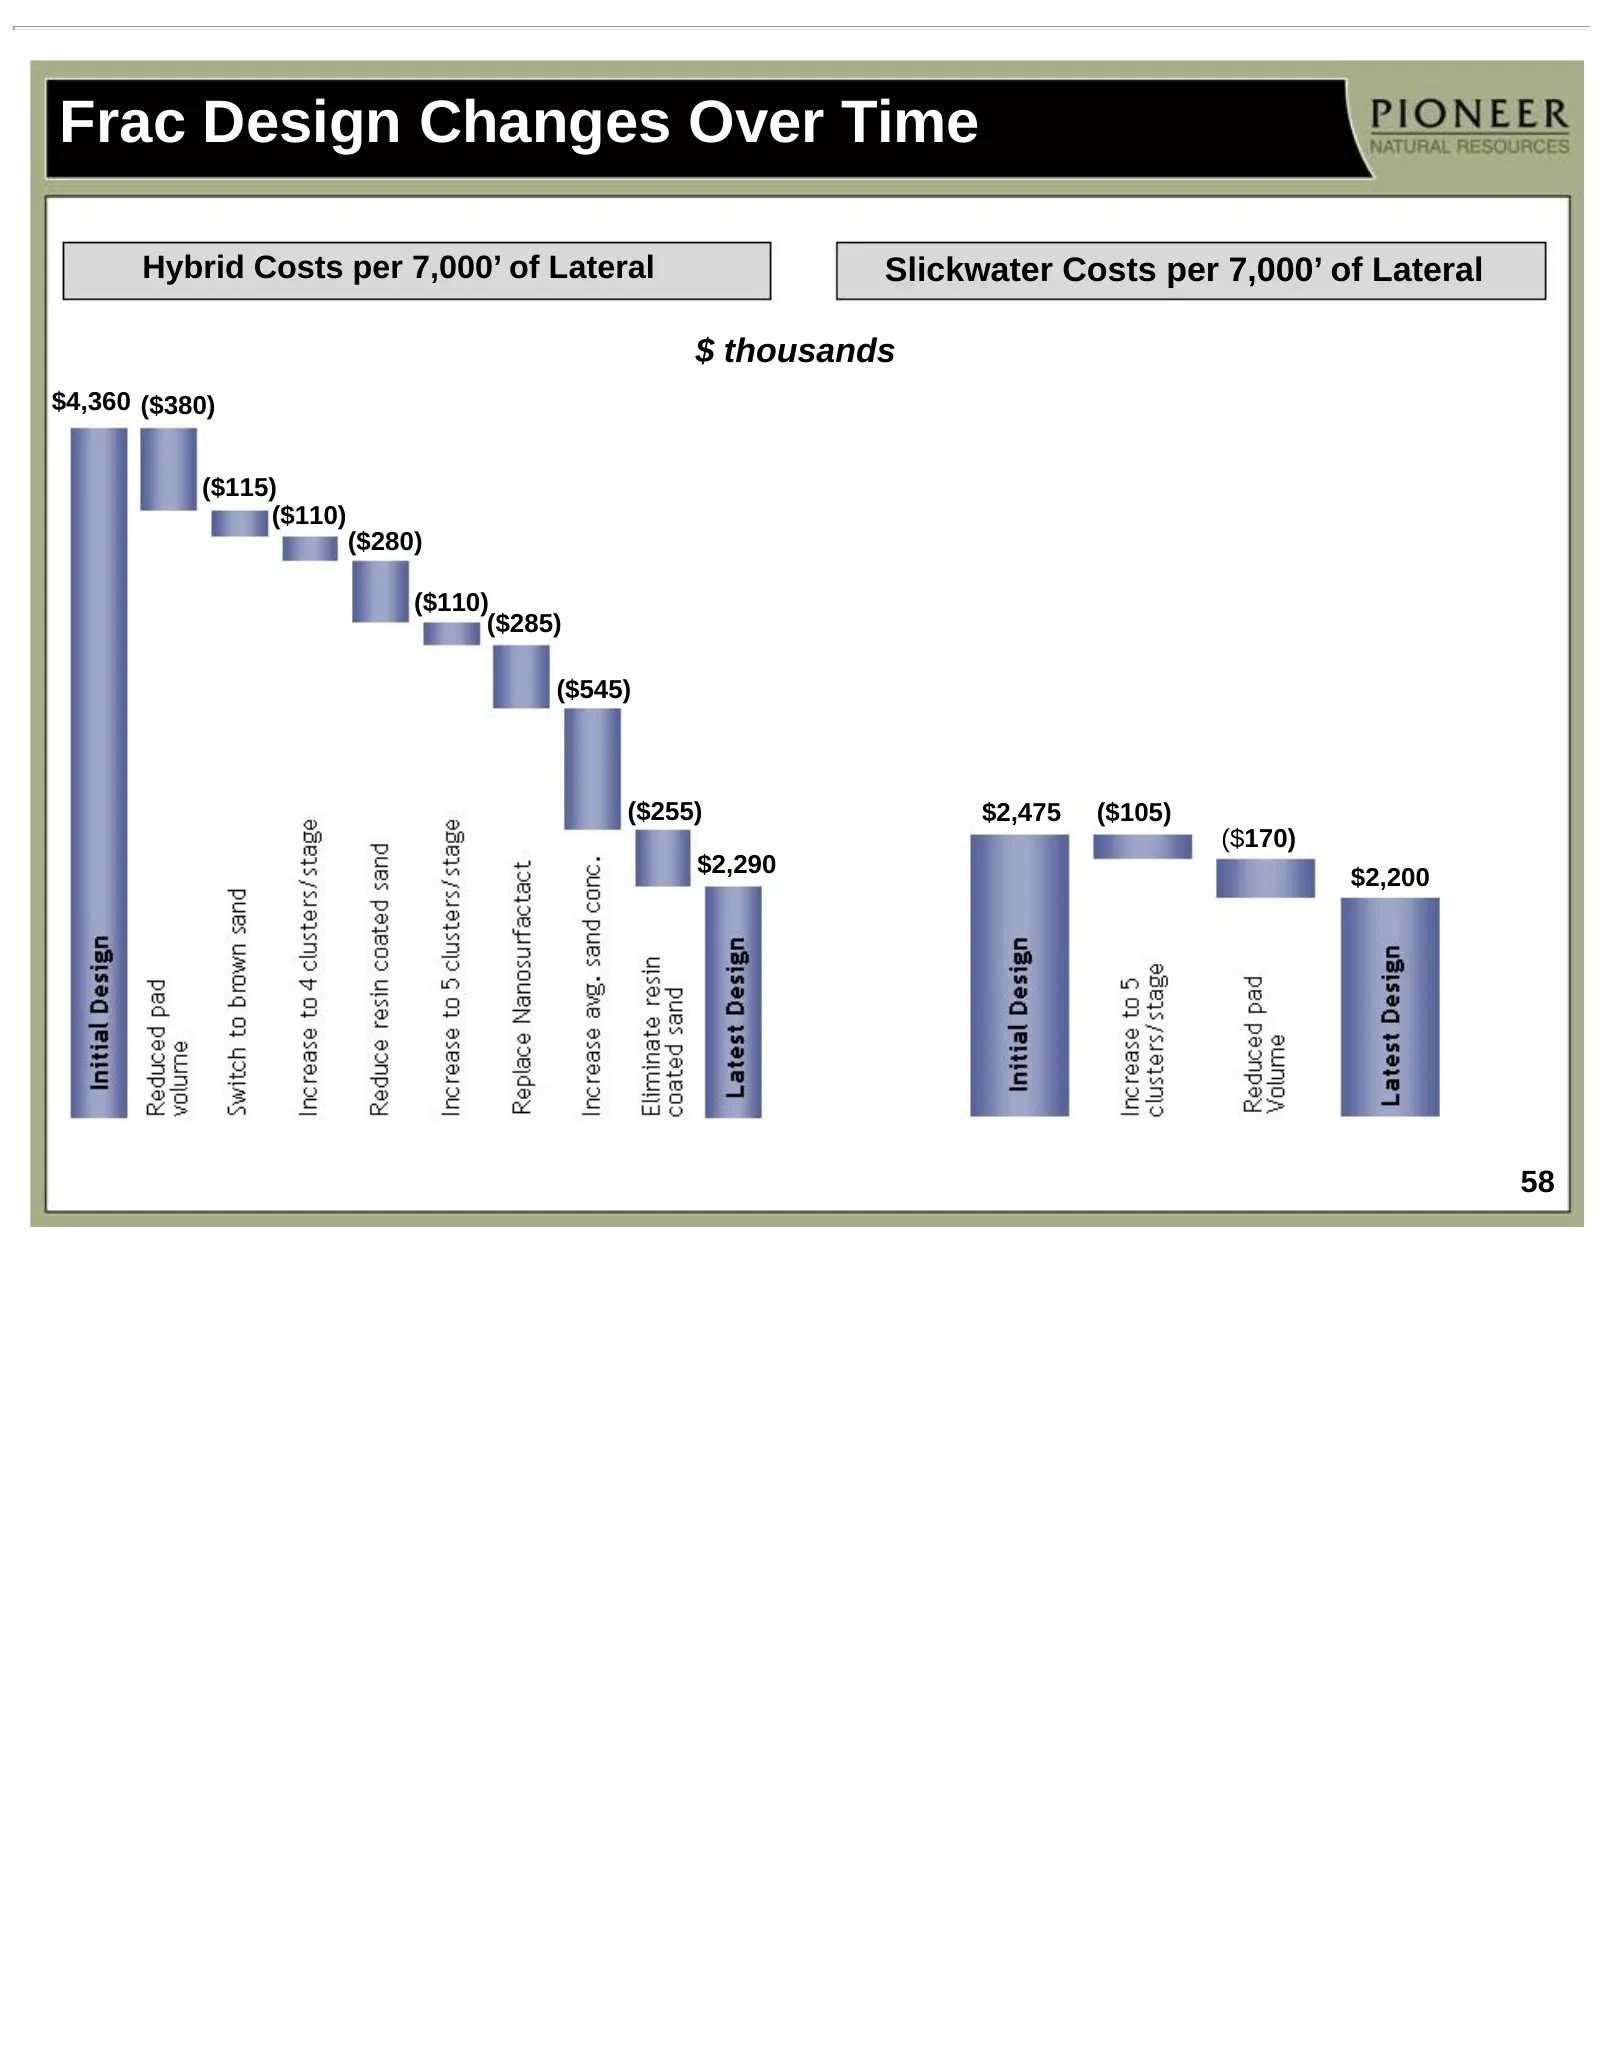
Frac Design Changes Over Time Hybrid Costs per 7,000’ of Lateral Slickwater Costs per 7,000’ of Lateral $ thousands $4,360 ($380) ($115) ($110) ($280) ($110) ($285) ($545) ($255) $2,475 ($105) ($170) $2,290 $2,200 58
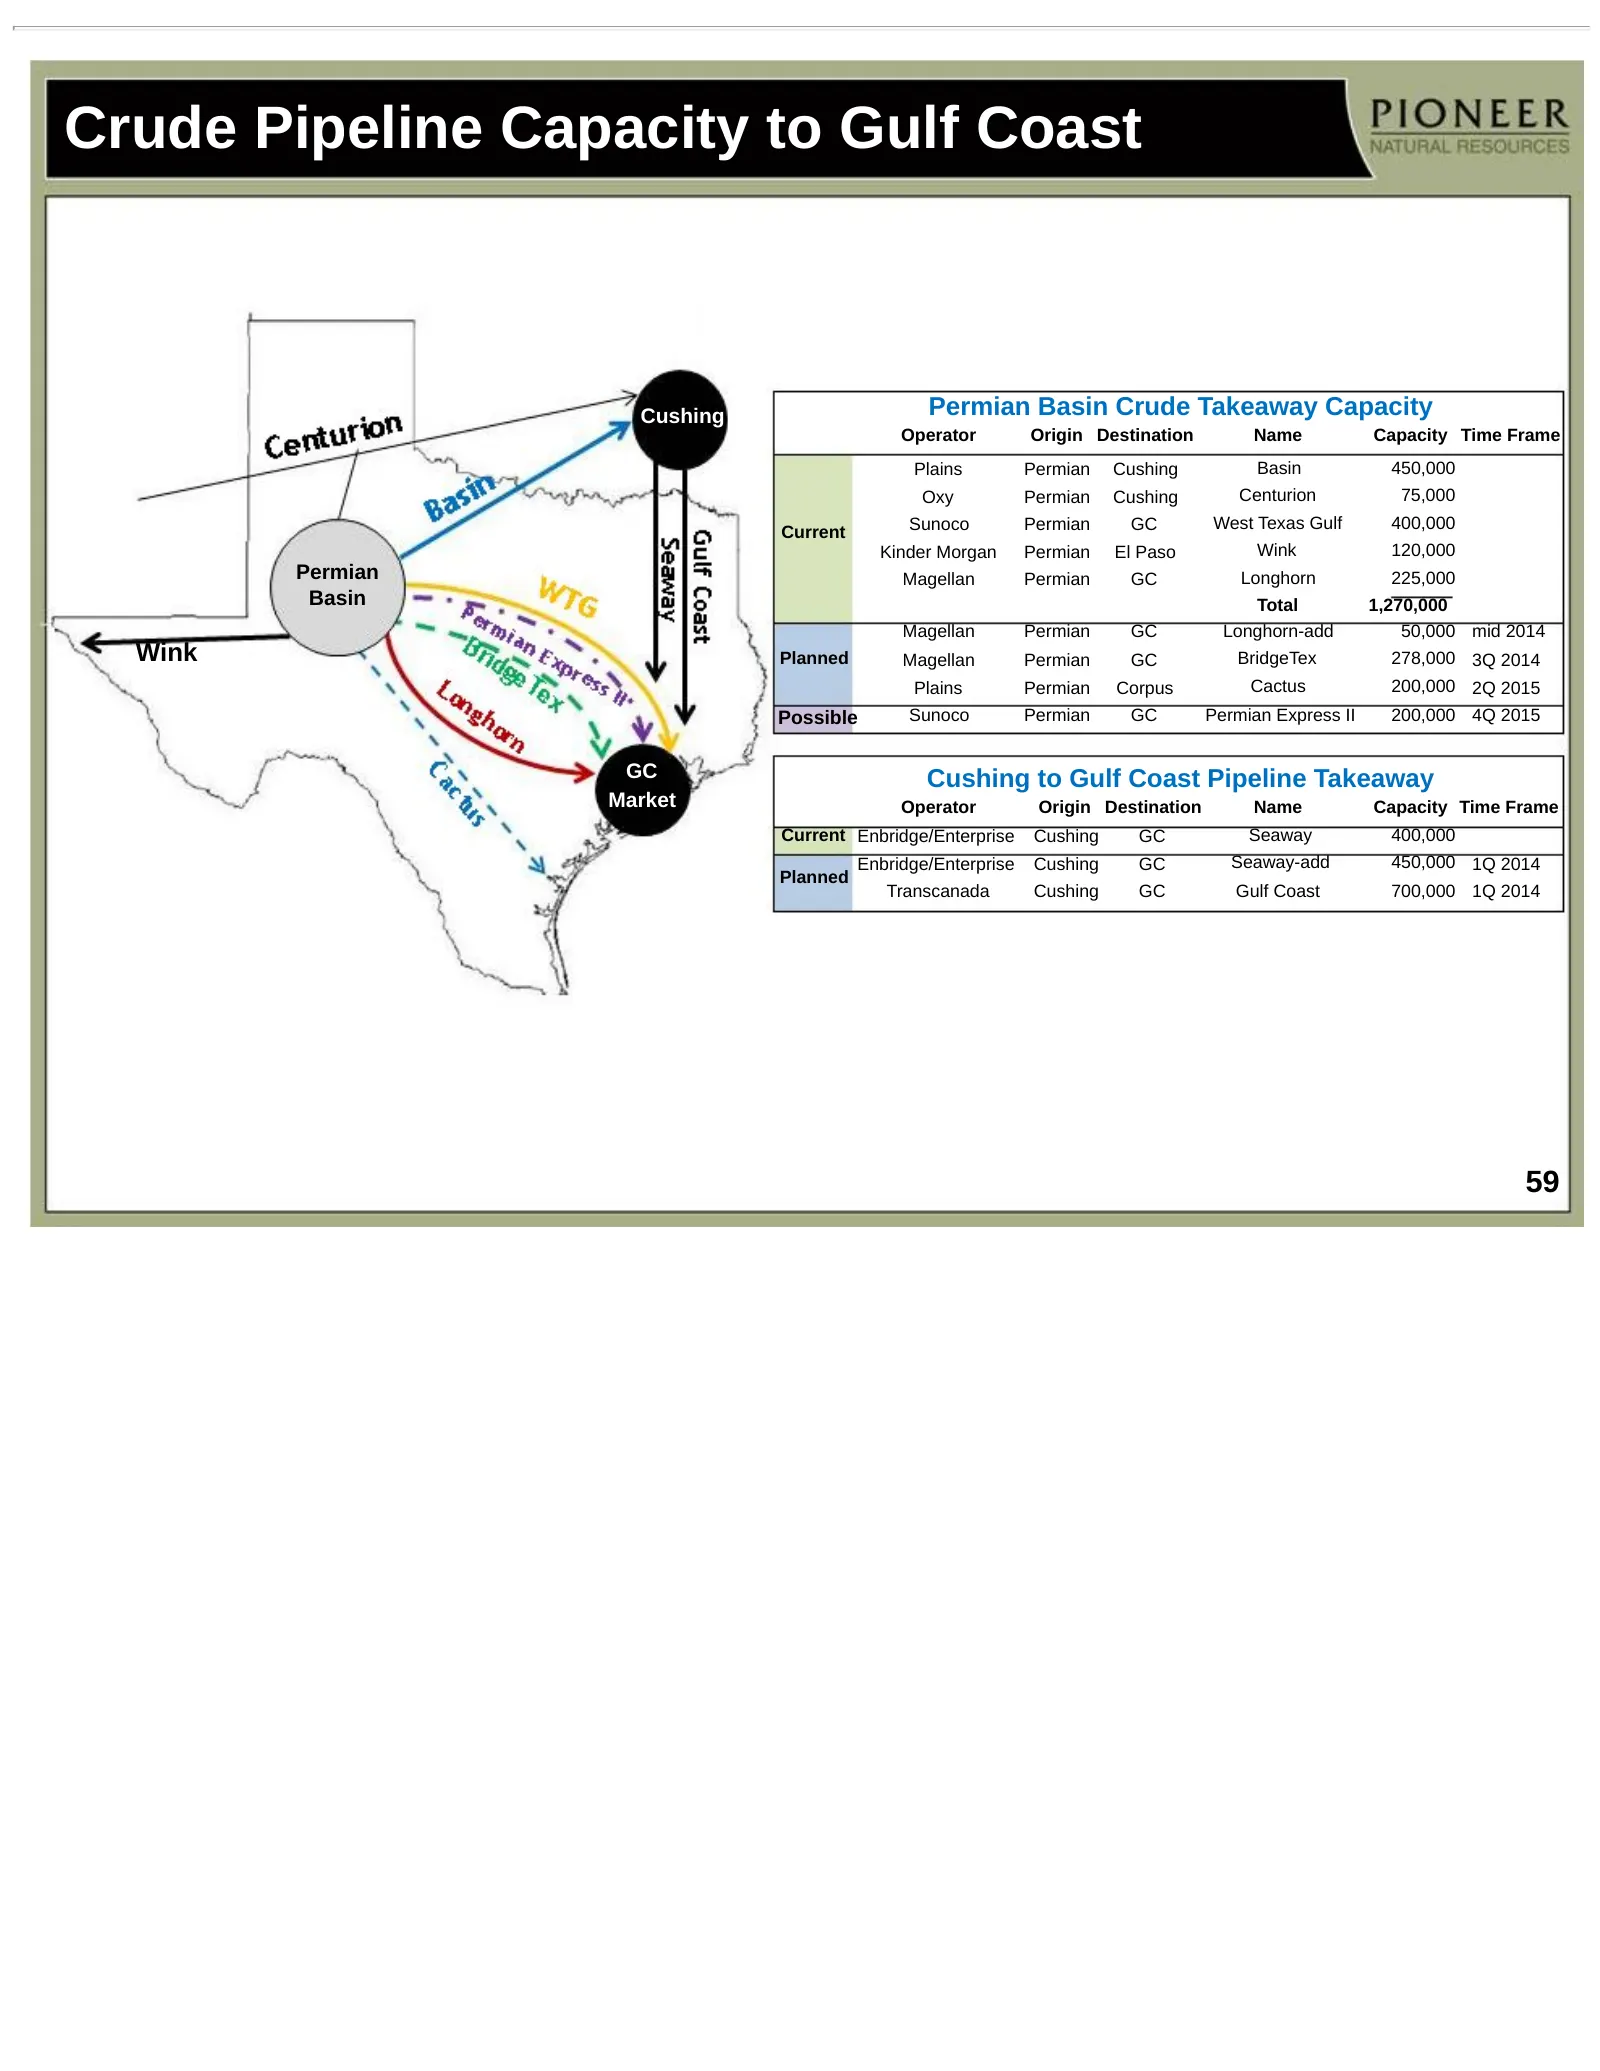
Slide 59: Crude Pipeline Capacity to Gulf Coast
Crude Pipeline Capacity to Gulf Coast Cushing Permian Basin Crude Takeaway Capacity Operator Origin Destination Name Capacity Time Frame Plains Permian Cushing Basin 450,000 Oxy Permian Cushing Centurion 75,000 Sunoco Permian GC West Texas Gulf 400,000 Current Kinder Morgan Permian El Paso Wink 120,
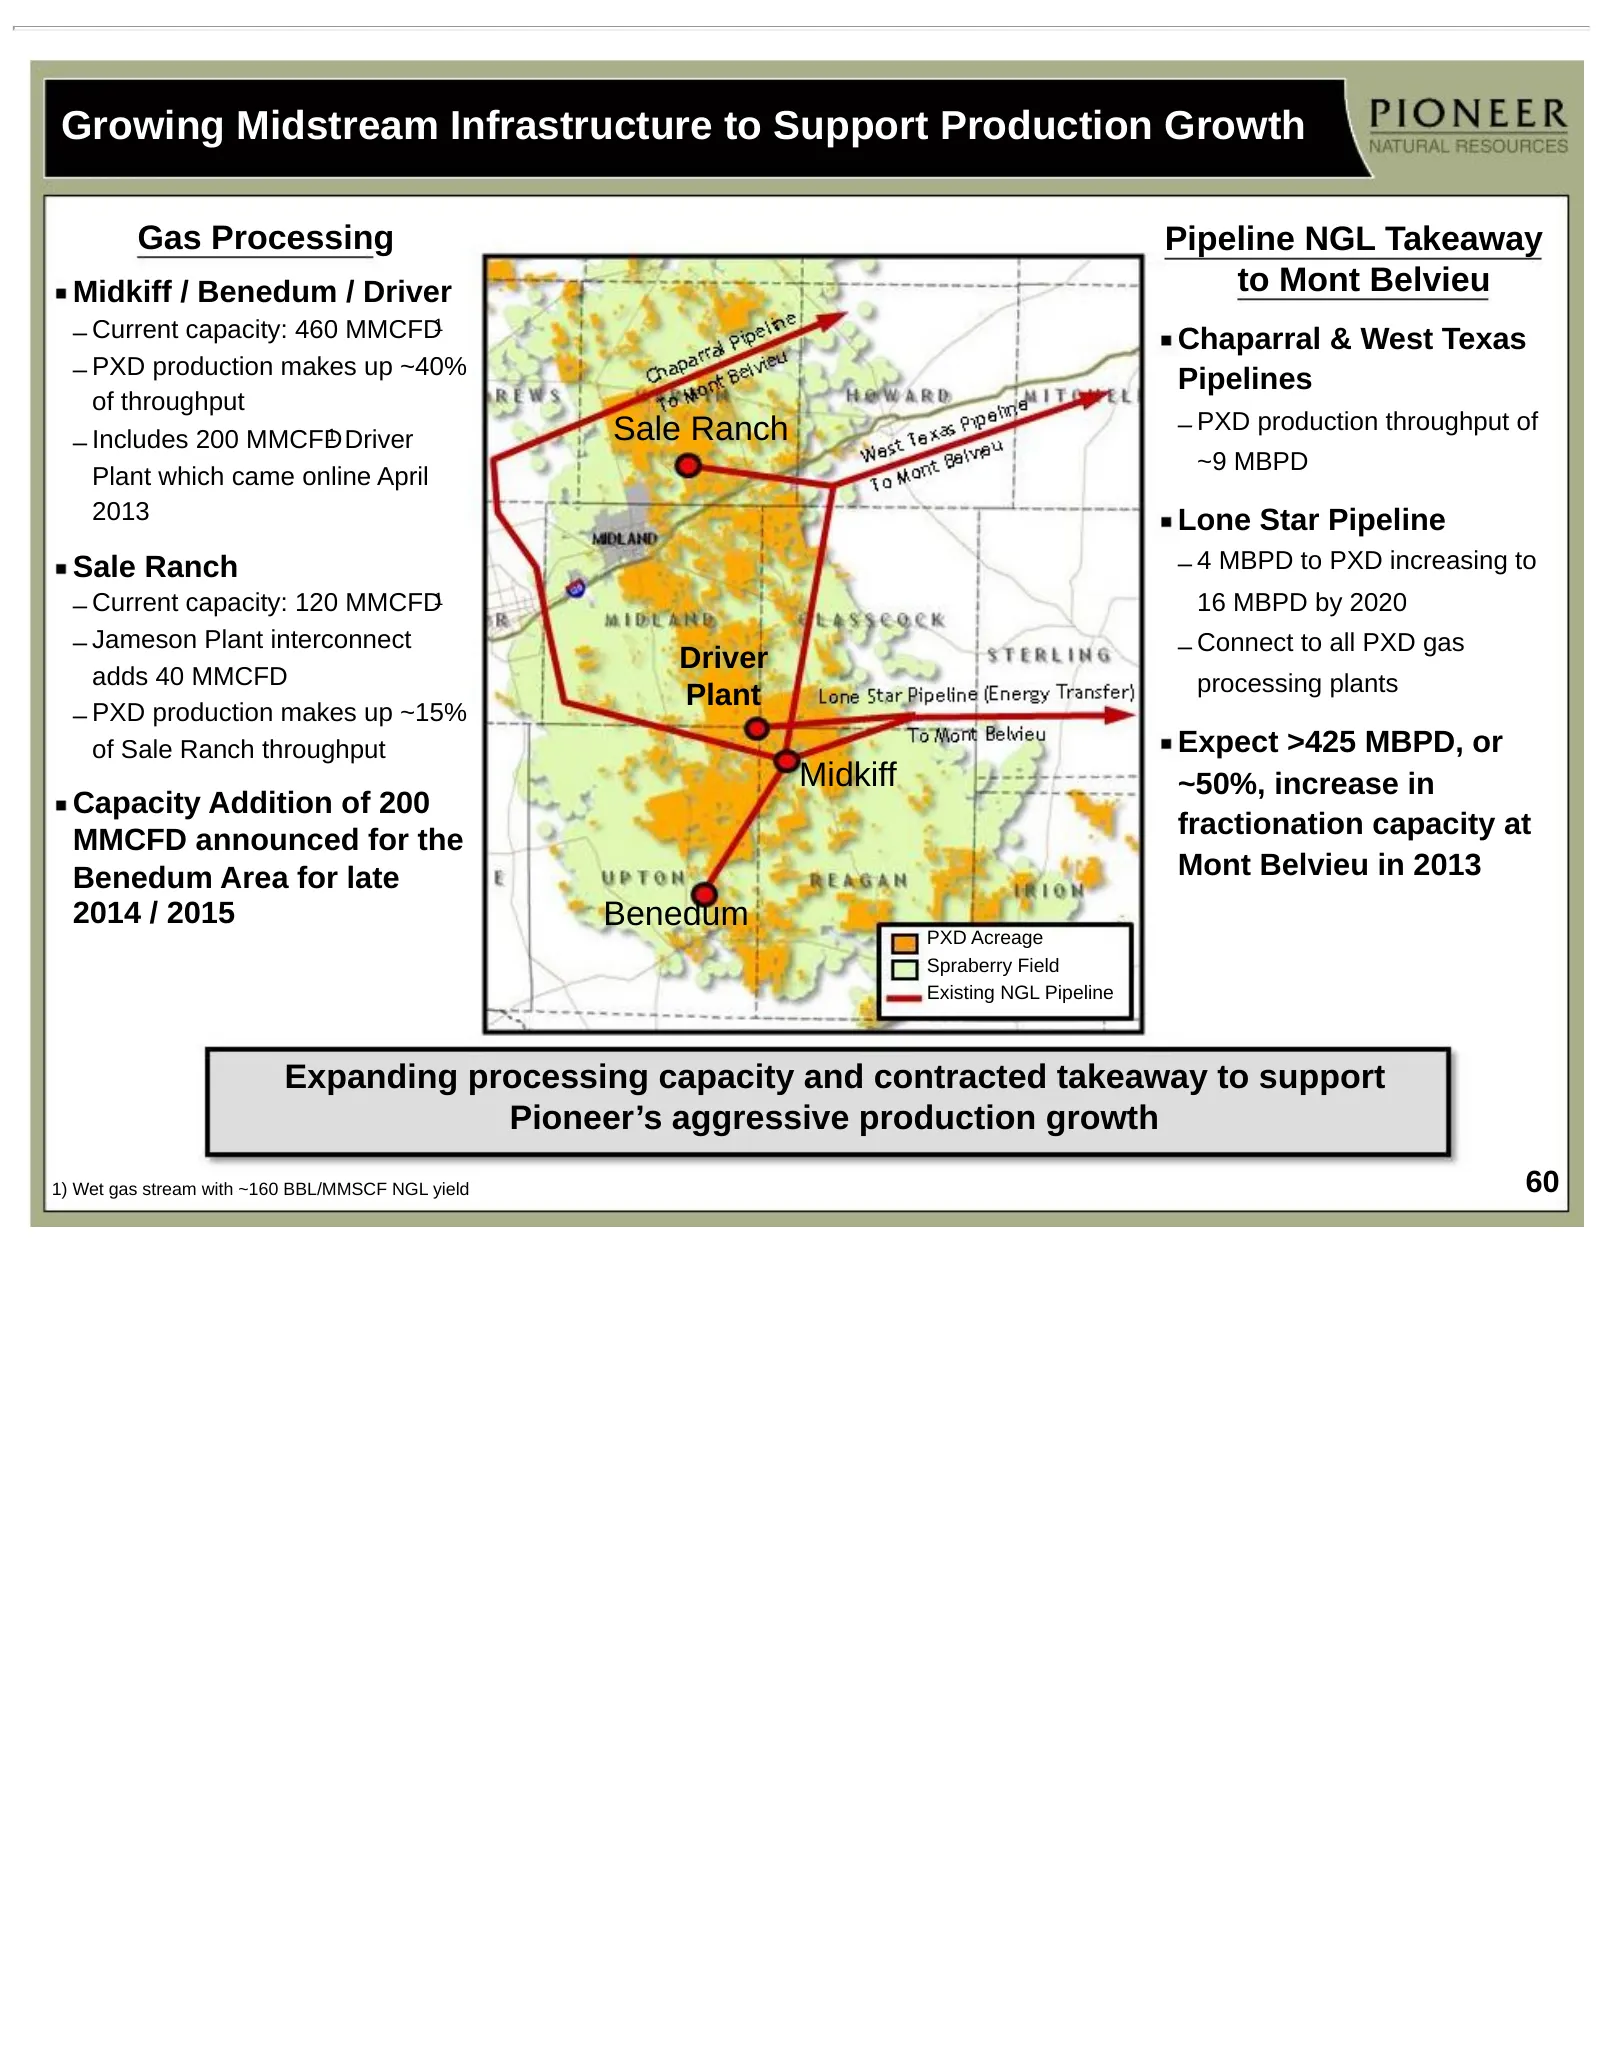
Slide 60: Growing Midstream Infrastructure to Support Production Growth
Growing Midstream Infrastructure to Support Production Growth Gas Processing Pipeline NGL Takeaway Midkiff / Benedum / Driver to Mont Belvieu – Current capacity: 460 MMCFD1 Chaparral & West Texas – PXD production makes up ~40% Pipelines of throughput Sale Ranch – PXD production throughput of – Inclu
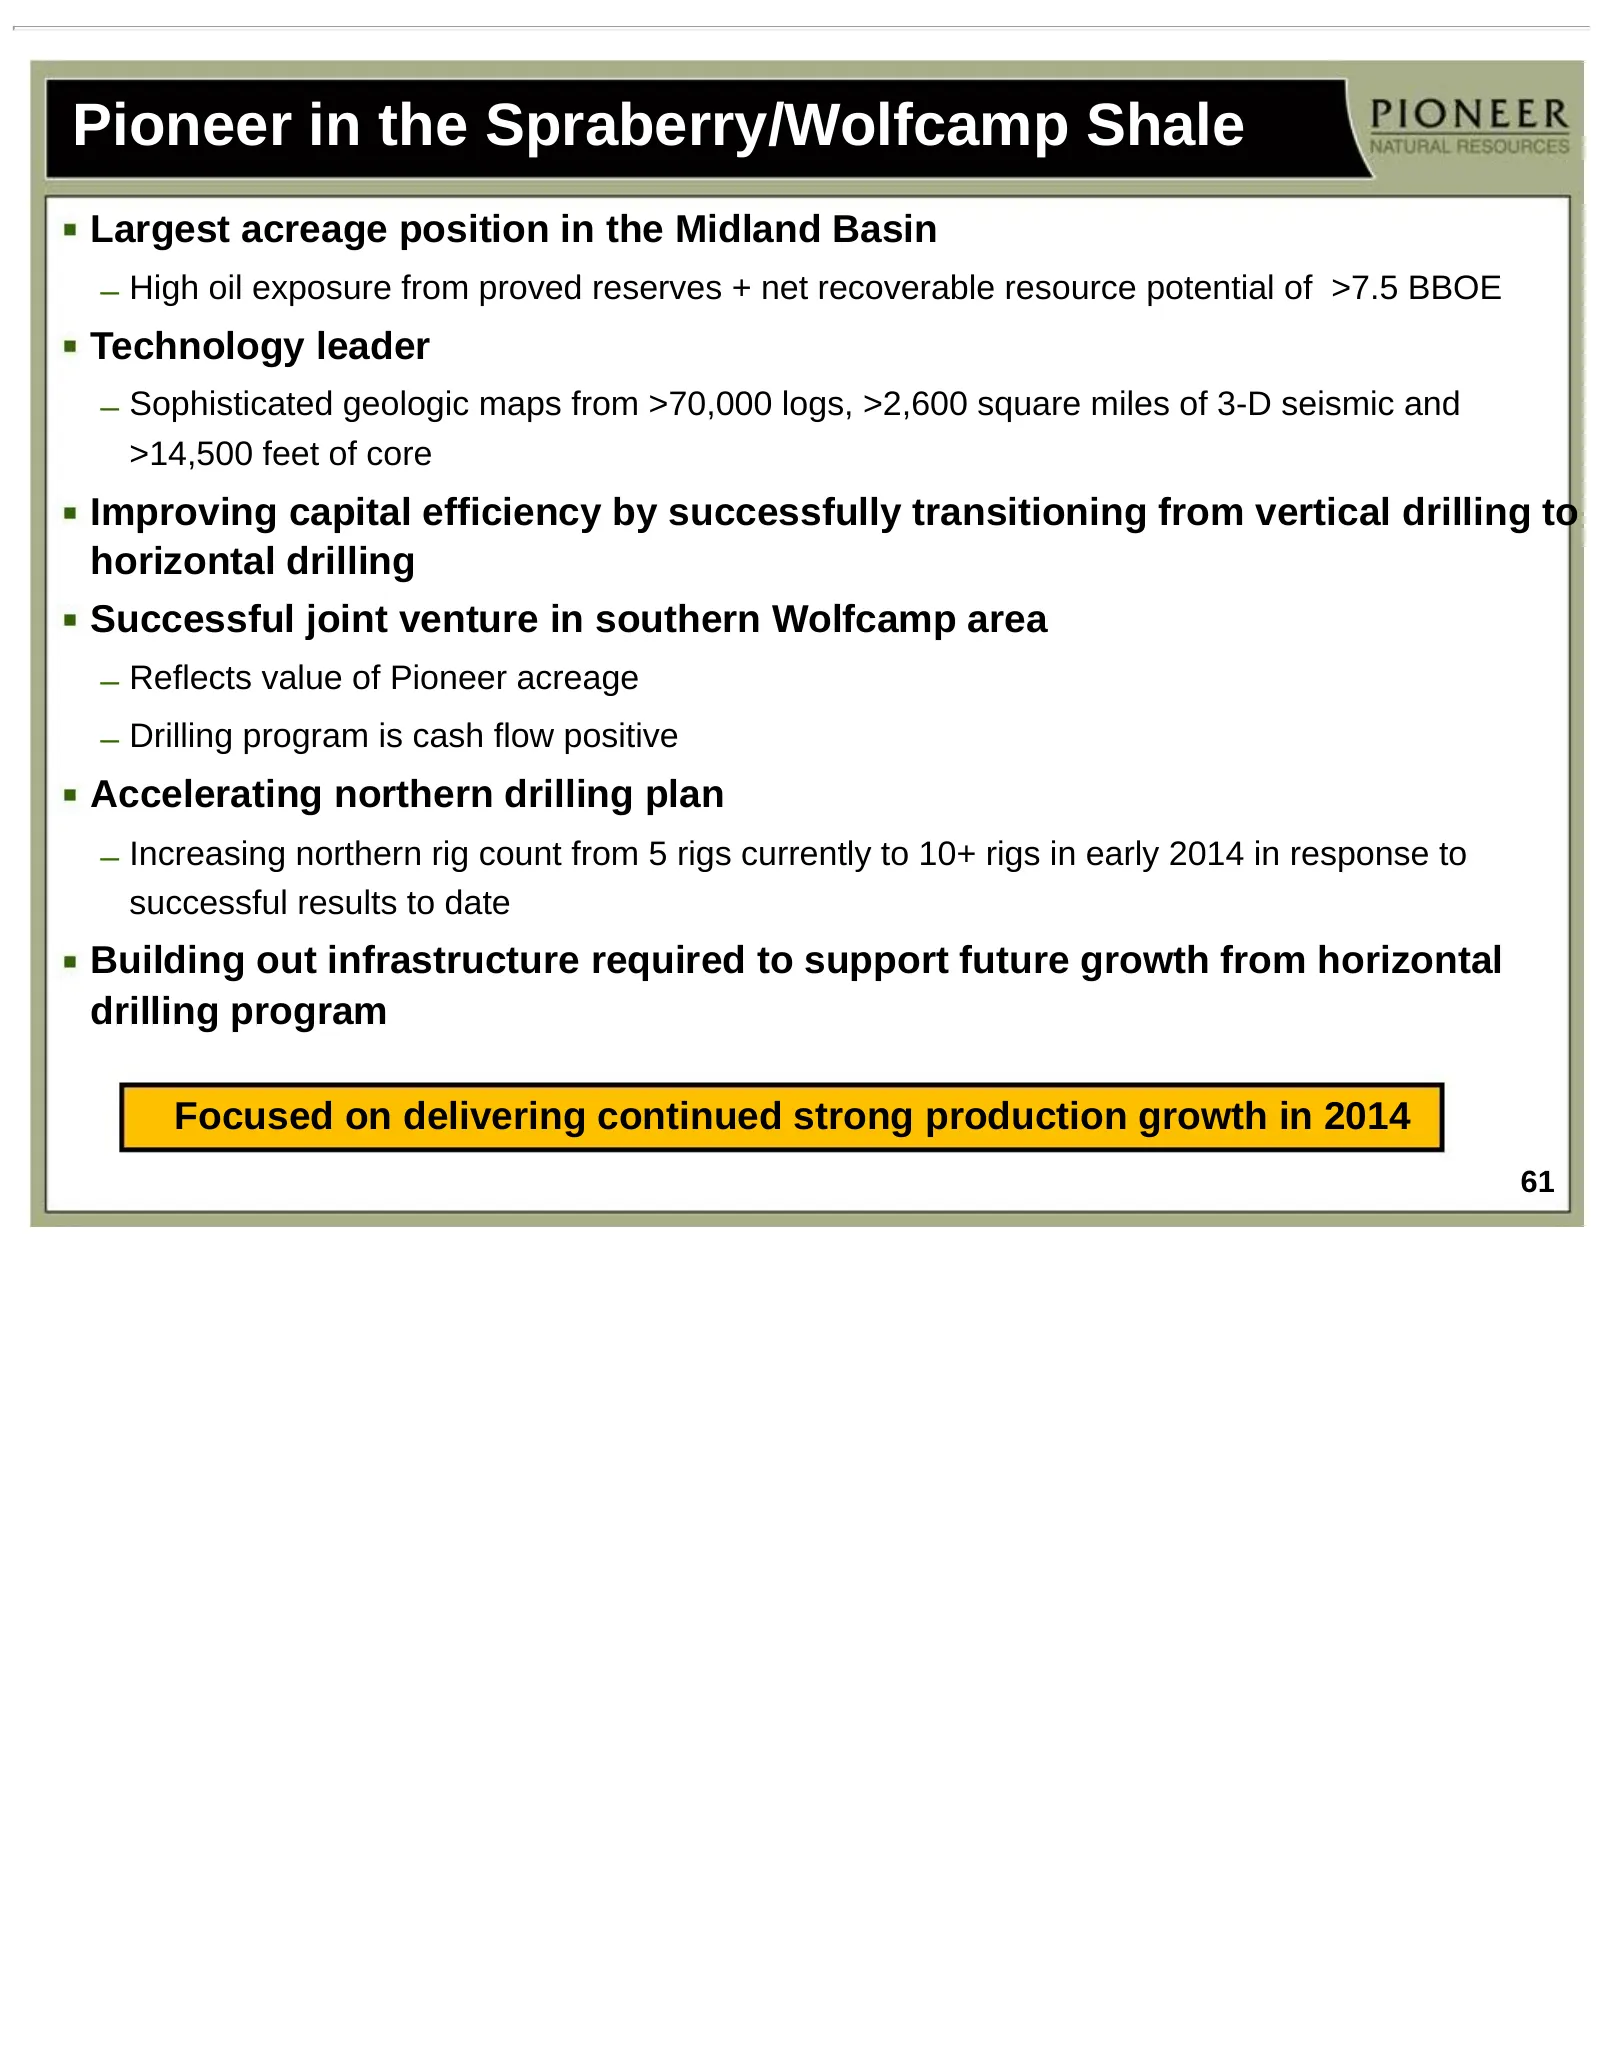
Slide 61: Pioneer in the Spraberry/Wolfcamp Shale
Pioneer in the Spraberry/Wolfcamp Shale Largest acreage position in the Midland Basin – High oil exposure from proved reserves + net recoverable resource potential of >7.5 BBOE Technology leader – Sophisticated geologic maps from >70,000 logs, >2,600 square miles of 3-D seismic and >14,500 feet of c
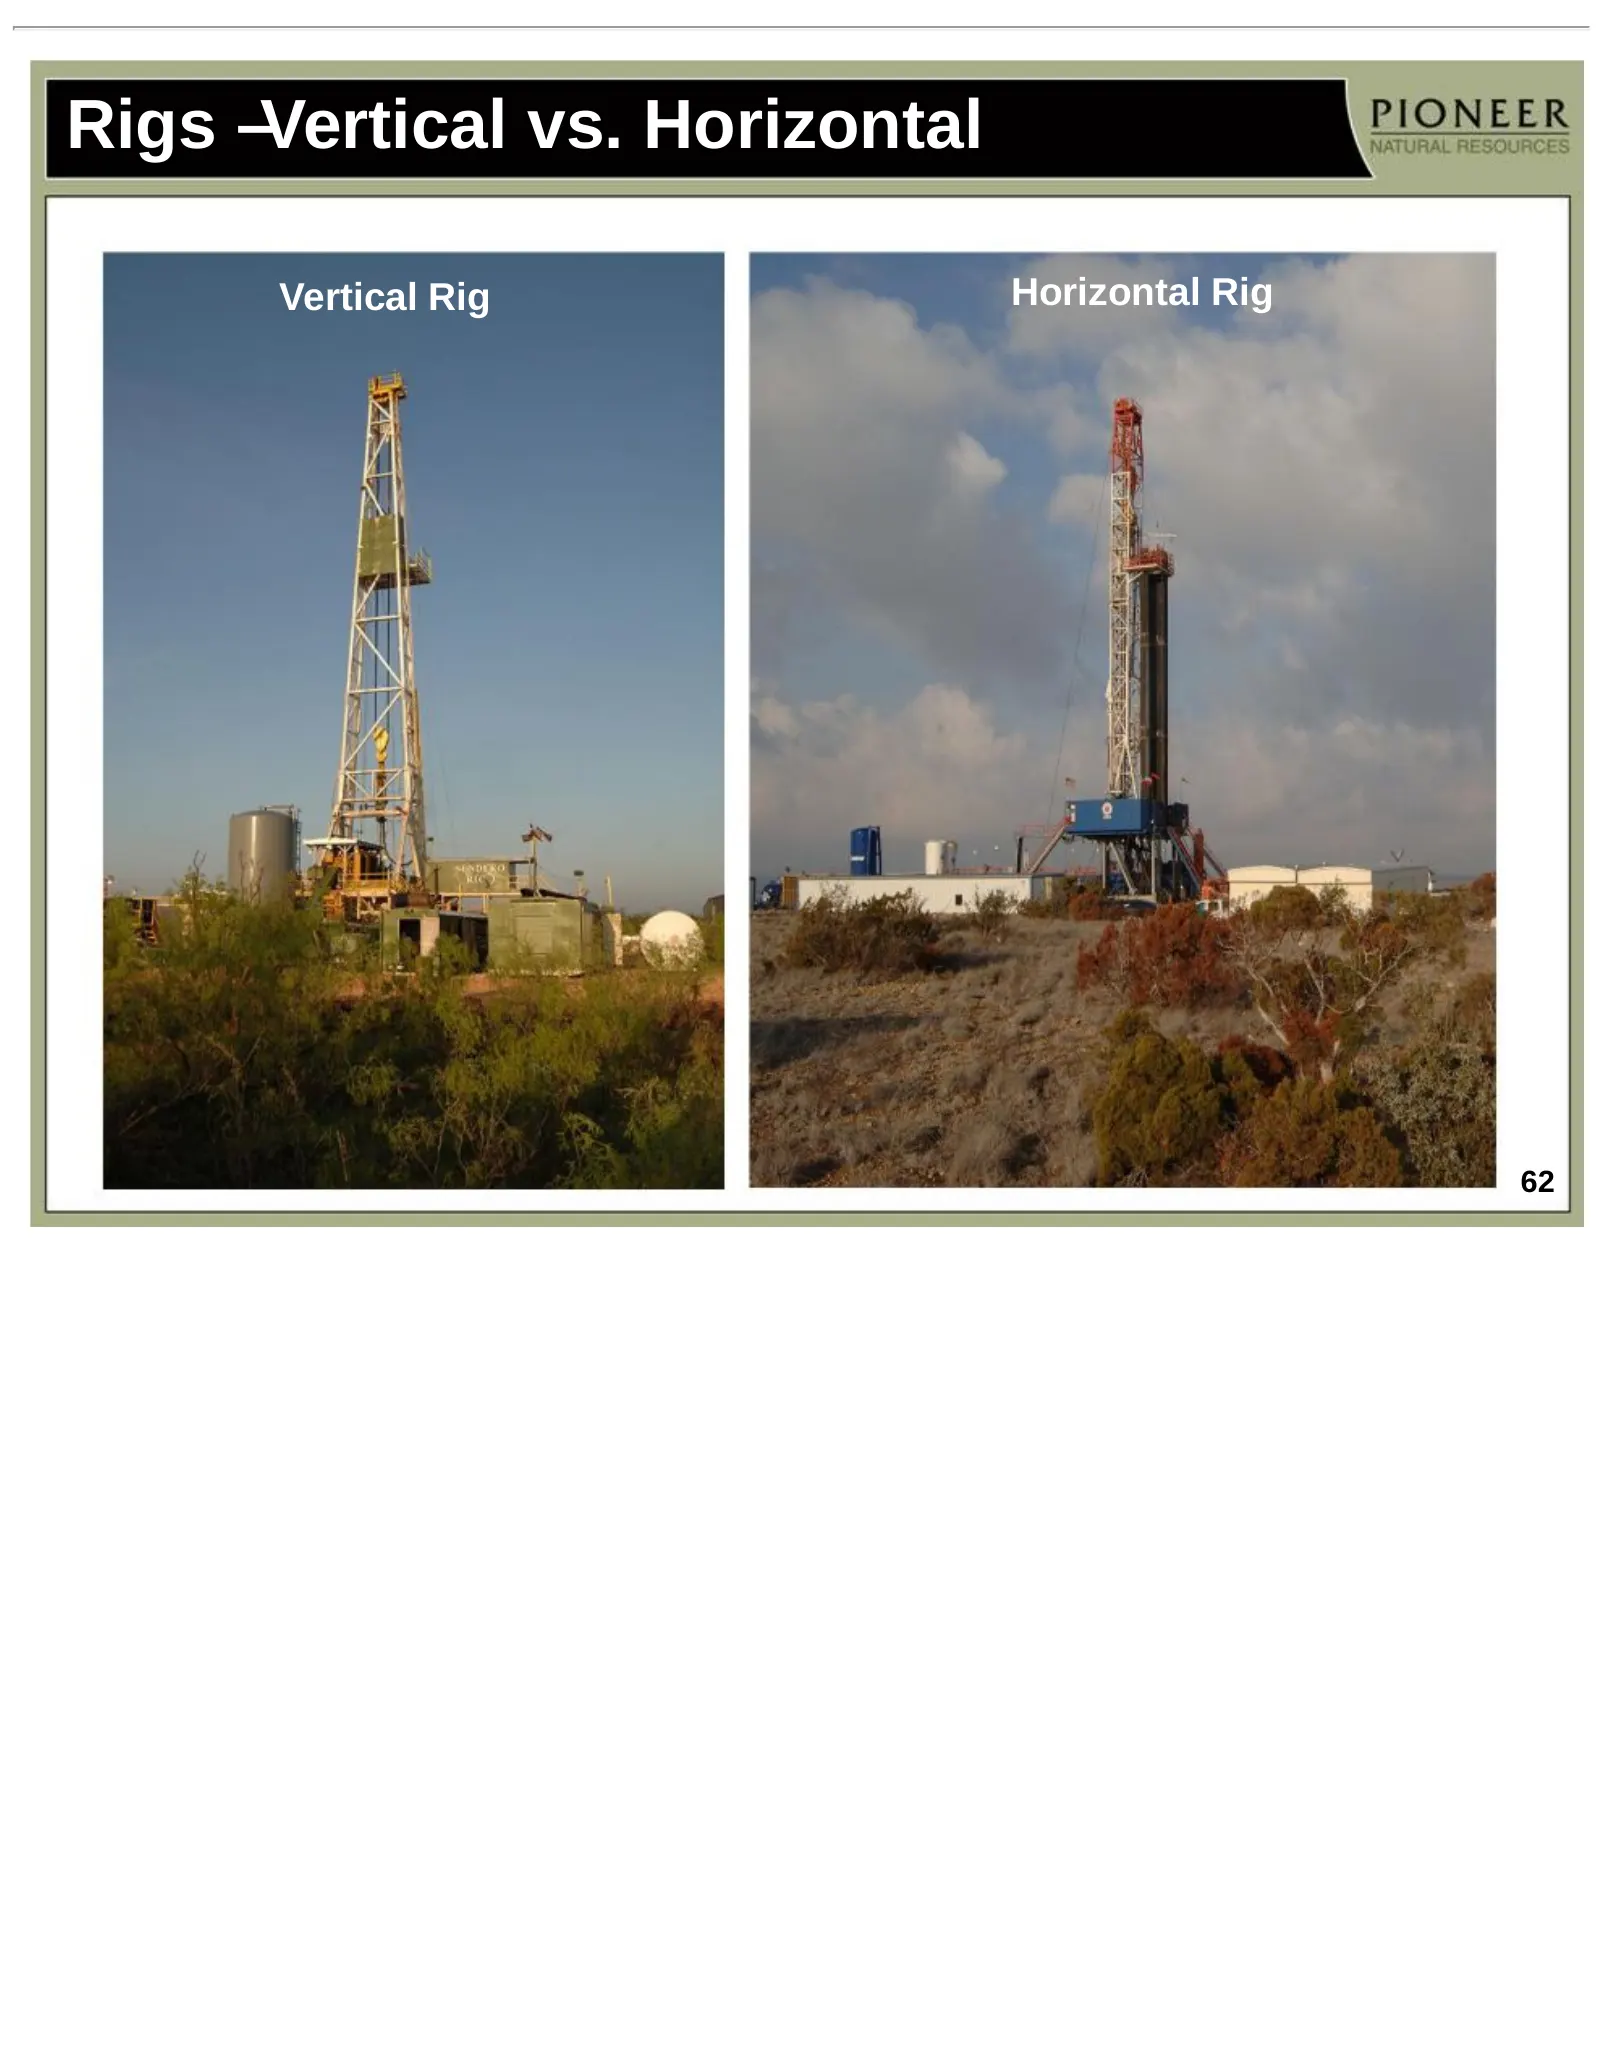
Slide 62: Rigs – Vertical vs. Horizontal
Rigs –Vertical vs. Horizontal Vertical Rig Horizontal Rig 62
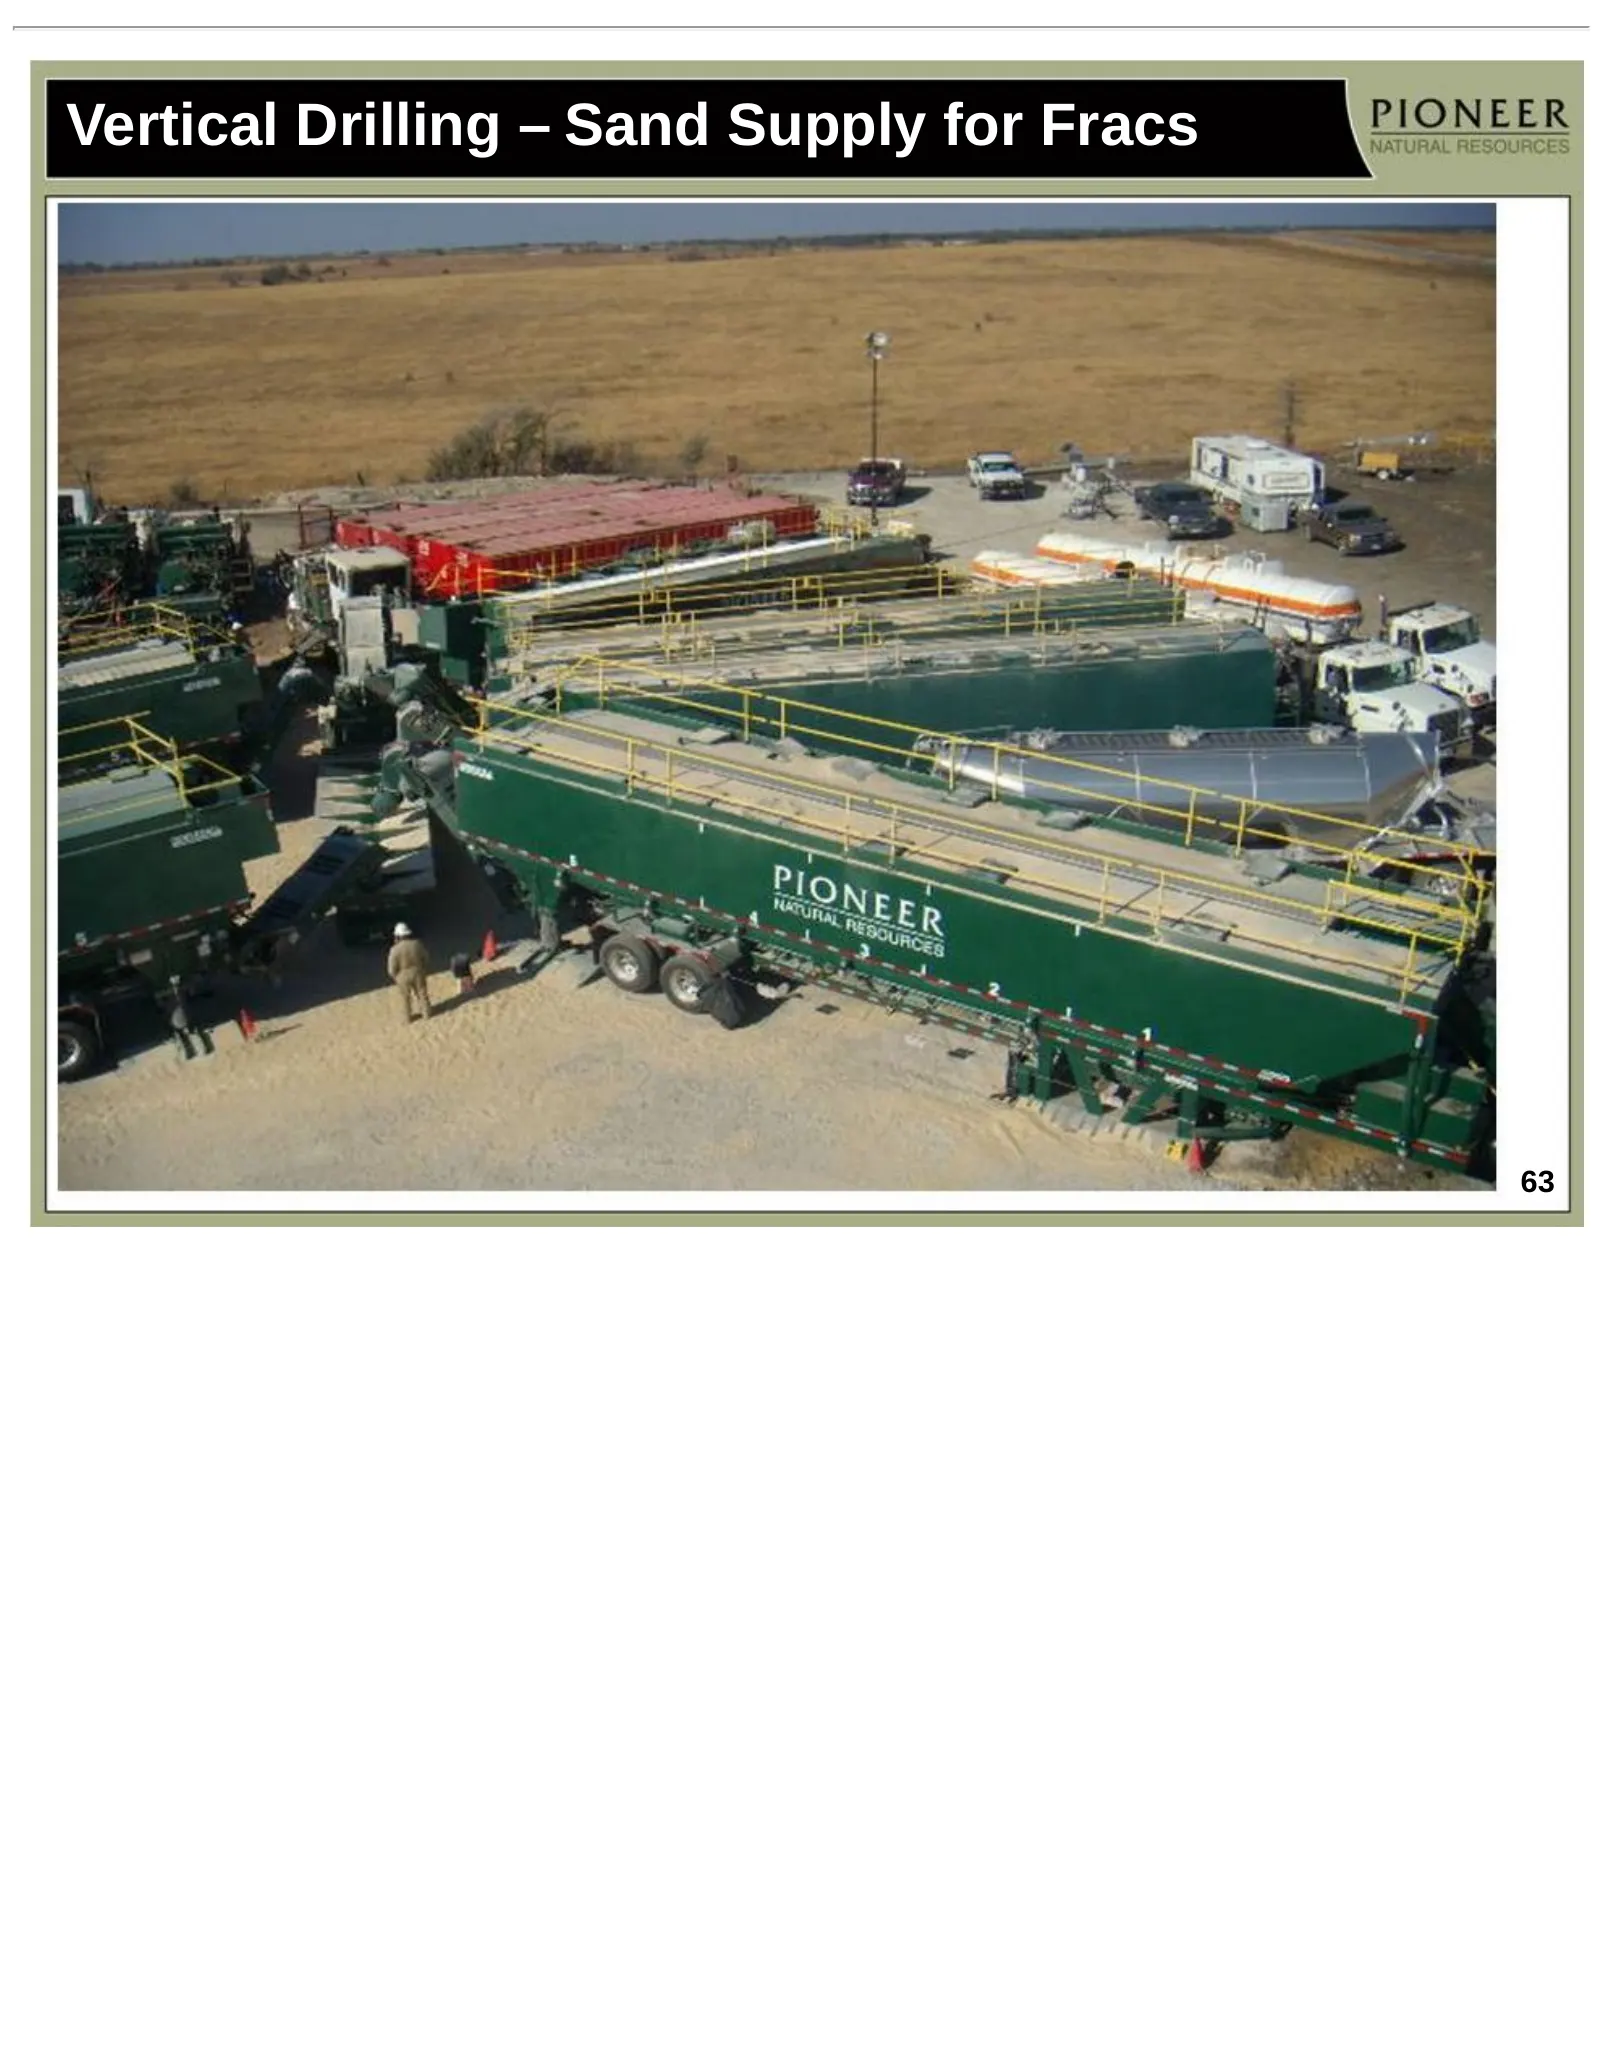
Slide 63: Vertical Drilling – Sand Supply for Fracs
Vertical Drilling – Sand Supply for Fracs 63
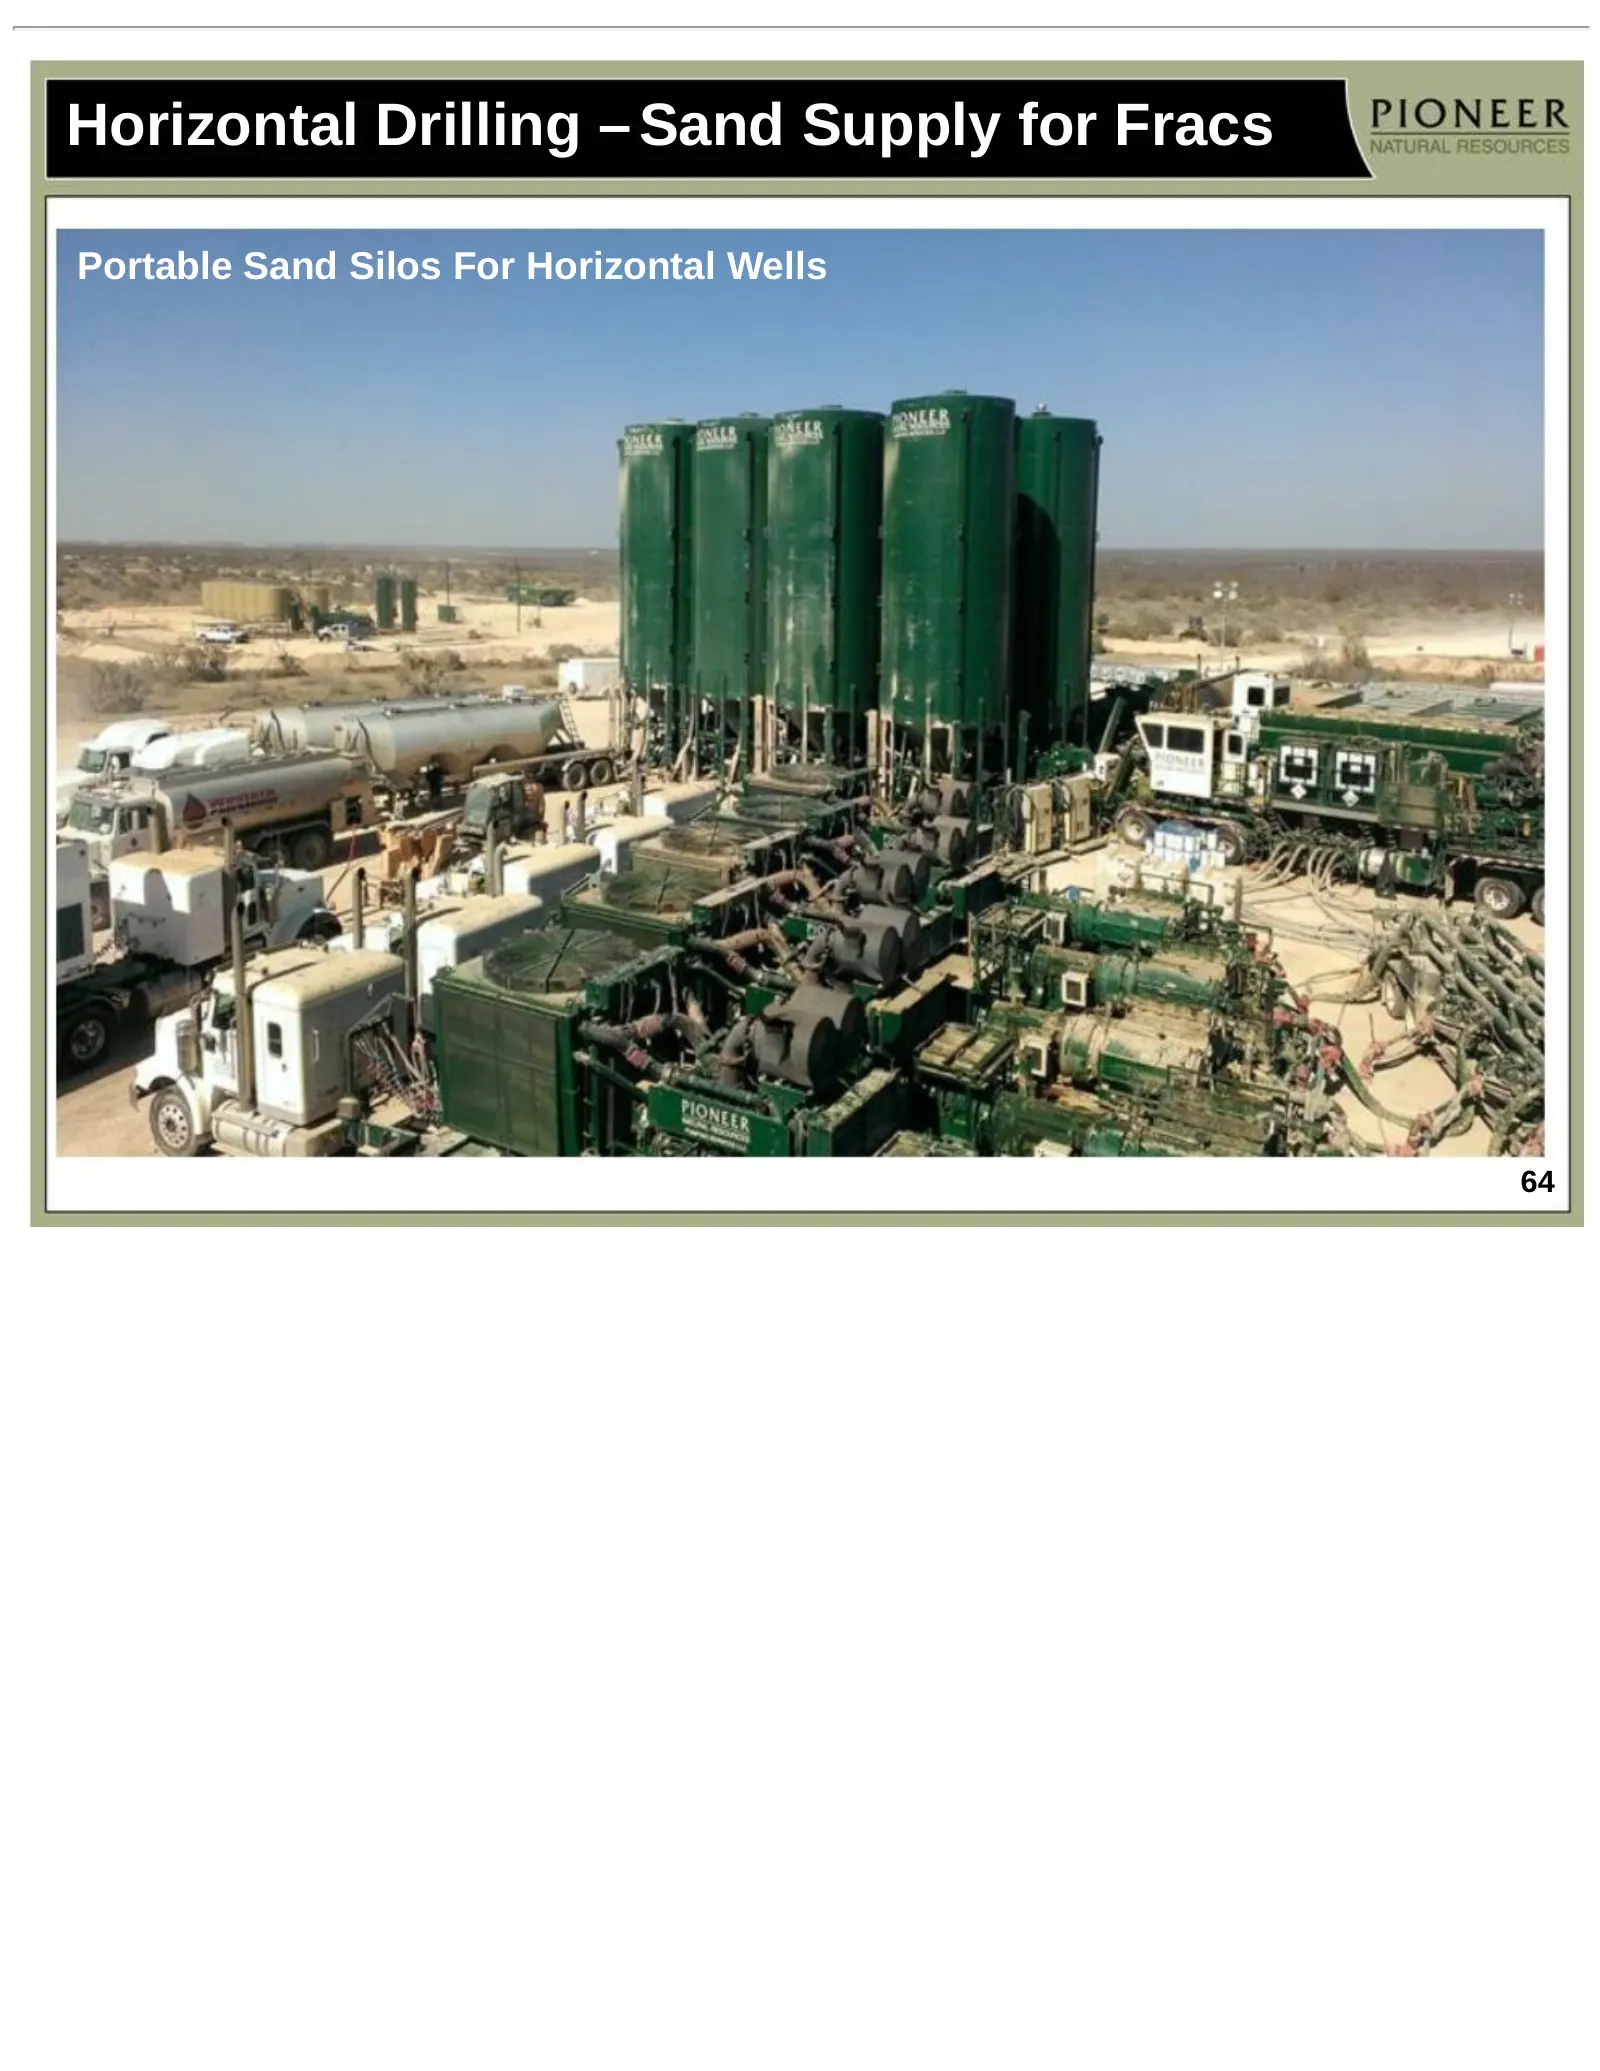
Slide 64: Horizontal Drilling – Sand Supply for Fracs
Horizontal Drilling – Sand Supply for Fracs Portable Sand Silos For Horizontal Wells 64
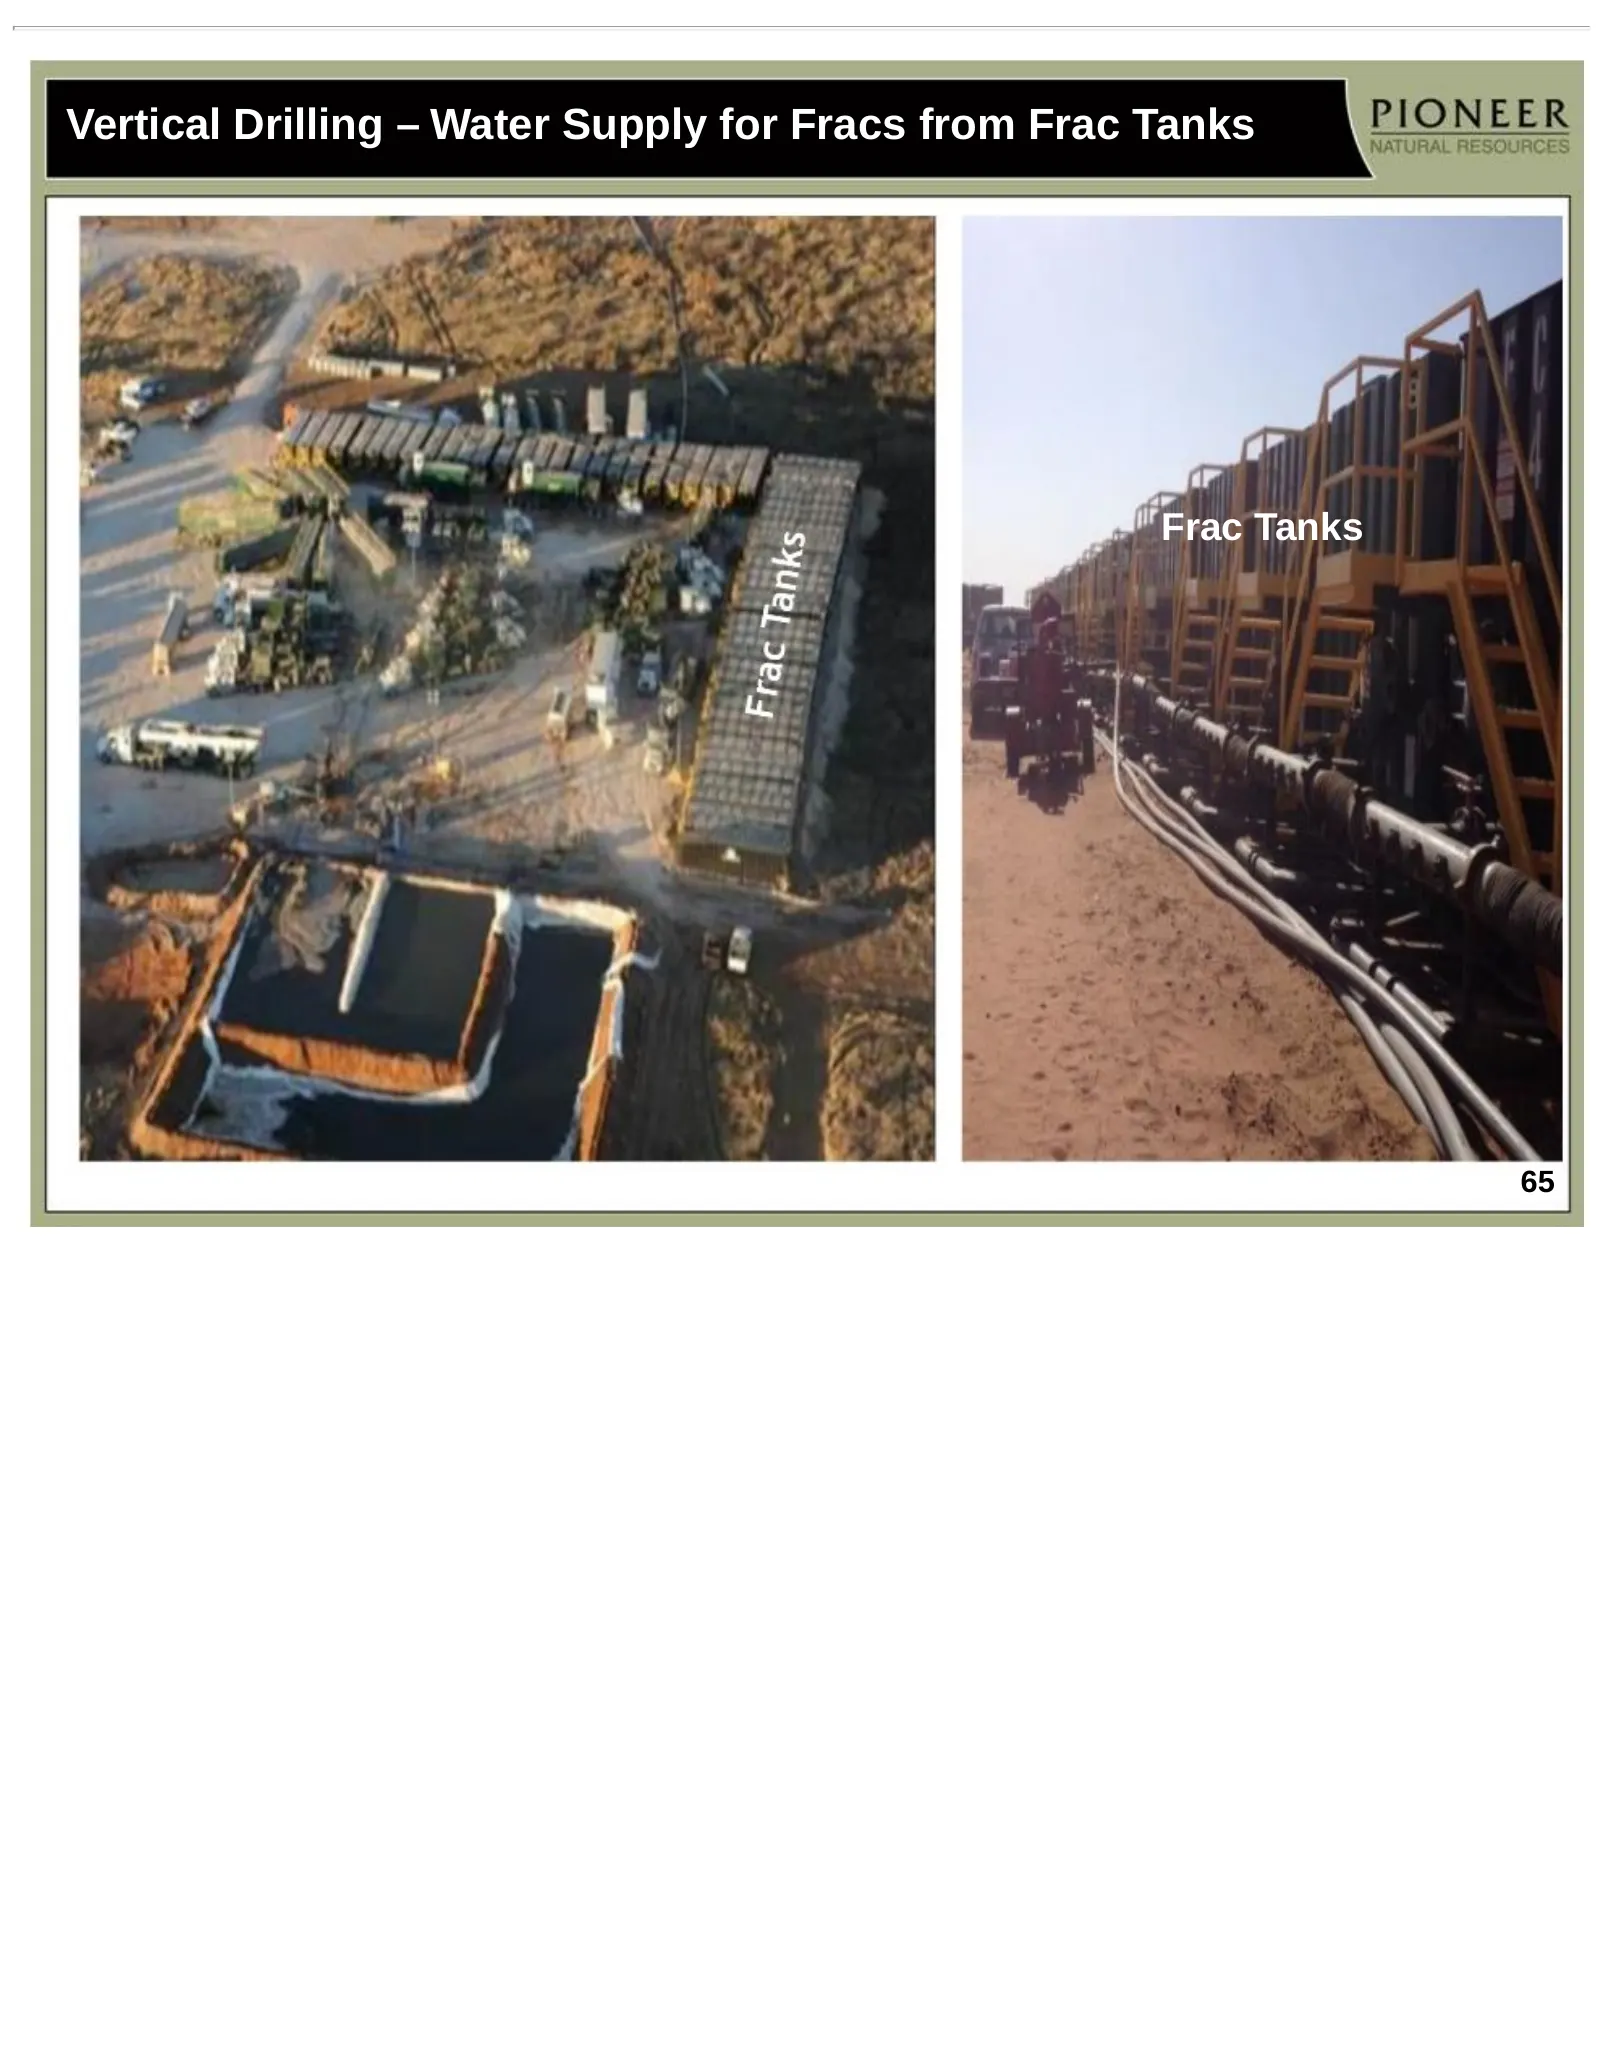
Slide 65: Vertical Drilling – Water Supply for Fracs from Frac Tanks
Vertical Drilling – Water Supply for Fracs from Frac Tanks Frac Tanks 65
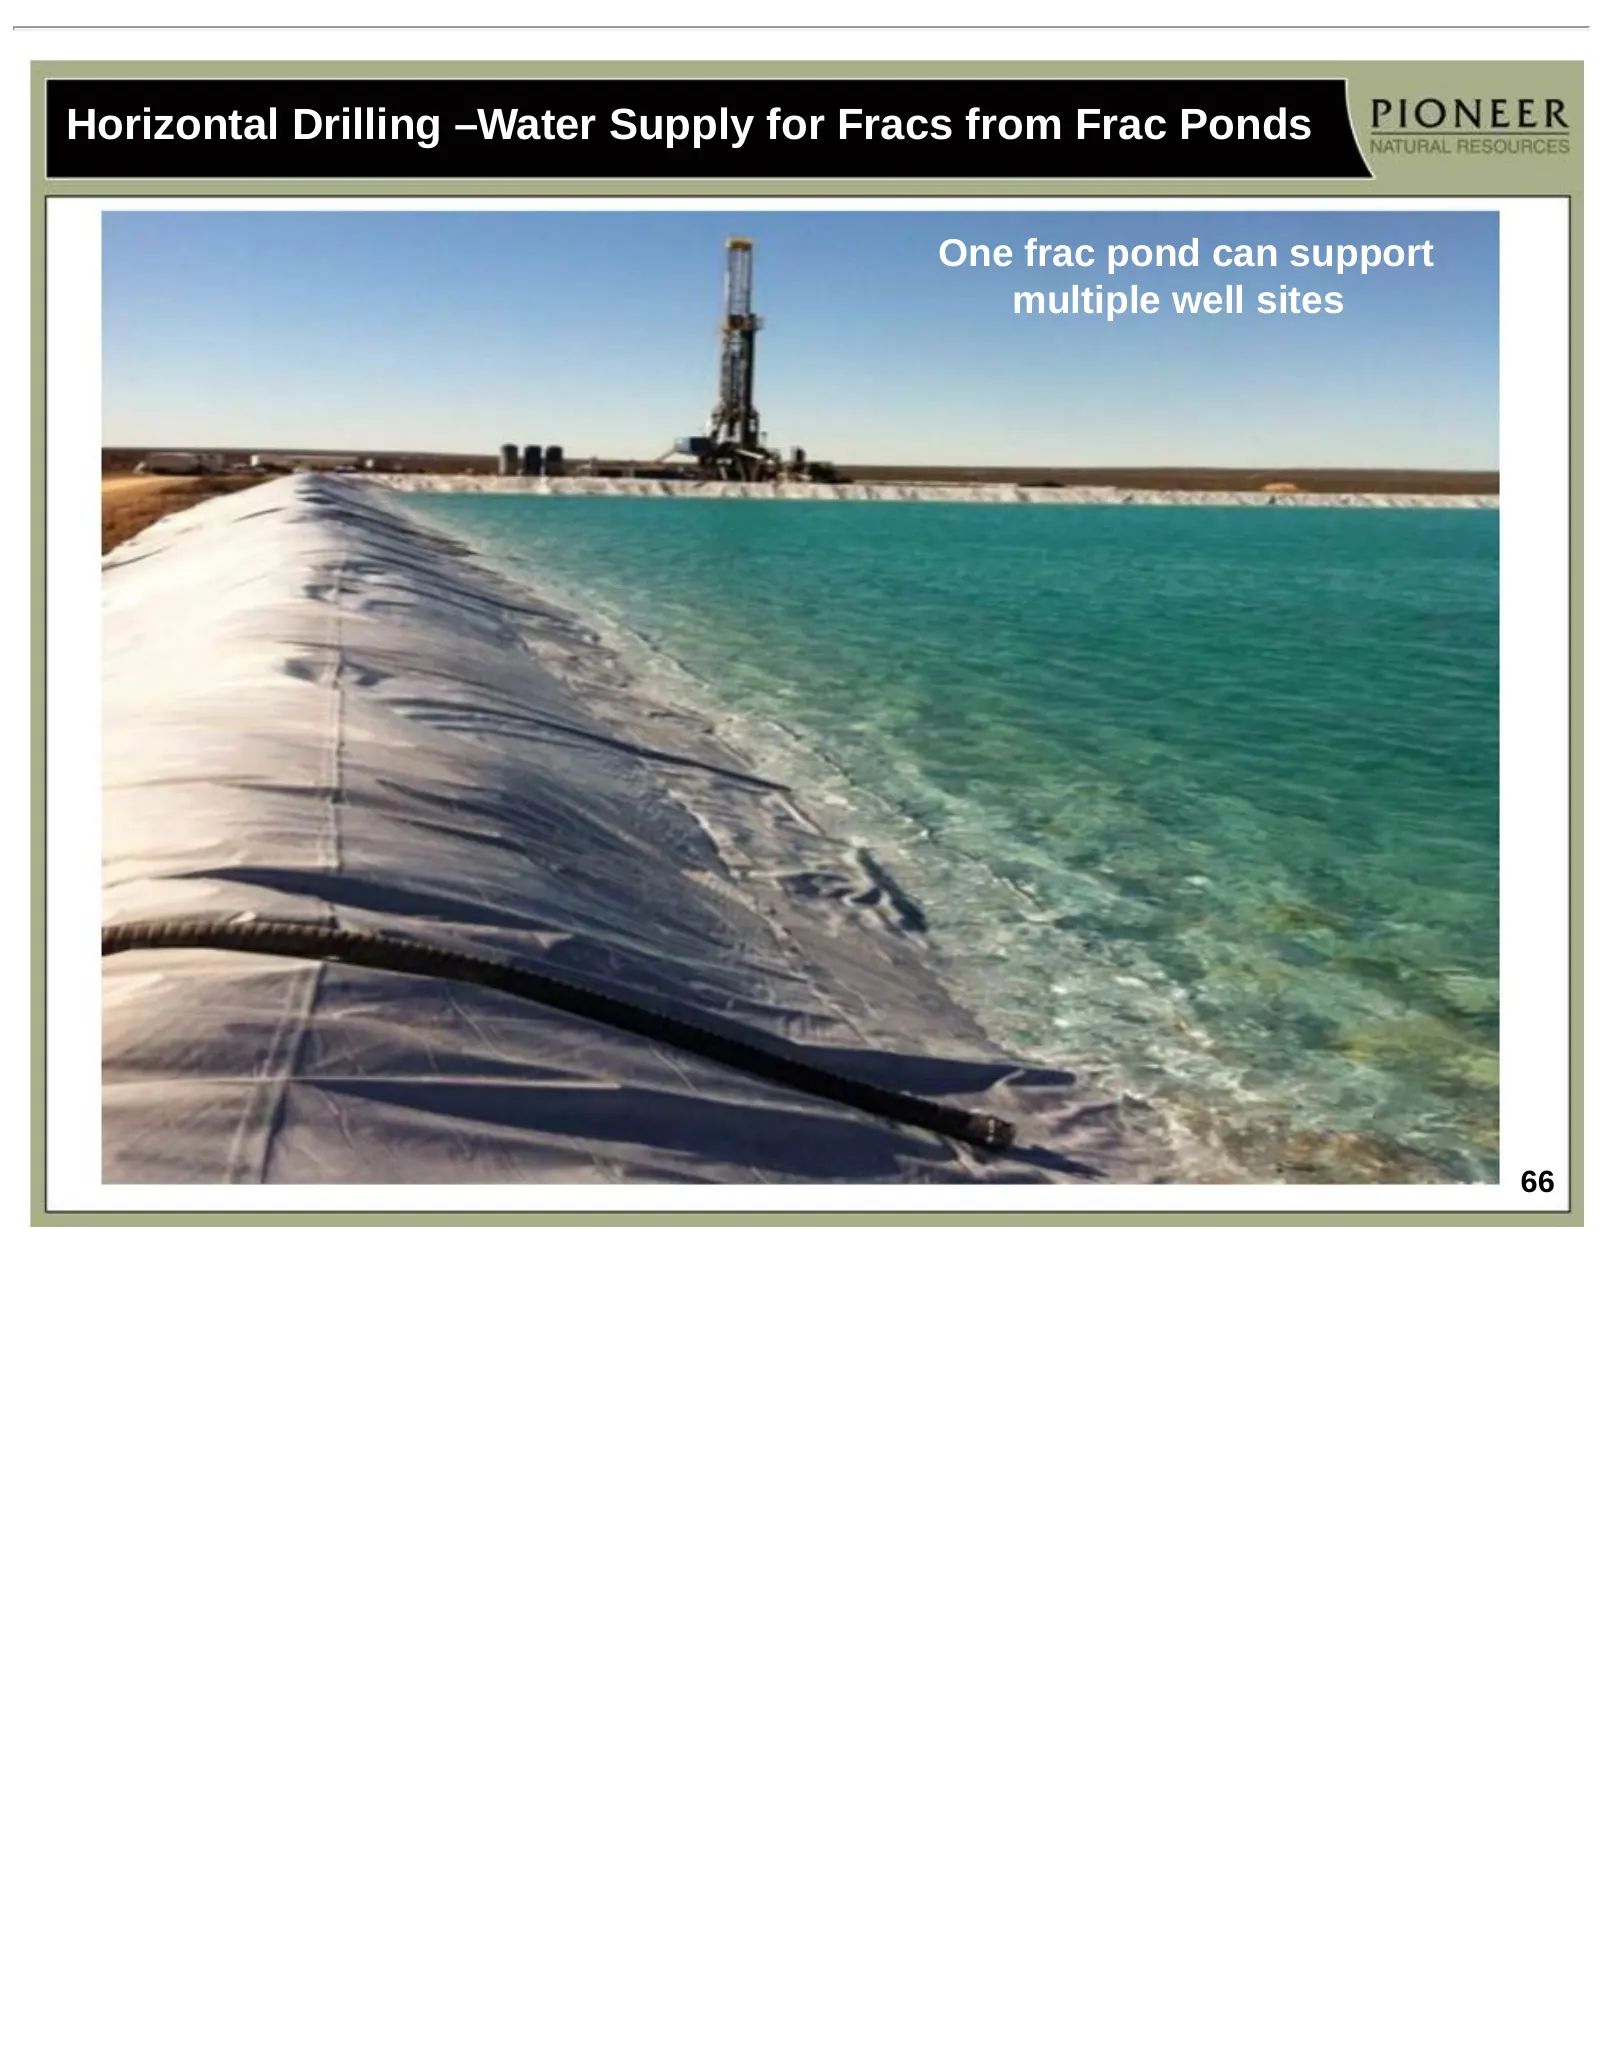
Slide 66: Horizontal Drilling – Water Supply for Fracs from Frac Ponds
Horizontal Drilling –Water Supply for Fracs from Frac Ponds One frac pond can support multiple well sites 66
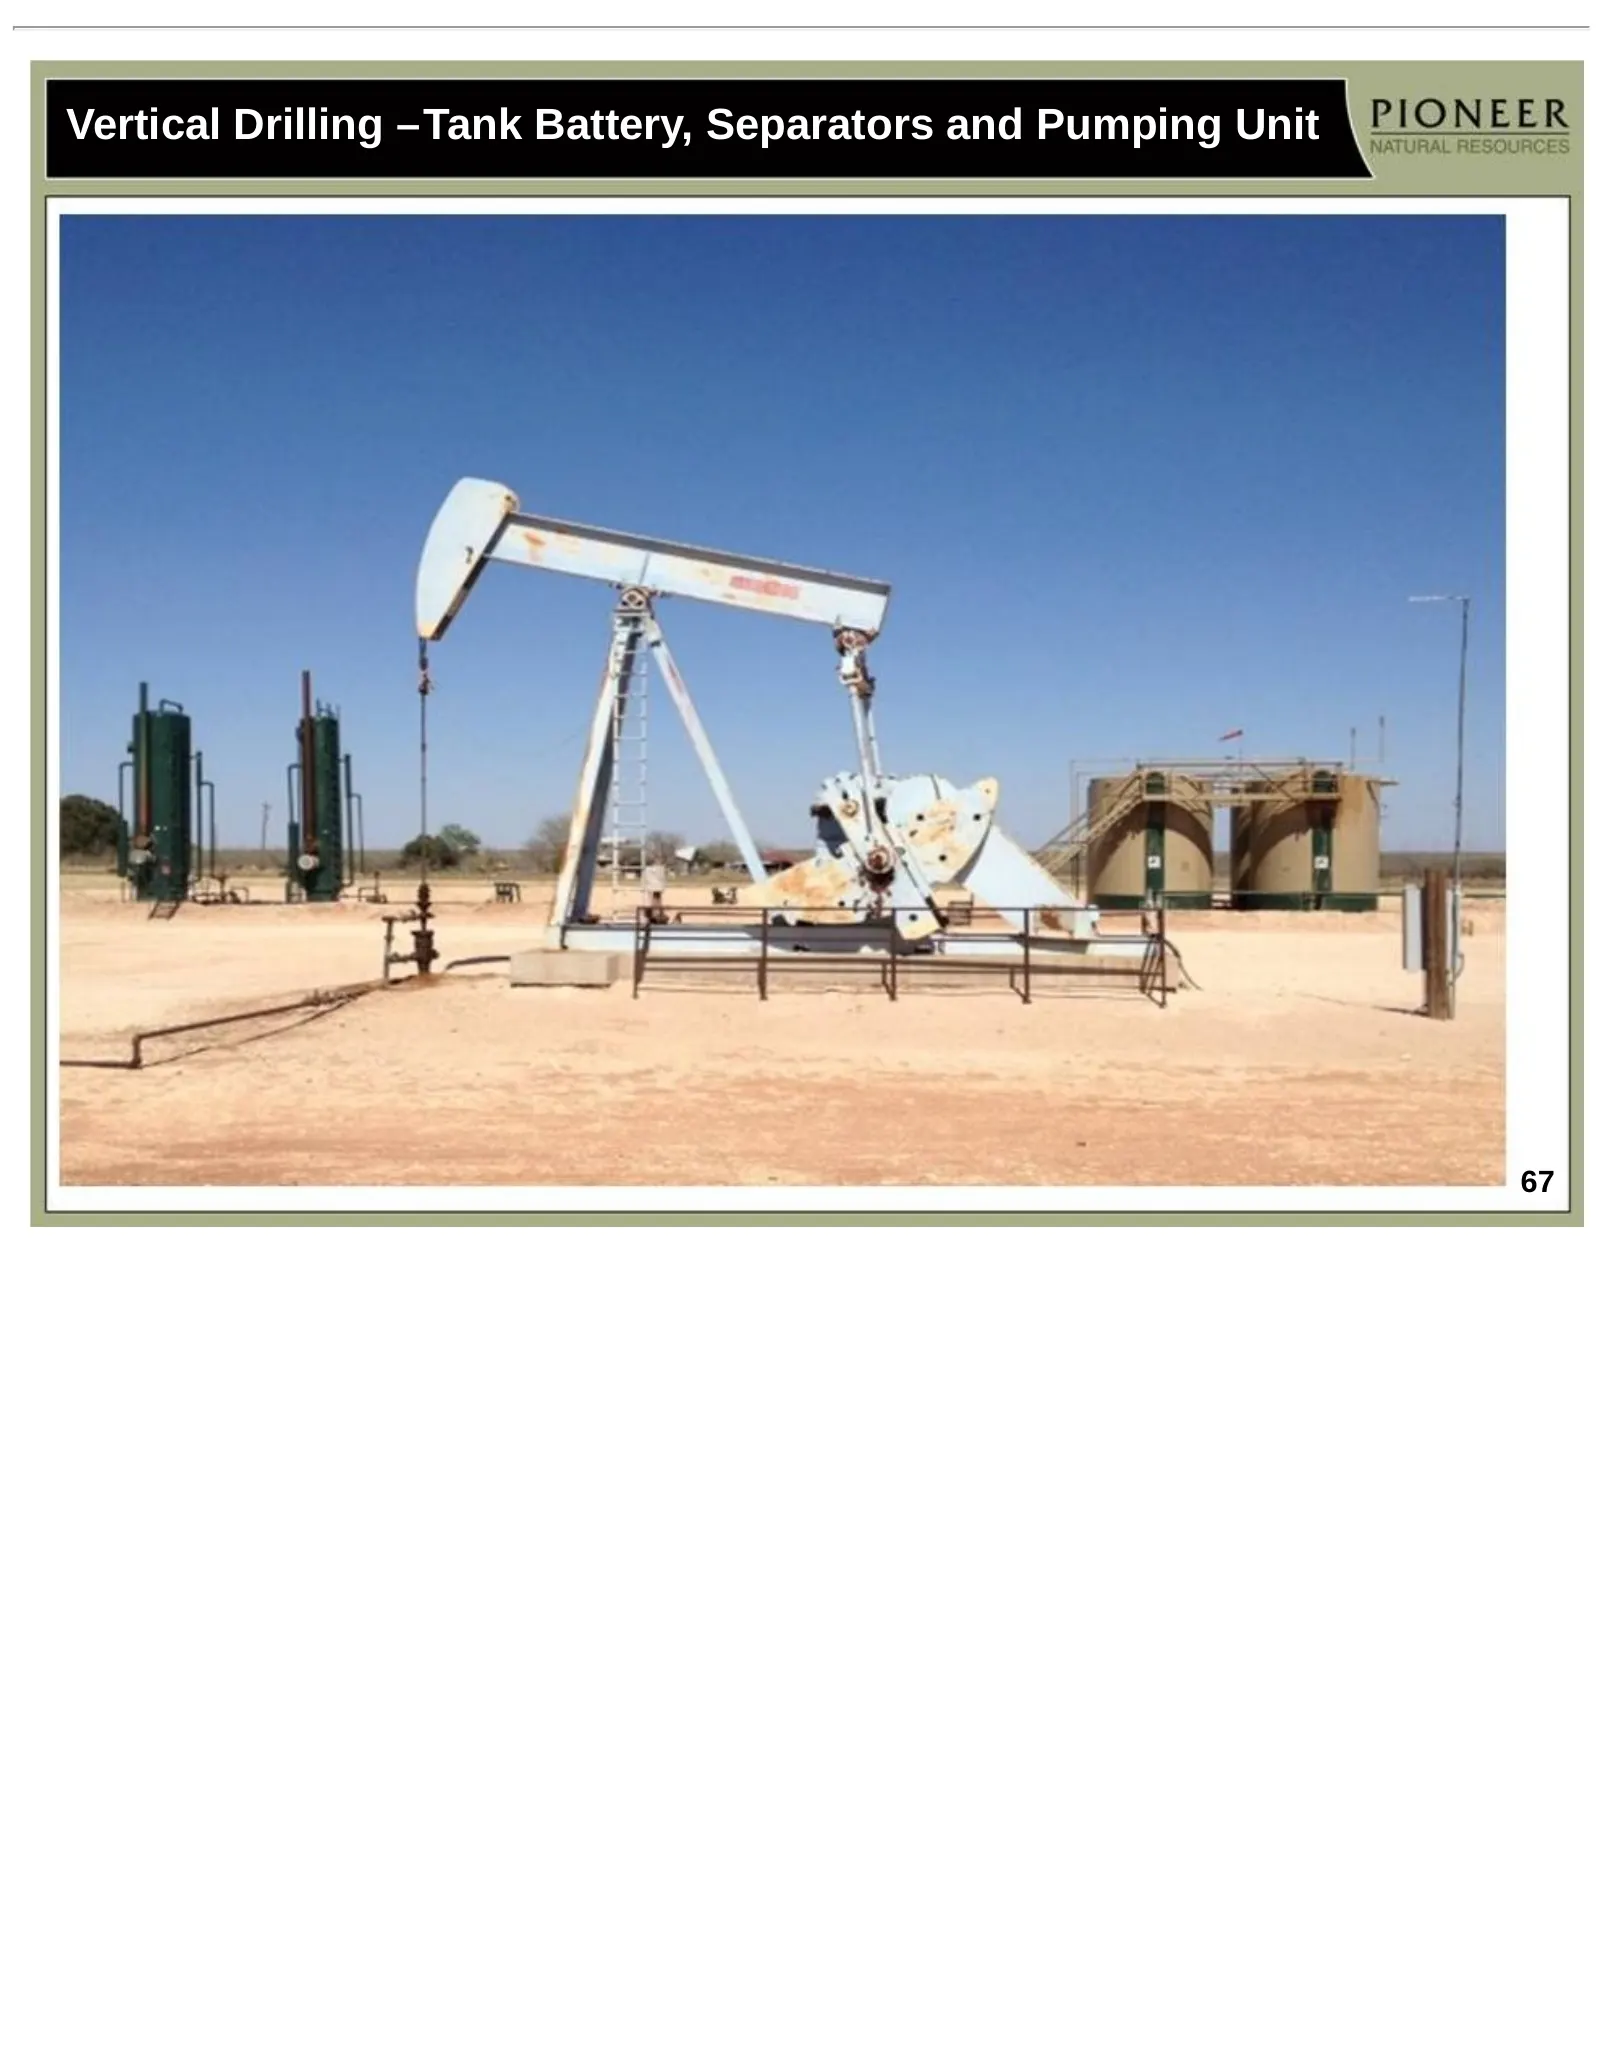
Slide 67: Vertical Drilling – Tank Battery, Separators and Pumping Unit
Vertical Drilling –Tank Battery, Separators and Pumping Unit 67
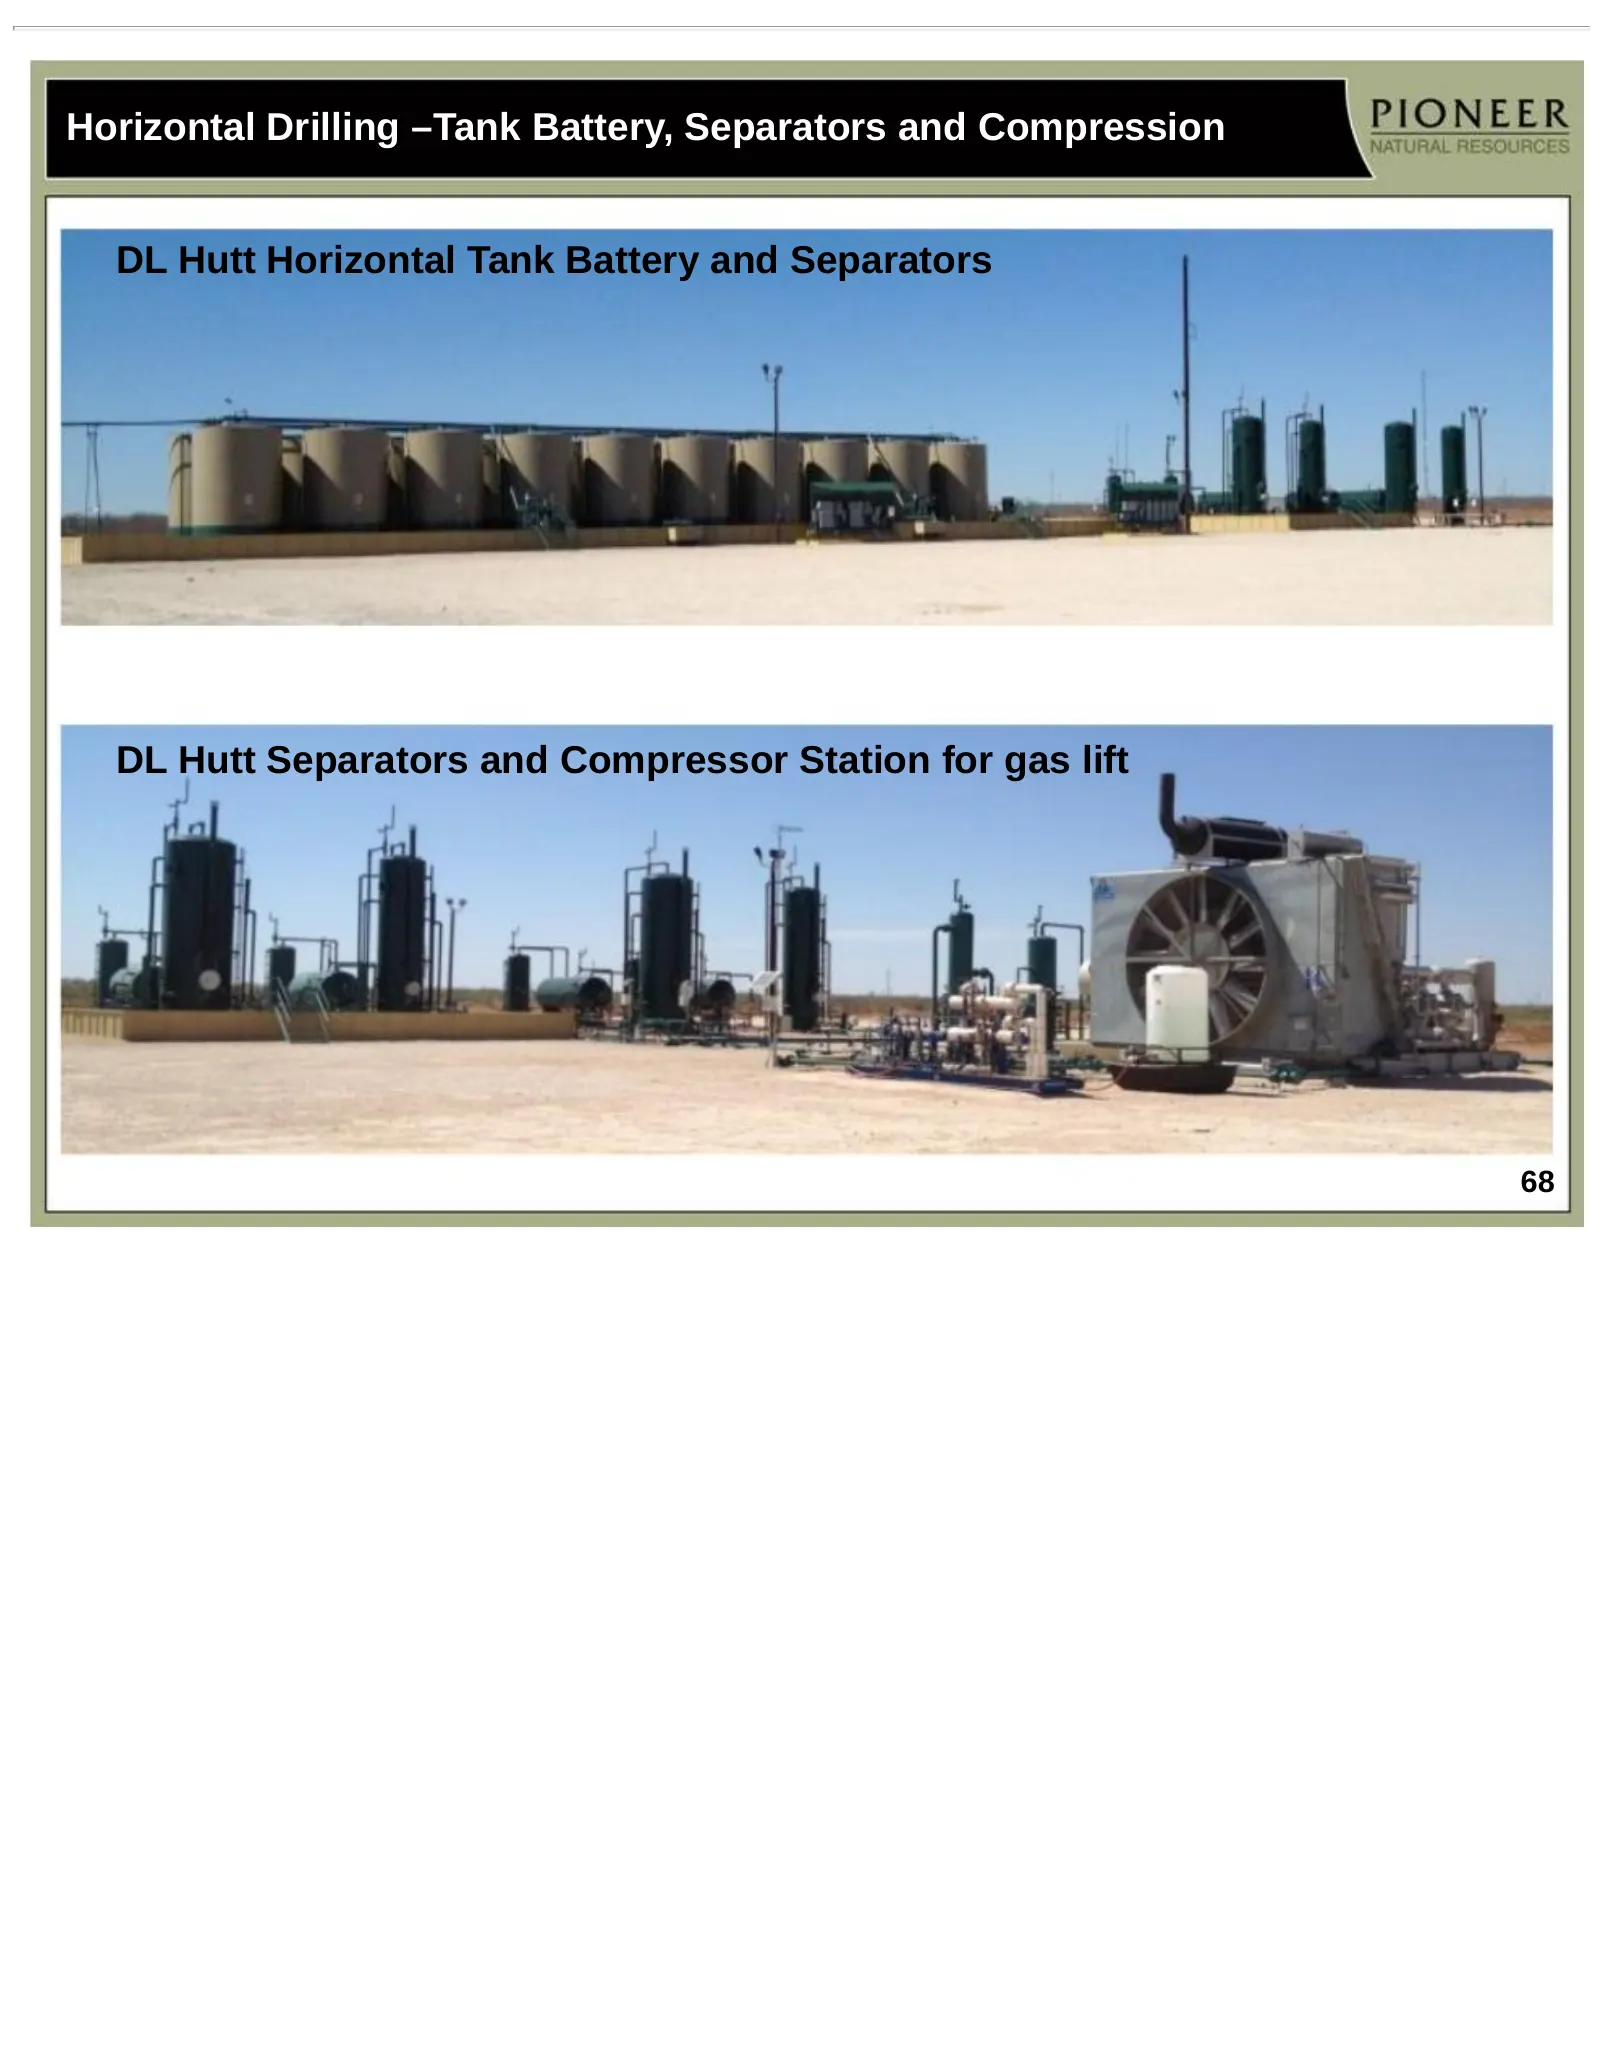
Slide 68: Horizontal Drilling – Tank Battery, Separators and Compression
Horizontal Drilling –Tank Battery, Separators and Compression DL Hutt Horizontal Tank Battery and Separators DL Hutt Separators and Compressor Station for gas lift 68
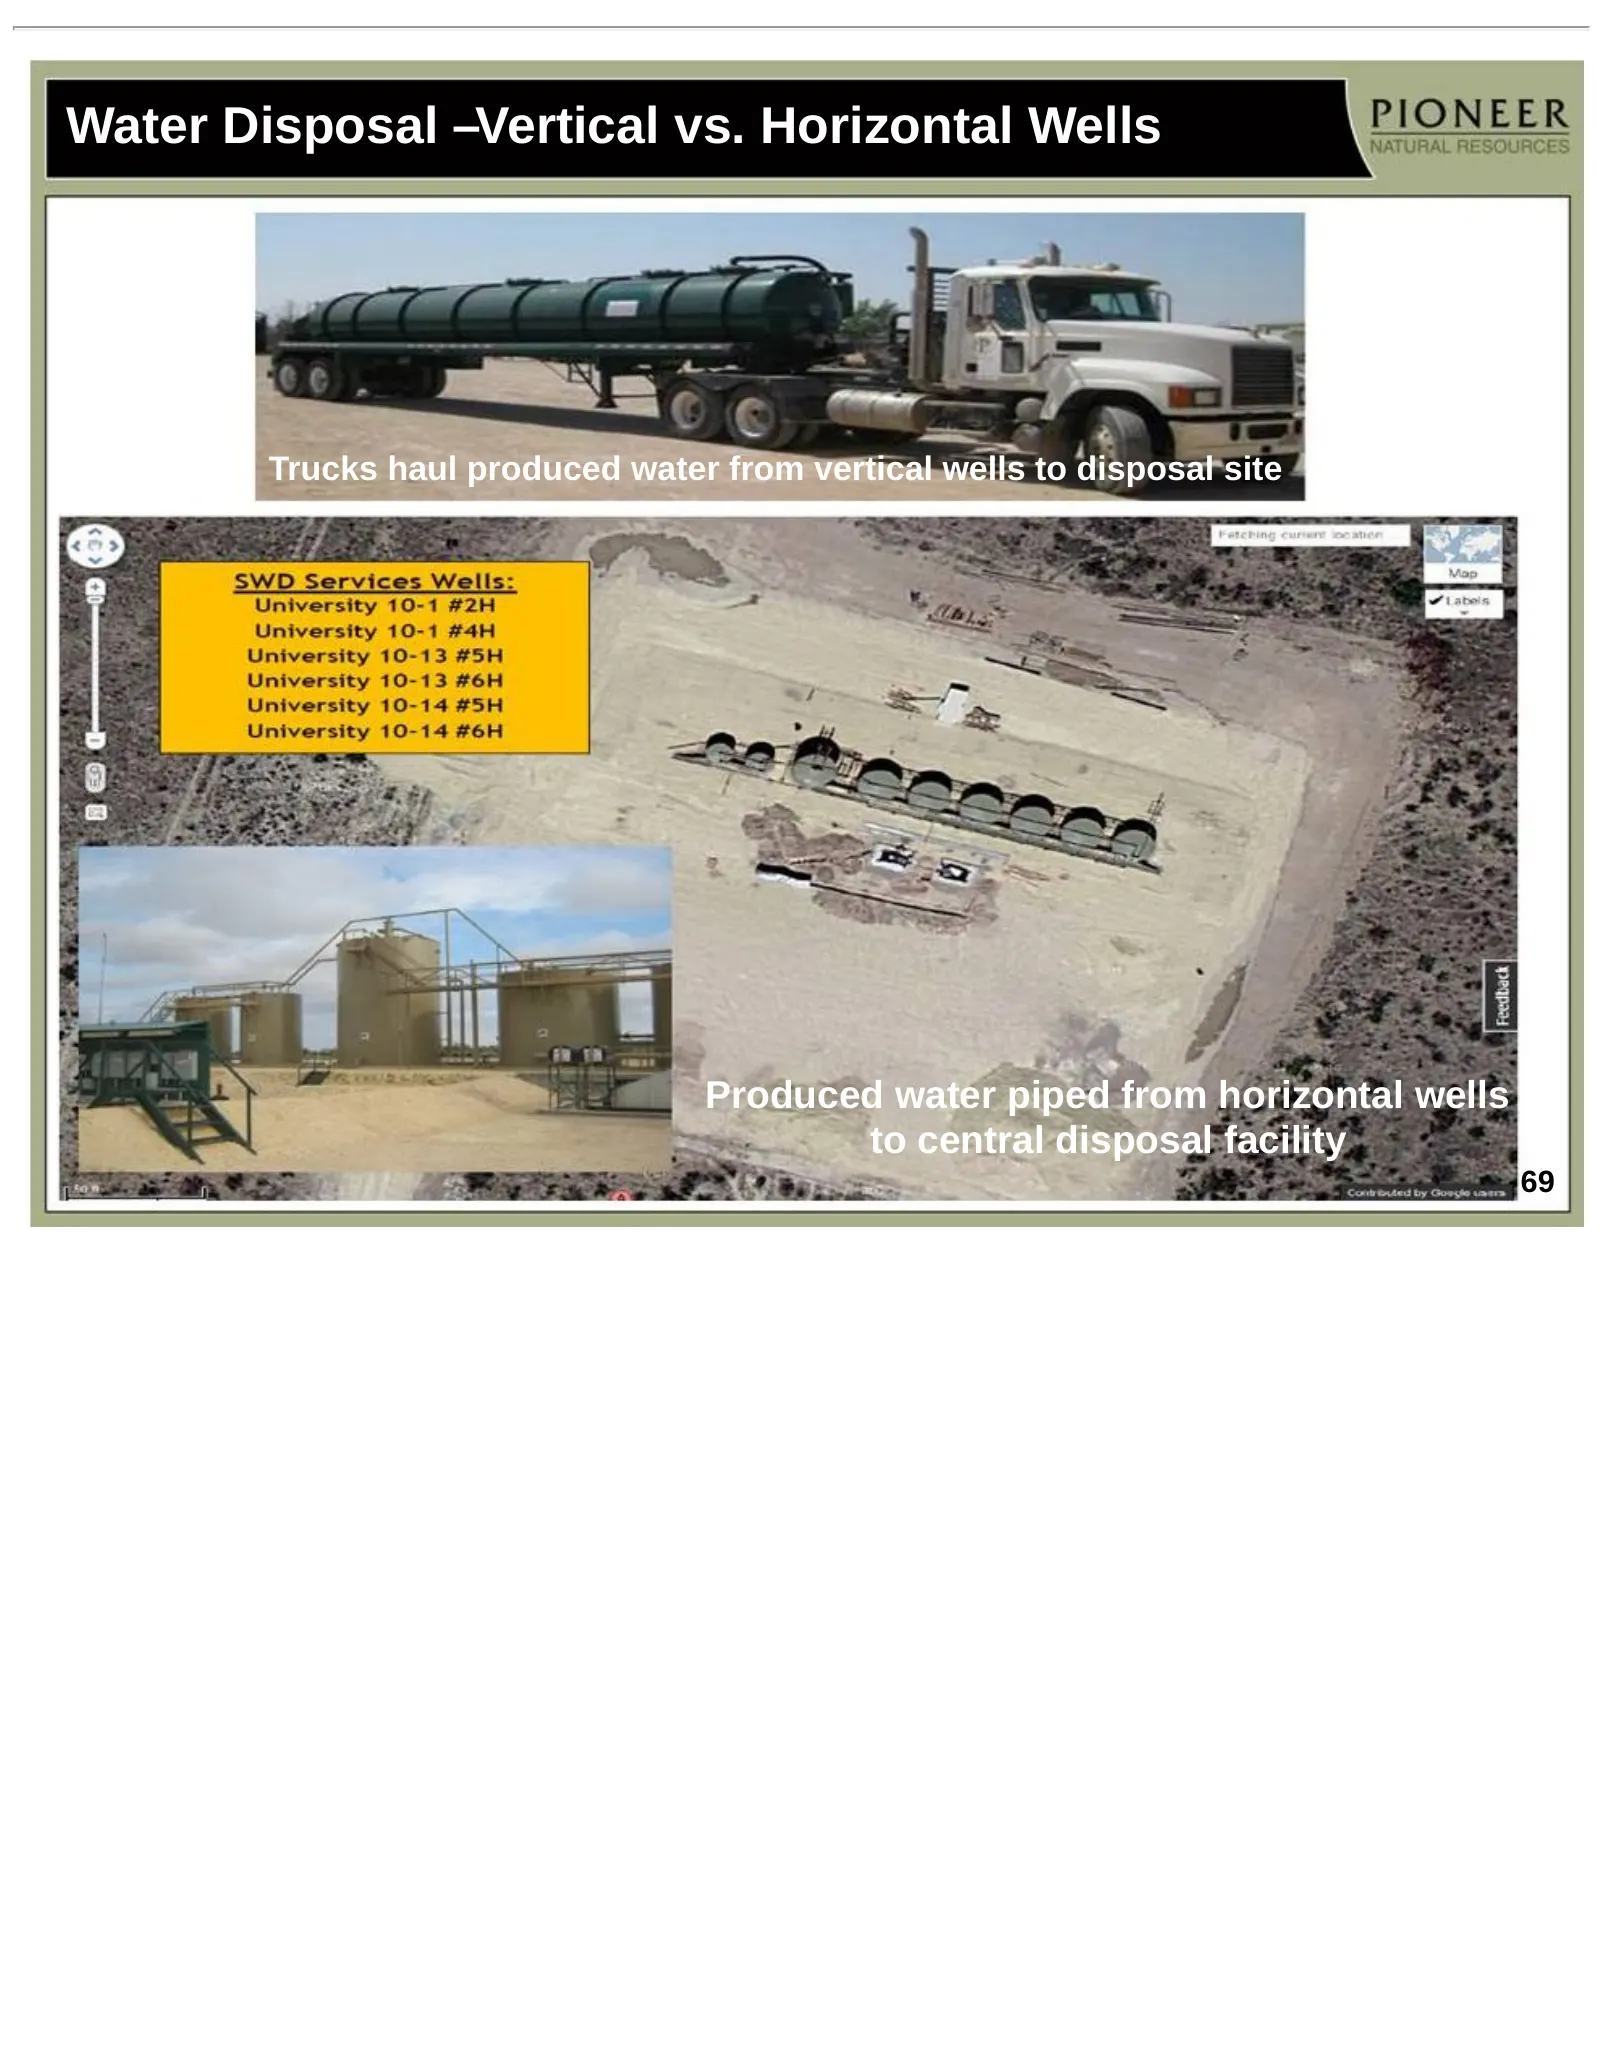
Slide 69: Water Disposal – Vertical vs. Horizontal Wells
Water Disposal –Vertical vs. Horizontal Wells Trucks haul produced water from vertical wells to disposal site Produced water piped from horizontal wells to central disposal facility 69
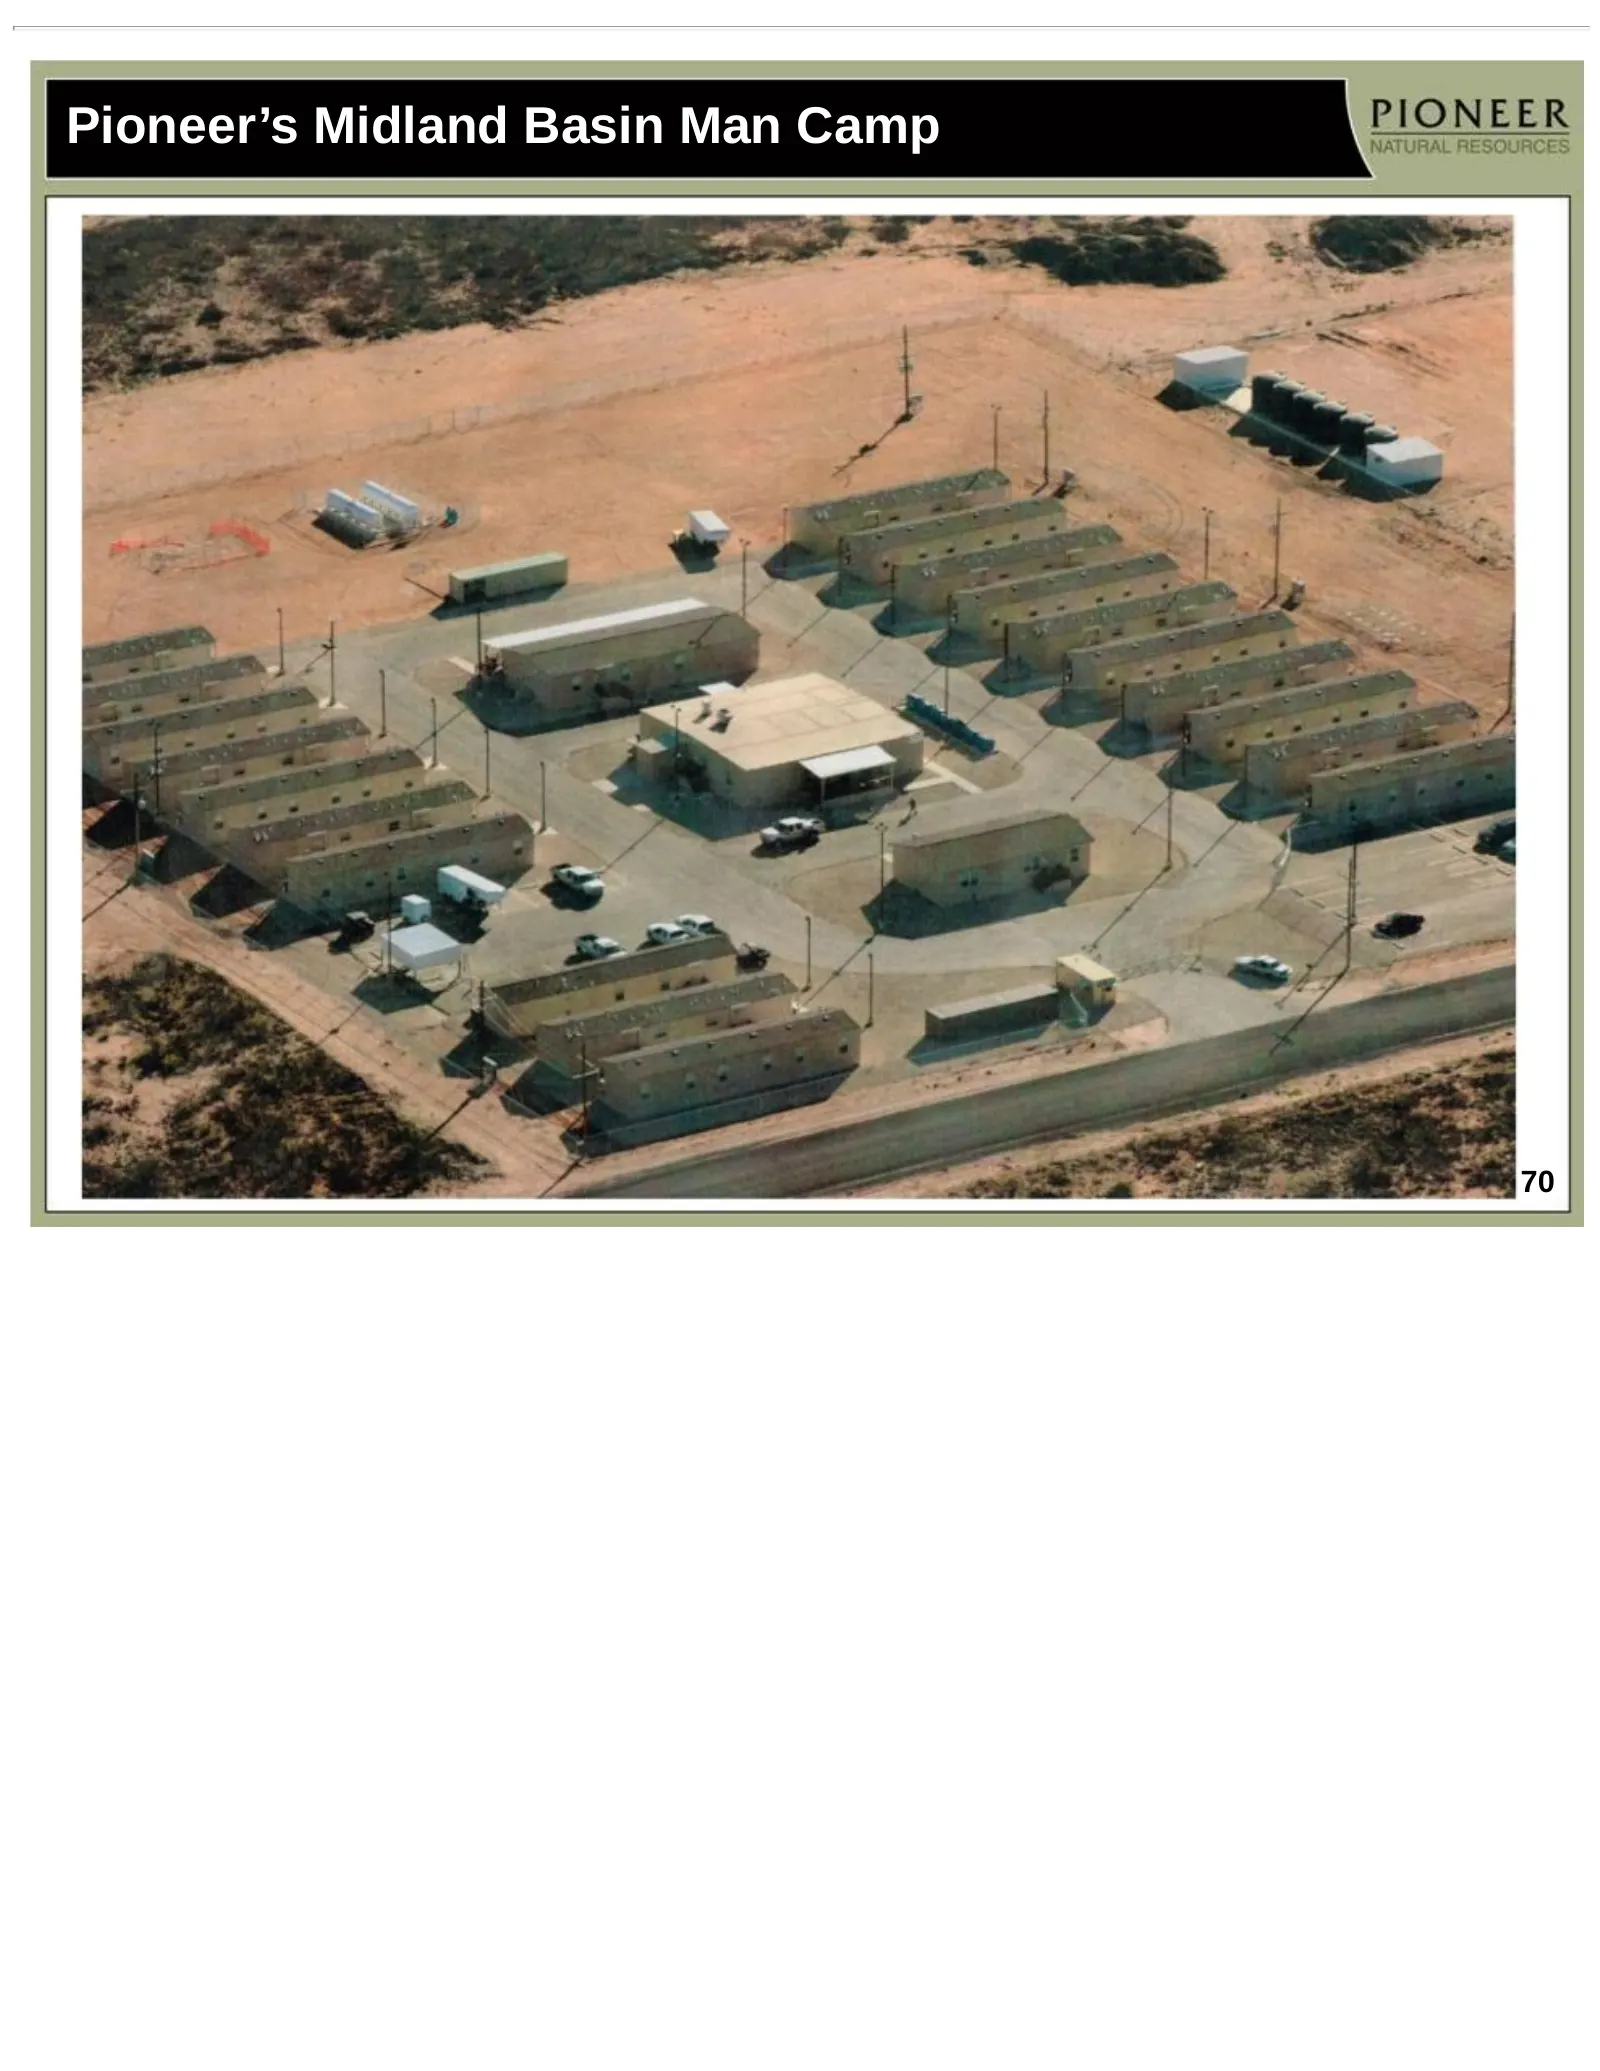
Slide 70: Pioneer's Midland Basin Man Camp
Pioneer’s Midland Basin Man Camp 70
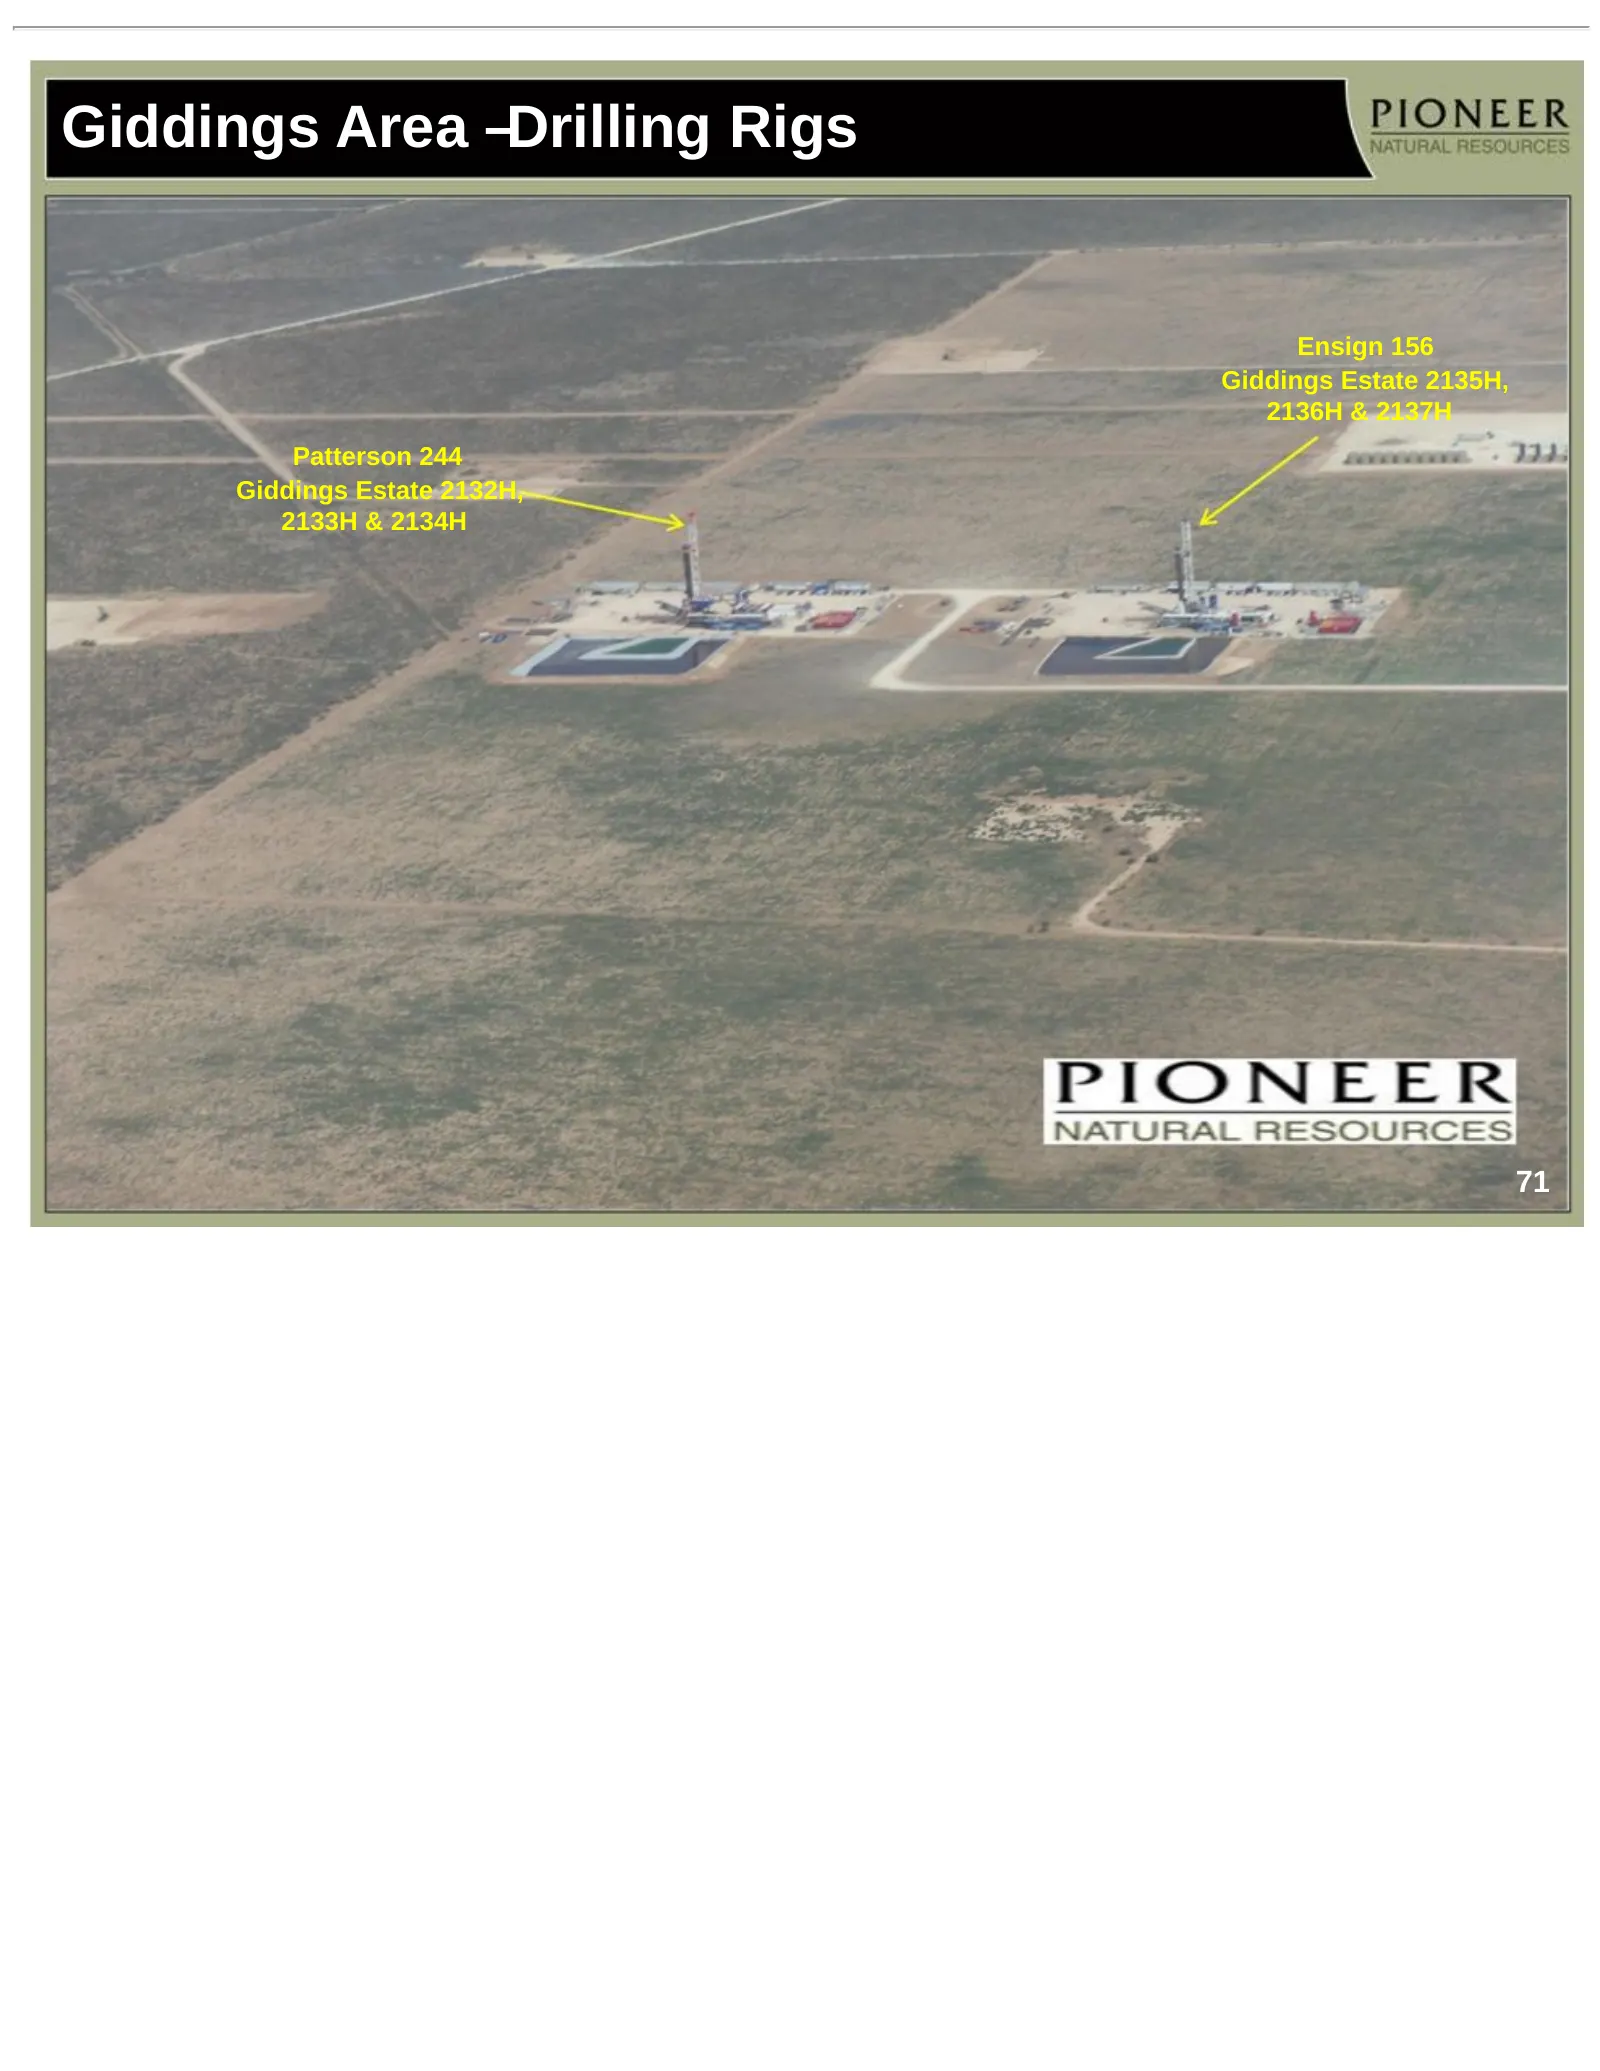
Slide 71: Giddings Area – Drilling Rigs
Giddings Area –Drilling Rigs Ensign 156 Giddings Estate 2135H, 2136H & 2137H Patterson 244 Giddings Estate 2132H, 2133H & 2134H 71
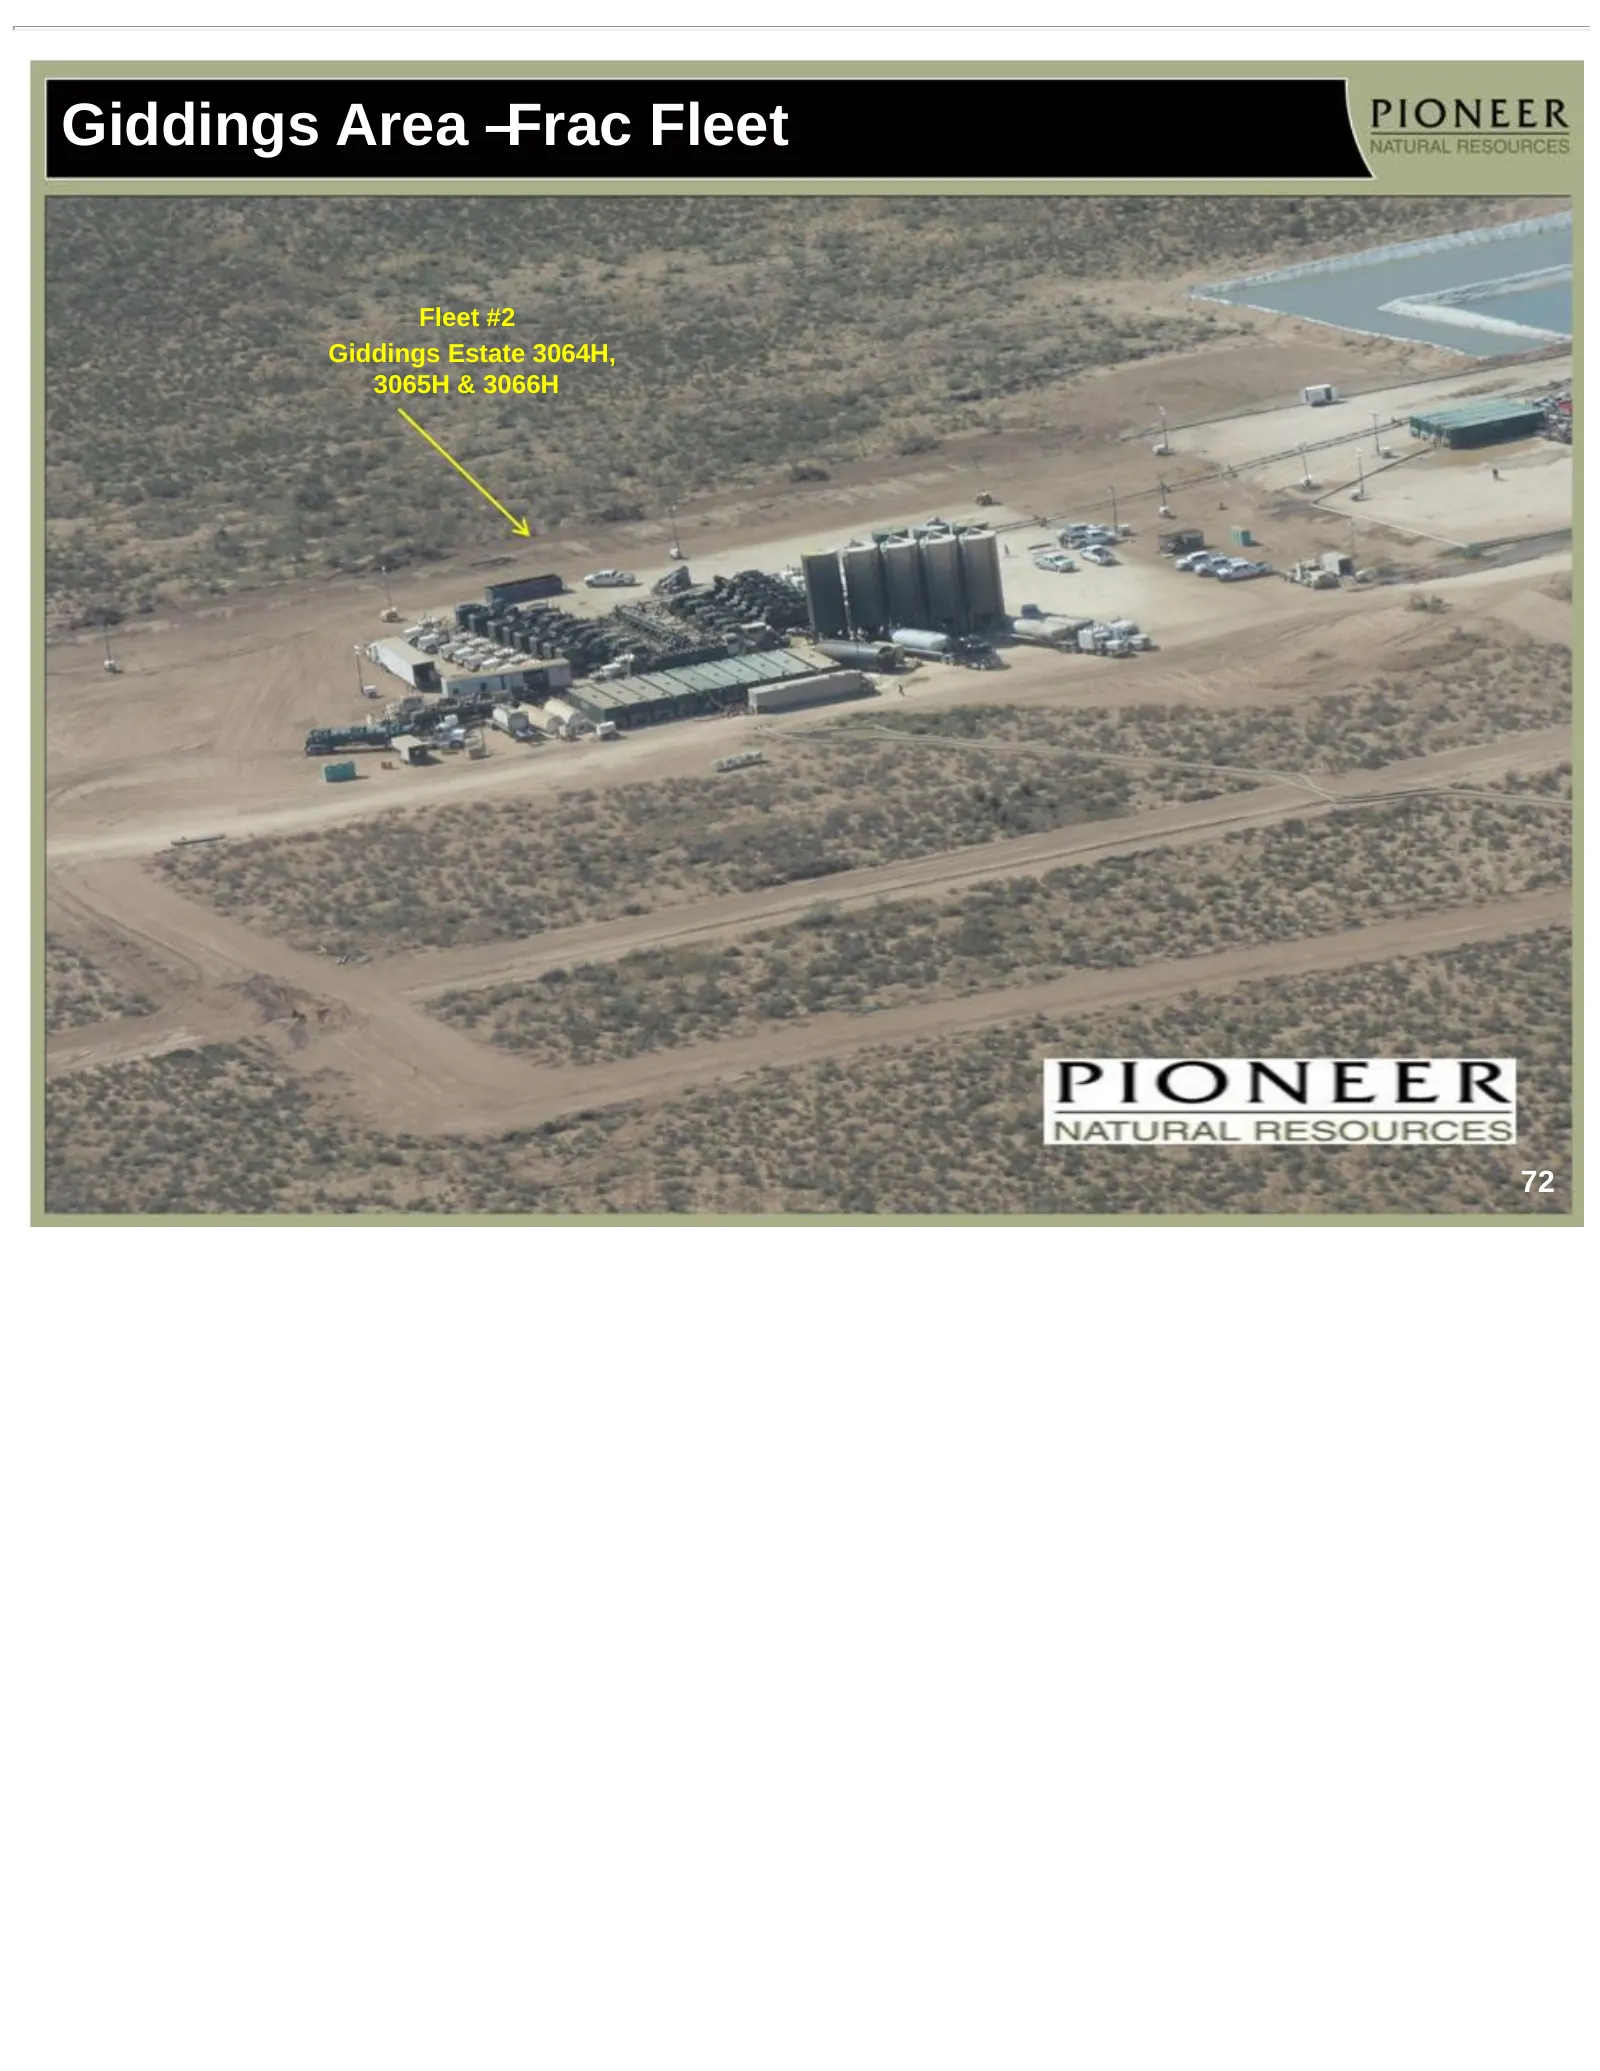
Slide 72: Giddings Area – Frac Fleet
Giddings Area –Frac Fleet Fleet #2 Giddings Estate 3064H, 3065H & 3066H 72
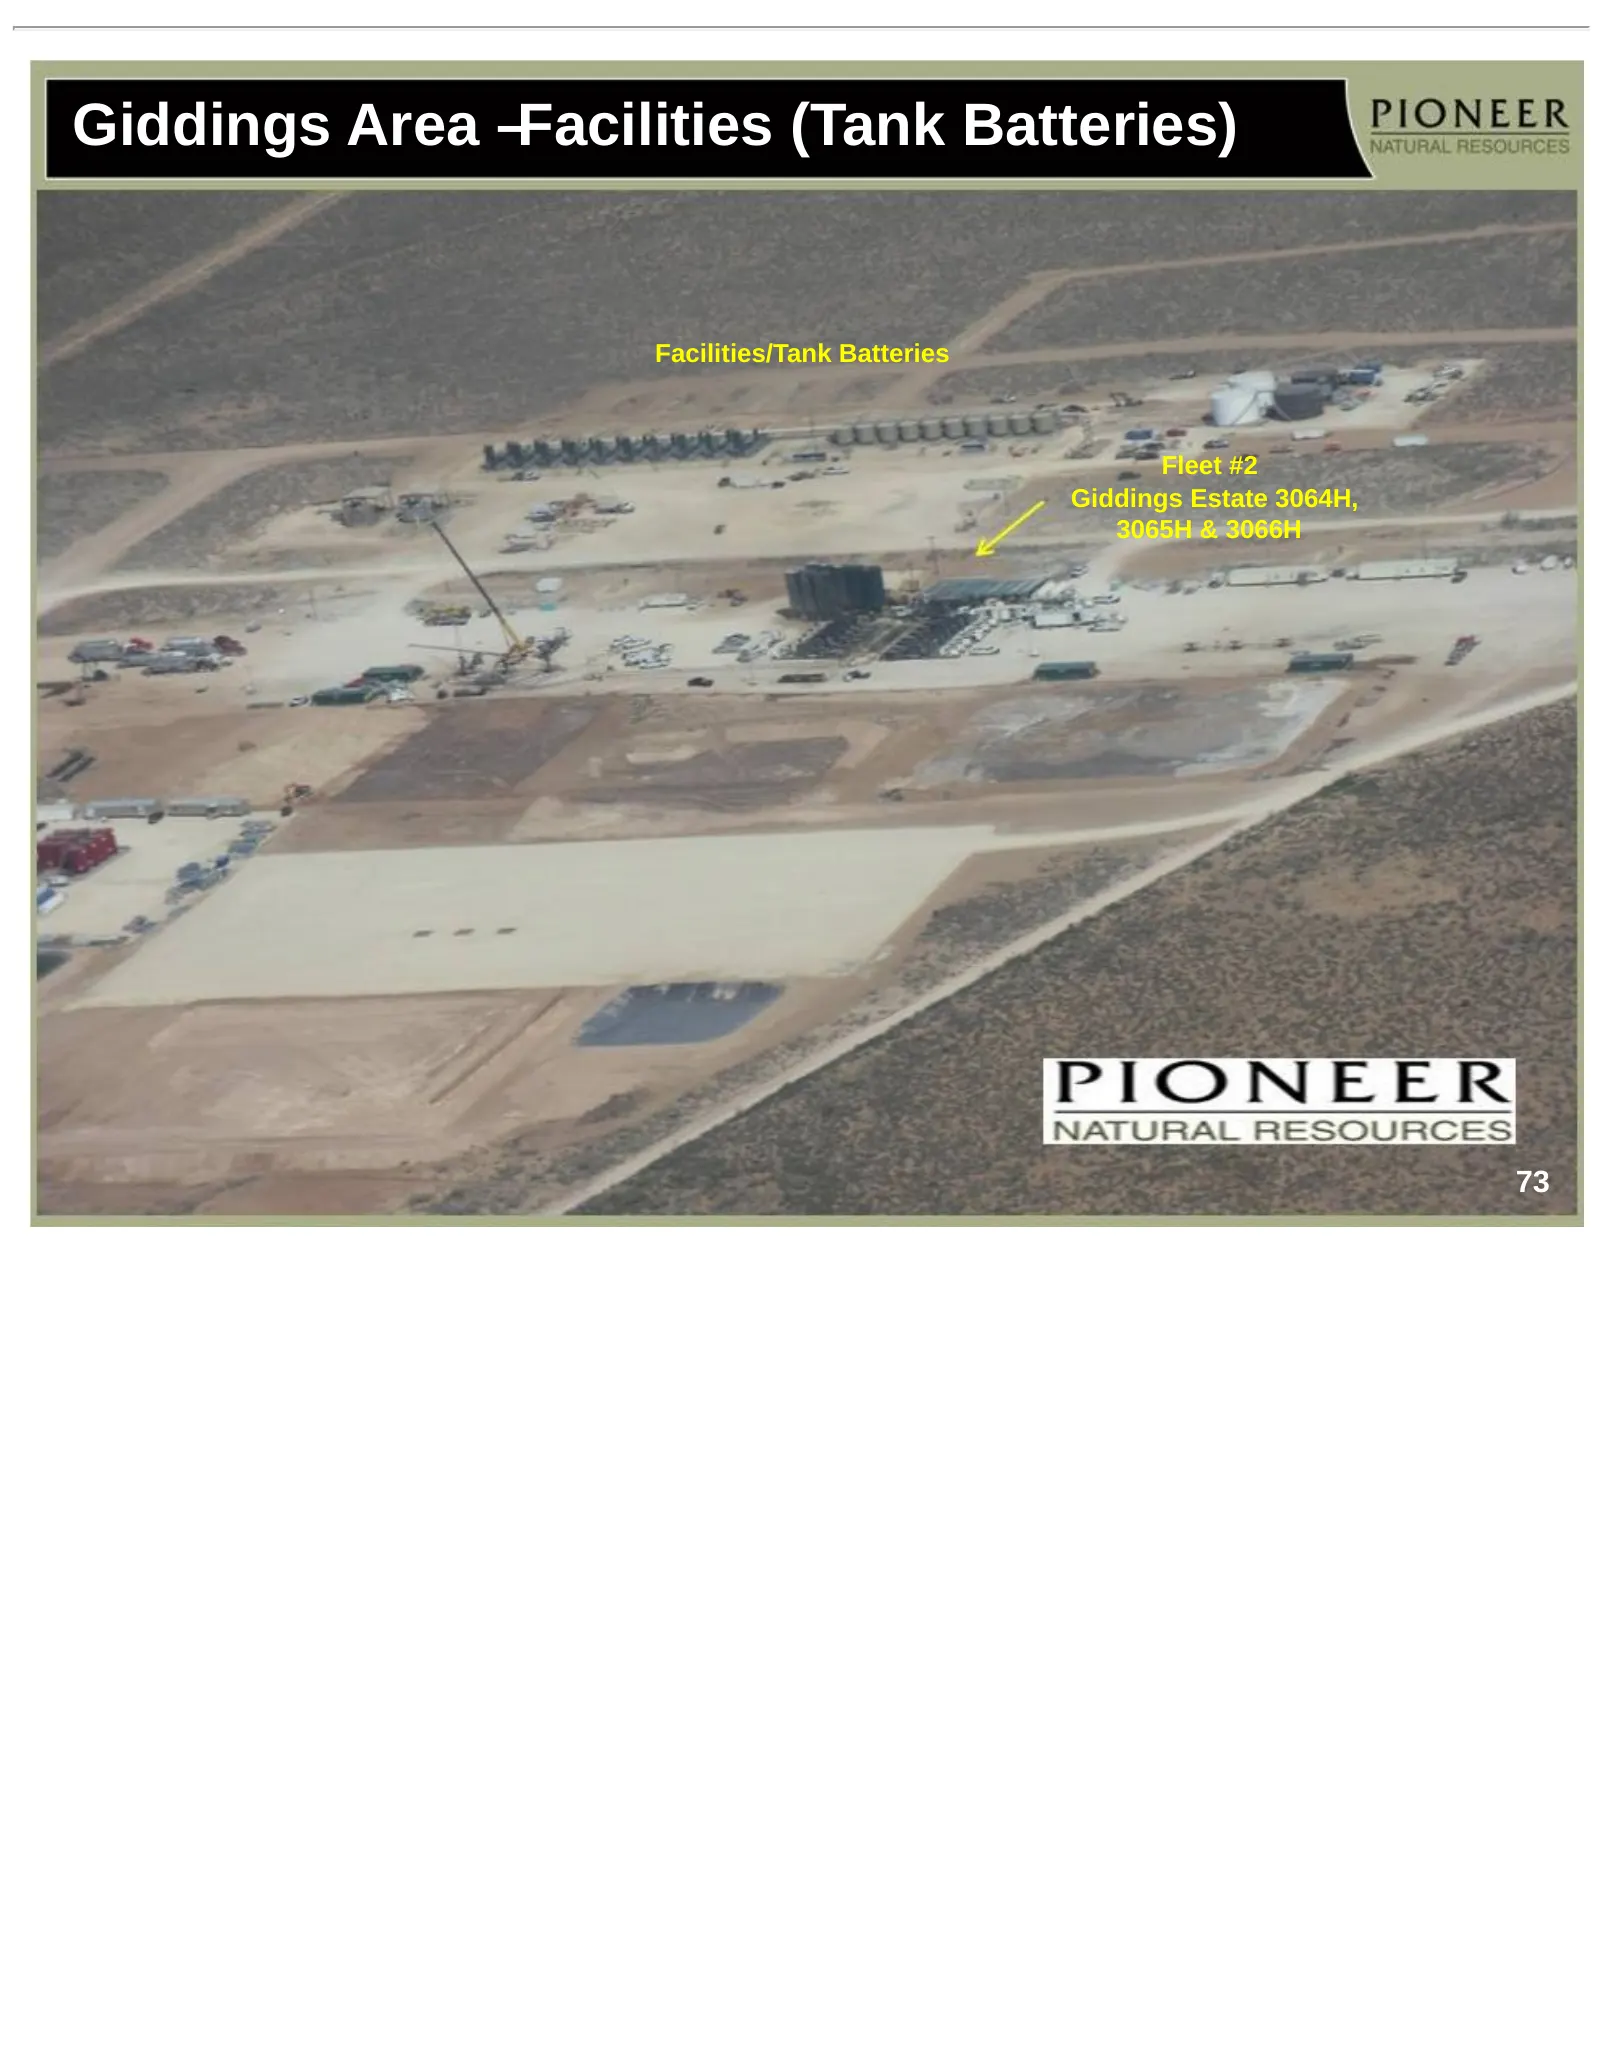
Slide 73: Giddings Area – Facilities (Tank Batteries)
Giddings Area –Facilities (Tank Batteries) Facilities/Tank Batteries Fleet #2 Giddings Estate 3064H, 3065H & 3066H 73
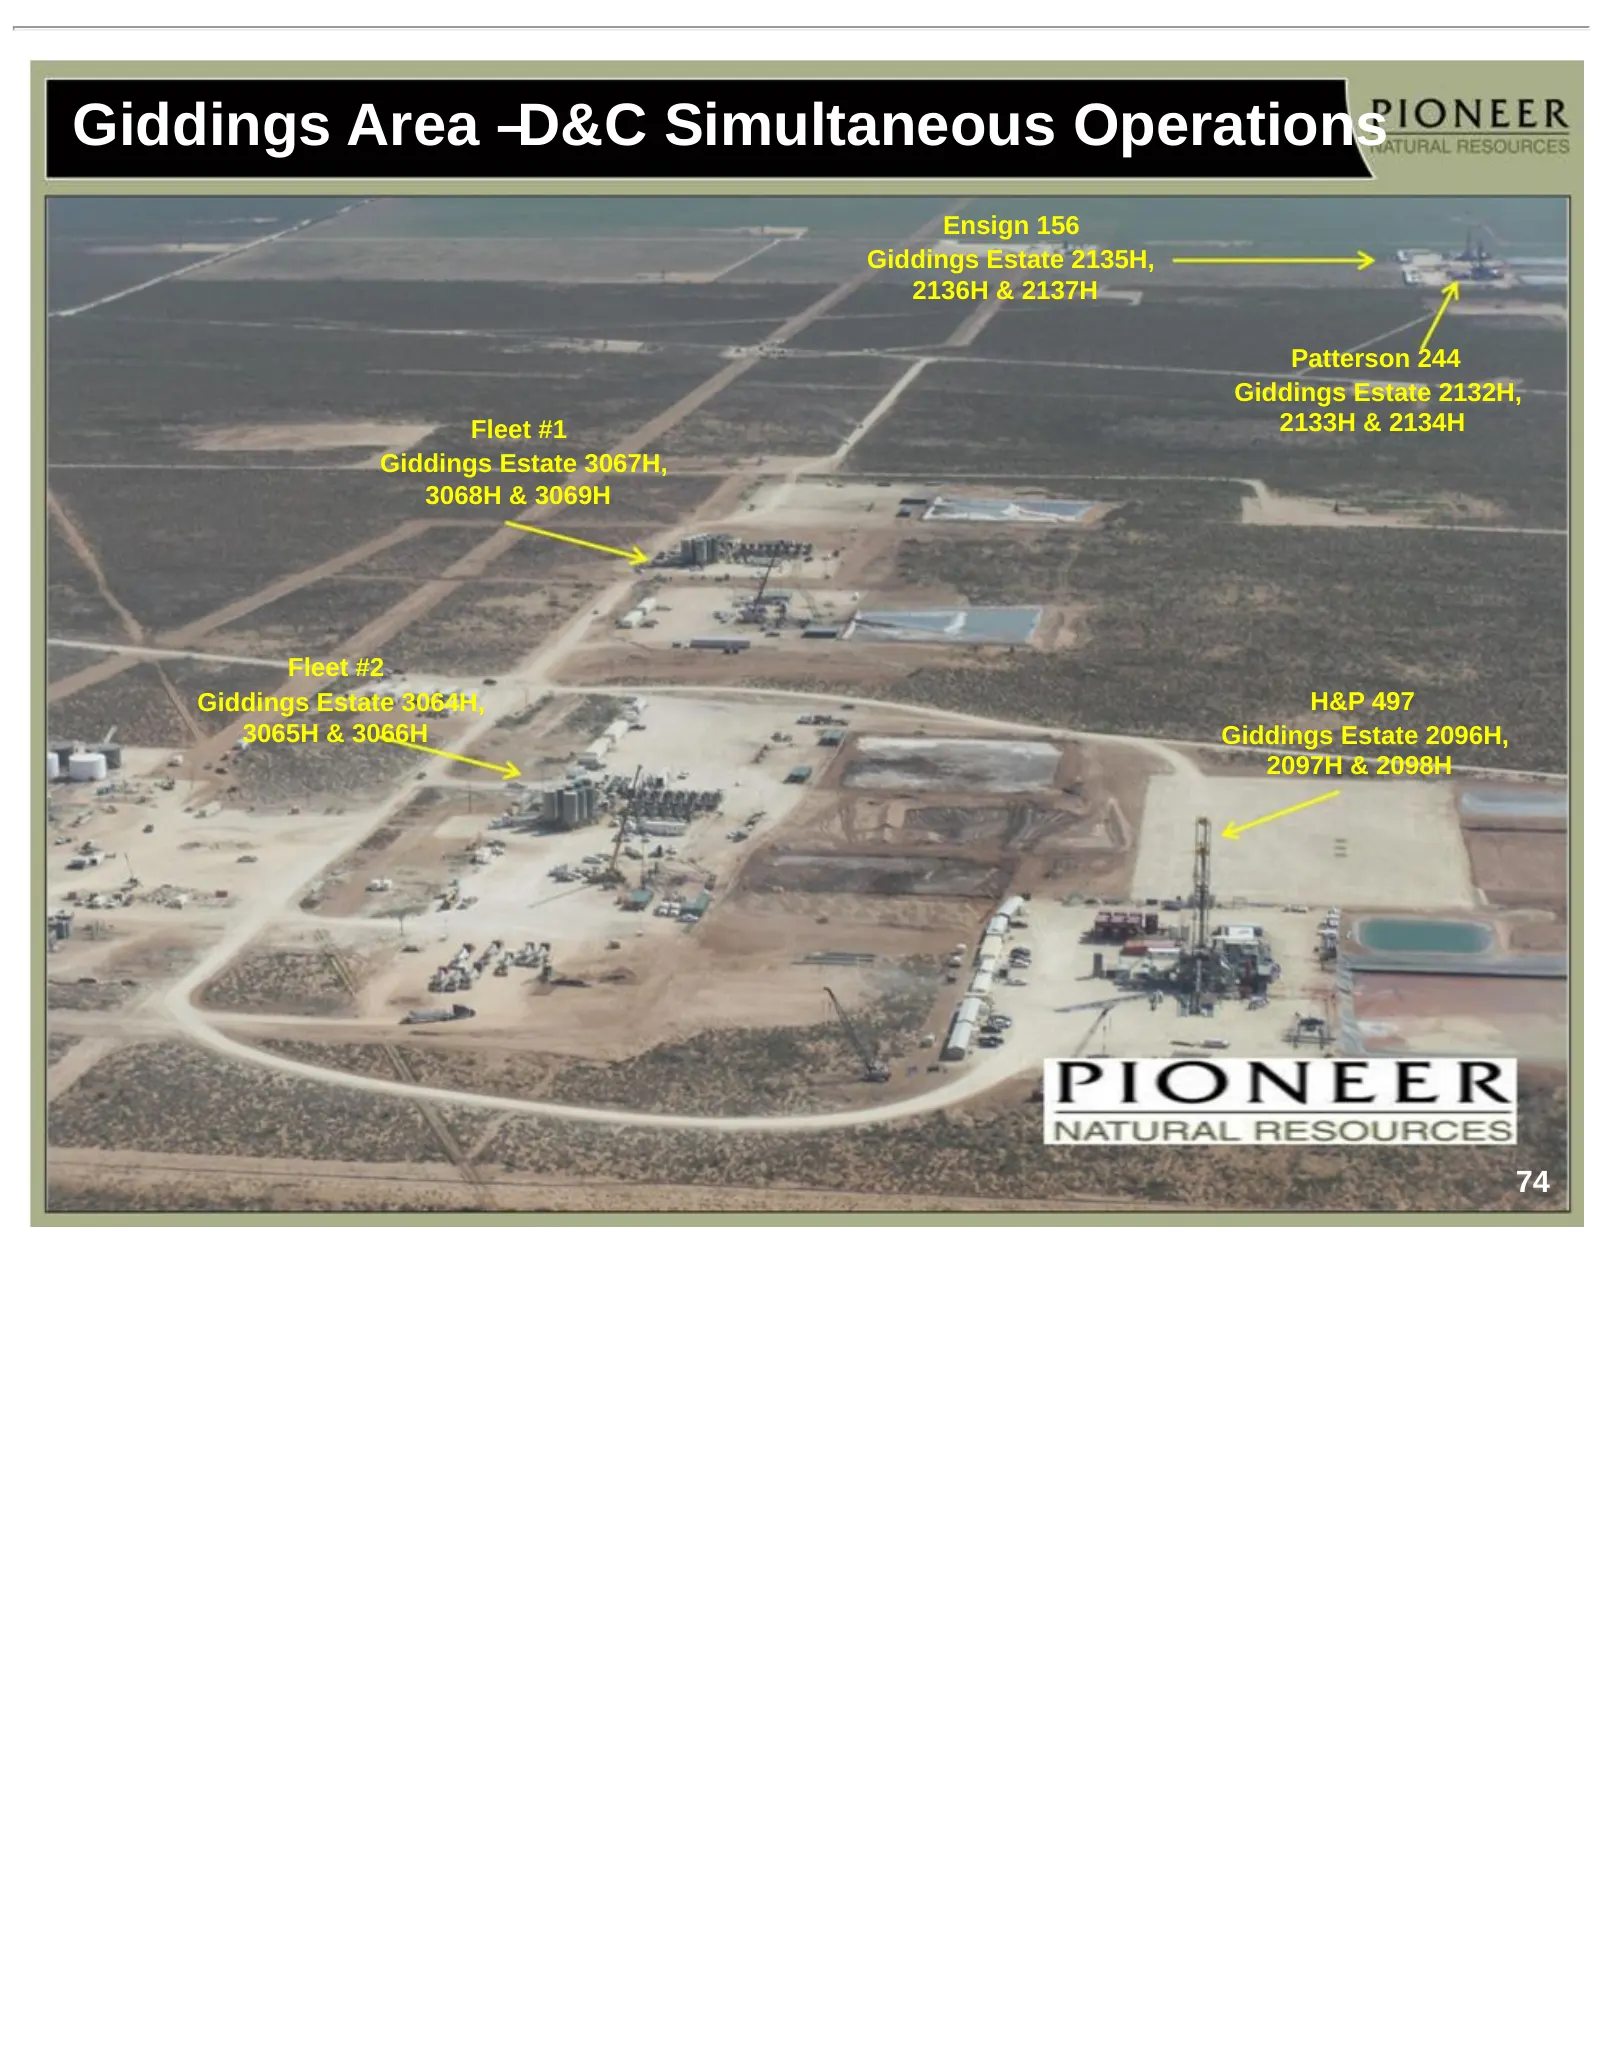
Slide 74: Giddings Area – D&C Simultaneous Operations
Giddings Area –D&C Simultaneous Operations Ensign 156 Giddings Estate 2135H, 2136H & 2137H Patterson 244 Giddings Estate 2132H, Fleet #1 2133H & 2134H Giddings Estate 3067H, 3068H & 3069H Fleet #2 Giddings Estate 3064H, H&P 497 3065H & 3066H Giddings Estate 2096H, 2097H & 2098H 74
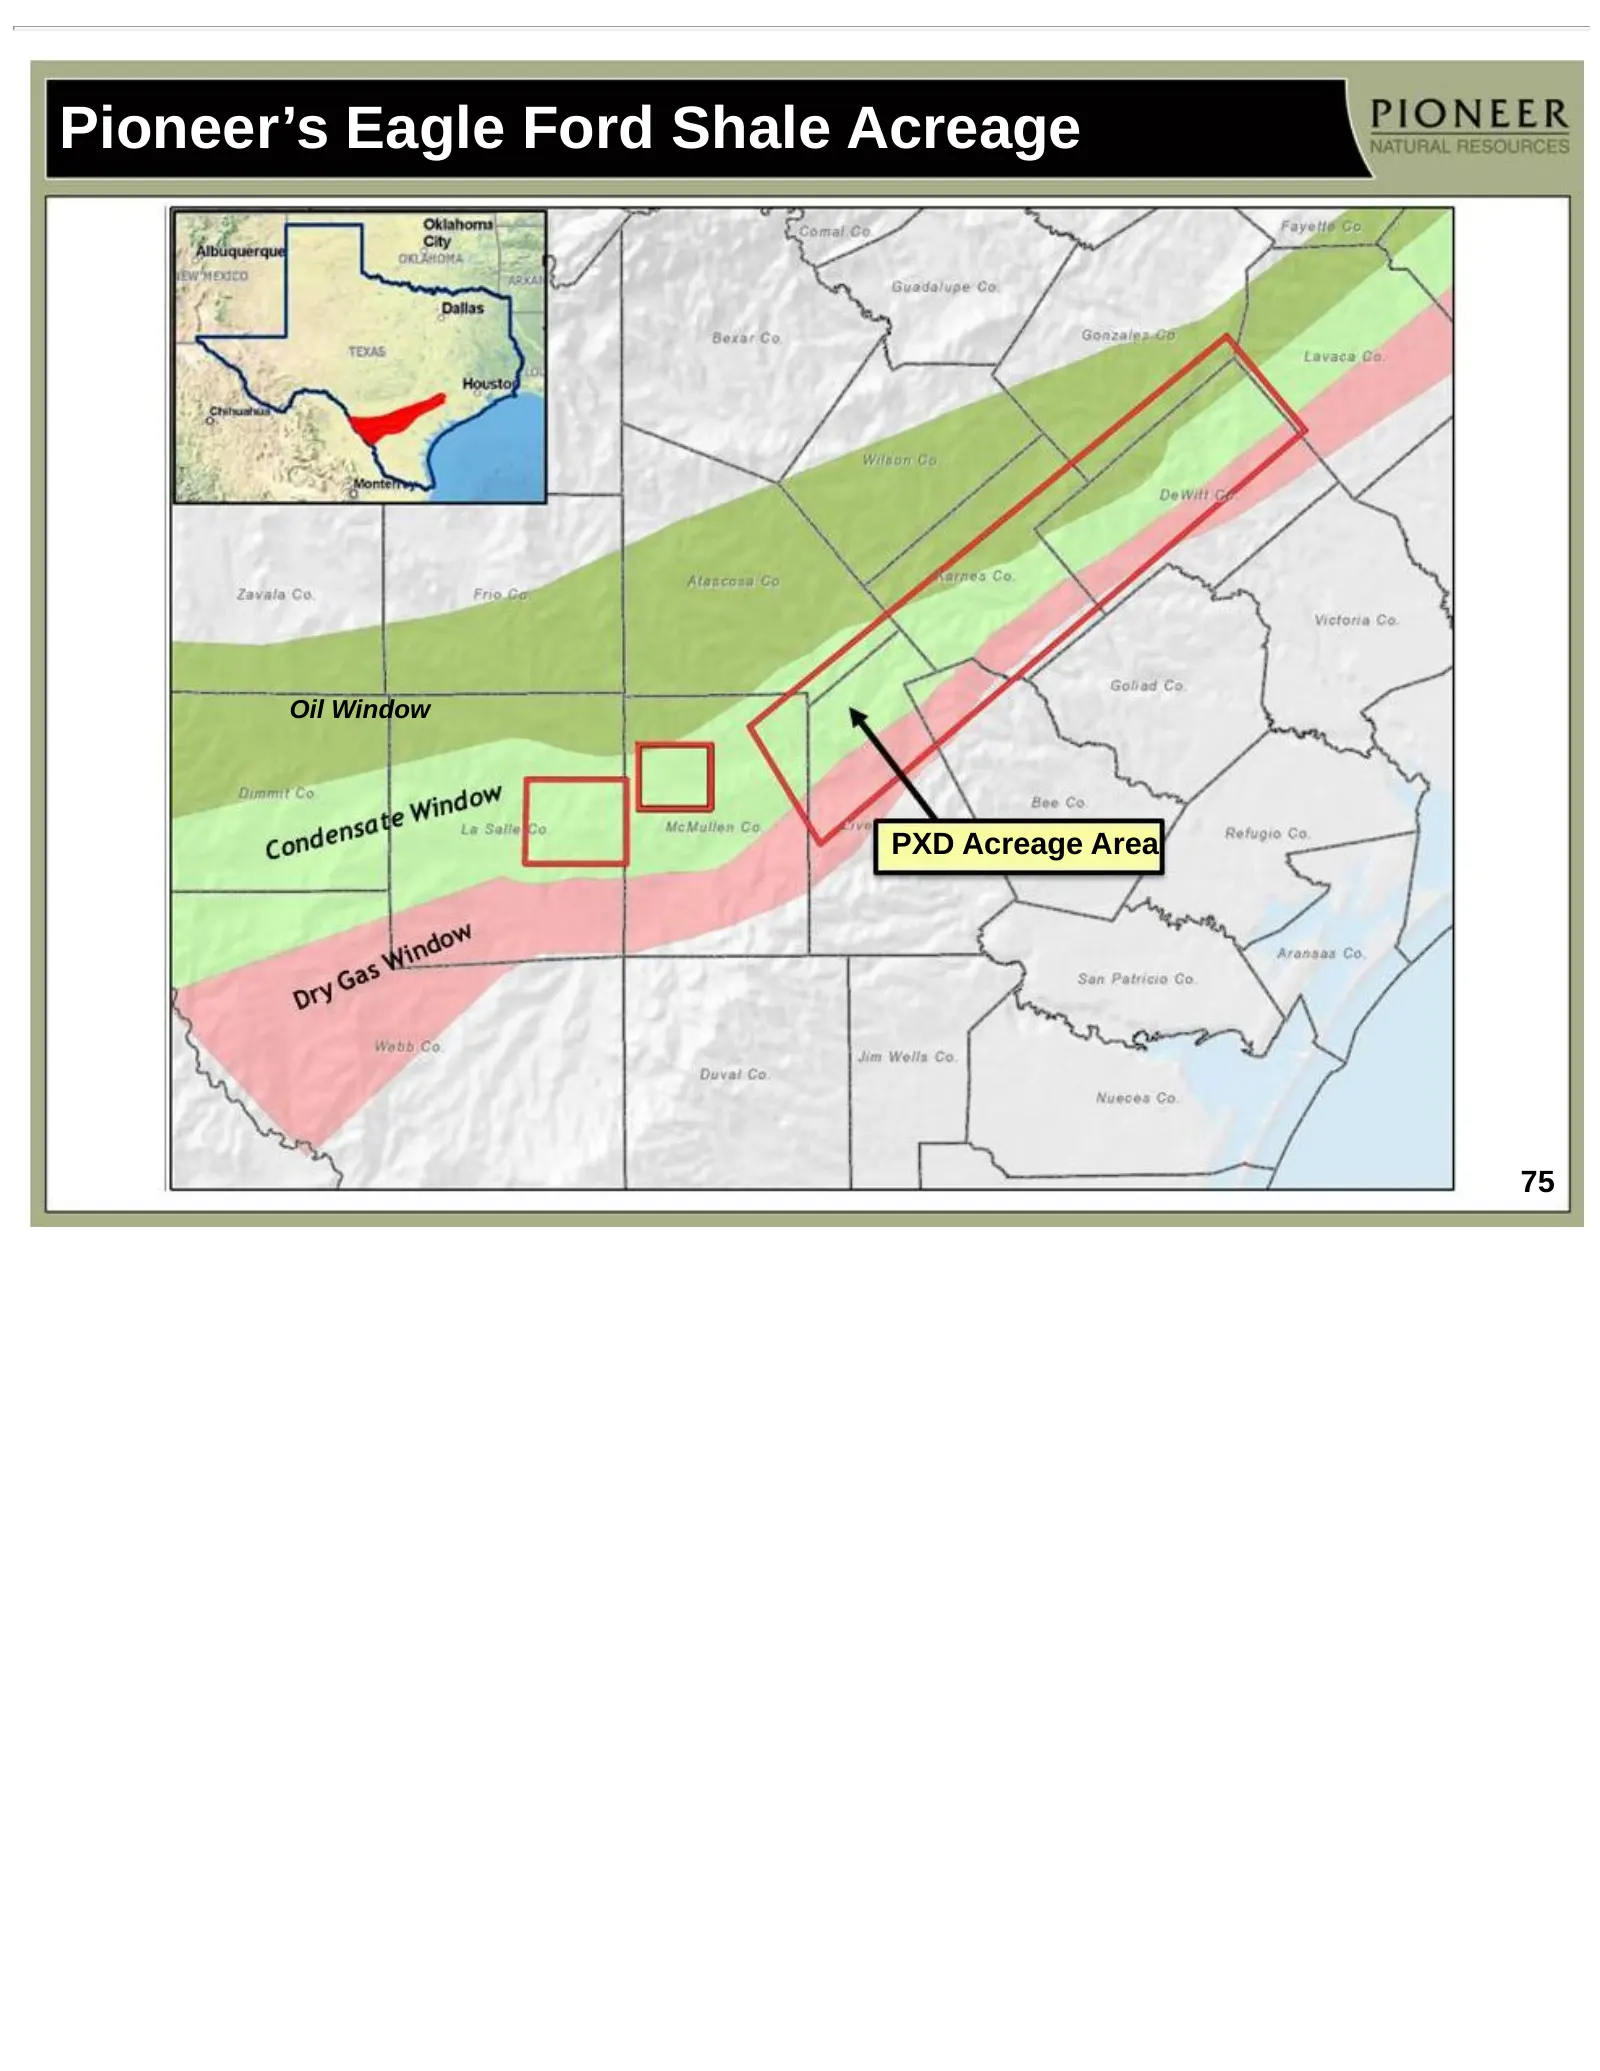
Slide 75: Pioneer's Eagle Ford Shale Acreage
Pioneer’s Eagle Ford Shale Acreage Oil Window PXD Acreage Area 75
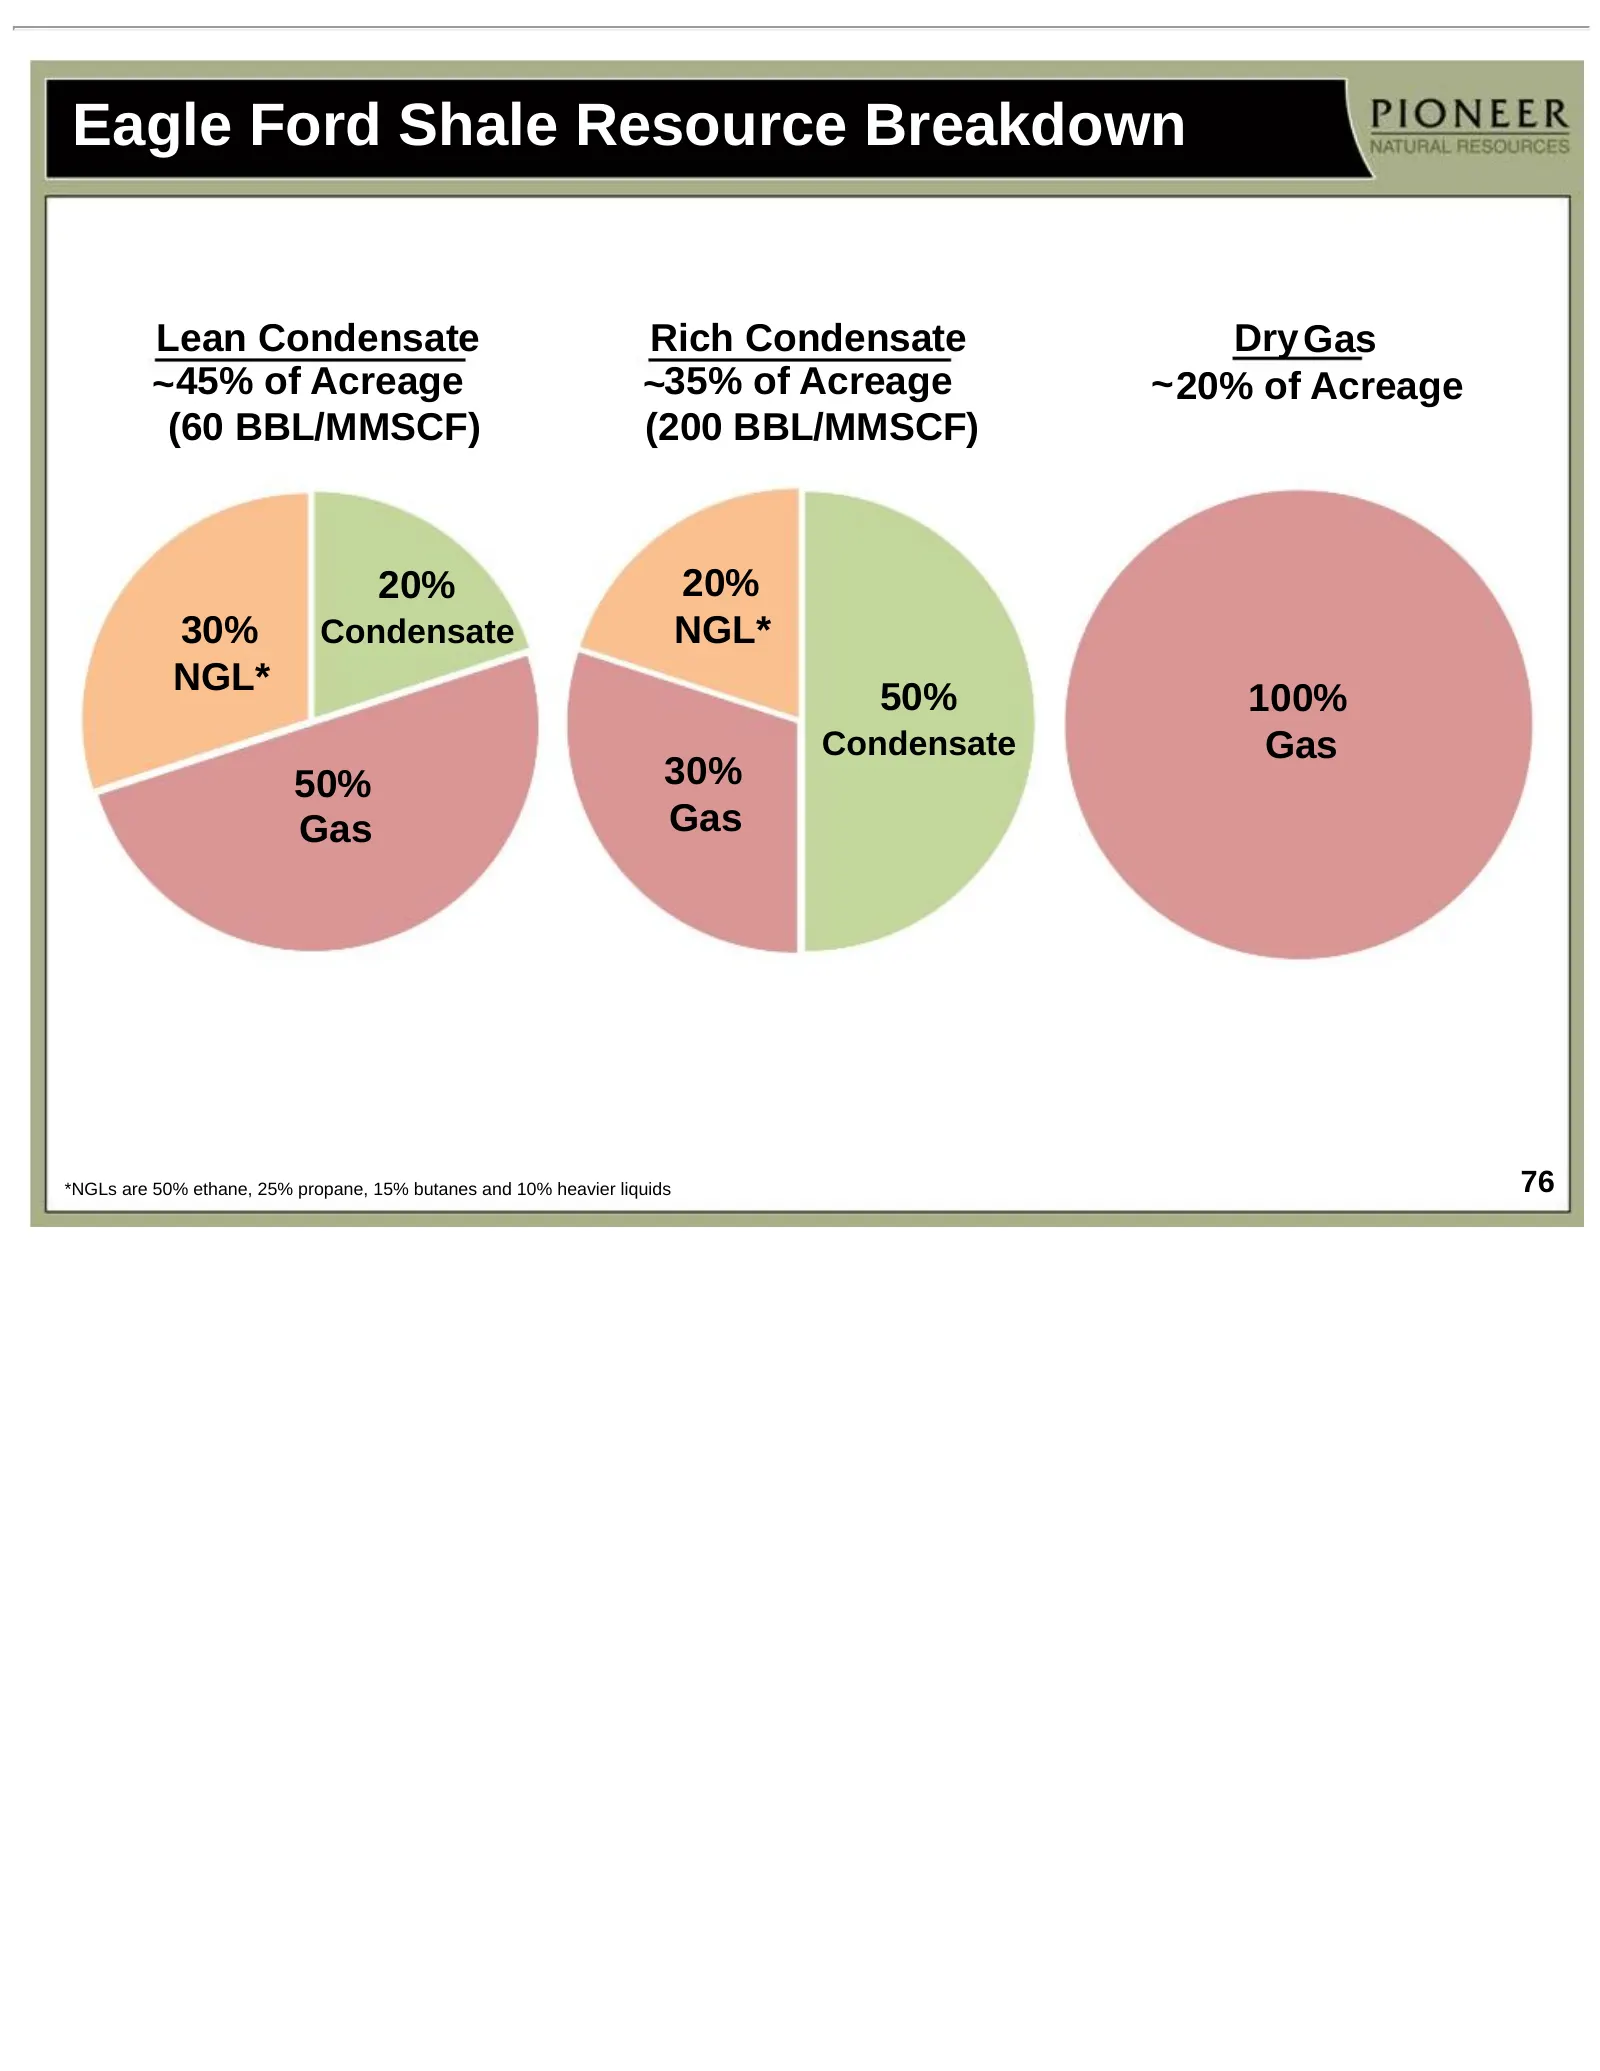
Slide 76: Eagle Ford Shale Resource Breakdown
Eagle Ford Shale Resource Breakdown Lean Condensate Rich Condensate Dry Gas ~ 45% of Acreage ~35% of Acreage ~ 20% of Acreage (60 BBL/MMSCF) (200 BBL/MMSCF) 20% 20% 30% Condensate NGL* NGL* 50% 100% Condensate Gas 50% 30% Gas Gas *NGLs are 50% ethane, 25% propane, 15% butanes and 10% heavier liquids
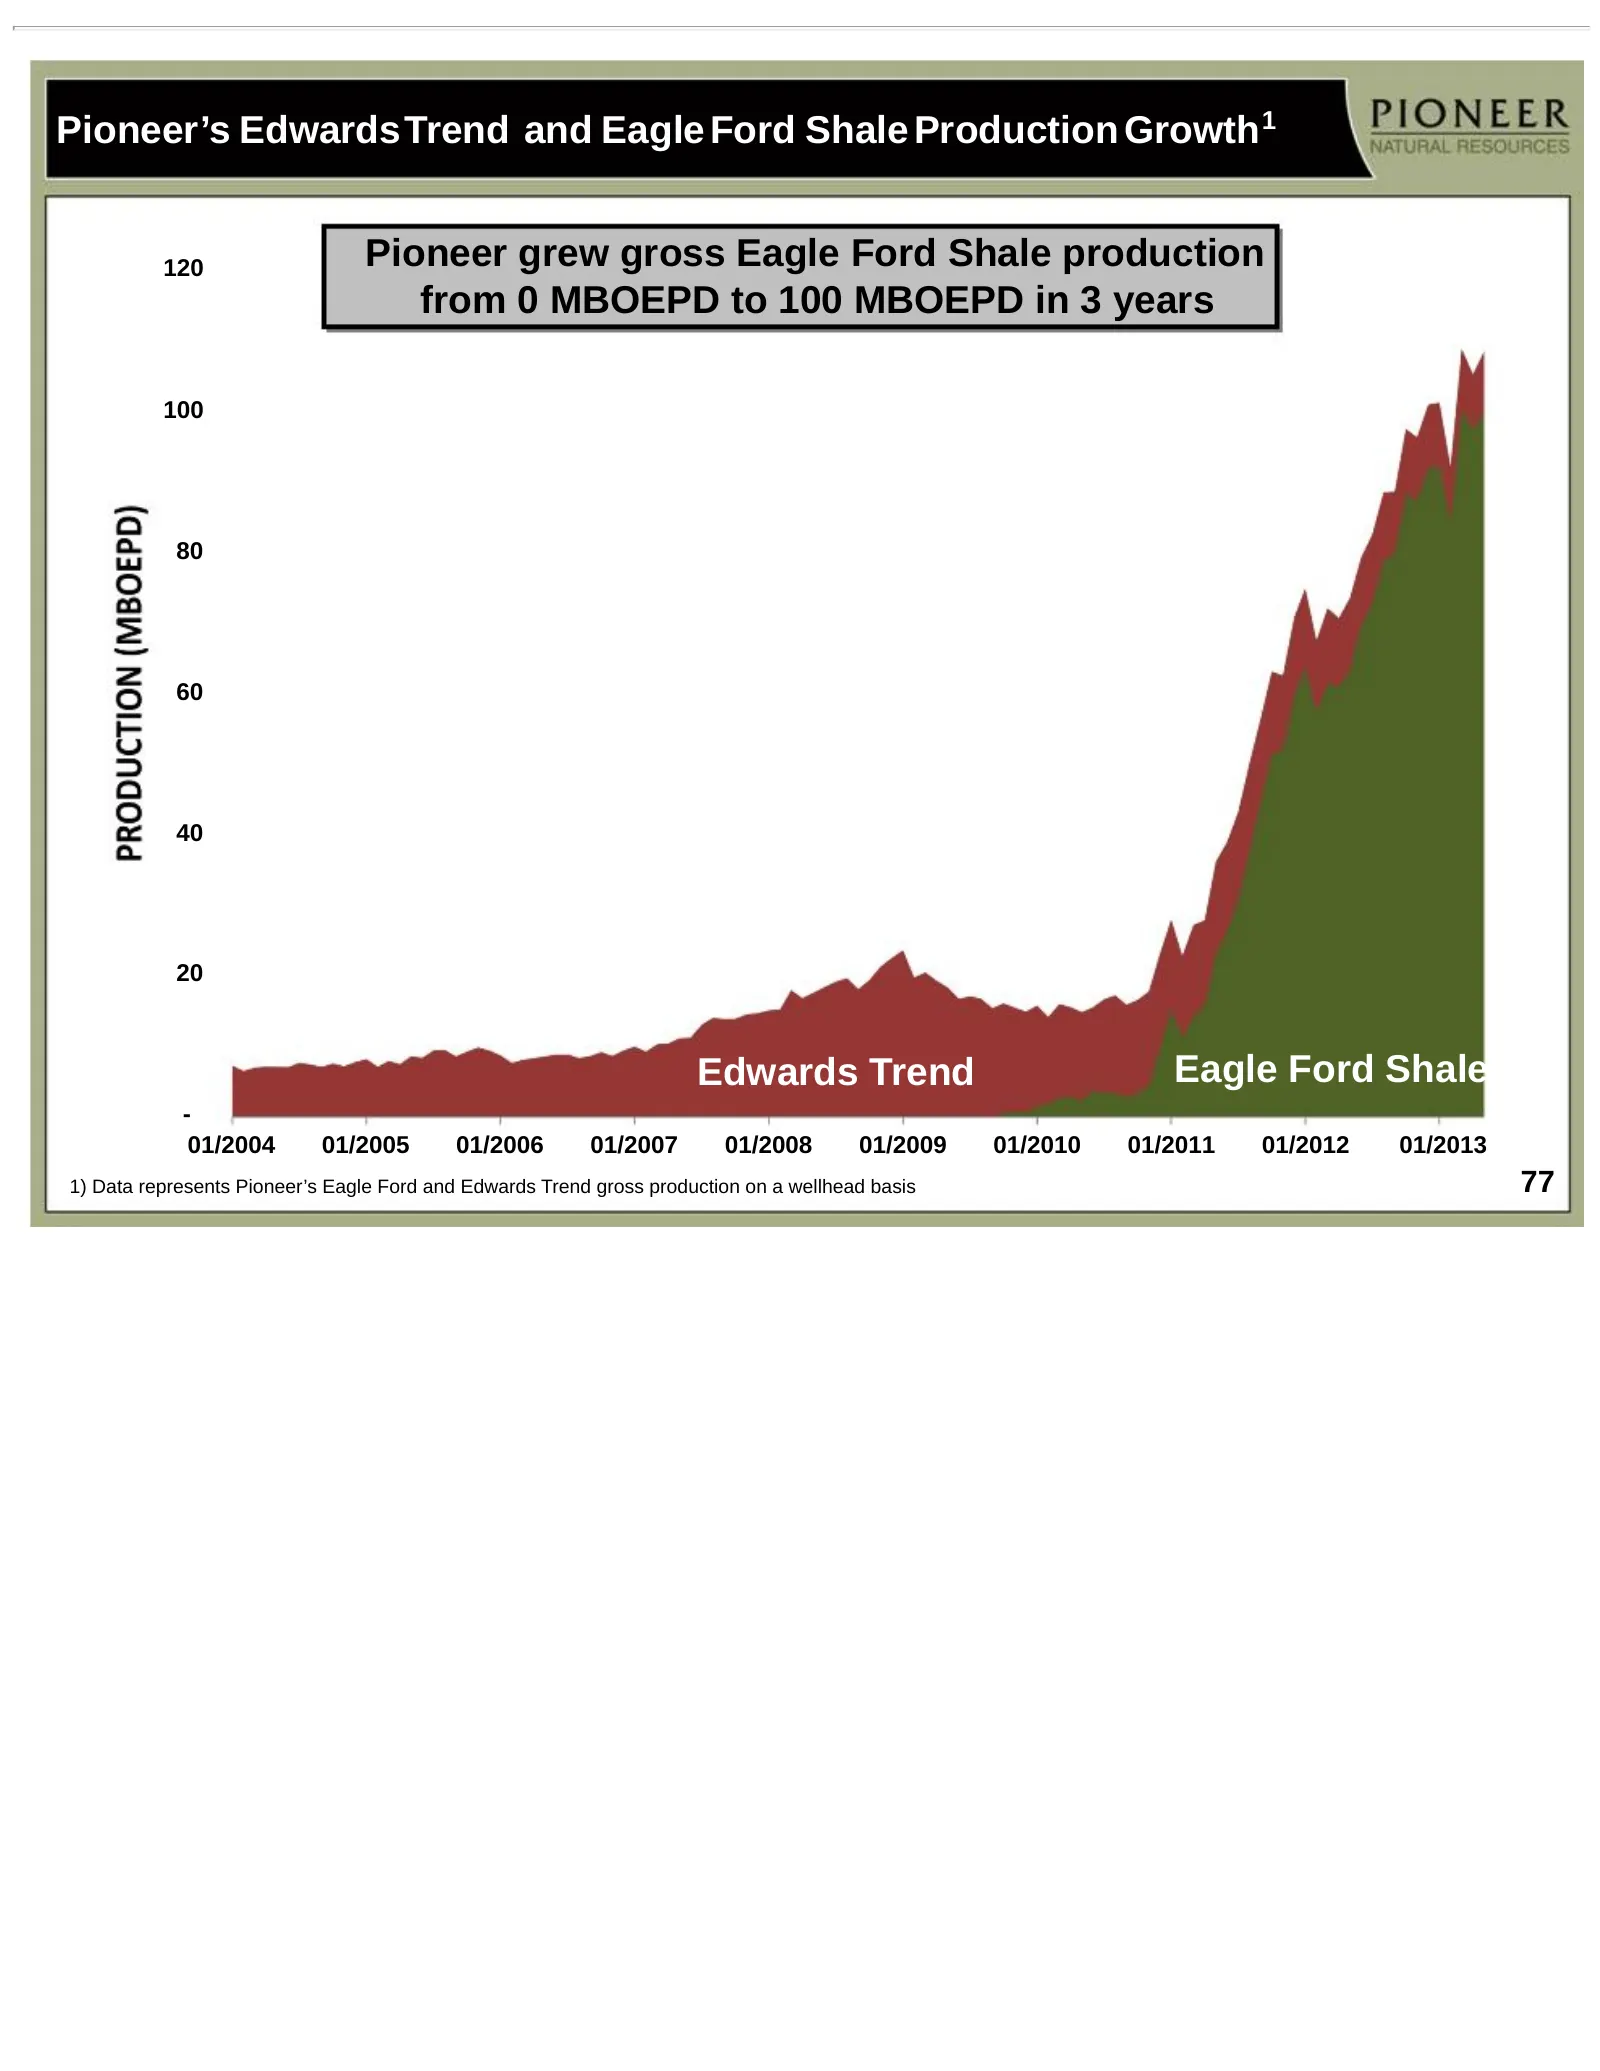
Slide 77: Pioneer's Edwards Trend and Eagle Ford Shale Production Growth
Pioneer’s EdwardsTrend and Eagle Ford Shale Production Growth 1 120 Pioneer grew gross Eagle Ford Shale production from 0 MBOEPD to 100 MBOEPD in 3 years 100 80 60 40 20 Edwards Trend Eagle Ford Shale - 01/2004 01/2005 01/2006 01/2007 01/2008 01/2009 01/2010 01/2011 01/2012 01/2013 1) Data represent
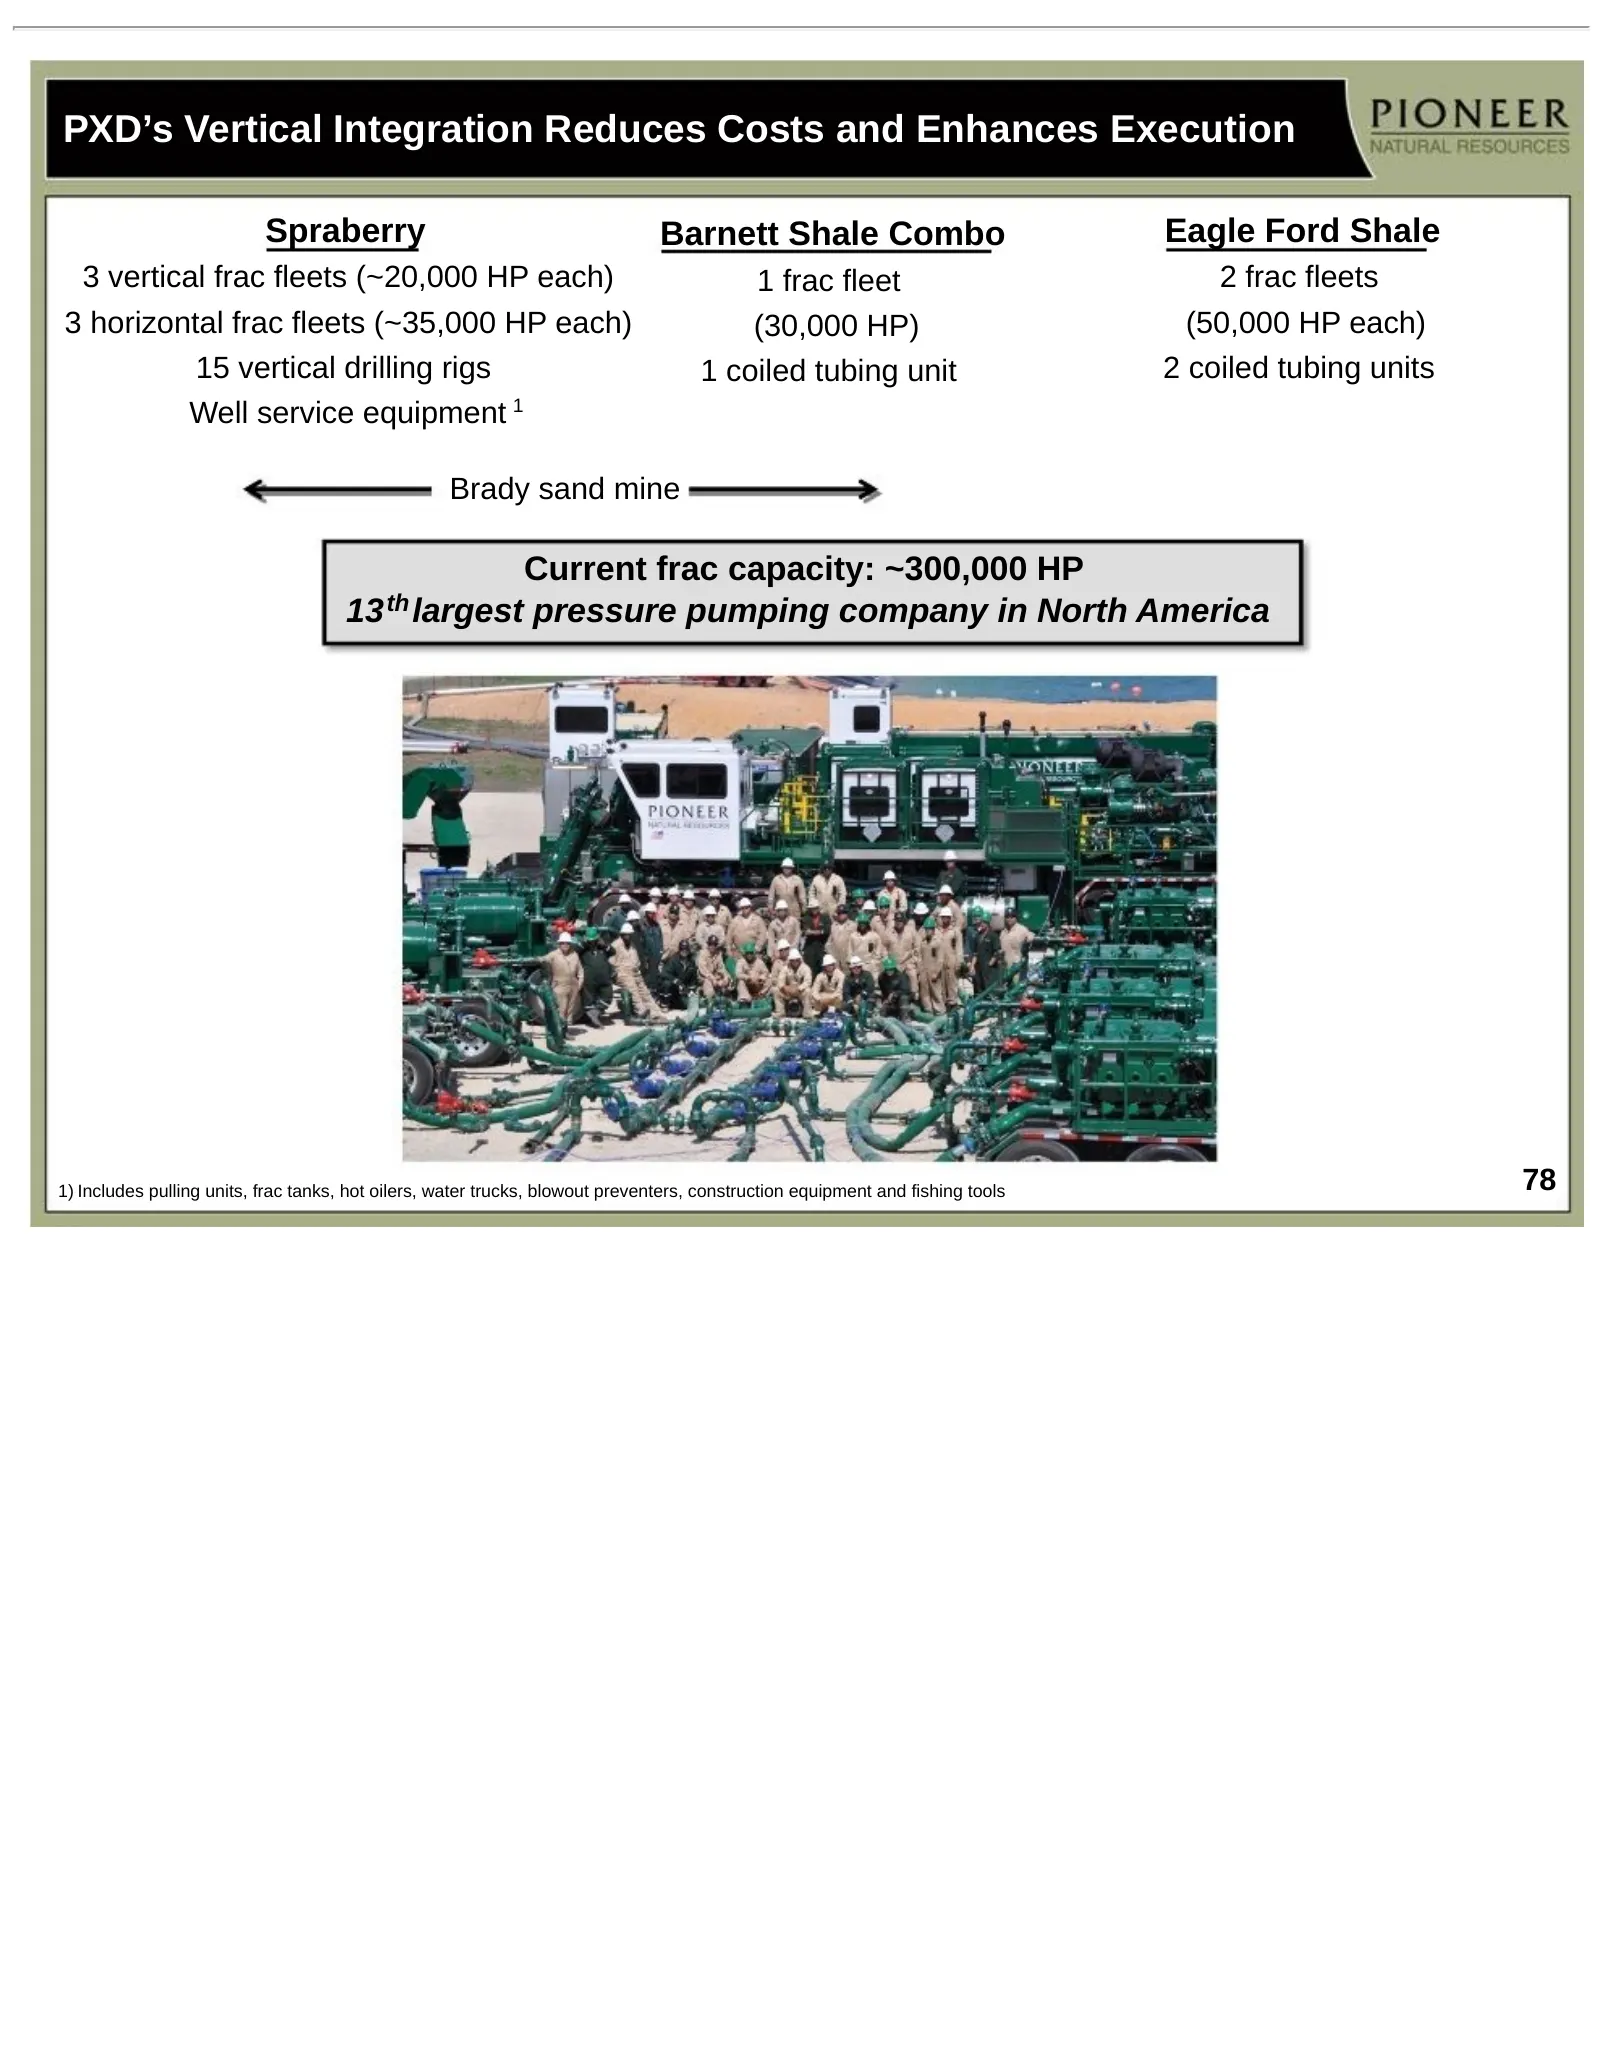
Slide 78: PXD's Vertical Integration Reduces Costs and Enhances Execution
PXD’s Vertical Integration Reduces Costs and Enhances Execution Spraberry Barnett Shale Combo Eagle Ford Shale 3 vertical frac fleets (~20,000 HP each) 1 frac fleet 2 frac fleets 3 horizontal frac fleets (~35,000 HP each) (30,000 HP) (50,000 HP each) 15 vertical drilling rigs 1 coiled tubing unit 2
Slide 79: Reserves Audit, F&D Costs and Reserve Replacement
Reserves Audit, F&D Costs and Reserve Replacement An audit of proved reserves follows the general principles set forth in the standards pertaining to the estimating and auditing of oil and gas reserve information promulgated by the Society of Petroleum Engineers ("SPE"). A reserve audit as defined b
Slide 80: Certain Reserve Information
Certain Reserve Information Cautionary Note to U.S. Investors --The U.S. Securities and Exchange Commission (the "SEC") prohibits oil and gas companies, in their filings with the SEC, from disclosing estimates of oil or gas resources other than “reserves,” as that term is defined by the SEC. In this
Source: SEC EDGAR · 8-K filed Jan 6, 2014
More decks from Pioneer Natural Resources Co
 Merger or Acquisition (October 2023)15 slides · Oct 11, 2023
 Q3 2020 Earnings Presentation30 slides · Nov 4, 2020
 Merger or Acquisition (October 2020)18 slides · Oct 20, 2020
 IPAA Oil & Gas Investment Symposium 201846 slides · Apr 9, 2018
 Q4 2012 Earnings Presentation48 slides · Feb 13, 2013
 Investor Presentation (January 2013)54 slides · Jan 7, 2013