Valeant Pharmaceuticals International Inc
Valeant Pharmaceuticals International — CIBC World Markets Annual Biotechnology and Specialty Pharmaceuticals Conference 2006
50 slides from Valeant Pharmaceuticals International's conference presentation, Apr 5, 2006
Slide 1: CIBC World Markets Annual Biotechnology and Specialty Pharmaceuticals Conference
CIBC World Markets Annual Biotechnology and Specialty Pharmaceuticals Conference April 5, 2006
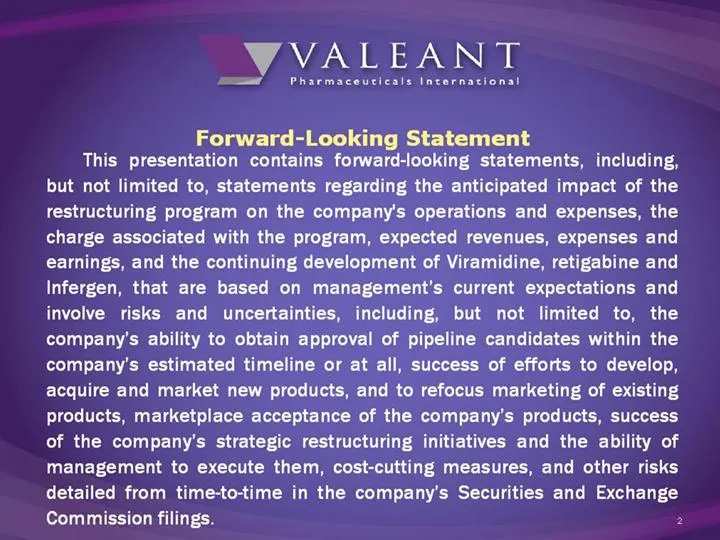
Slide 2: Forward-Looking Statement
VALEANT Pharmaceuticals International Forward: cing tatement This presentation co! joking statements, including, but not limited to, statements regarding the anticipated impact of the restructuring program on the : company's operations and expenses, the charge associated with the program, ex nected
Slide 3: Announces Restructuring
Announces Restructuring
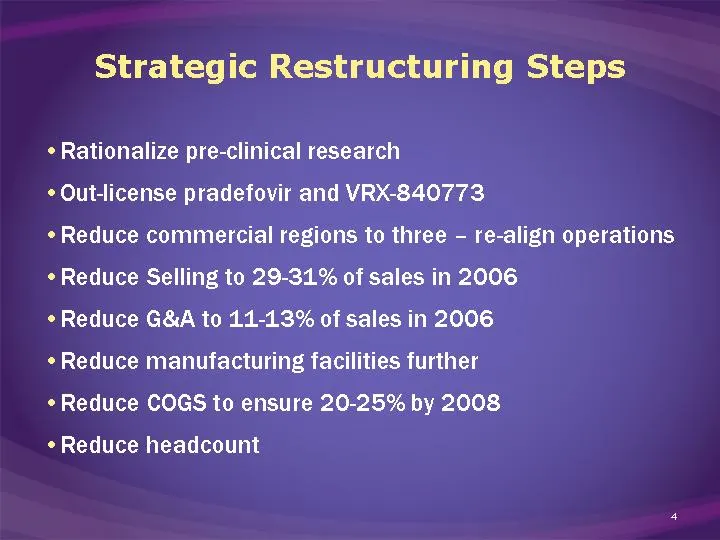
Slide 4: Strategic Restructuring Steps
Rationalize pre-clinical research Out-license pradefovir and VRX-840773 Reduce commercial regions to three - re-align operations Reduce Selling to 29-31% of sales in 2006 Reduce G&A to 11-13% of sales in 2006 Reduce manufacturing facilities further Reduce COGS to ensure 20-25% by 2008 Reduce headcou
Slide 5: Strategic Restructuring Benefits
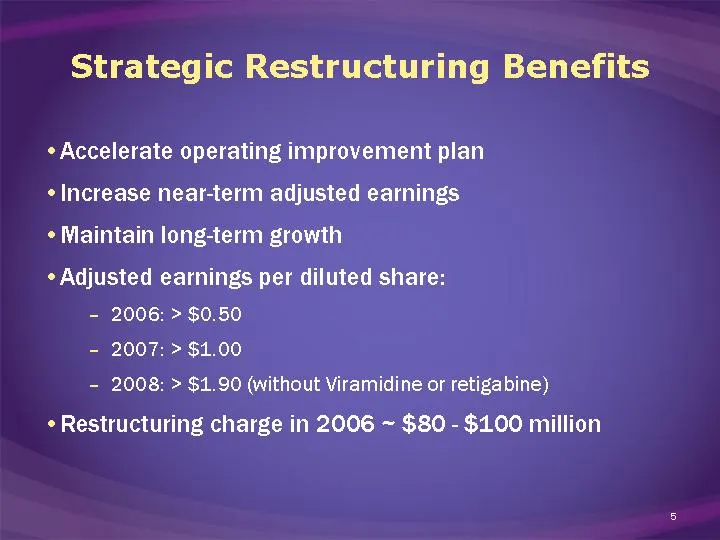
Accelerate operating improvement plan Increase near-term adjusted earnings Maintain long-term growth Adjusted earnings per diluted share: 2006: > $0.50 2007: > $1.00 2008: > $1.90 (without Viramidine or retigabine) Restructuring charge in 2006 ~ $80 - $100 million Strategic Restructuring Benefits
Slide 6: A unique, global, science-based specialty pharmaceutical company
(NYSE:VRX) in the areas of neurology, infectious disease and dermatology A unique, GLOBAL, science-based, specialty pharmaceutical company that develops, manufactures and markets pharmaceutical products
Slide 7: Company Profile
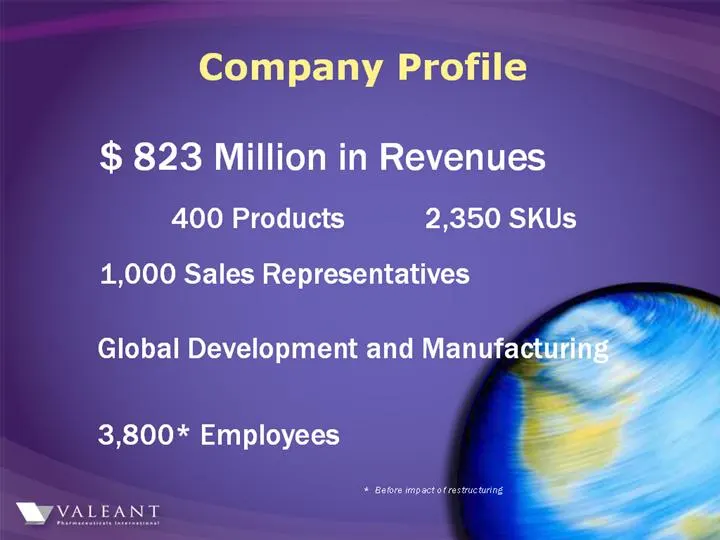
Company Profile $ 823 Million in Revenues 400 Products 2,350 SKUs 1,000 Sales Representatives Global Development ai 3,800* Employees Wy VALEANT
Slide 8: Strategic Focus
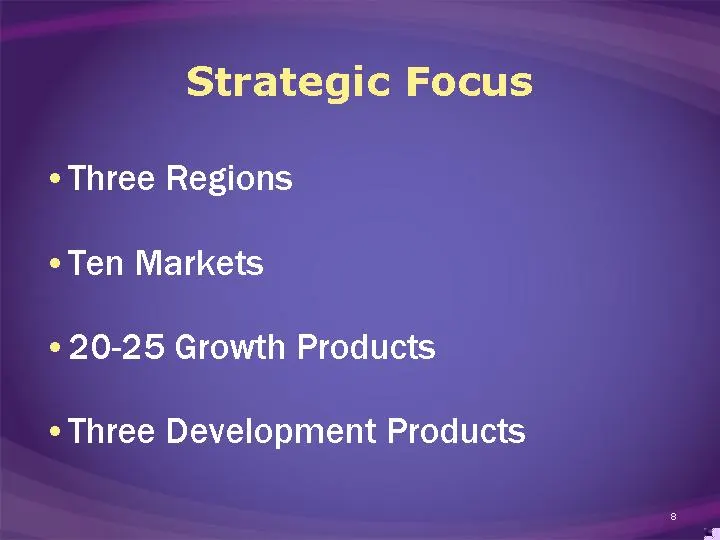
Three Regions Ten Markets 20-25 Growth Products Three Development Products Strategic Focus
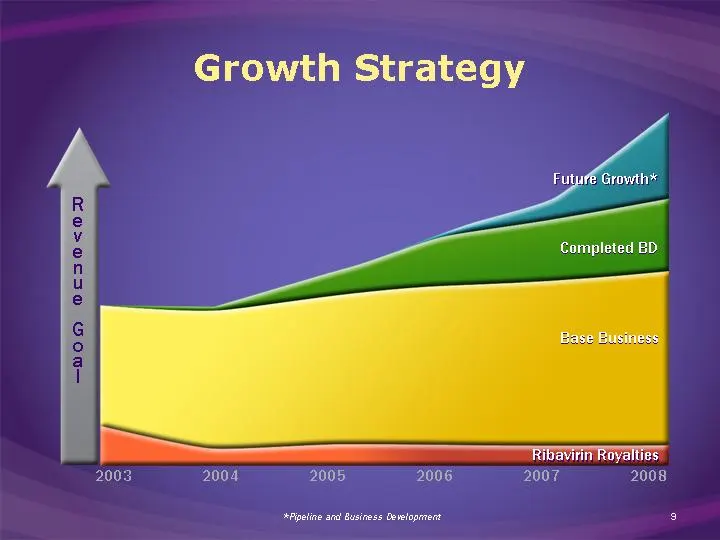
Slide 9: Growth Strategy
Growth Strategy R e v e n u e G o a l 2004 2005 2006 2007 2003 2008 Completed BD Ribavirin Royalties Base Business Future Growth* *Pipeline and Business Development
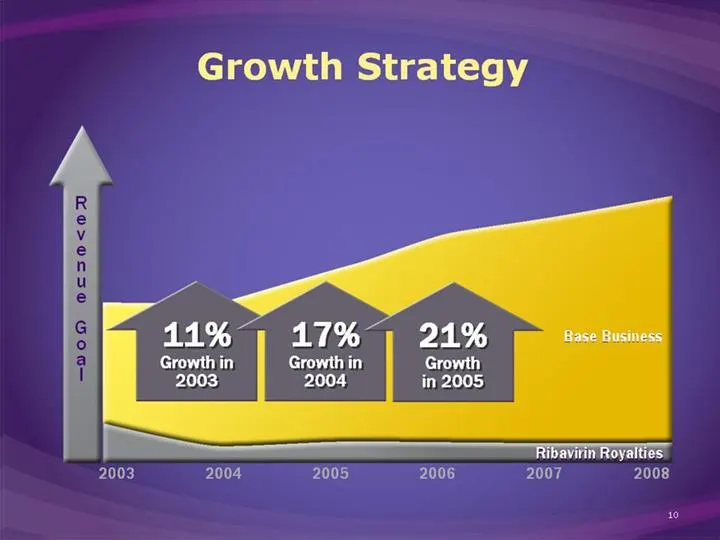
Slide 10: Growth Strategy
Growth Strategy 2004 2005 2006
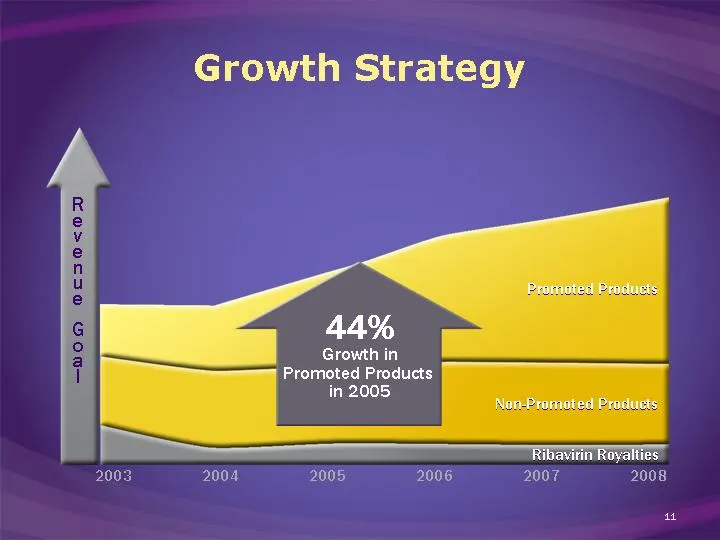
Slide 11: Growth Strategy
Growth Strategy 2004 2005 2006 2007 2003 2008 Non-Promoted Products Promoted Products 44% Growth in Promoted Products in 2005 R e v e n u e G o a l Ribavirin Royalties
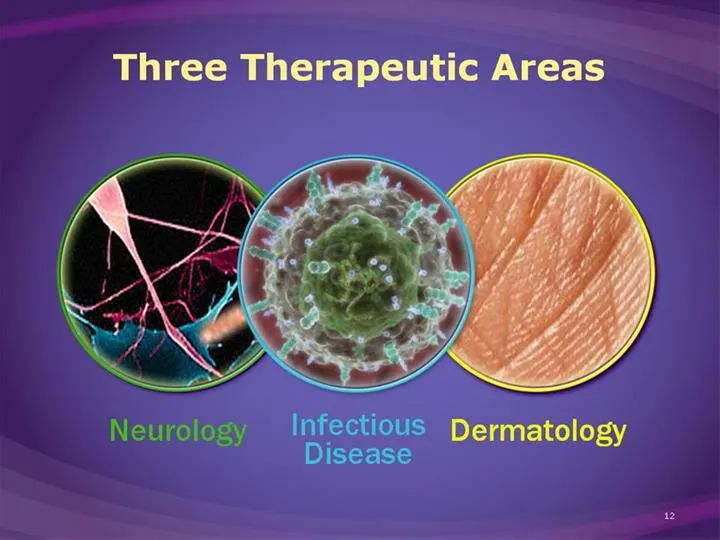
Slide 12: Three Therapeutic Areas
Three Therapeutic Areas Neurology ds Dermatology
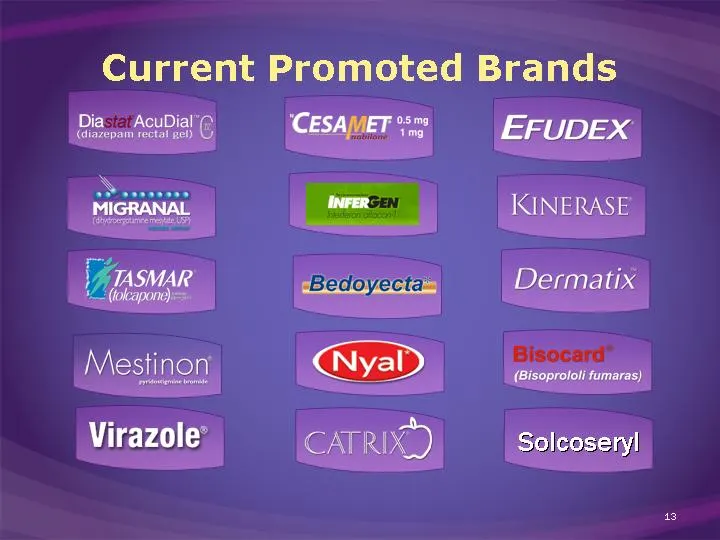
Slide 13: Current Promoted Brands
Solcoseryl Current Promoted Brands
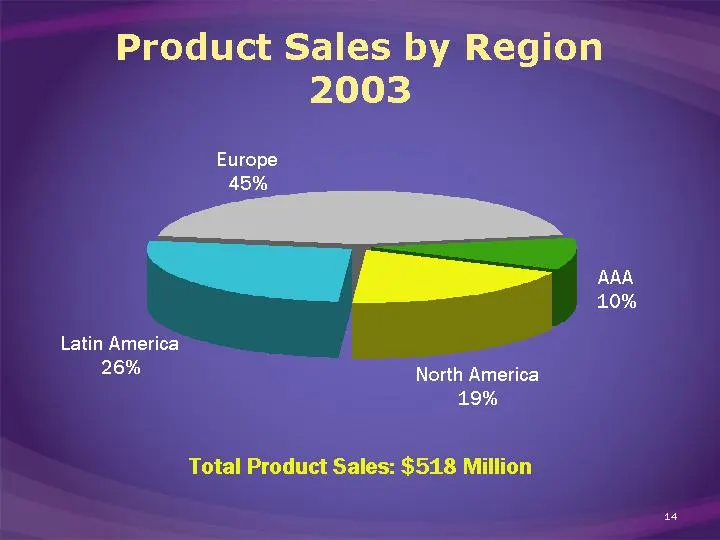
Slide 14: Product Sales by Region 2003
AAA North America Latin America Europe East 51 99 136 232 West 30.6 38.6 34.6 31.6 North 45.9 46.9 45 43.9 North America 19% AAA 10% Latin America 26% Europe 45% Product Sales by Region 2003 Total Product Sales: $518 Million
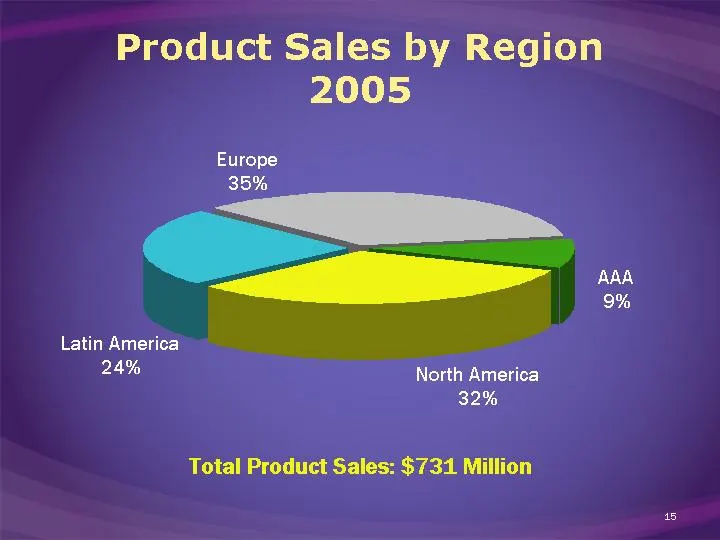
Slide 15: Product Sales by Region 2005
AAA North America Latin America Europe East 9 32 24 35 West 30.6 38.6 34.6 31.6 North 45.9 46.9 45 43.9 Product Sales by Region 2005 North America 32% AAA 9% Latin America 24% Total Product Sales: $731 Million Europe 35%
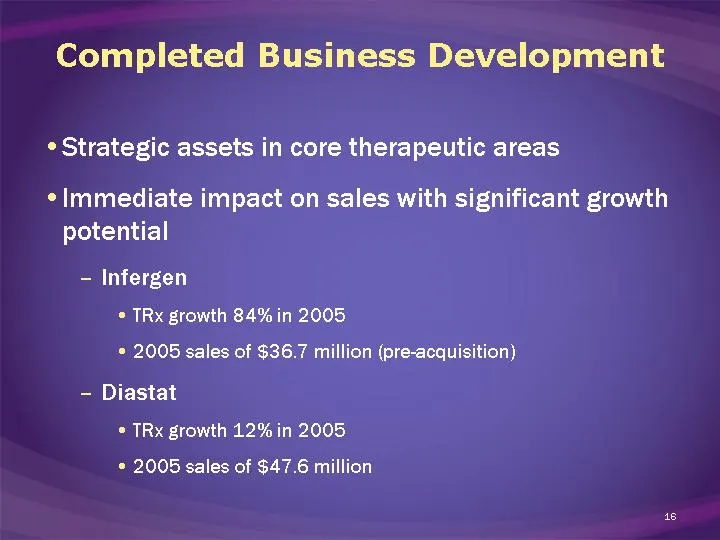
Slide 16: Completed Business Development
Completed Business Development Strategic assets in core therapeutic areas Immediate impact on sales with significant growth potential Infergen TRx growth 84% in 2005 2005 sales of $36.7 million (pre-acquisition) Diastat TRx growth 12% in 2005 2005 sales of $47.6 million
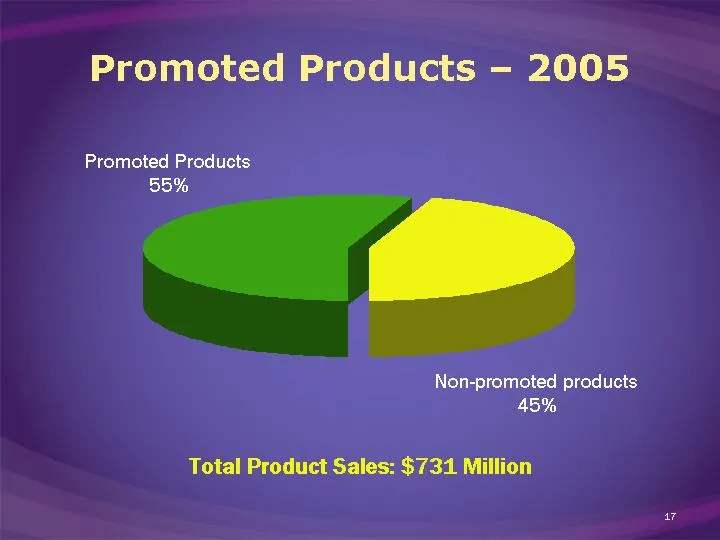
Slide 17: Promoted Products 2005
Promoted Products Non-promoted Products East 55 45 West 30.6 38.6 34.6 31.6 North 45.9 46.9 45 43.9 Promoted Products - 2005 Promoted Products 55% Total Product Sales: $731 Million Non-promoted products 45%
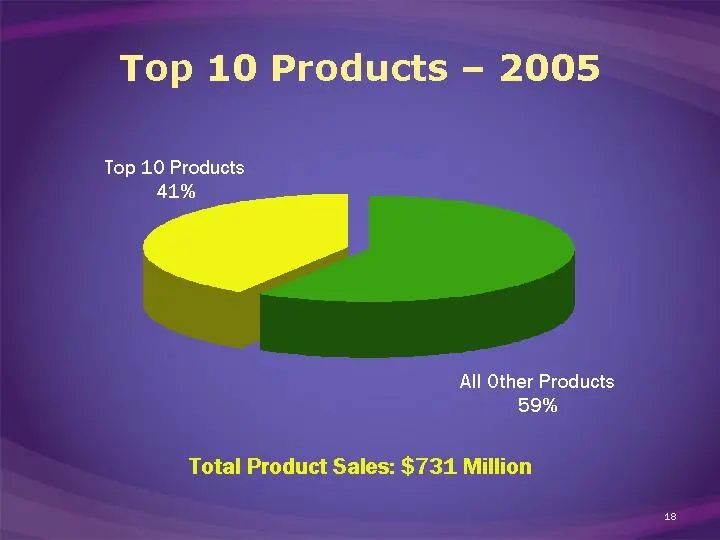
Slide 18: Top Products 2005
All Others Top 10 Products East 59 41 Top 10 Products - 2005 All Other Products 59% Total Product Sales: $731 Million Top 10 Products 41%
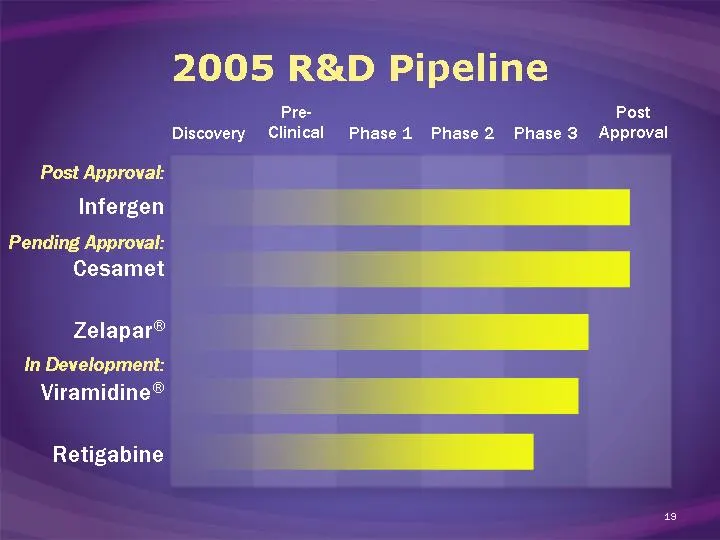
Slide 19: 2005 R&D Pipeline
2005 R&D Pipeline Discovery Phase 1 Phase 2 Phase 3 Post Approval Pre- Clinical Post Approval: Pending Approval: In Development:
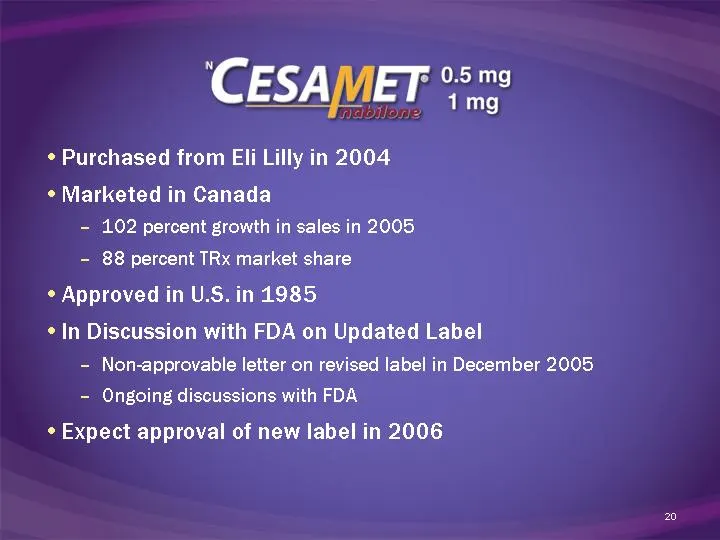
Slide 20: Diastat regulatory and sales update
Purchased from Eli Lilly in 2004 Marketed in Canada 102 percent growth in sales in 2005 88 percent TRx market share Approved in U.S. in 1985 In Discussion with FDA on Updated Label Non-approvable letter on revised label in December 2005 Ongoing discussions with FDA Expect approval of new label in 20
Slide 21: Zelapar Orally Disintegrating Tablets
| NEW | [ Zelapar Eten Orally Disintegrating Tablets
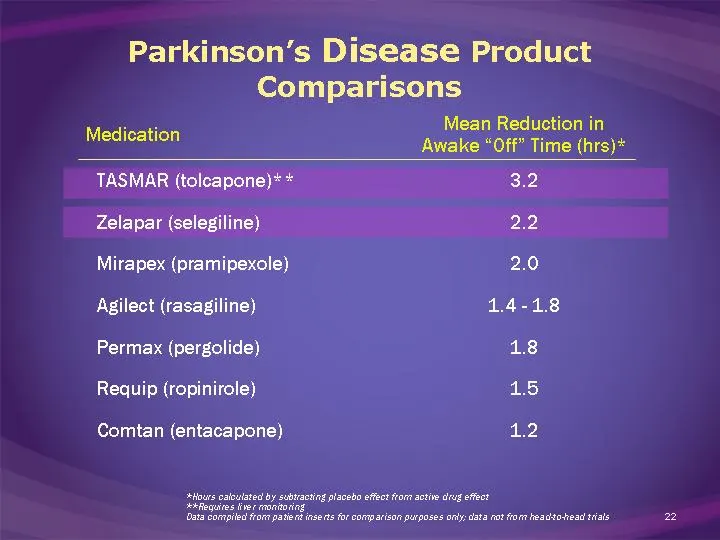
Slide 22: Parkinson's Disease Product Comparisons
Parkinson's Disease Product Comparisons Medication Mean Reduction in Awake "Off" Time (hrs)* TASMAR (tolcapone)** 3.2 Zelapar (selegiline) 2.2 Mirapex (pramipexole) 2.0 Agilect (rasagiline) 1.4 - 1.8 Permax (pergolide) 1.8 Requip (ropinirole) 1.5 Comtan (entacapone) 1.2 *Hours calculated by subtract
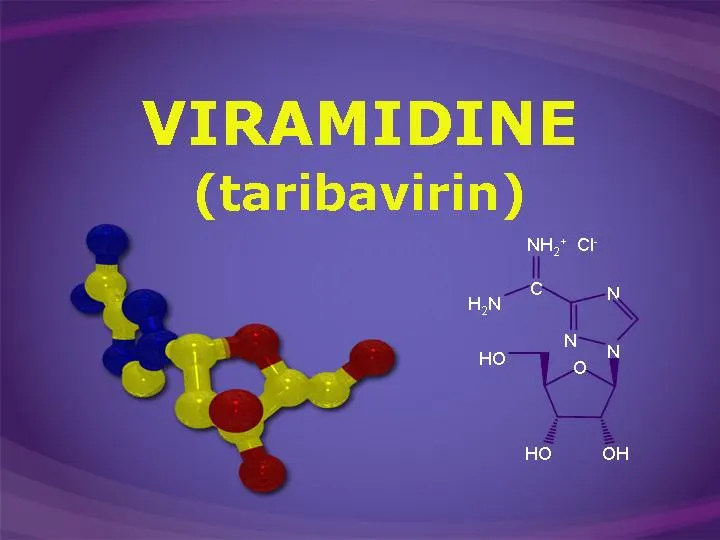
Slide 23: Viramidine (taribavirin)
VIRAMIDINE (taribavirin) O HO HO OH N N N C NH2+ H2N Cl-
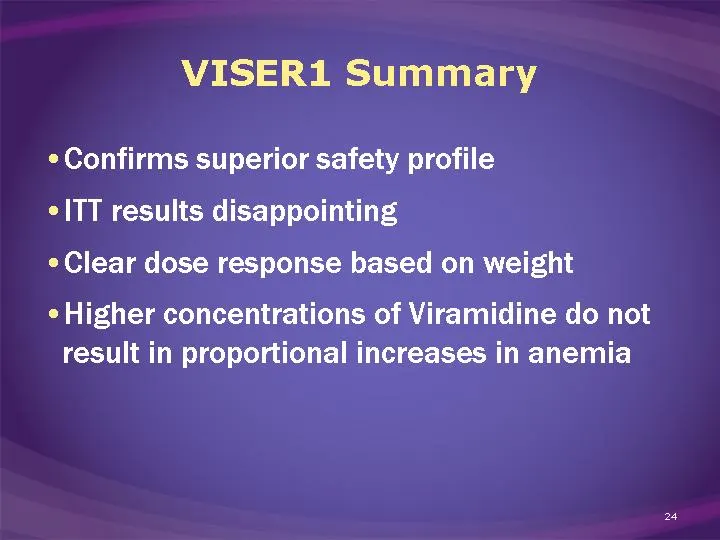
Slide 24: VISER1 Summary
VISER1 Summary Confirms superior safety profile ITT results disappointing Clear dose response based on weight Higher concentrations of Viramidine do not result in proportional increases in anemia
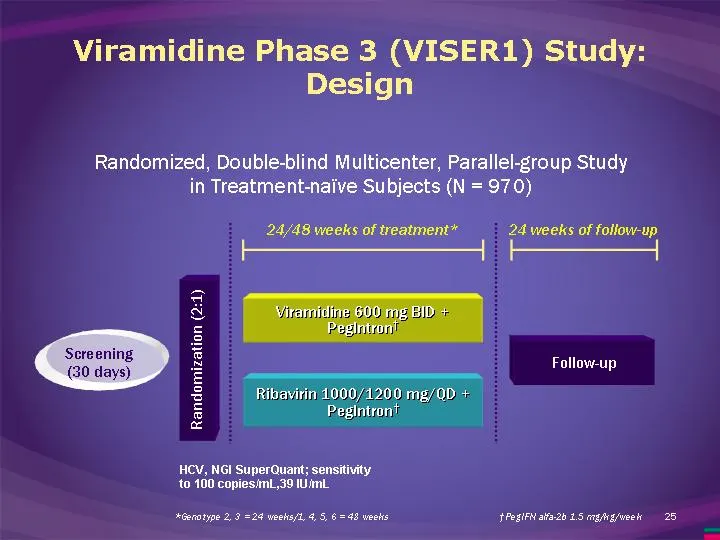
Slide 25: Viramidine Phase 3 (VISER1) Study Design
Viramidine Phase 3 (VISER1) Study: Design Randomized, Double-blind Multicenter, Parallel-group Study in Treatment-naive Subjects (N = 970) 24 weeks of follow-up 24/48 weeks of treatment* Screening (30 days) Randomization (2:1) Follow-up Ribavirin 1000/1200 mg/QD + PegIntron† Viramidine 600 mg BID +
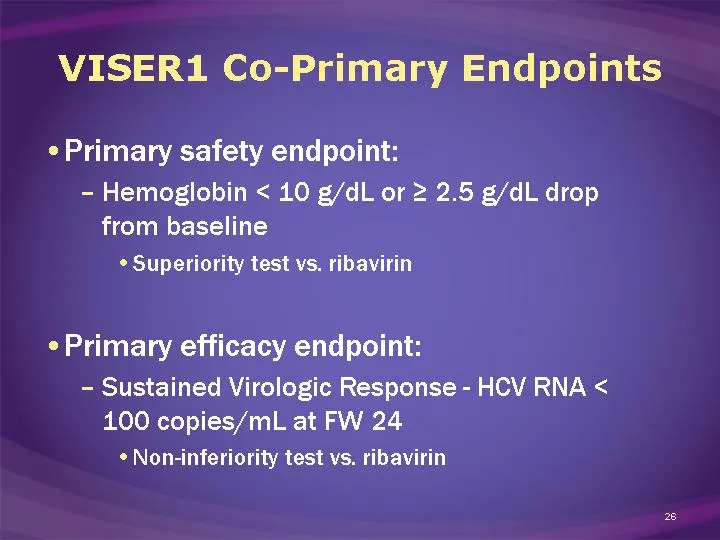
Slide 26: VISER1 Co-Primary Endpoints
VISER1 Co-Primary Endpoints Primary safety endpoint: Hemoglobin < 10 g/dL or ^ 2.5 g/dL drop from baseline Superiority test vs. ribavirin Primary efficacy endpoint: Sustained Virologic Response - HCV RNA < 100 copies/mL at FW 24 Non-inferiority test vs. ribavirin
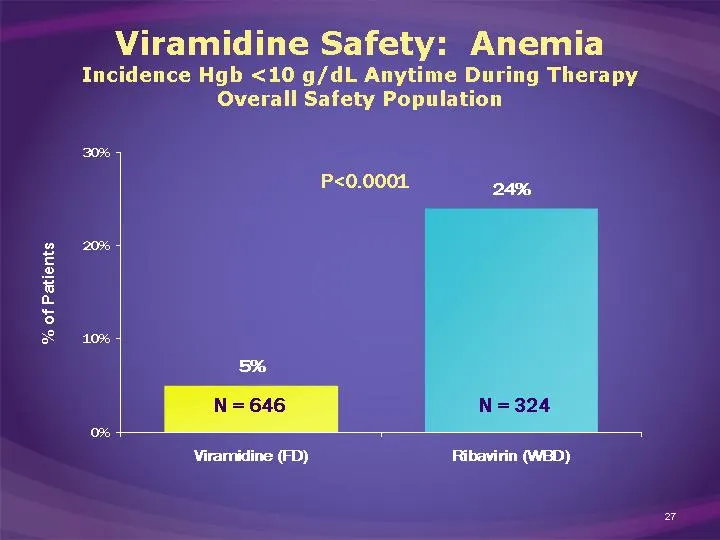
Slide 27: Viramidine Safety: Anemia Incidence
Viramidine Safety: Anemia Incidence Hgb <10 g/dL Anytime During Therapy Overall Safety Population Viramidine (FD) Ribavirin (WBD) SVR 0.05 0.24 N = 324 N = 646 P<0.0001 % of Patients
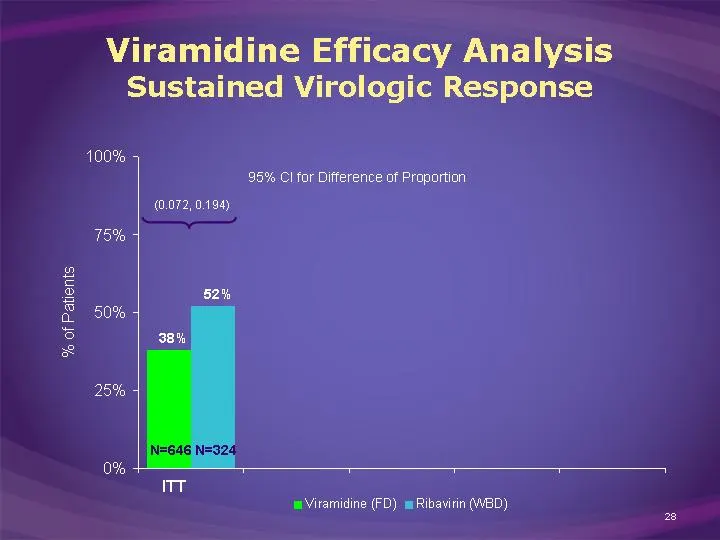
Slide 28: Viramidine Efficacy Analysis
Viramidine Efficacy Analysis Sustained Virologic Response Viramidine (FD) 0.38 0.51 0.62 0.42 Ribavirin (WBD) 0.52 0.56 0.6 0.53 38% 52% N=646 N=324 (0.072, 0.194) ITT 95% CI for Difference of Proportion
Slide 29: Viramidine Efficacy Analysis
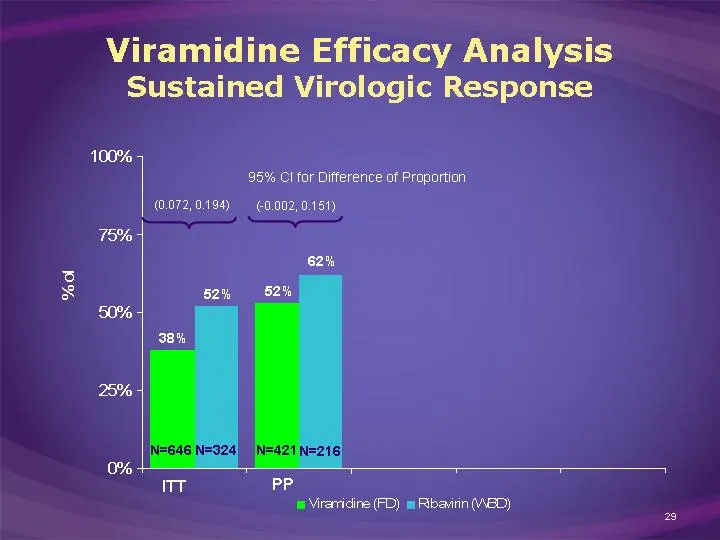
Viramidine Efficacy Analysis Sustained Virologic Response Viramidine (FD) 0.38 0.53 0.51 0.62 0.42 Ribavirin (WBD) 0.52 0.62 0.56 0.6 0.53 38% 52% 62% 52% N=646 N=421 N=324 N=216 (-0.002, 0.151) 95% CI for Difference of Proportion (0.072, 0.194) ITT PP
Slide 30: Sustained Virologic Response Overall by Region
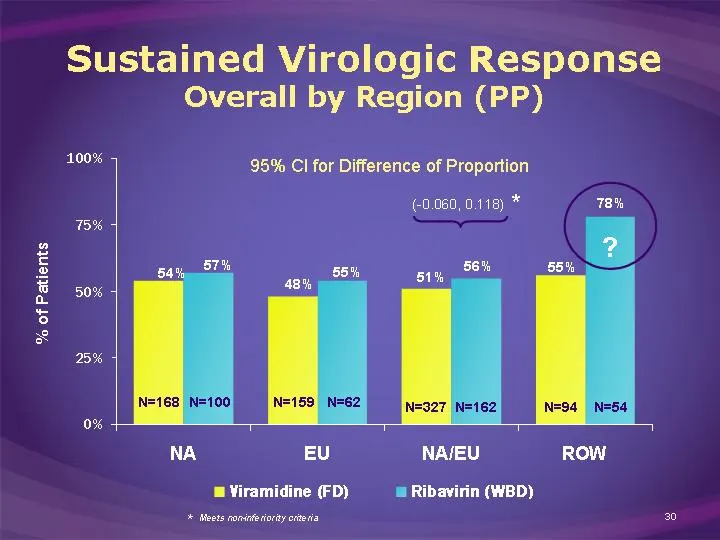
95% CI for Difference of Proportion Sustained Virologic Response Overall by Region (PP) NA EU NA/EU ROW Viramidine (FD) 0.54 0.48 0.51 0.56 Ribavirin (WBD) 0.57 0.54 0.55 0.78 54% 57% 48% 55% 55% 78% 56% 51% * Meets non-inferiority criteria N=168 N=100 N=159 N=62 N=327 N=162 N=94 N=54 ? (-0.060, 0.1
Slide 31: Viramidine Efficacy Analysis
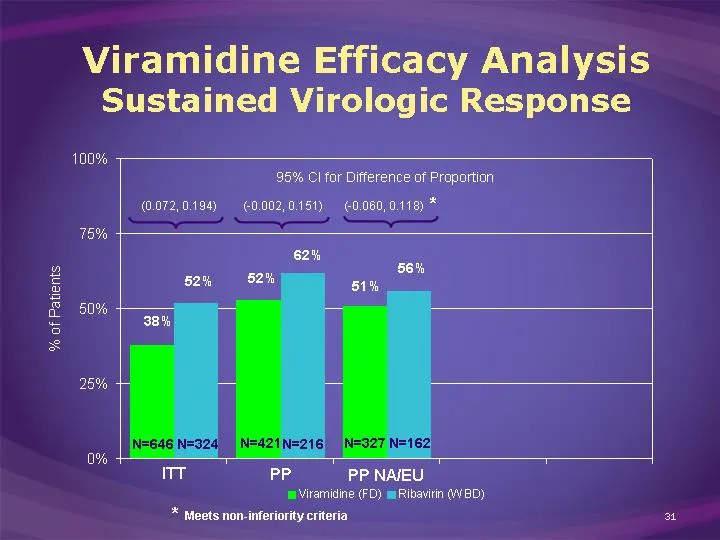
Viramidine Efficacy Analysis Sustained Virologic Response Viramidine (FD) 0.38 0.53 0.51 0.62 0.42 Ribavirin (WBD) 0.52 0.62 0.56 0.6 0.53 38% 52% 51% 56% 62% 52% N=646 N=421 N=324 N=216 N=327 N=162 95% CI for Difference of Proportion (-0.060, 0.118) * (-0.002, 0.151) * Meets non-inferiority criteri
Slide 32: Viramidine Weight Based Analysis
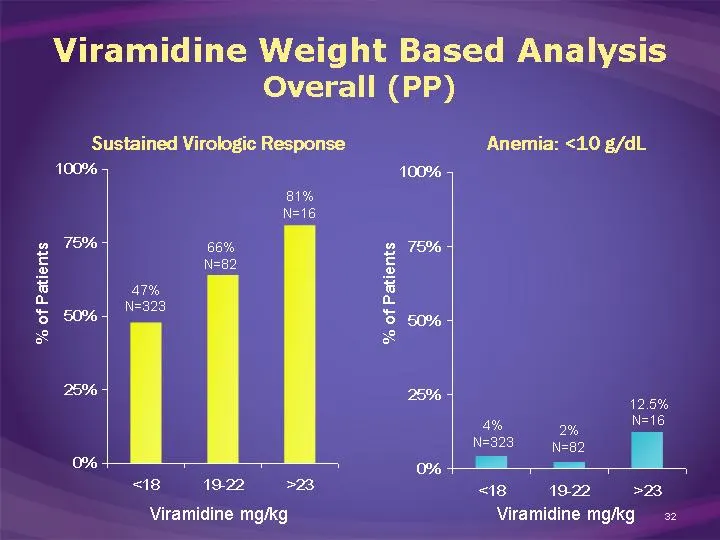
Viramidine Weight Based Analysis Overall (PP) Sustained Virologic Response Anemia: <10 g/dL Viramidine mg/kg Viramidine mg/kg <18 19-22 >23 East 0.48 0.64 0.81 47% N=323 66% N=82 81% N=16 <18 19-22 >23 East 0.043 0.024 0.125 2% N=82 4% N=323 12.5% N=16 % of Patients % of Patients
Slide 33: Viramidine Efficacy Analysis
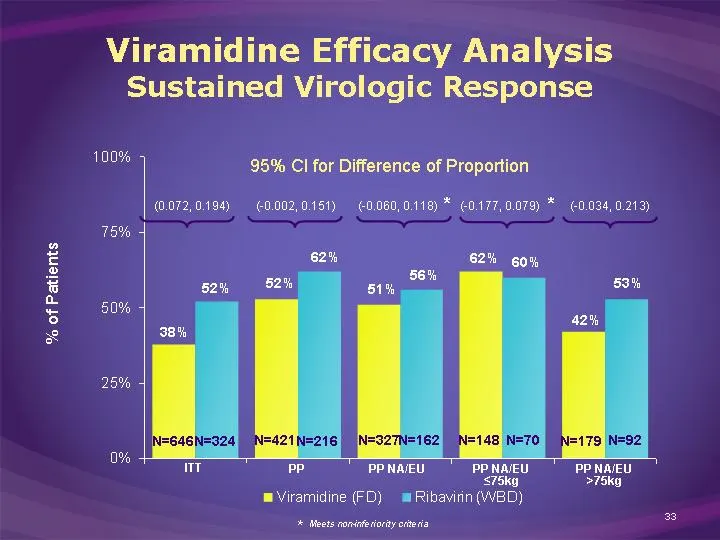
Viramidine Efficacy Analysis Sustained Virologic Response Viramidine (FD) 0.38 0.53 0.51 0.62 0.42 Ribavirin (WBD) 0.52 0.62 0.56 0.6 0.53 38% 52% 51% 56% 62% 52% 62% 60% 42% 53% N=646 N=421 N=324 N=148 N=70 N=92 N=179 N=216 N=327 N=162 (-0.060, 0.118) * (-0.177, 0.079) * (-0.034, 0.213) (-0.002, 0.
Slide 34: Viramidine Next Steps
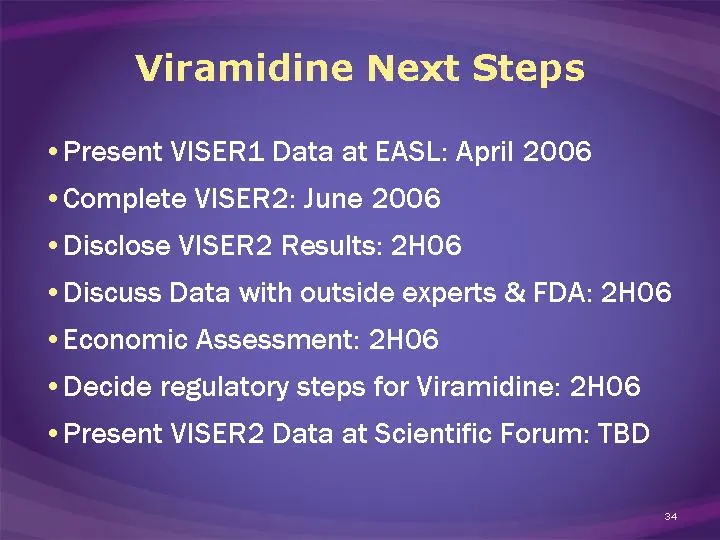
Viramidine Next Steps Present VISER1 Data at EASL: April 2006 Complete VISER2: June 2006 Disclose VISER2 Results: 2H06 Discuss Data with outside experts & FDA: 2H06 Economic Assessment: 2H06 Decide regulatory steps for Viramidine: 2H06 Present VISER2 Data at Scientific Forum: TBD
Slide 35: Retigabine
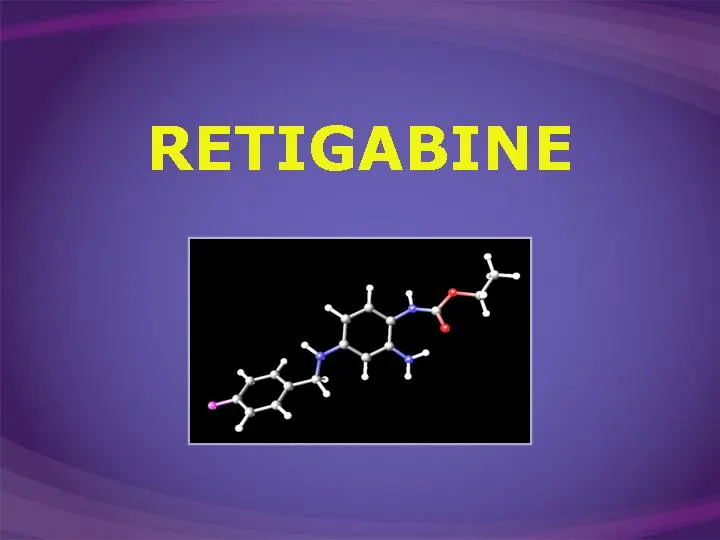
RETIGABINE
Slide 36: Retigabine Phase 2: Seizure Rate Reduction
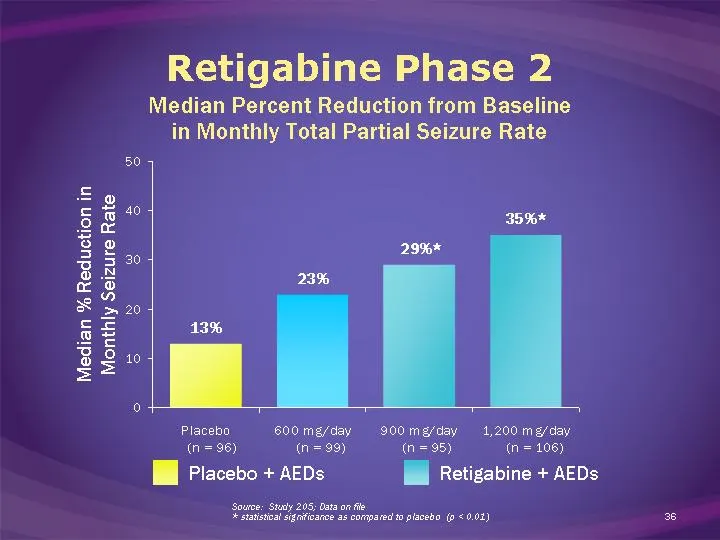
Retigabine Phase 2 Source: Study 205; Data on file * statistical significance as compared to placebo (p < 0.01) Median Percent Reduction from Baseline in Monthly Total Partial Seizure Rate Placebo + AEDs Retigabine + AEDs Placebo 600 mg/day 900 mg/day 1,200 mg/day East 13 23 29 35 West 30.6 38.6 34.
Slide 37: Retigabine Phase 2: Responder Rate
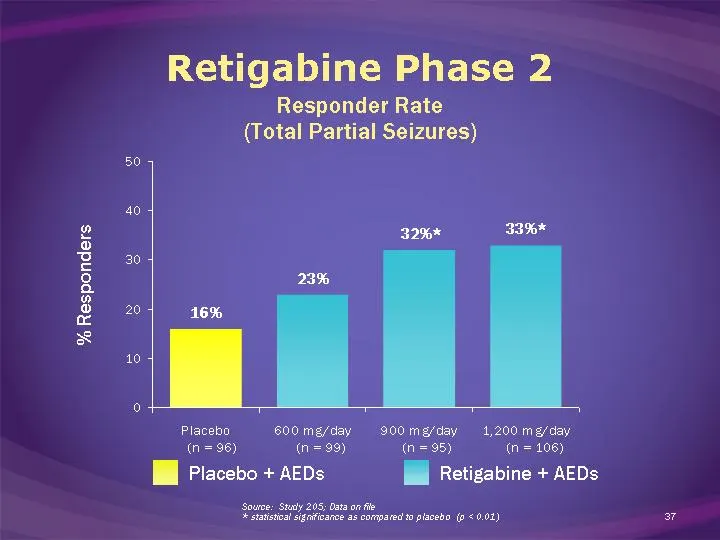
Retigabine Phase 2 Source: Study 205; Data on file * statistical significance as compared to placebo (p < 0.01) Responder Rate (Total Partial Seizures) Placebo 600 mg/day 900 mg/day 1,200 mg/day East 16 23 32 33 West 30.6 38.6 34.6 31.6 North 45.9 46.9 45 43.9 % Responders (n = 96) (n = 99) (n = 95)
Slide 38: Retigabine Phase 3: 301 Study Design (US)
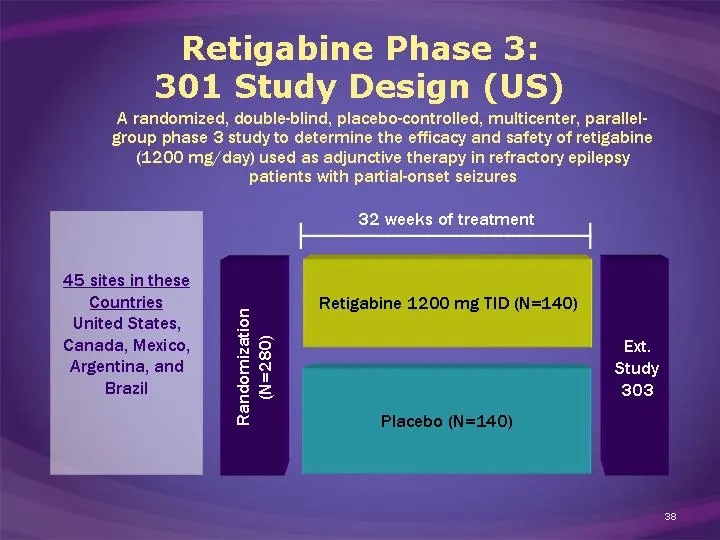
A randomized, double-blind, placebo-controlled, multicenter, parallel- group phase 3 study to determine the efficacy and safety of retigabine (1200 mg/day) used as adjunctive therapy in refractory epilepsy patients with partial-onset seizures Retigabine Phase 3: 301 Study Design (US) 32 weeks of tre
Slide 39: Retigabine Phase 3: 302 Study Design (ROW)
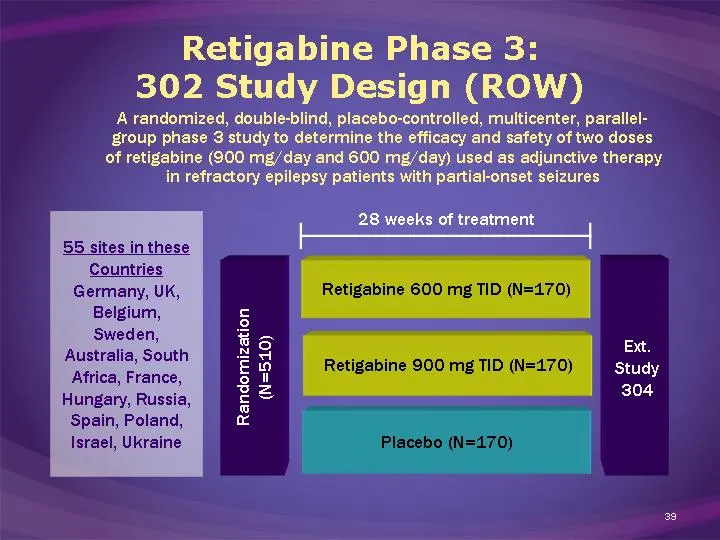
A randomized, double-blind, placebo-controlled, multicenter, parallel- group phase 3 study to determine the efficacy and safety of two doses of retigabine (900 mg/day and 600 mg/day) used as adjunctive therapy in refractory epilepsy patients with partial-onset seizures Retigabine Phase 3: 302 Study

Slide 40: Financial Review
Review Financial www.valeant.com
Slide 41: Product Sales
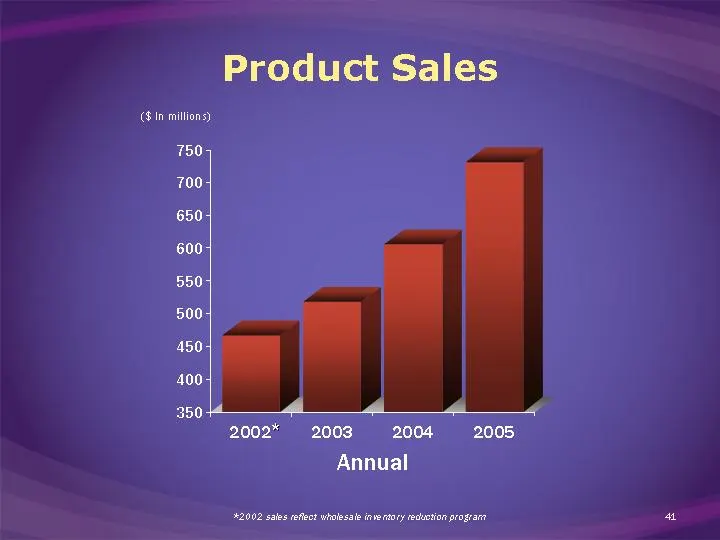
Product Sales 2002 2003 2004 2005 Sales 467 518 606 731 Annual *2002 sales reflect wholesale inventory reduction program * ($ In millions)
Slide 42: Same Store Sales
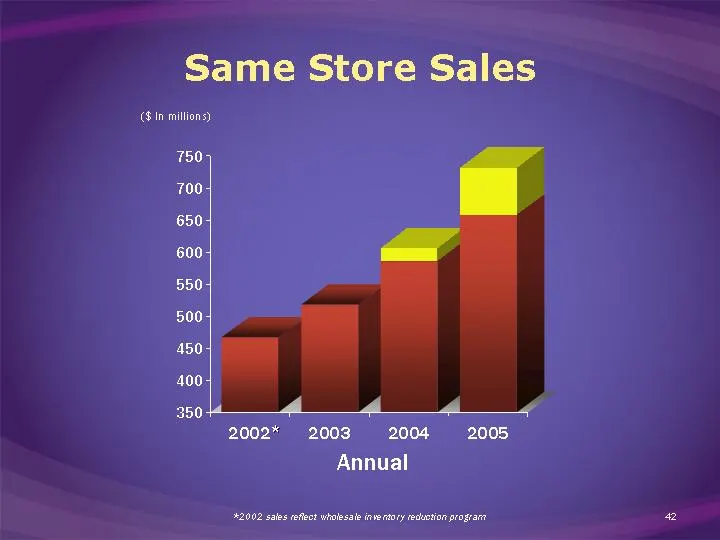
Same Store Sales 2002 2003 2004 2005 Sales 467 518 586 658 Acquisitions 20 73 Annual *2002 sales reflect wholesale inventory reduction program * ($ In millions)
Slide 43: Adjusted Operating Income
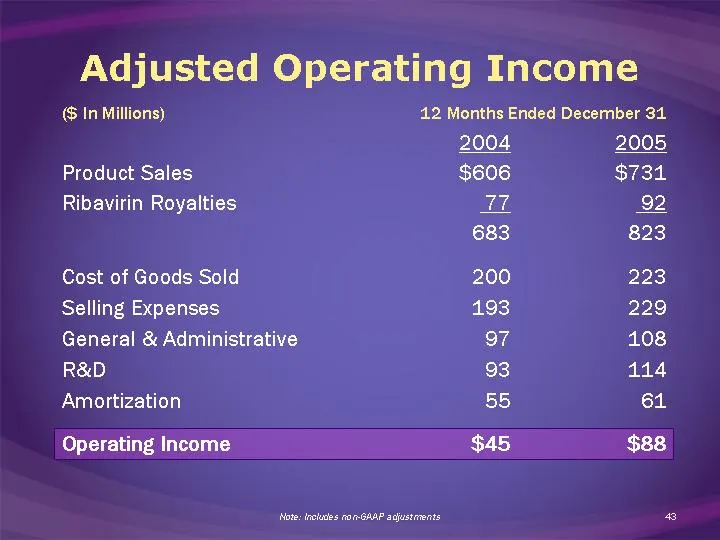
Adjusted Operating Income ($ In Millions) 12 Months Ended December 31 12 Months Ended December 31 2004 2005 Product Sales $606 $731 Ribavirin Royalties 77 92 683 823 Cost of Goods Sold 200 223 Selling Expenses 193 229 General & Administrative 97 108 R&D 93 114 Amortization 55 61 Operating Income $45
Slide 44: Adjusted Operating Income
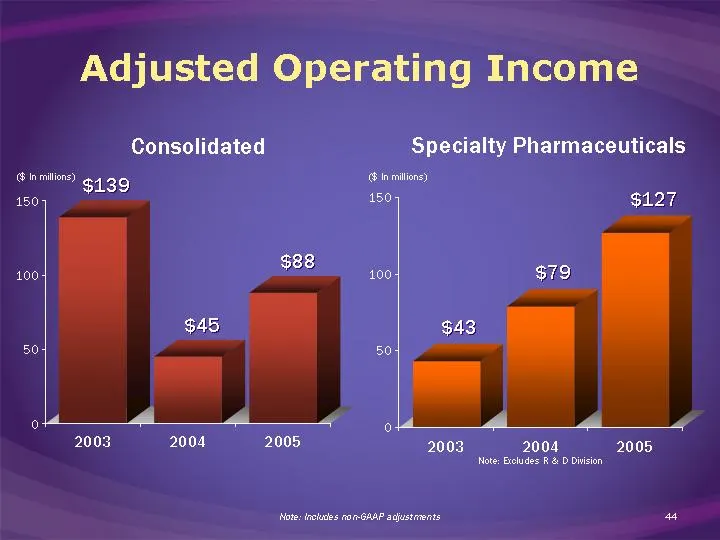
Adjusted Operating Income 2002 2003 2004 2005 Sales 209 139 45 88 Consolidated 2002 2003 2004 2005 Sales 2 43 79 127 ($ In millions) ($ In millions) Specialty Pharmaceuticals $139 $45 $88 $43 $79 $127 Note: Excludes R & D Division Note: Includes non-GAAP adjustments
Slide 45: R&D Investment
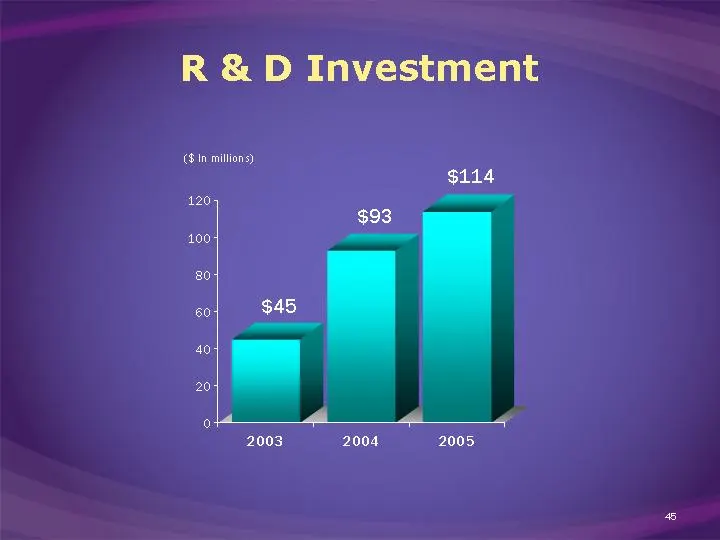
R & D Investment 2002 2003 2004 2005 Sales 50 45 93 114 ($ In millions) $45 $93 $114
Slide 46: Solid Balance Sheet
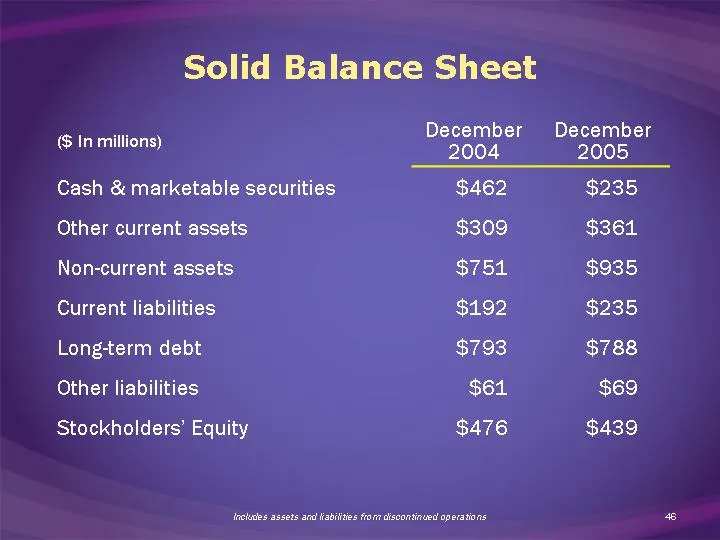
Solid Balance Sheet ($ In millions) December 2004 December 2005 Cash & marketable securities $462 $235 Other current assets $309 $361 Non-current assets $751 $935 Current liabilities $192 $235 Long-term debt $793 $788 Other liabilities $61 $69 Stockholders' Equity $476 $439 Includes assets and liabi
Slide 47: Adjusted EBITDA
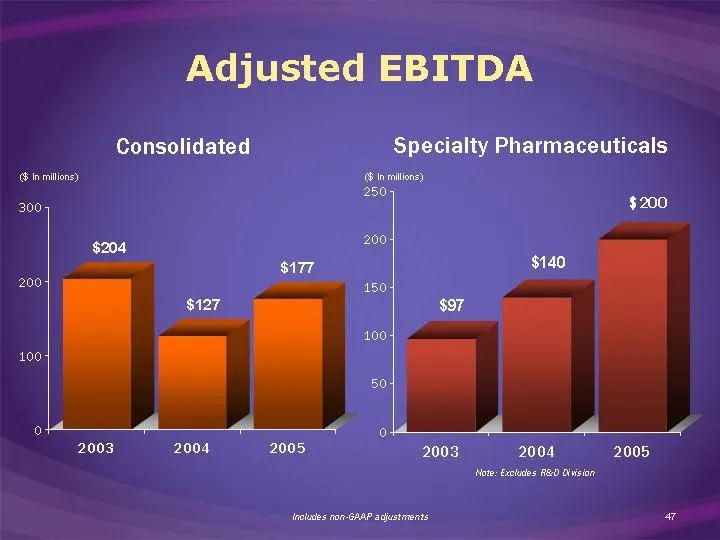
Adjusted EBITDA 2002 2003 2004 2005 Specialty Pharma 53 97 140 200 2002 2003 2004 2005 Consolidated 263.1 204 127 177 Consolidated ($ In millions) ($ In millions) Specialty Pharmaceuticals $200 Note: Excludes R&D Division Includes non-GAAP adjustments
Slide 48: Financial Metrics
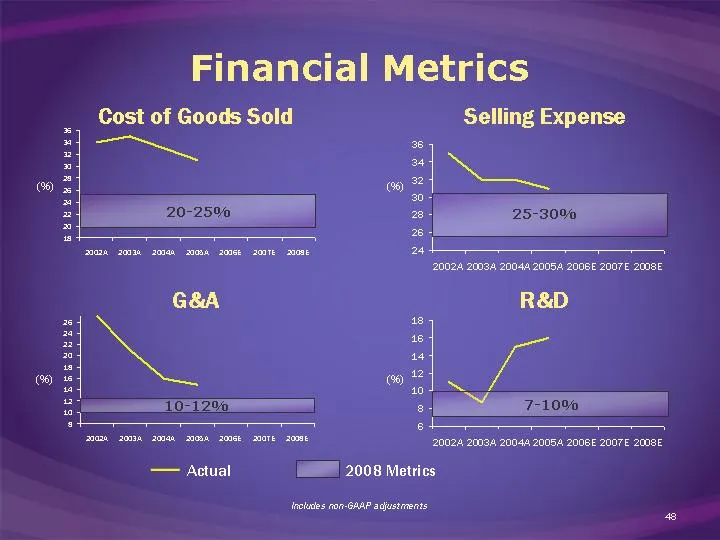
2002A 2003A 2004A 2005A 2006E 2007E 2008E Cost of Goods Sold 11 8.7 15 16 2002A 2003A 2004A 2005A 2006E 2007E 2008E Cost of Goods Sold 35 32 32 31 2002A 2003A 2004A 2005A 2006E 2007E 2008E Cost of Goods Sold 34 35 33 31 2002A 2003A 2004A 2005A 2006E 2007E 2008E Cost of Goods Sold 27 21 16 15 Financi
Slide 49: Financial Metrics
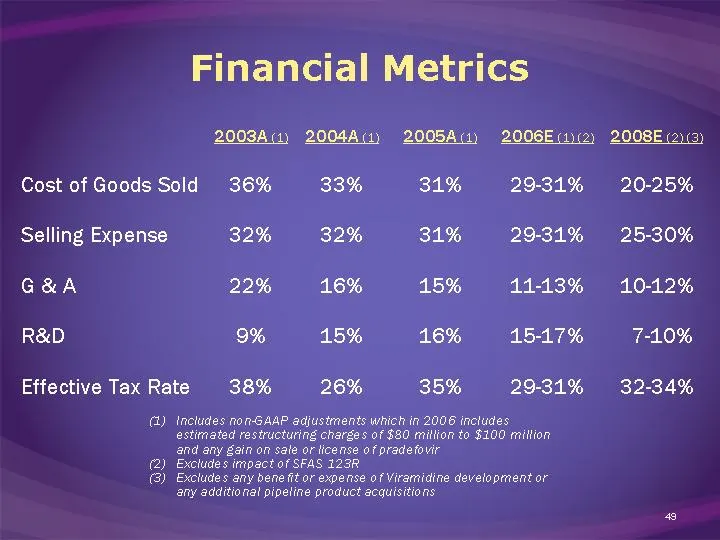
Financial Metrics 2003A (1) 2004A (1) 2005A (1) 2006E (1) (2) 2008E (2) (3) Cost of Goods Sold 36% 33% 31% 29-31% 20-25% Selling Expense 32% 32% 31% 29-31% 25-30% G & A 22% 16% 15% 11-13% 10-12% R&D 9% 15% 16% 15-17% 7-10% Effective Tax Rate 38% 26% 35% 29-31% 32-34% Includes non-GAAP adjustments wh
Slide 50: Delivering Results, Keeping Our Promises
Delivering Results Keeping Our Promises Positioning VRX for the Future
Source: SEC EDGAR · 8-K filed Apr 5, 2006
More decks from Valeant Pharmaceuticals International Inc
 Q2 2010 Earnings Presentation25 slides · Aug 3, 2010
 Q2 2010 Earnings Presentation25 slides · Aug 2, 2010
 Merger or Acquisition (June 2010)22 slides · Jun 21, 2010
 Merger or Acquisition (December 2008)14 slides · Dec 10, 2008
 Technical Presentation (May 2008)20 slides · May 13, 2008
 Investor Presentation (March 2008)42 slides · Mar 27, 2008