Valeant Pharmaceuticals International Inc
Valeant Pharmaceuticals International — Investor Presentation (March 2008)
42 slides from Valeant Pharmaceuticals International's investor presentation, Mar 27, 2008
Slide 1: Investor Presentation March 27, 2008
Investor Presentation March 27, 2008
Slide 2: Forward-looking statements
Forward-looking statements This presentation contains forward-looking statements, including, but not limited to, statements regarding the company's new strategic direction and restructuring plans, that are based on management's current expectations and involve risks and uncertainties, including, but
Slide 3: Today's agenda
Today's agenda Summary conclusions What I found - first 60 days What gives me confidence about our future New strategy Pipeline update
Slide 4: Our strategy
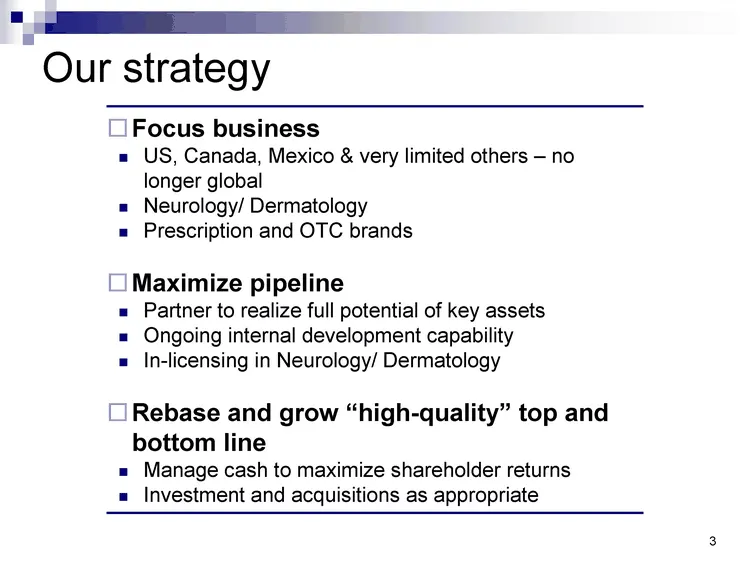
Our strategy Focus business US, Canada, Mexico & very limited others - no longer global Neurology/ Dermatology Prescription and OTC brands Maximize pipeline Partner to realize full potential of key assets Ongoing internal development capability In-licensing in Neurology/ Dermatology Rebase and grow
Slide 5: Today's agenda
Today's agenda Summary conclusions What I found - first 60 days What gives me confidence about our future New strategy Pipeline update
Slide 6: Valeant is diversified...
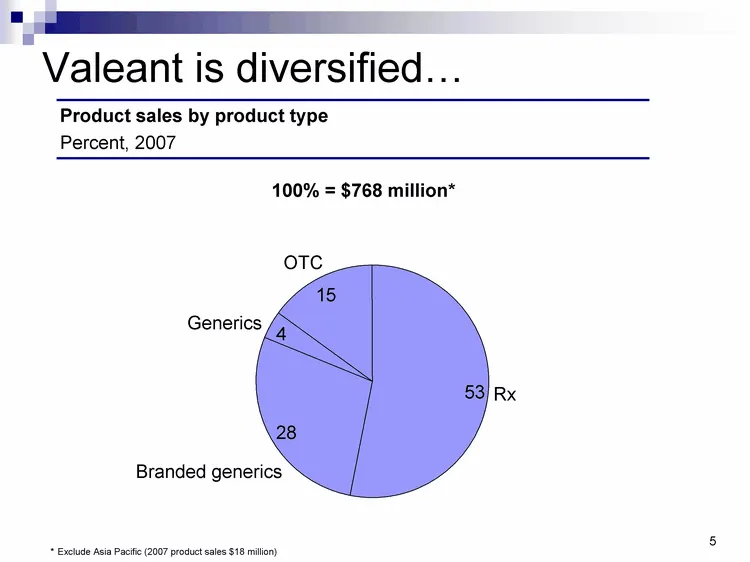
Valeant is diversified... Product sales by product type Percent, 2007 100% = $768 million* Rx Branded generics Generics OTC 166,134 * Exclude Asia Pacific (2007 product sales $18 million)
Slide 7: ....relatively unfocused...
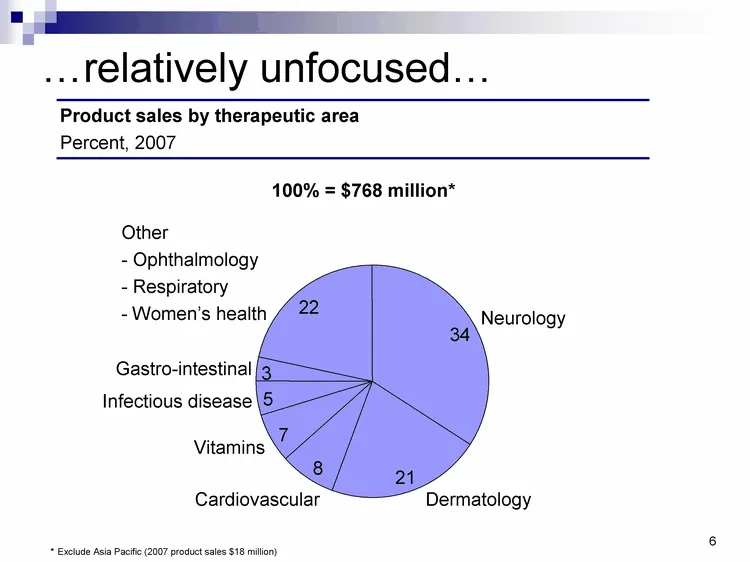
....relatively unfocused... Product sales by therapeutic area Percent, 2007 100% = $768 million* Neurology Dermatology Cardiovascular Vitamins Infectious disease Gastro-intestinal Other - - Ophthalmology - - Respiratory - - Women's health 22 * Exclude Asia Pacific (2007 product sales $18 million)
Slide 8: ....with an over-extended geographic footprint...
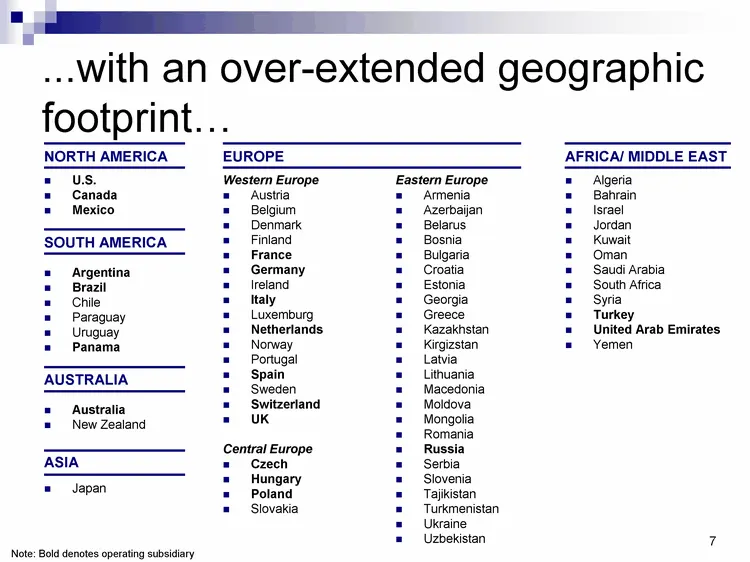
....with an over-extended geographic footprint... NORTH AMERICA Eastern Europe Armenia Azerbaijan Belarus Bosnia Bulgaria Croatia Estonia Georgia Greece Kazakhstan Kirgizstan Latvia Lithuania Macedonia Moldova Mongolia Romania Russia Serbia Slovenia Tajikistan Turkmenistan Ukraine Uzbekistan AFRICA/
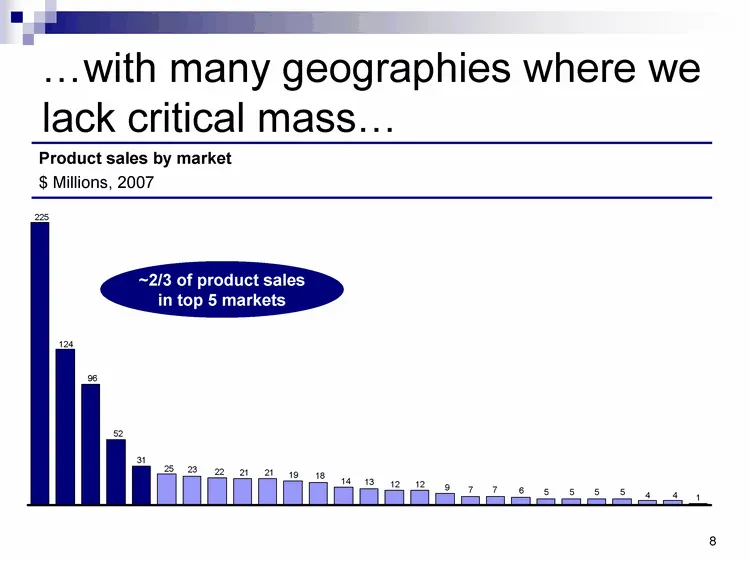
Slide 9: ....with many geographies where we lack critical mass...
....with many geographies where we lack critical mass... Product sales by market $ Millions, 2007 21 ~2/3 of product sales in top 5 markets
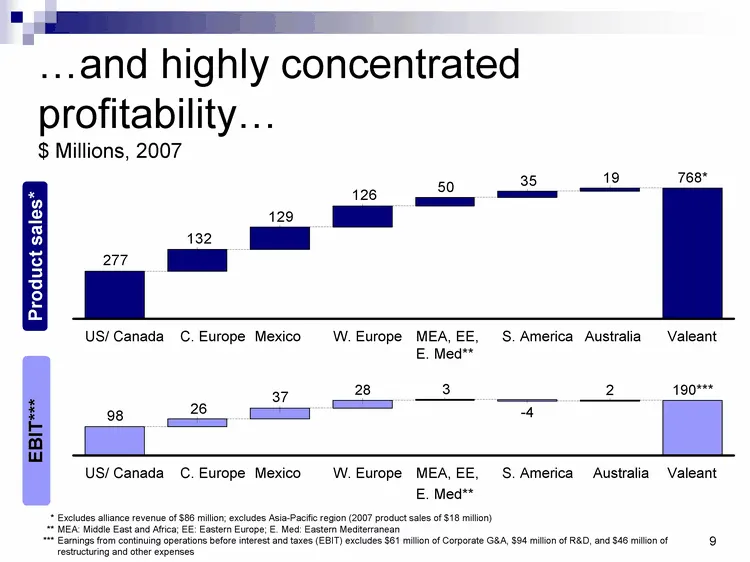
Slide 10: ....and highly concentrated profitability...
$ Millions, 2007 * Excludes alliance revenue of $86 million; excludes Asia-Pacific region (2007 product sales of $18 million) ** MEA: Middle East and Africa; EE: Eastern Europe; E. Med: Eastern Mediterranean *** Earnings from continuing operations before interest and taxes (EBIT) excludes $61 millio
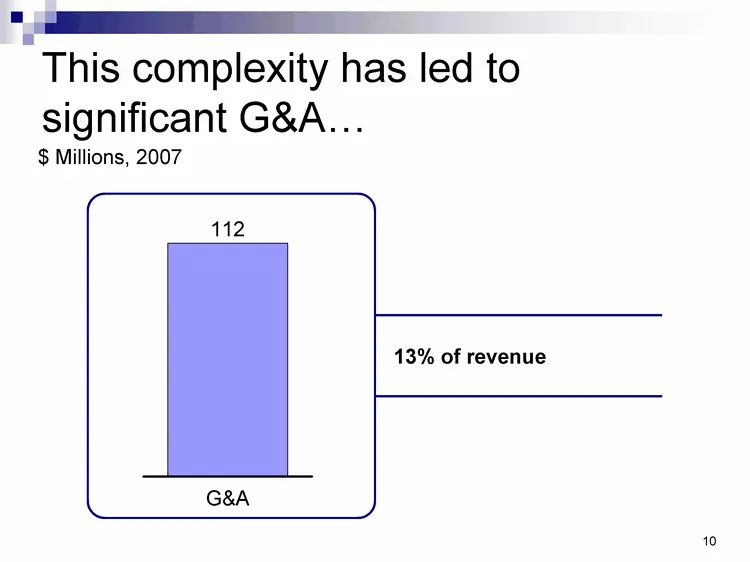
Slide 11: This complexity has led to significant G&A...
13% of revenue This complexity has led to significant G&A... $ Millions, 2007 112 G&A 112
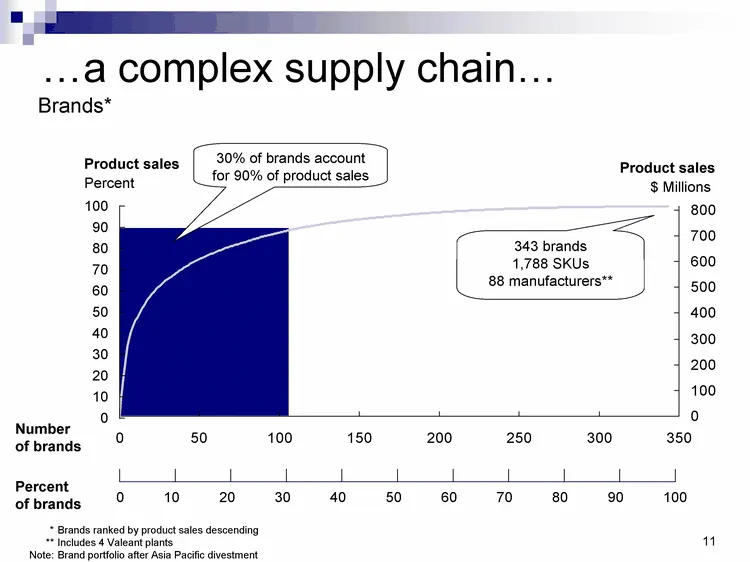
Slide 12: ....a complex supply chain...
....a complex supply chain... * Brands ranked by product sales descending ** Includes 4 Valeant plants Note: Brand portfolio after Asia Pacific divestment Brands* 0 1.48000000010046E-03 1.00000000000011 75.9865512664745 2.00000000000023 127.789936591082 3.00000000000034 178.373770861088 4.0000000000
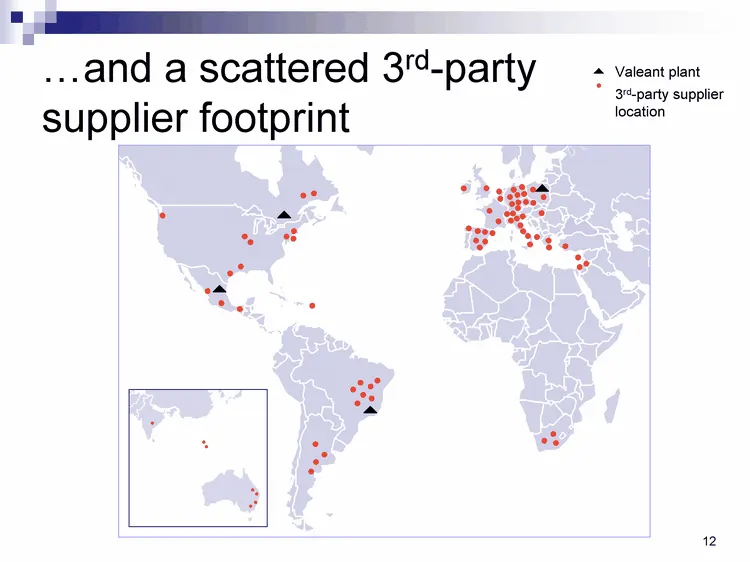
Slide 13: ....and a scattered 3rd-party supplier footprint
....and a scattered 3rd-party supplier footprint 3rd-party supplier location Valeant plant
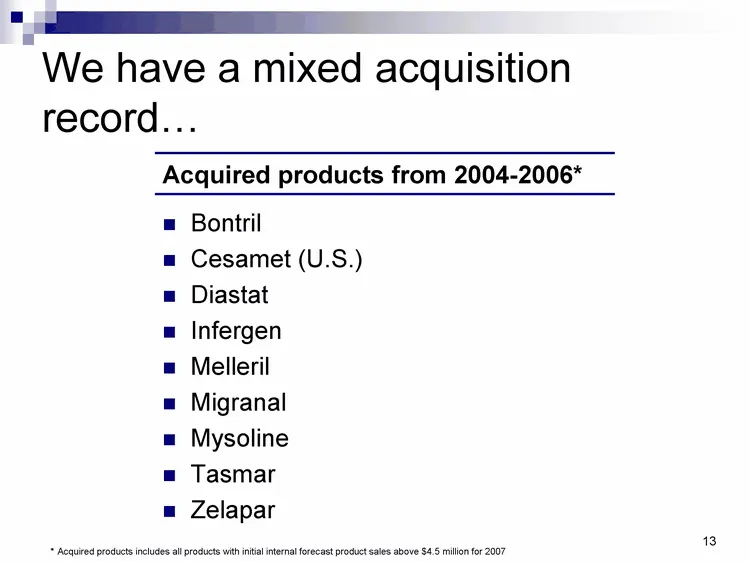
Slide 14: We have a mixed acquisition record...
Acquired products from 2004-2006* We have a mixed acquisition record... Bontril Cesamet (U.S.) Diastat Infergen Melleril Migranal Mysoline Tasmar Zelapar * Acquired products includes all products with initial internal forecast product sales above $4.5 million for 2007 134
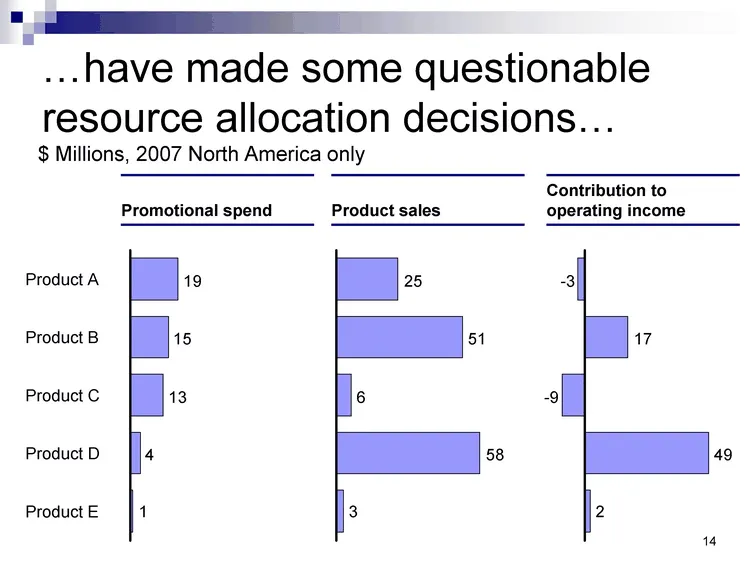
Slide 15: ....have made some questionable resource allocation decisions...
....have made some questionable resource allocation decisions... Promotional spend Product sales Contribution to operating income Product E Product D Product C Product B Product A 25 $ Millions, 2007 North America only
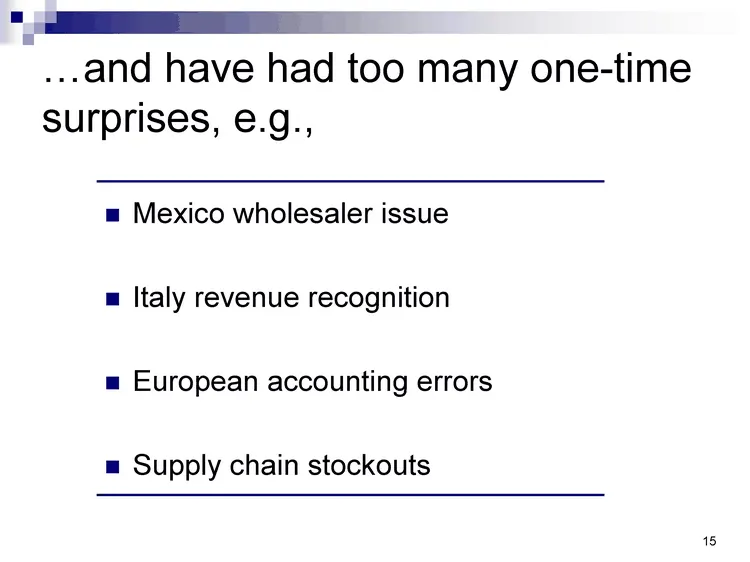
Slide 16: ....and have had too many one-time surprises
....and have had too many one-time surprises, e.g., Mexico wholesaler issue Italy revenue recognition European accounting errors Supply chain stockouts
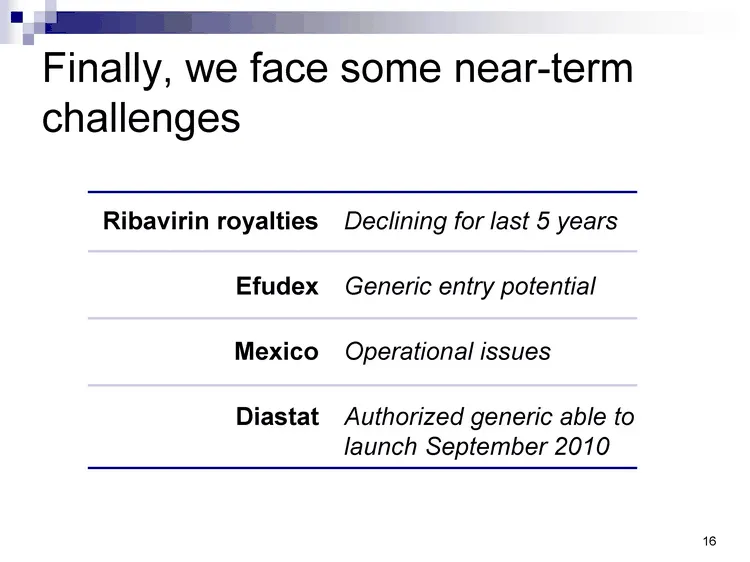
Slide 17: Finally, we face some near-term challenges
Finally, we face some near-term challenges 167 Ribavirin royalties Efudex Mexico Diastat Declining for last 5 years Generic entry potential Operational issues Authorized generic able to launch September 2010
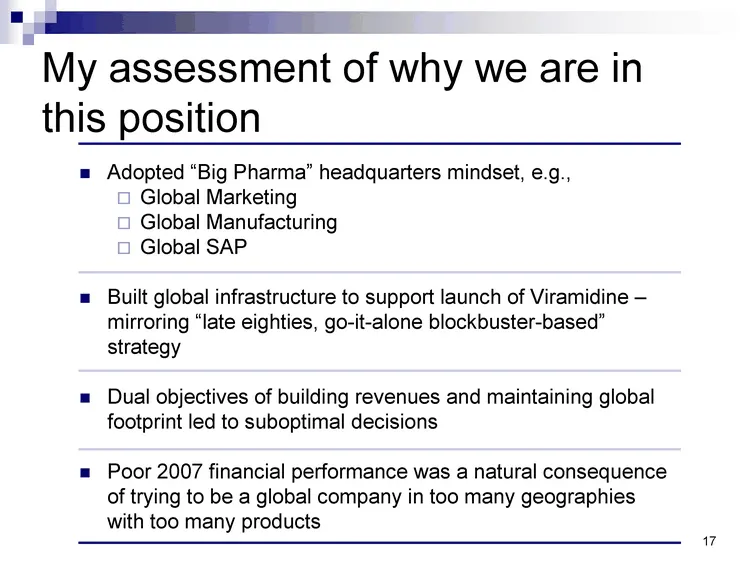
Slide 18: My assessment of why we are in this position
My assessment of why we are in this position Adopted "Big Pharma" headquarters mindset, e.g., Global Marketing Global Manufacturing Global SAP Built global infrastructure to support launch of Viramidine - mirroring "late eighties, go-it-alone blockbuster-based" strategy Dual objectives of building r
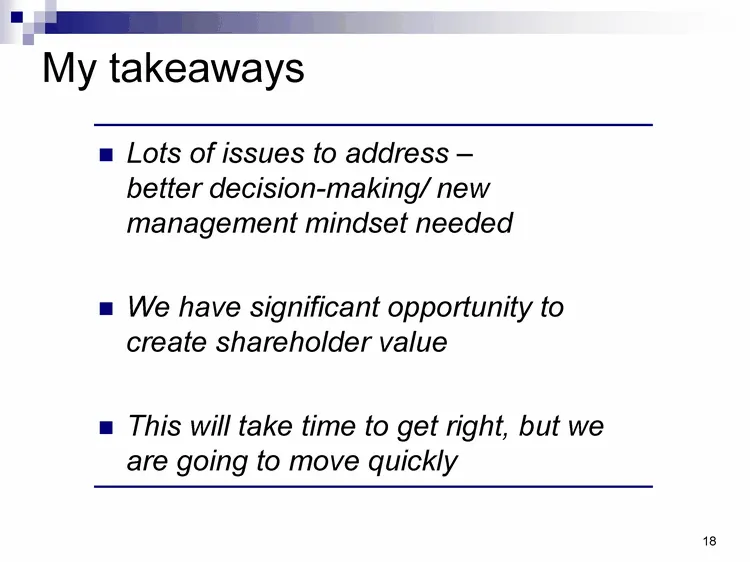
Slide 19: My takeaways
My takeaways Lots of issues to address - better decision-making/ new management mindset needed We have significant opportunity to create shareholder value This will take time to get right, but we are going to move quickly
Slide 20: Today's agenda
Today's agenda Summary conclusions What I found - first 60 days What gives me confidence about our future New strategy Pipeline update
Slide 21: What gives me confidence about our future
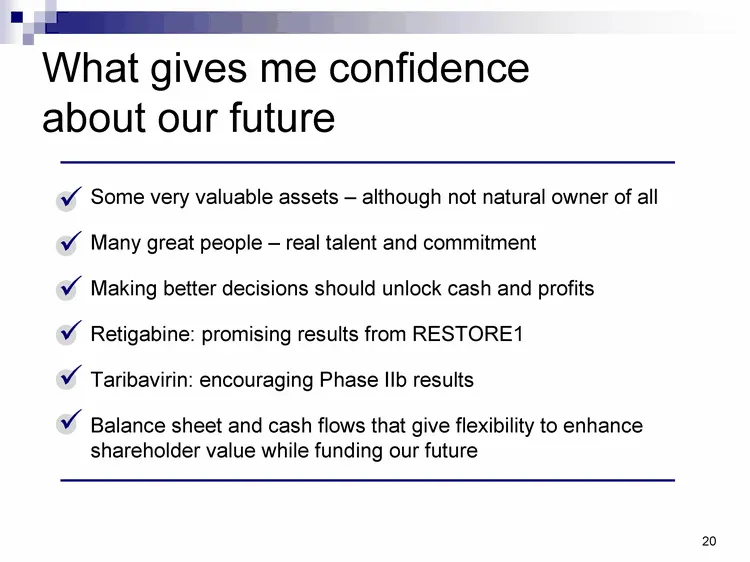
What gives me confidence about our future Some very valuable assets - although not natural owner of all Many great people - real talent and commitment Making better decisions should unlock cash and profits Retigabine: promising results from RESTORE1 Taribavirin: encouraging Phase IIb results Balance
Slide 22: Assets that excite me
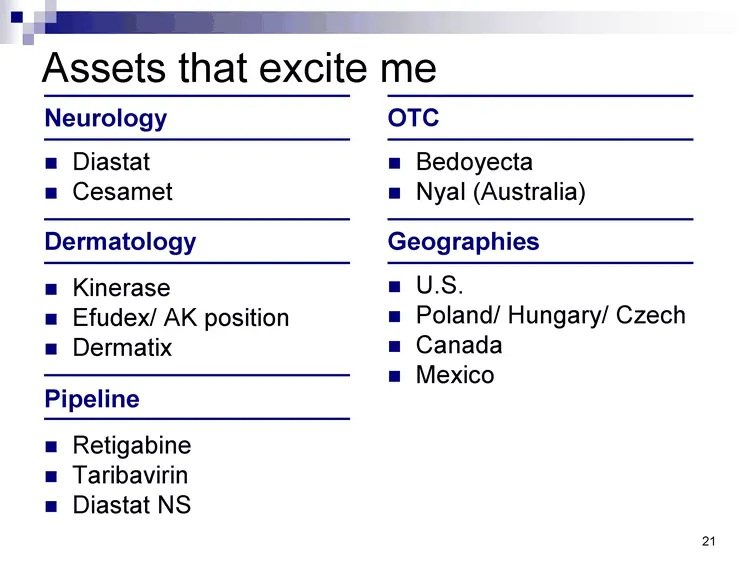
Assets that excite me Neurology OTC Pipeline Diastat Cesamet Retigabine Taribavirin Diastat NS Kinerase Efudex/ AK position Dermatix Dermatology Bedoyecta Nyal (Australia) U.S. Poland/ Hungary/ Czech Canada Mexico Geographies
Slide 23: Today's agenda
Today's agenda Summary conclusions What I found - first 60 days What gives me confidence about our future New strategy Pipeline update
Slide 24: Our strategy
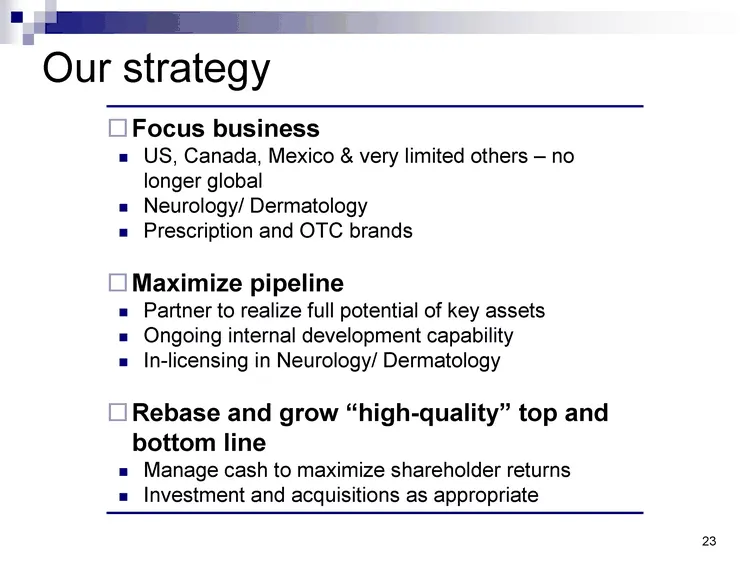
Our strategy Focus business US, Canada, Mexico & very limited others - no longer global Neurology/ Dermatology Prescription and OTC brands Maximize pipeline Partner to realize full potential of key assets Ongoing internal development capability In-licensing in Neurology/ Dermatology Rebase and grow
Slide 25: Rationale
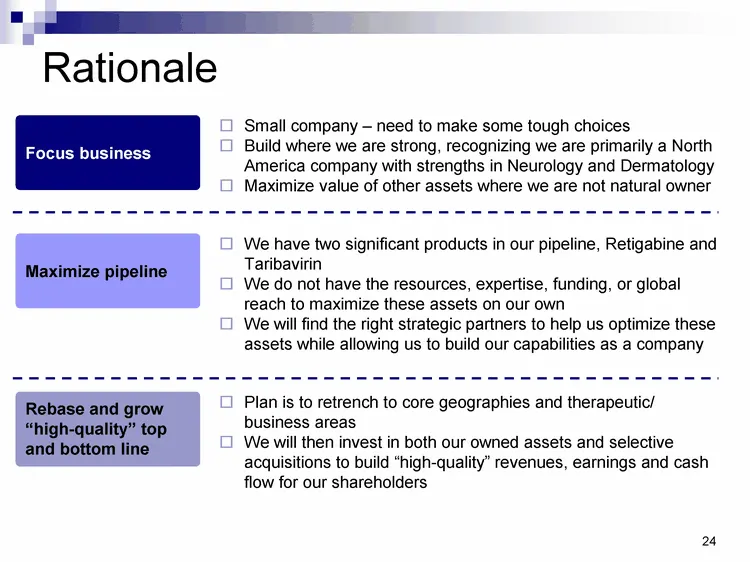
Rationale Small company - need to make some tough choices Build where we are strong, recognizing we are primarily a North America company with strengths in Neurology and Dermatology Maximize value of other assets where we are not natural owner Focus business We have two significant products in our p
Slide 26: Reduce geographic footprint
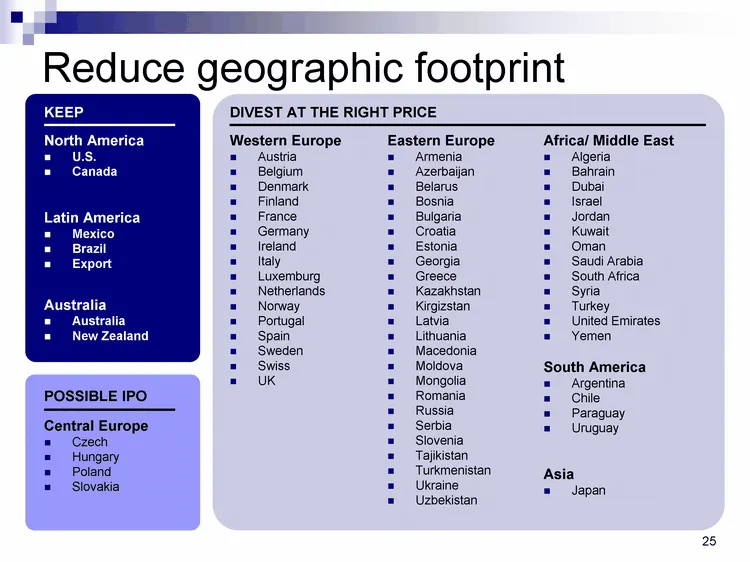
Reduce geographic footprint KEEP Eastern Europe Armenia Azerbaijan Belarus Bosnia Bulgaria Croatia Estonia Georgia Greece Kazakhstan Kirgizstan Latvia Lithuania Macedonia Moldova Mongolia Romania Russia Serbia Slovenia Tajikistan Turkmenistan Ukraine Uzbekistan Africa/ Middle East Algeria Bahrain Du
Slide 27: Simplify portfolio
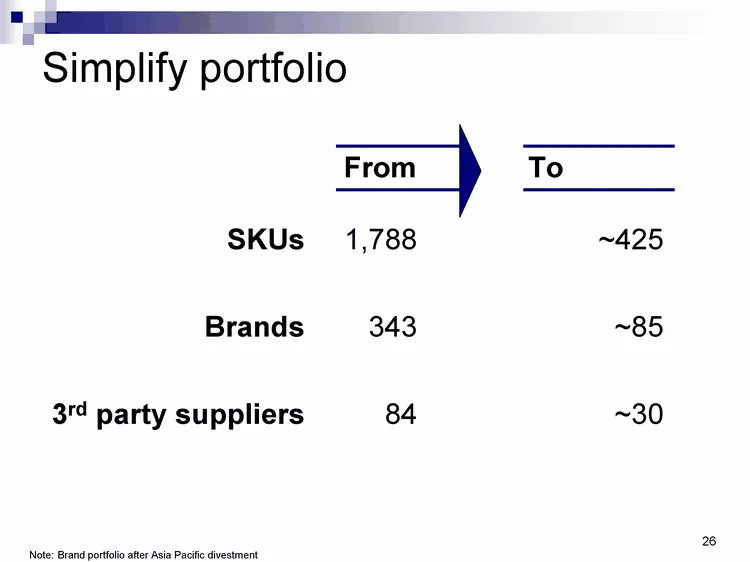
Simplify portfolio From SKUs To Brands 3rd party suppliers 1,788 343 84 ~425 ~85 ~30 Note: Brand portfolio after Asia Pacific divestment
Slide 28: Build management team
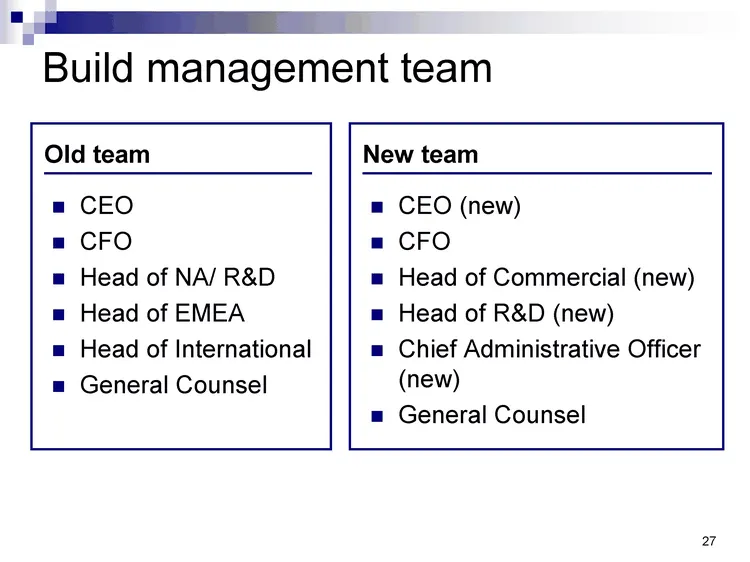
Build management team CEO CFO Head of NA/ R&D Head of EMEA Head of International General Counsel Old team CEO (new) CFO Head of Commercial (new) Head of R&D (new) Chief Administrative Officer (new) General Counsel New team
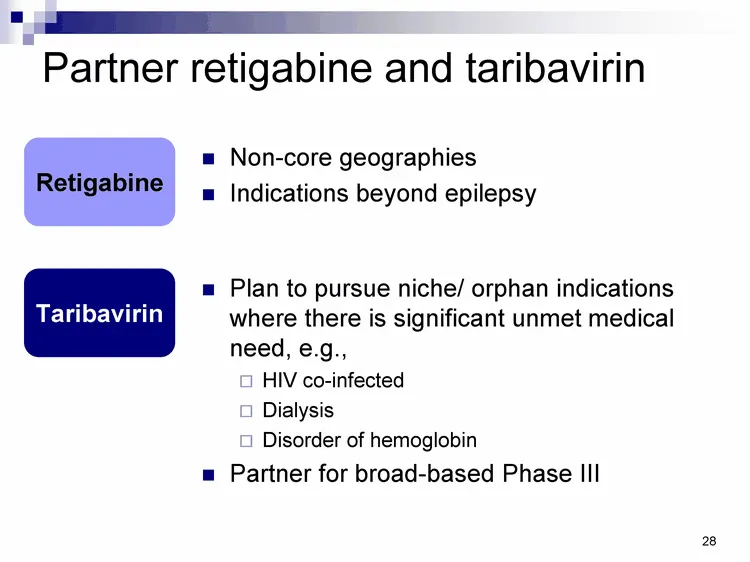
Slide 29: Partner retigabine and taribavirin
Partner retigabine and taribavirin Non-core geographies Indications beyond epilepsy Taribavirin Retigabine Plan to pursue niche/ orphan indications where there is significant unmet medical need, e.g., HIV co-infected Dialysis Disorder of hemoglobin Partner for broad-based Phase III
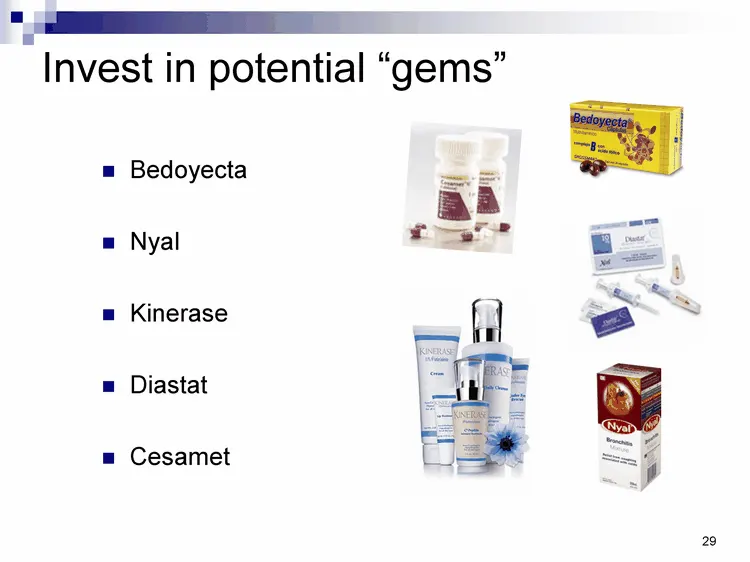
Slide 30: Invest in potential "gems"
Invest in potential "gems" Bedoyecta Nyal Kinerase Diastat Cesamet 40
Slide 31: Acquisition philosophy
Acquisition philosophy Get our own house in order Many "Valeants" in specialty pharma space characterized by Oversized infrastructure Excessive R&D spend A few potential "gems" (either in-line or development) Low multiples Once credibility earned, consider targeted acquisitions in our core therapeut
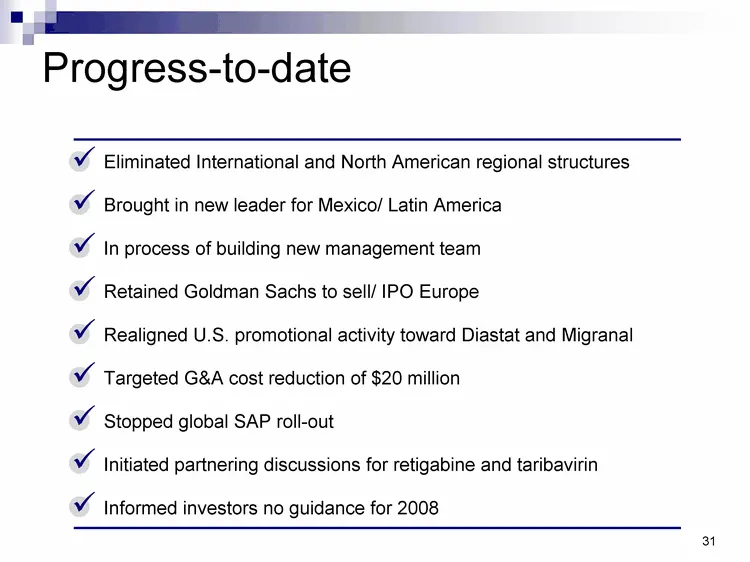
Slide 32: Progress-to-date
Progress-to-date Eliminated International and North American regional structures Brought in new leader for Mexico/ Latin America In process of building new management team Retained Goldman Sachs to sell/ IPO Europe Realigned U.S. promotional activity toward Diastat and Migranal Targeted G&A cost red
Slide 33: Results of new strategy
Results of new strategy Initial revenue reduction from sale of non-core geographies Strong growth prospects in core geographies and therapeutic/ business areas Reduced product/ market complexity Reinvest cash in appropriate mix of Internal investment Share repurchases Debt reduction Acquisitions
Slide 34: Today's agenda
Today's agenda Summary conclusions What I found - first 60 days What gives me confidence about our future New strategy Pipeline update
Slide 35: Retigabine
Retigabine Positive data from RESTORE1 Confirms efficacy observed at 1200 mg dose in Study 205 Confirms potential utility of potassium channel openers in epilepsy Ongoing development activities Complete RESTORE2 Prepare regulatory submissions to FDA and EMEA Continue work on modified release formula
Slide 36: Taribavirin
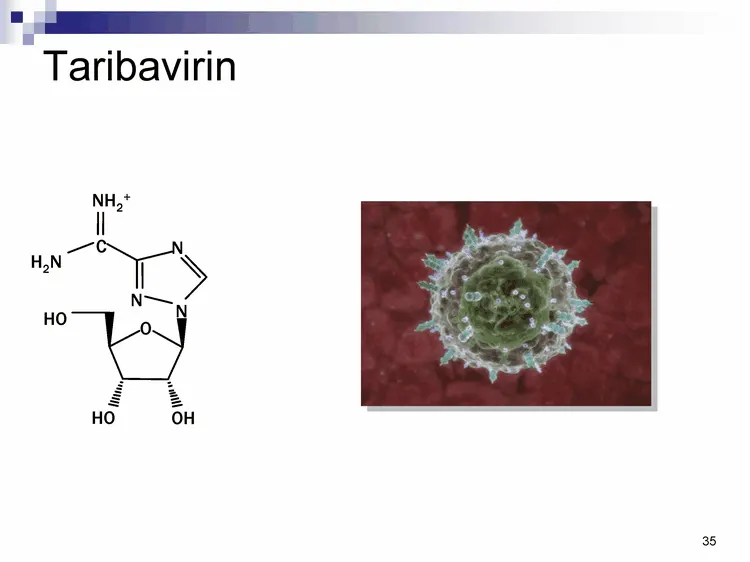
Taribavirin O HO HO OH N N N C NH2+ H2N Cl-
Slide 37: Taribavirin Phase 2b Study Design
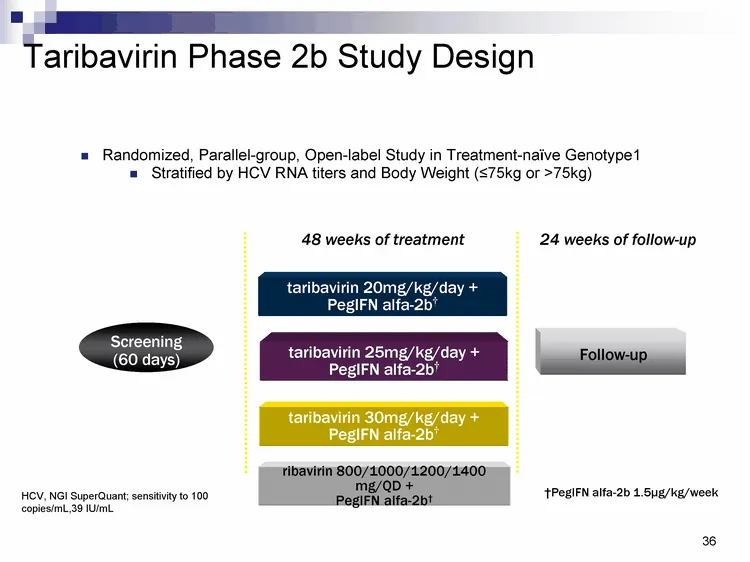
Taribavirin Phase 2b Study Design Randomized, Parallel-group, Open-label Study in Treatment-naive Genotype1 Stratified by HCV RNA titers and Body Weight (^75kg or >75kg) 24 weeks of follow-up 48 weeks of treatment taribavirin 25mg/kg/day + PegIFN alfa-2b† taribavirin 20mg/kg/day + PegIFN alfa-2b† ta
Slide 38: Summary patient characteristics
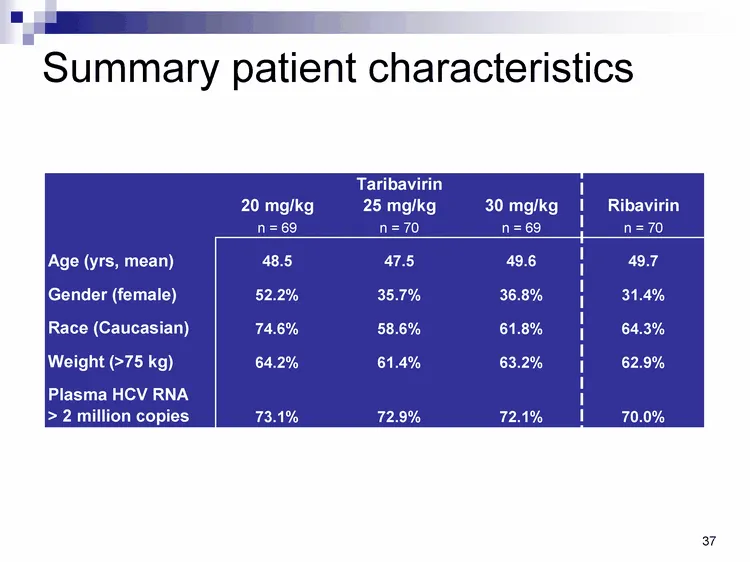
Summary patient characteristics
Slide 39: ITT TW4 (undetectable)
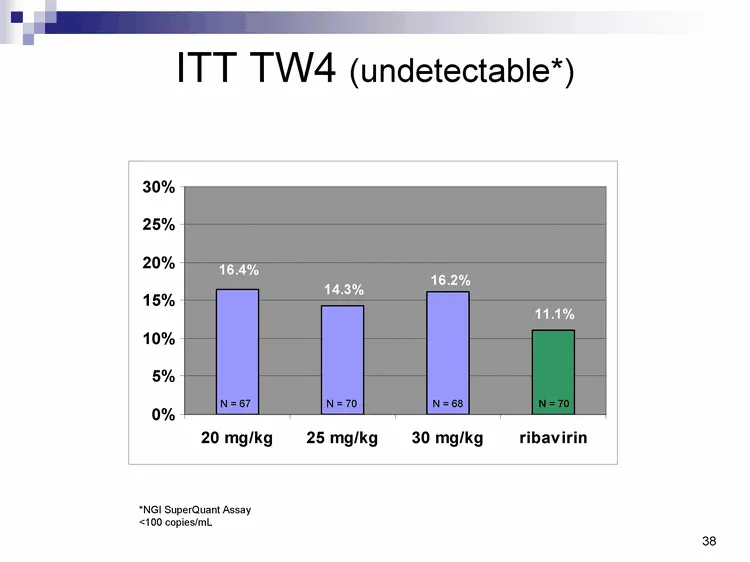
ITT TW4 (undetectable*) *NGI SuperQuant Assay <100 copies/mL N = 67 N = 70 N = 68 N = 70
Slide 40: ITT TW12 responders
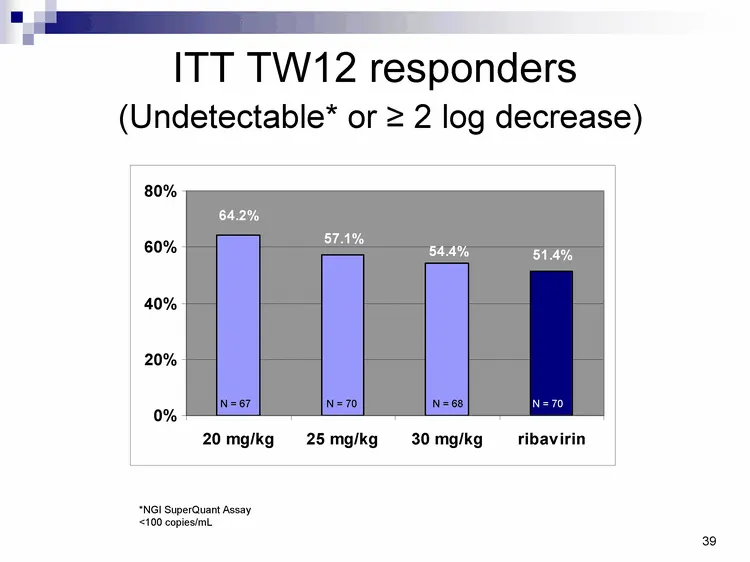
ITT TW12 responders (Undetectable* or ^ 2 log decrease) *NGI SuperQuant Assay <100 copies/mL N = 67 N = 70 N = 68 N = 70
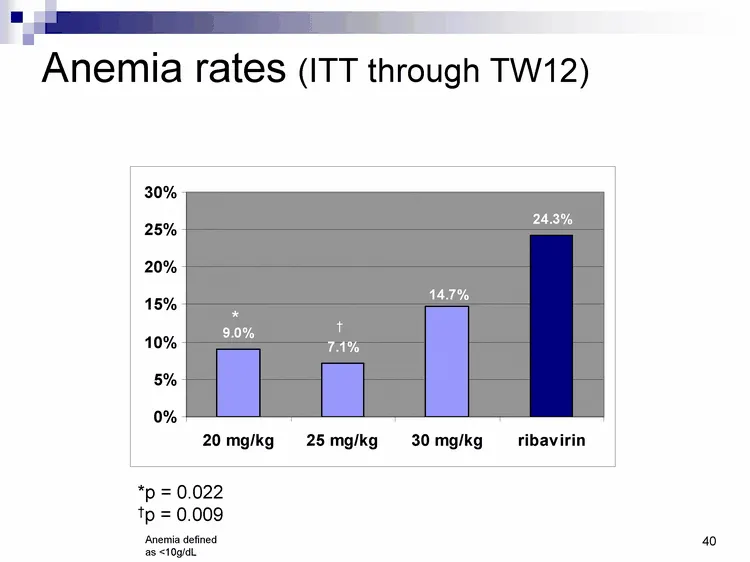
Slide 41: Anemia rates (ITT through TW12)
Anemia rates (ITT through TW12) * † *p = 0.022 †p = 0.009 Anemia defined as <10g/dL

Slide 42: VEE ANG
VEE ANG Pharmaceuticals International
Source: SEC EDGAR · 8-K filed Mar 27, 2008
More decks from Valeant Pharmaceuticals International Inc
 Q2 2010 Earnings Presentation25 slides · Aug 3, 2010
 Q2 2010 Earnings Presentation25 slides · Aug 2, 2010
 Merger or Acquisition (June 2010)22 slides · Jun 21, 2010
 Merger or Acquisition (December 2008)14 slides · Dec 10, 2008
 Technical Presentation (May 2008)20 slides · May 13, 2008
 Technical Presentation (February 2008)16 slides · Feb 14, 2008