Montpelier Re — Investor Day (June 2004)
50 slides from Montpelier Re's investor day presentation, Jun 4, 2004

Slide 1: Montpelier Re Investor Day, June 4th, 2004
Exhibit Montpelier June 4th,99.1 2004 Re Investor Day
Slide 2: Opening Remarks and Introduction of Montpelier Re Management
Opening Remarks Anthony Chairman, Taylor President andand Introduction Chief Executive of Montpelier Officer Re Management
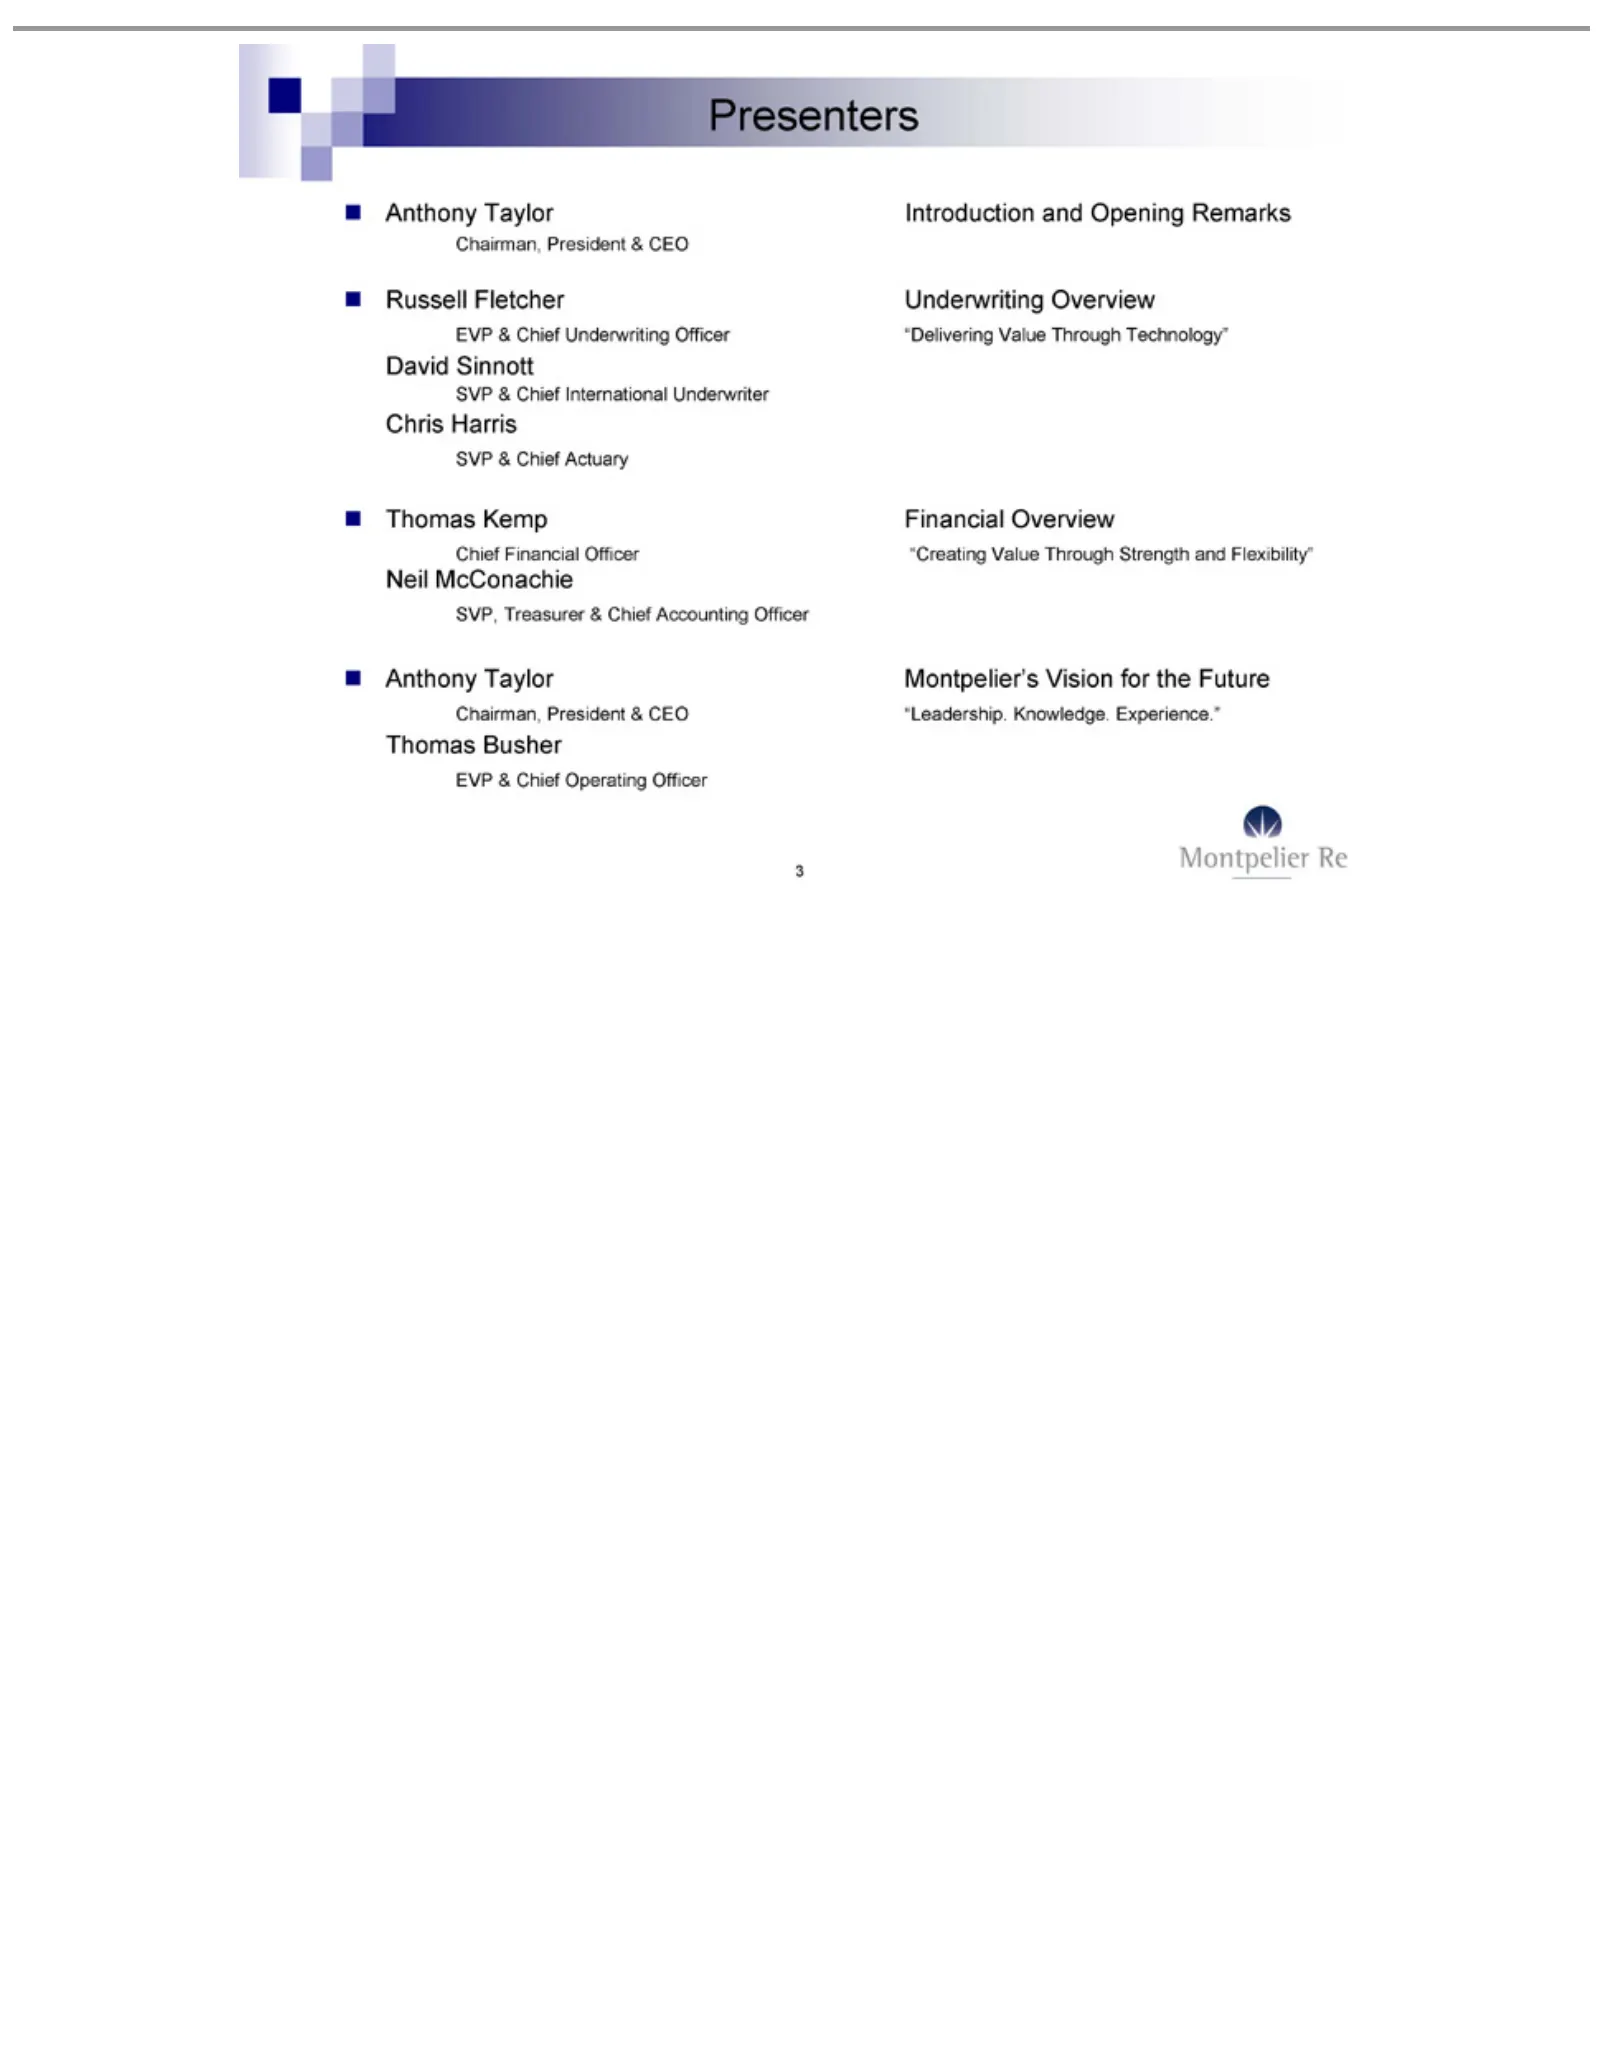
Slide 3: Presenters
Presenters Russell David Chris SVP Chief Financial “Creating Neil SVP, Anthony Chairman, Montpelier’s “Leadership. Thomas 3EVP McConachie &Treasurer Harris Financial Sinnott Chief Fletcher Kemp Busher Taylor Overview Value President Vision Knowledge. Actuary International Underwriting Operating &Off
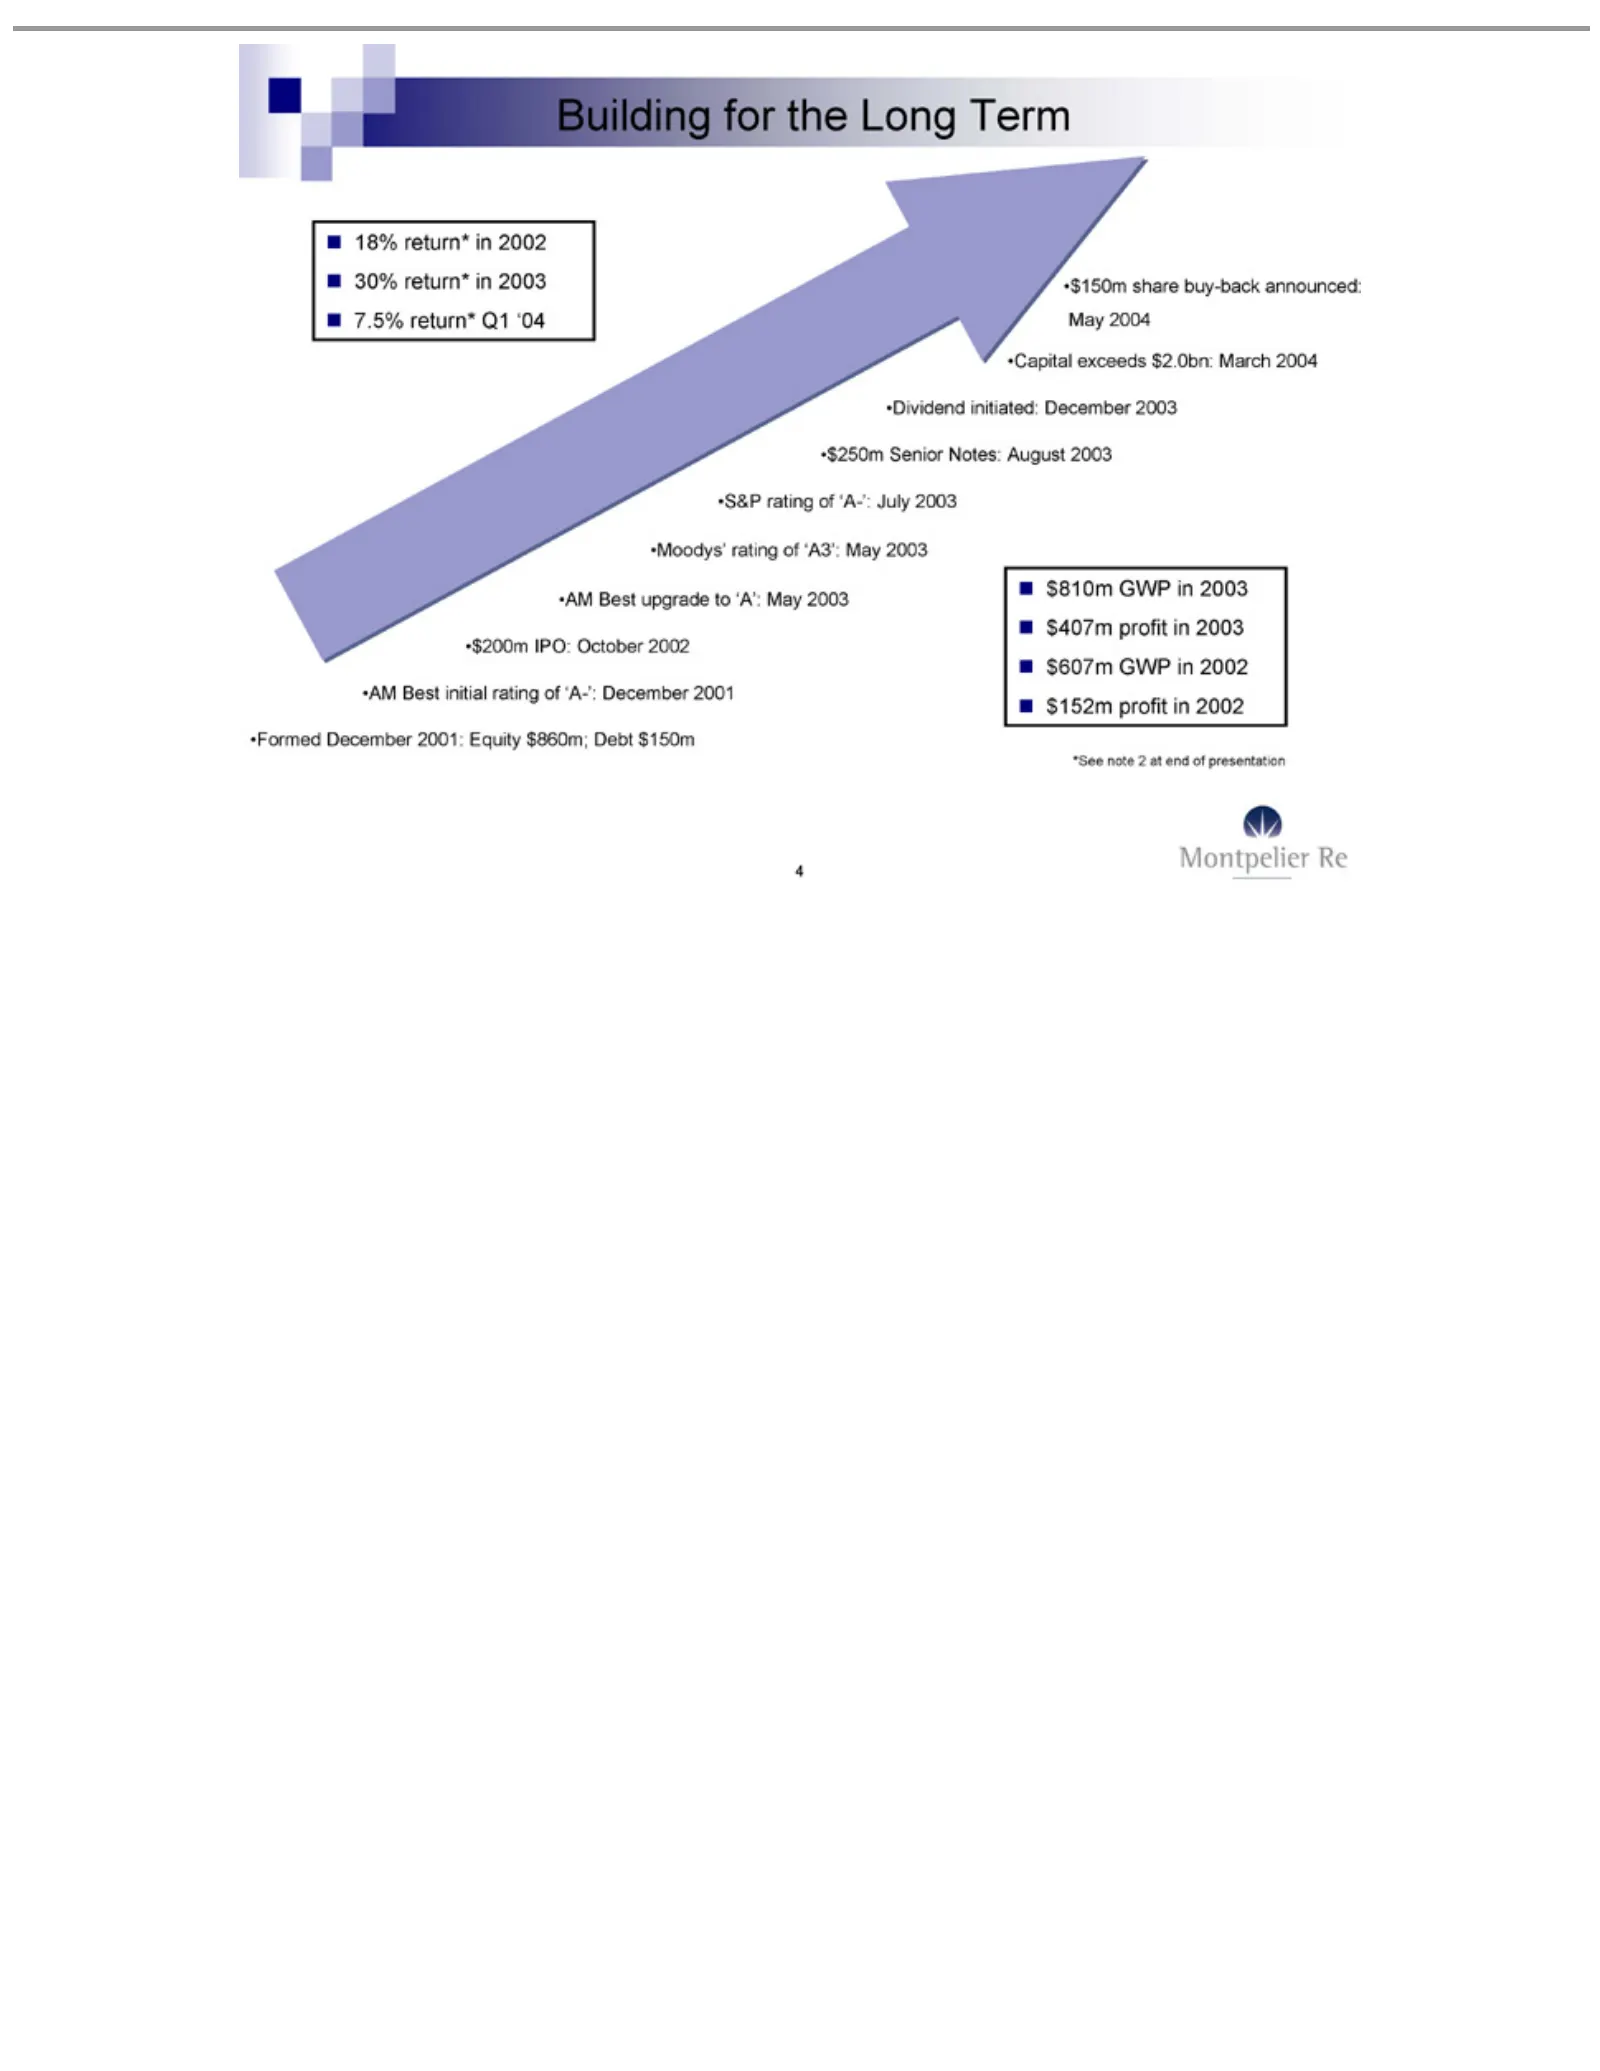
Slide 4: Building Capital
Building 18% $150m Capital Dividend S&P $Moodys’ AM Formed $810m $407m $607m $152m 4*See 250m 200m Best return* rating note share GWP profit exceeds Senior IPO: December for rating upgrade initial initiated: 2of atthe inbuy-back October in‘A-’: end Notes: 2002 of rating 2003 2002 $2.0bn: Long to ‘A3
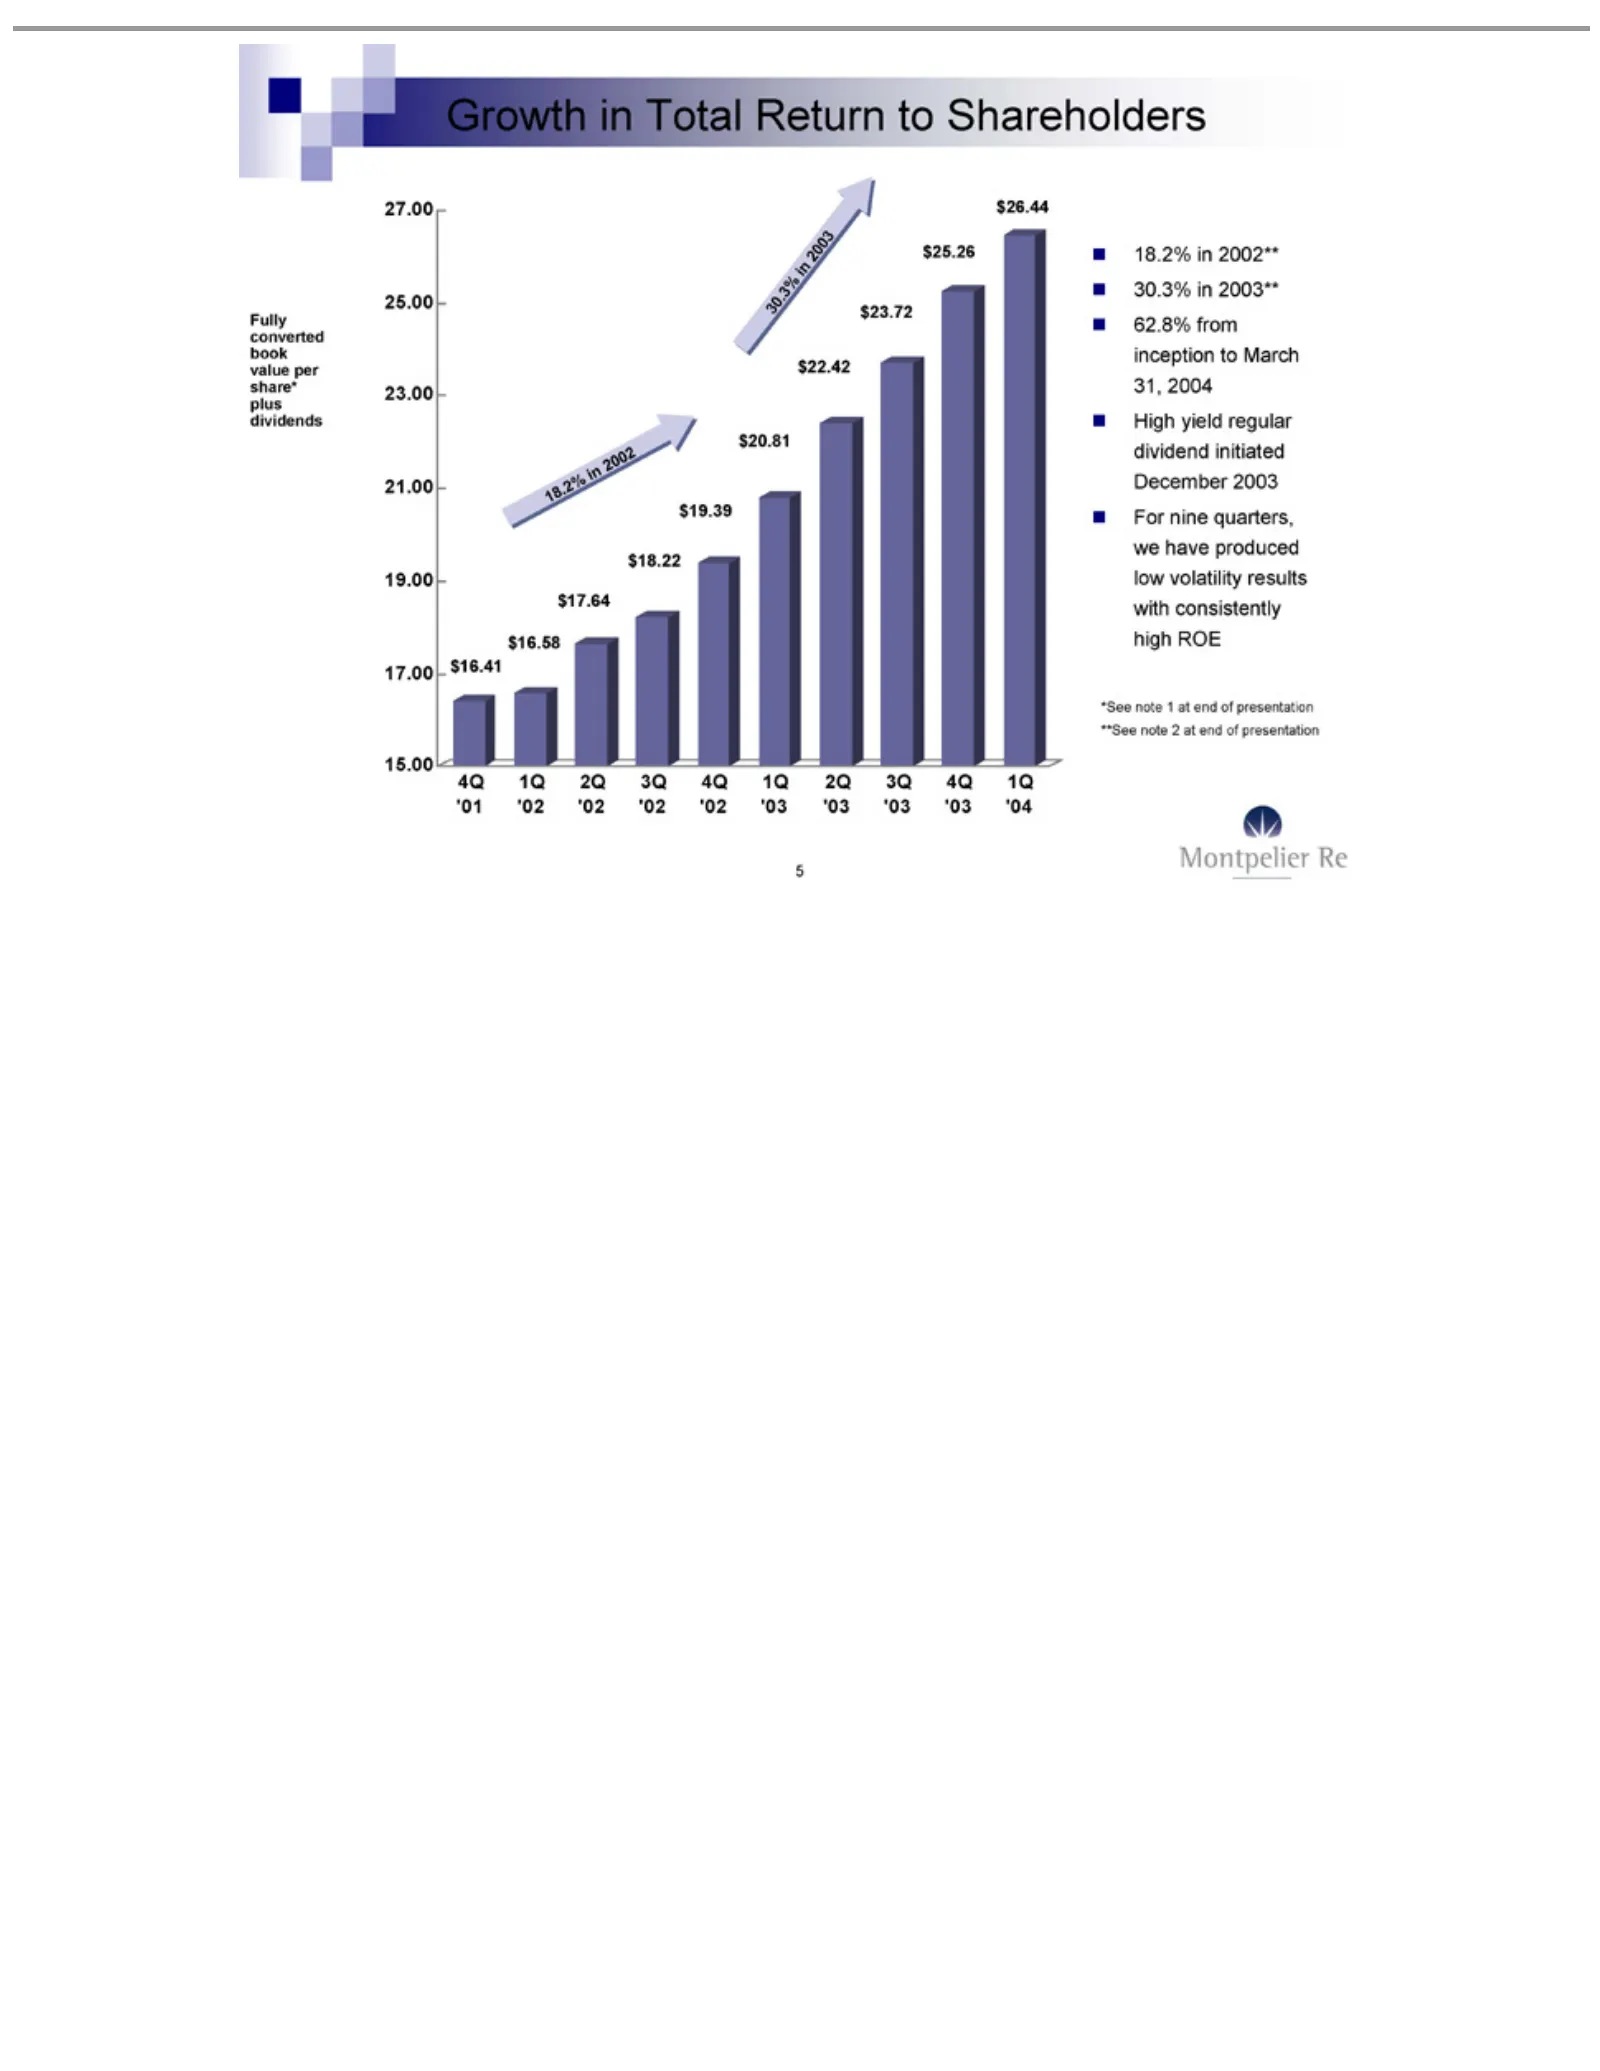
Slide 5: Growth in Fully Converted Book Value per Share
Growth Fully $16.41 15.00 17.00 19.00 21.00 23.00 25.00 27.00 4Q 18.2% 30.3% 62.8% High For 5*See ‘01 nine note yield converted in from $16.58 1Q inquarters, 2002** 2003** 1Total regular ‘02 at inception end $17.64 2Q book Return we dividend of ‘02presentation have value to $18.22 3Q toMarch Shareho
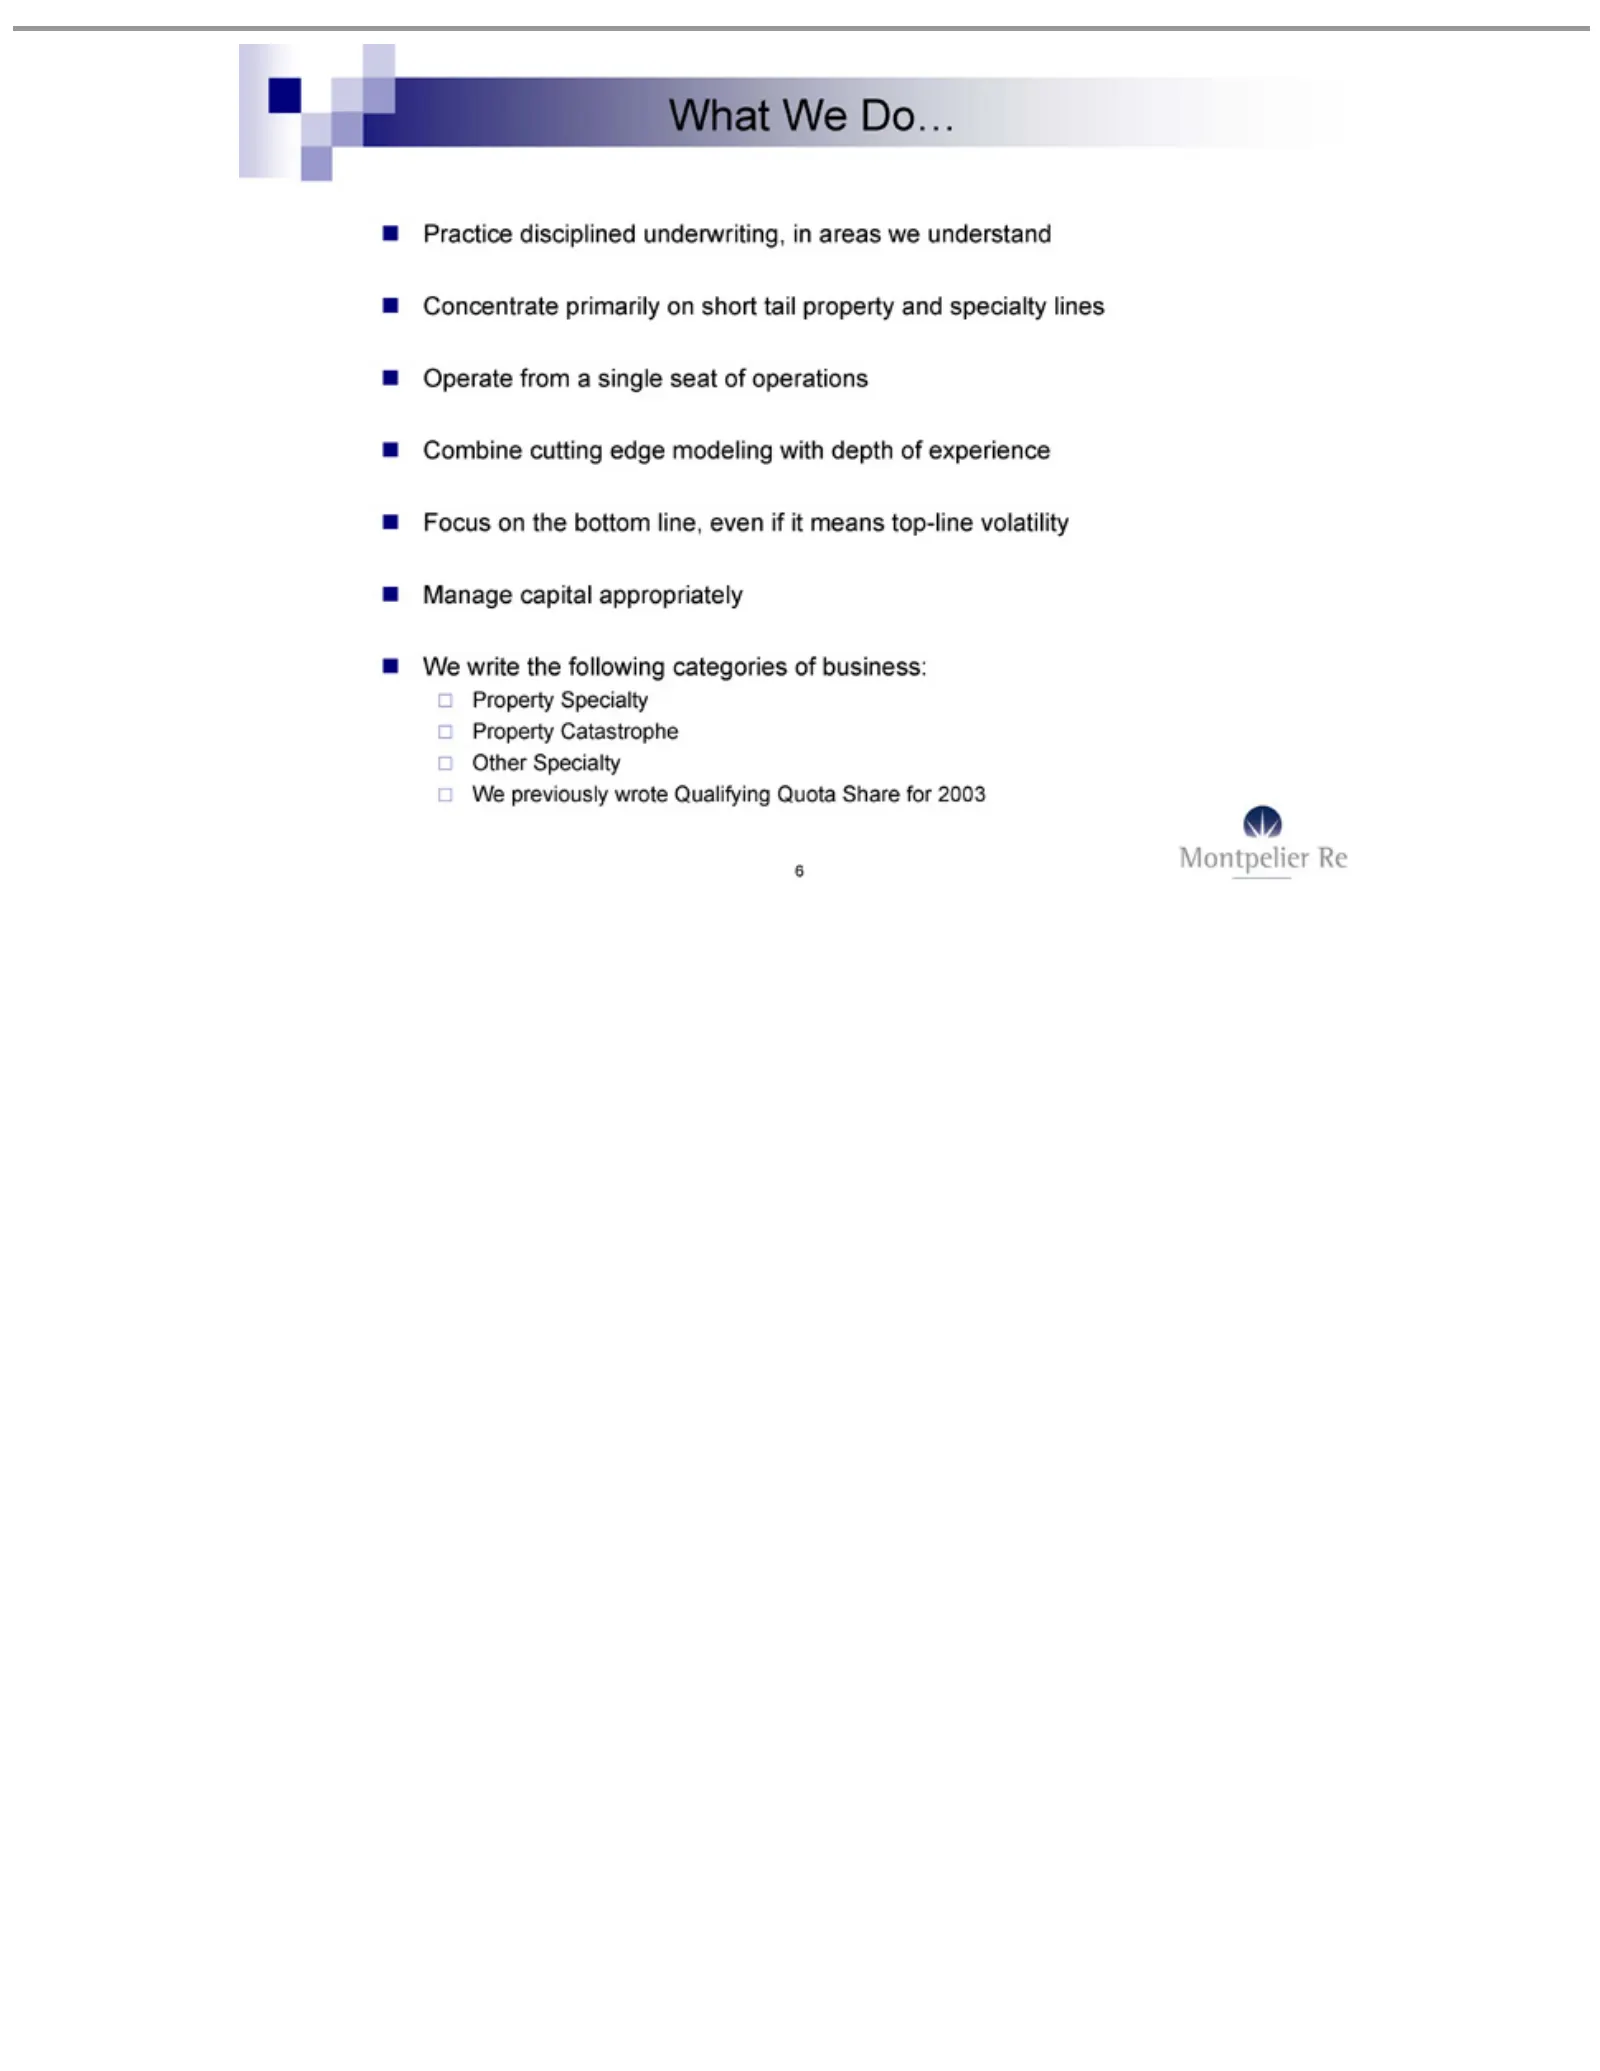
Slide 6: What We Do: Practice, Concentrate, Operate
What Practice Concentrate Operate Combine Focus Manage Property Other 6We write previously We Specialty onfrom disciplined capital Specialty Catastrophe the cutting Do…primarily following bottom awrote single appropriately edge underwriting, line, Qualifying seat on modeling categories short even of
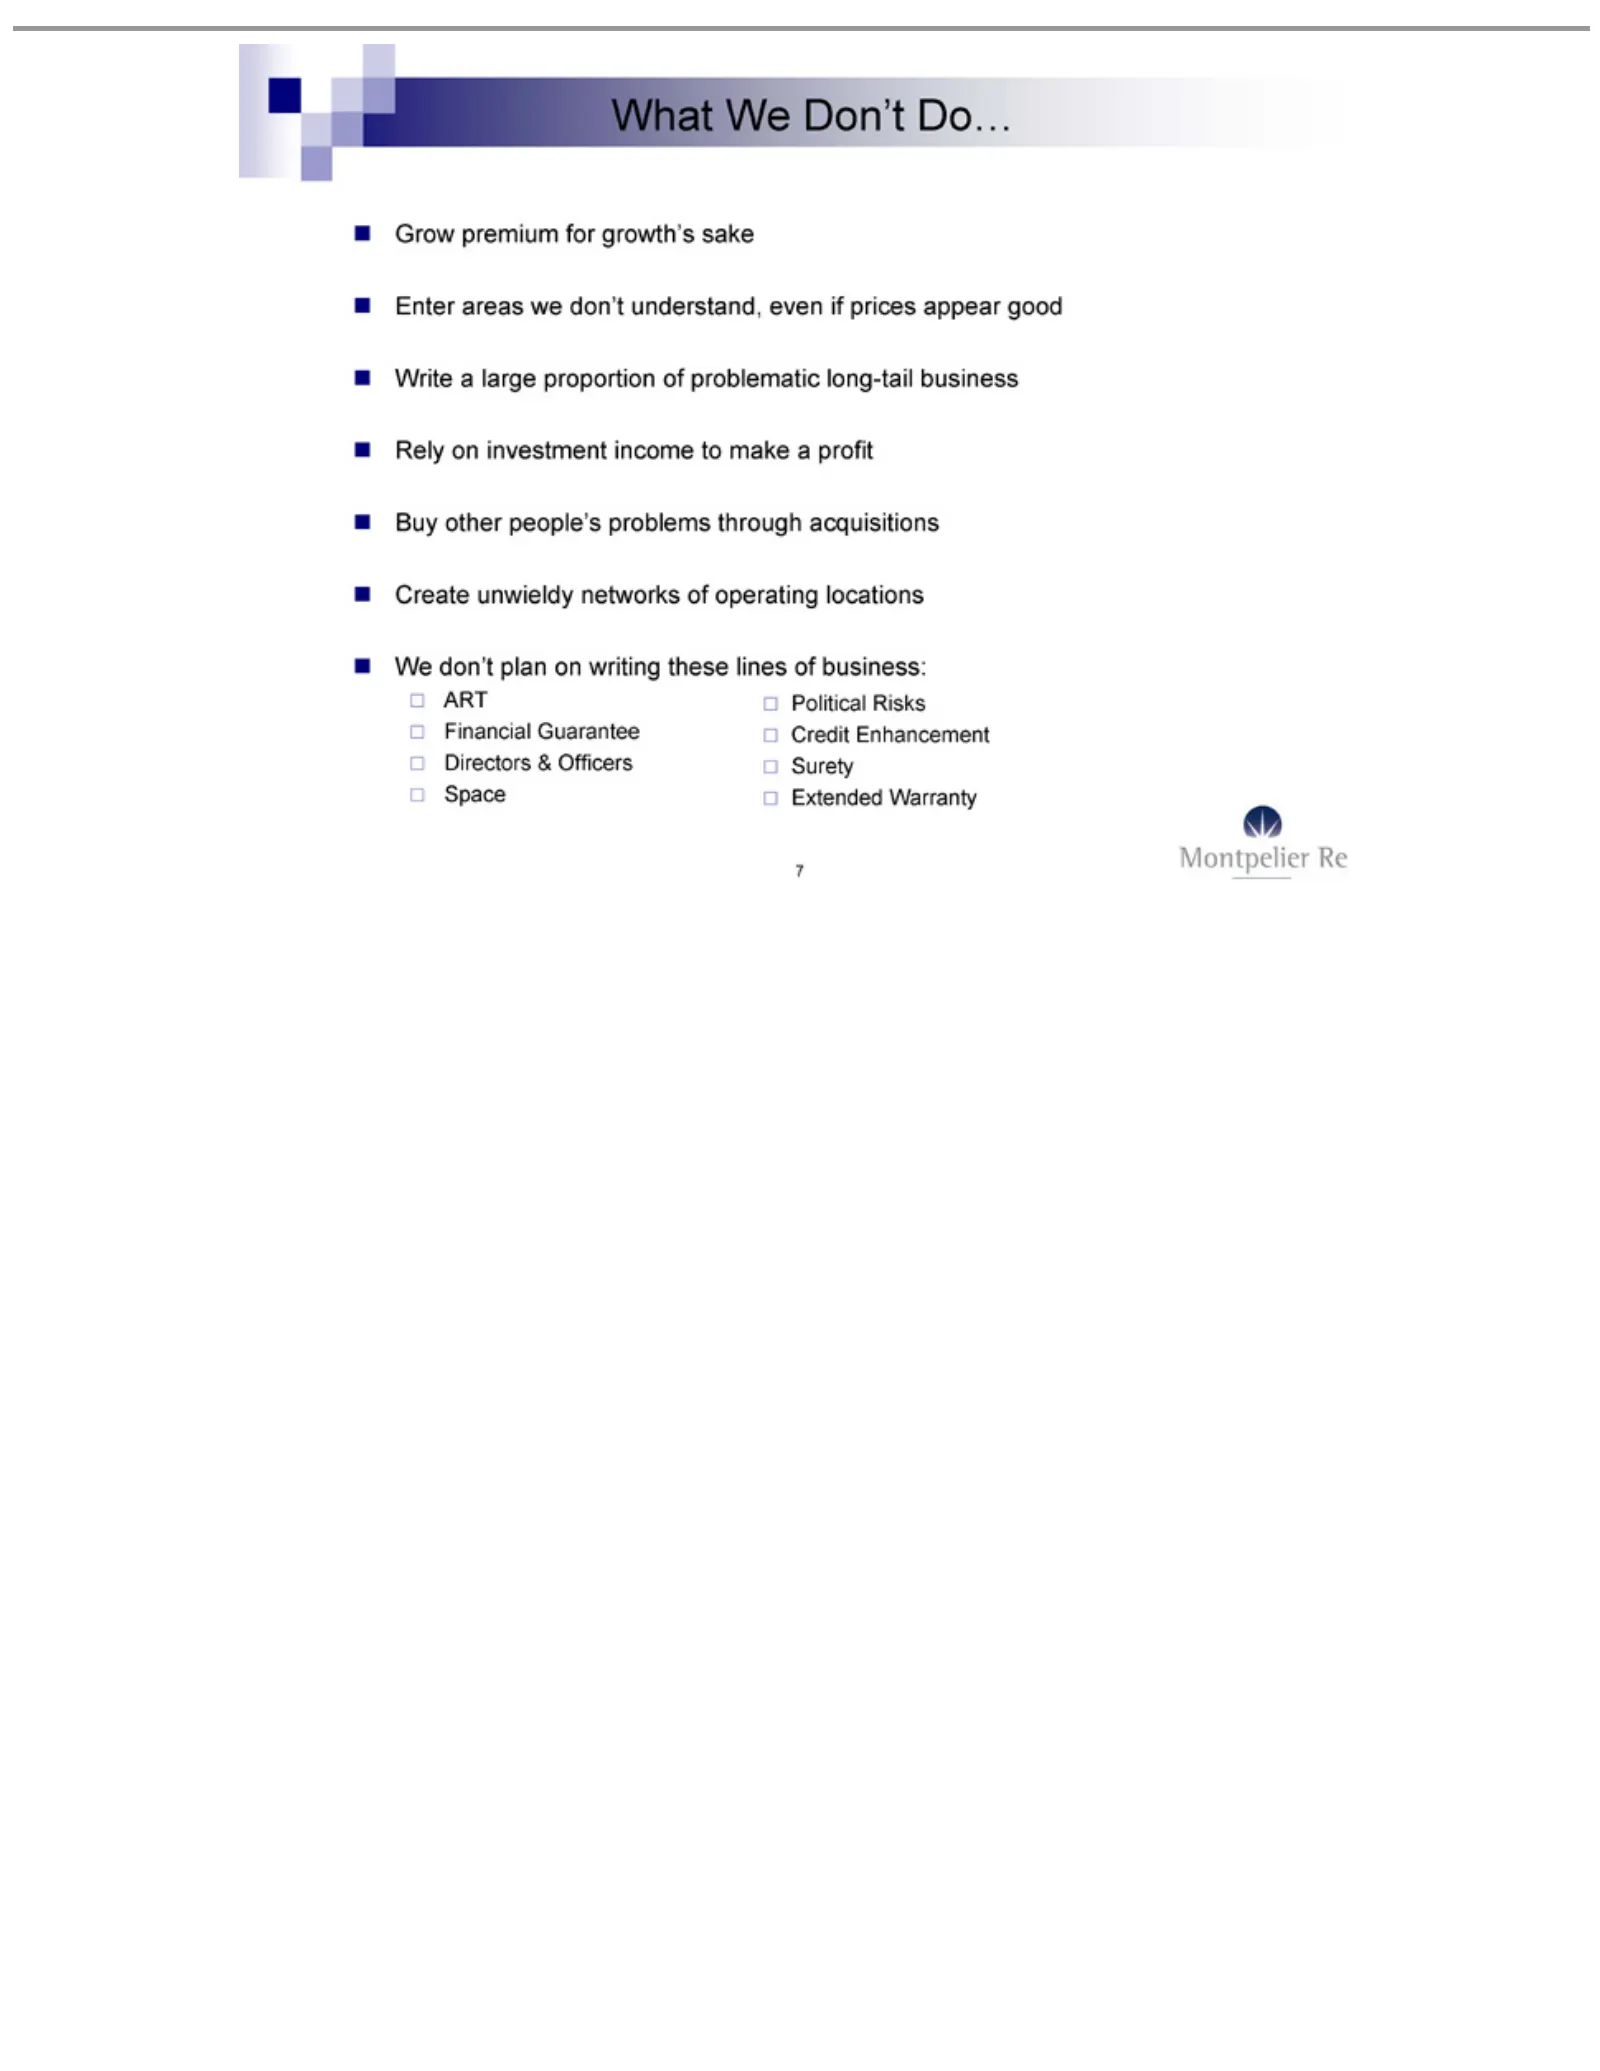
Slide 7: What We Don't Do
What Grow Enter Write Rely Buy Create We ART Financial Directors 7Space don’t other on Political We areas apremium Extended unwieldy large investment plan Don’t & Guarantee people’s we Officers proportion Risks on don’t for Do… Warranty networks writing growth’s problems income Credit understand, Su
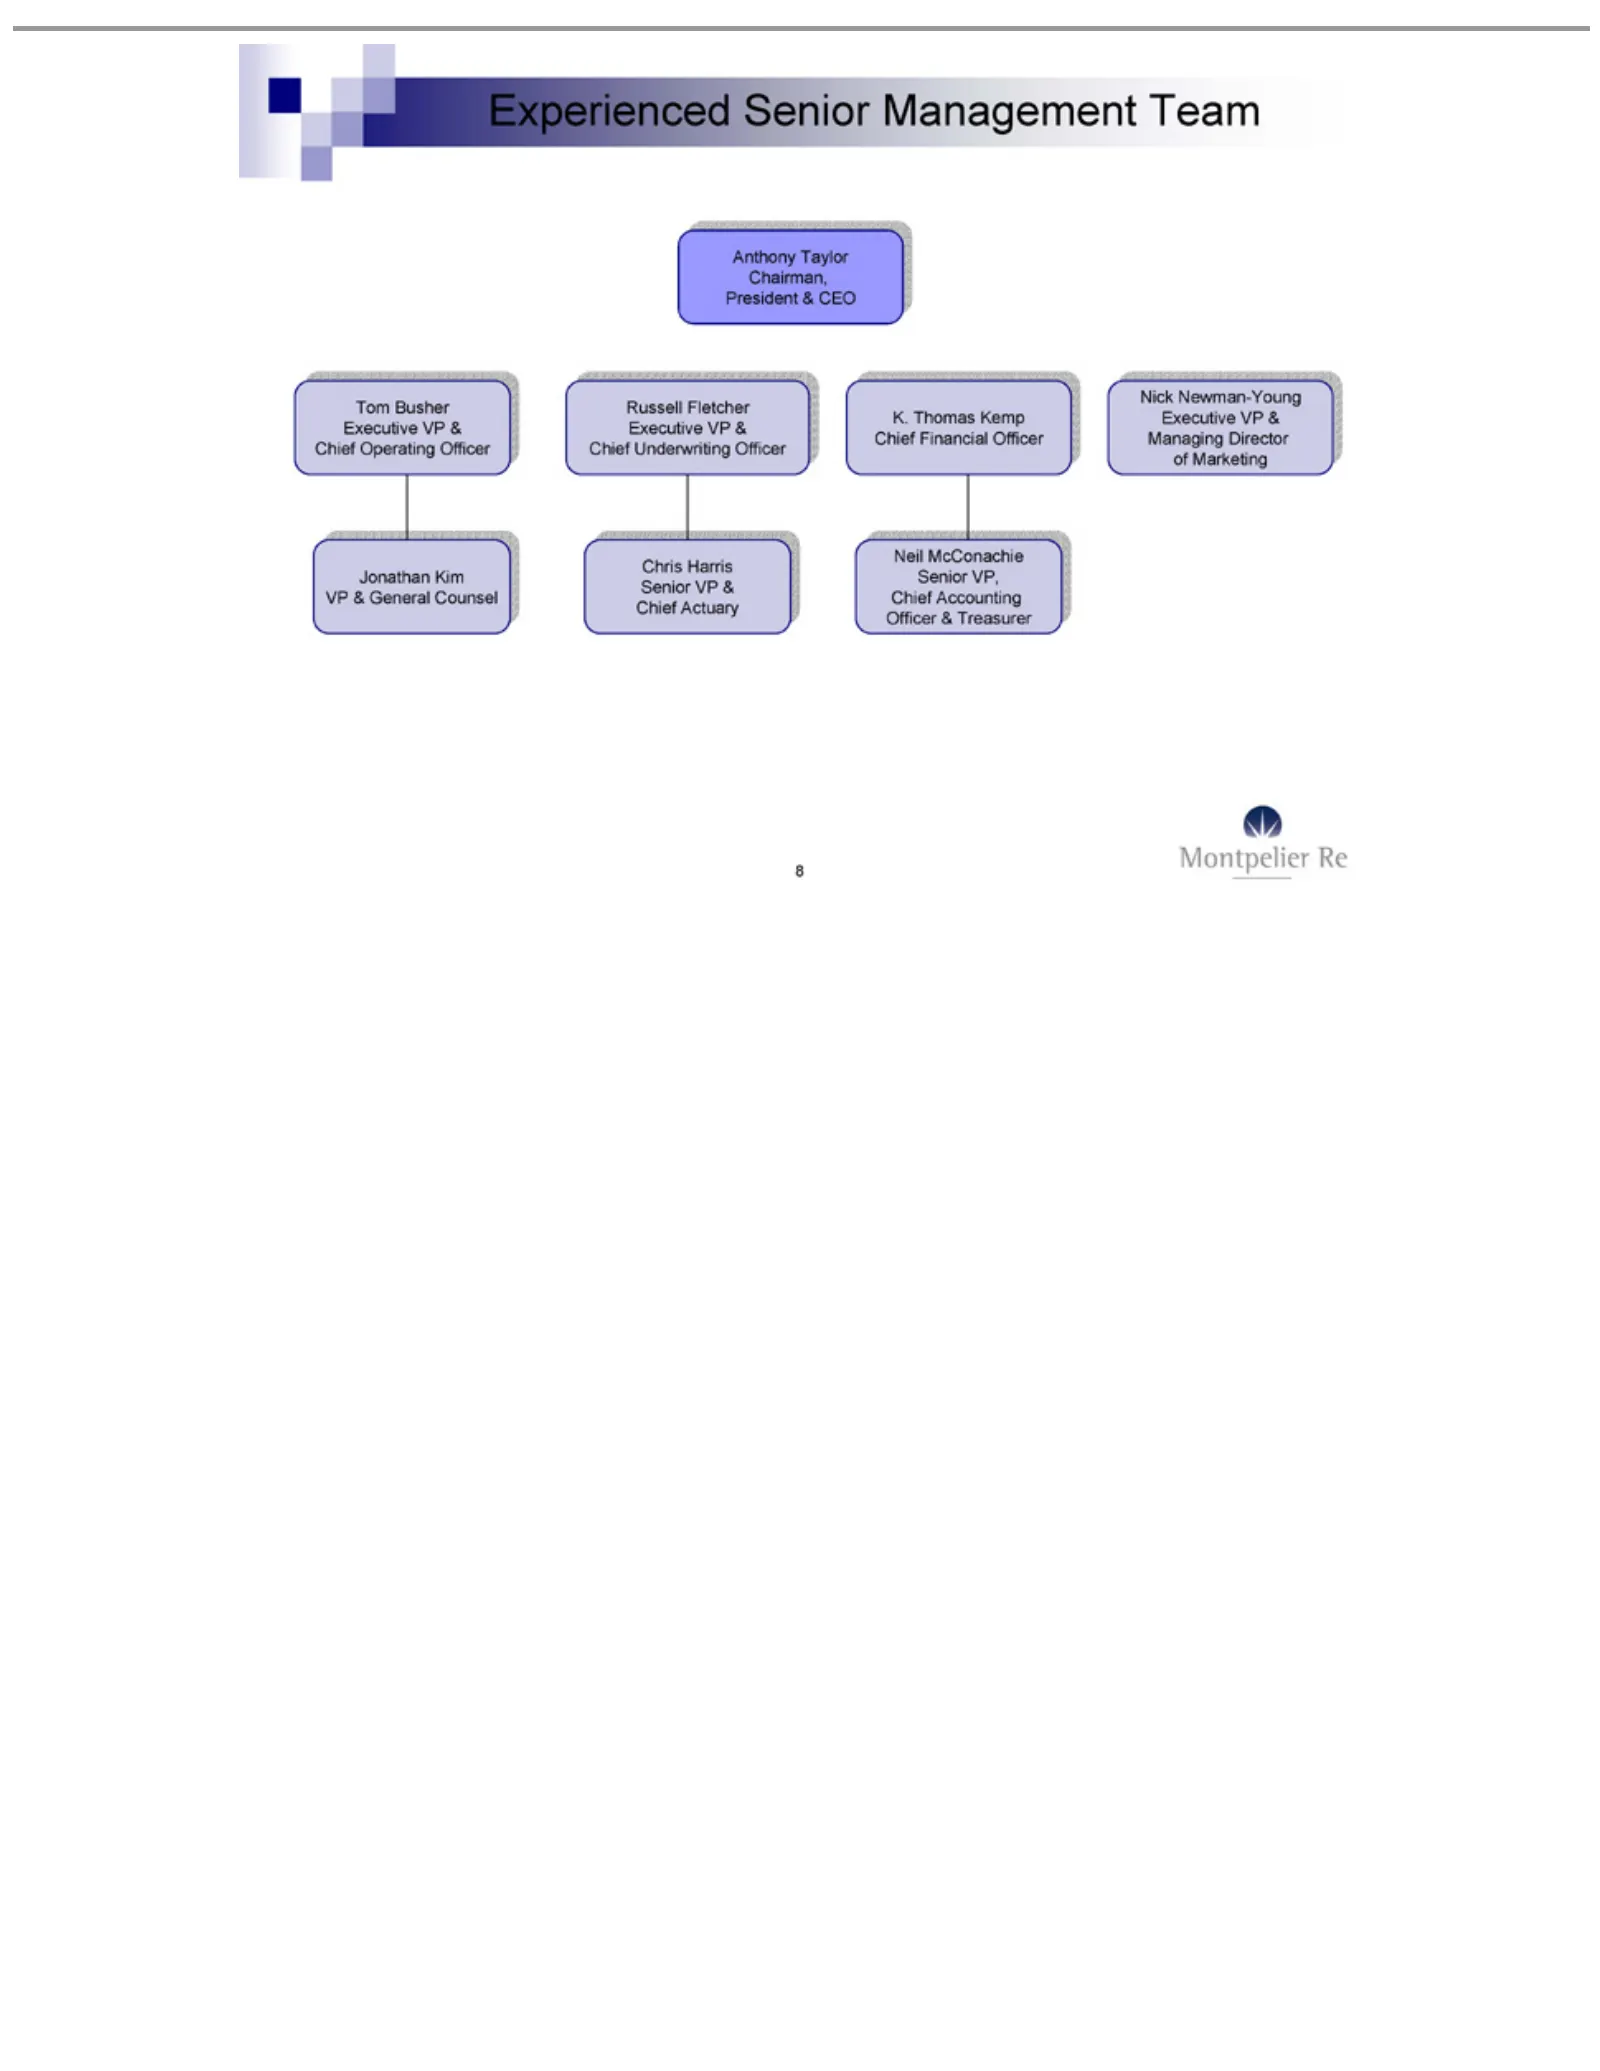
Slide 8: Experienced Management Team
Experienced Anthony Tom Russell K. Nick Jonathan Chris 8Neil Thomas McConachie Busher Newman-Young Harris Fletcher Taylor Kim Kemp Executive Senior VPChairman, Executive & Senior Chief VP Management General Executive VP &Financial VP, Chief &VP President Counsel Chief &Actuary VP Chief Team Officer
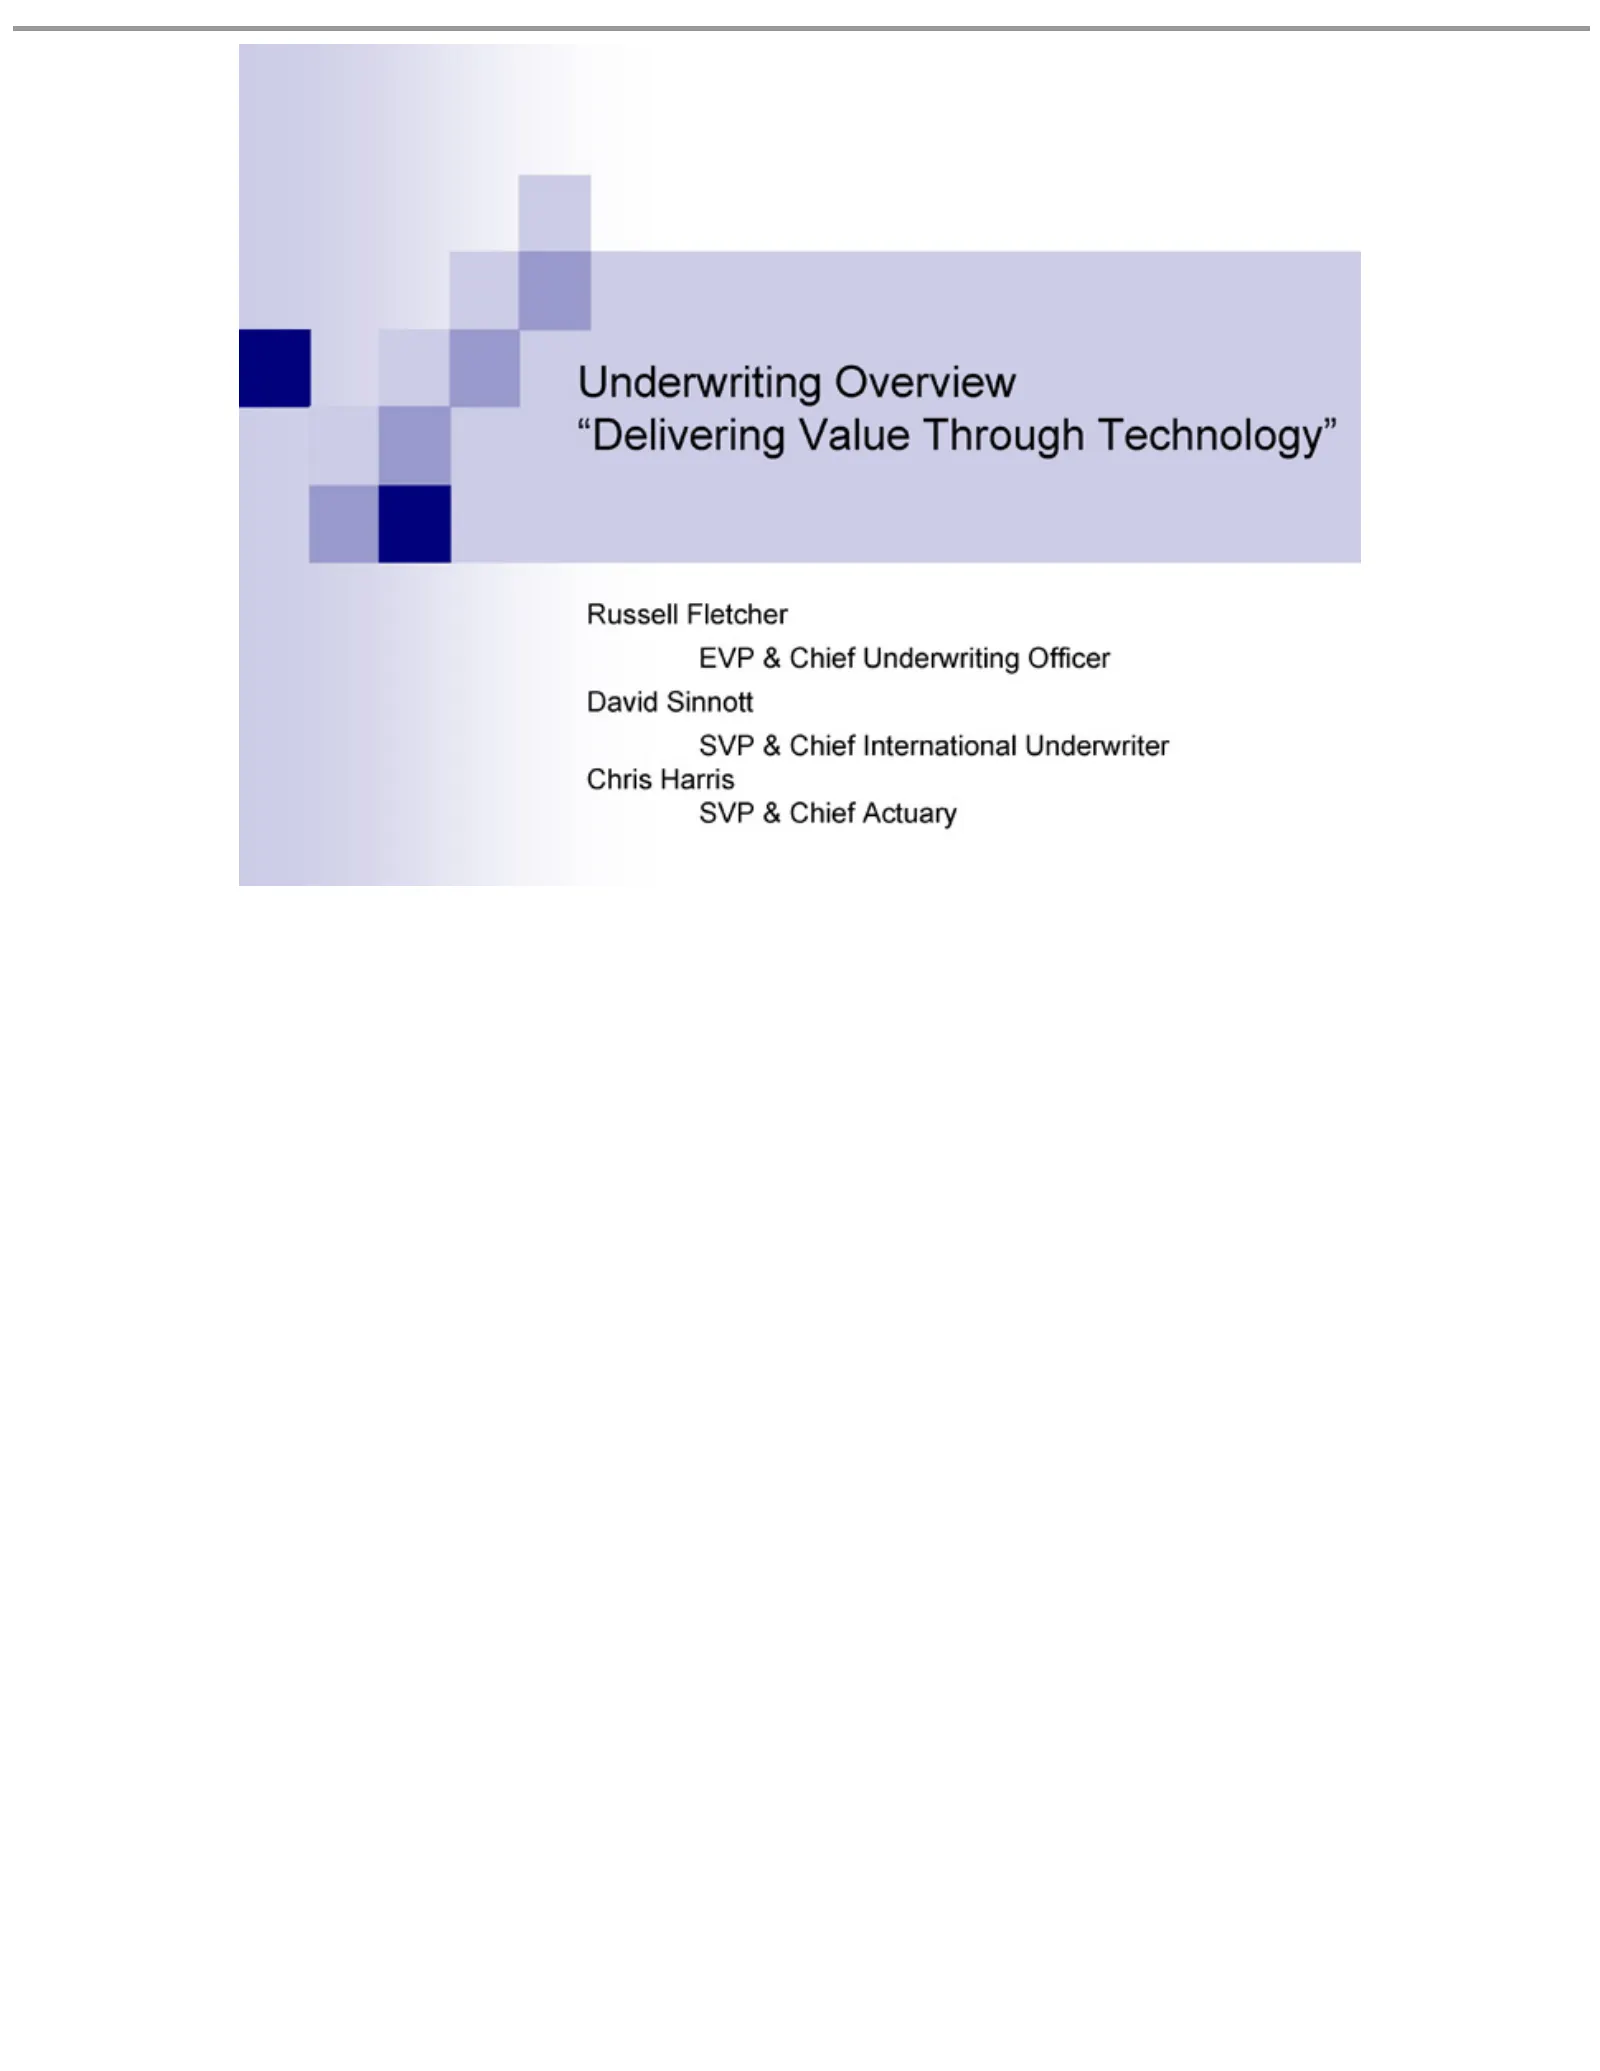
Slide 9: Underwriting: Delivering Value Through Technology
Underwriting “Delivering Russell EVP David SVP Chris&Harris Sinnott Chief Fletcher Value SVP International Underwriting Overview &Through Chief Actuary Underwriter Technology” Officer
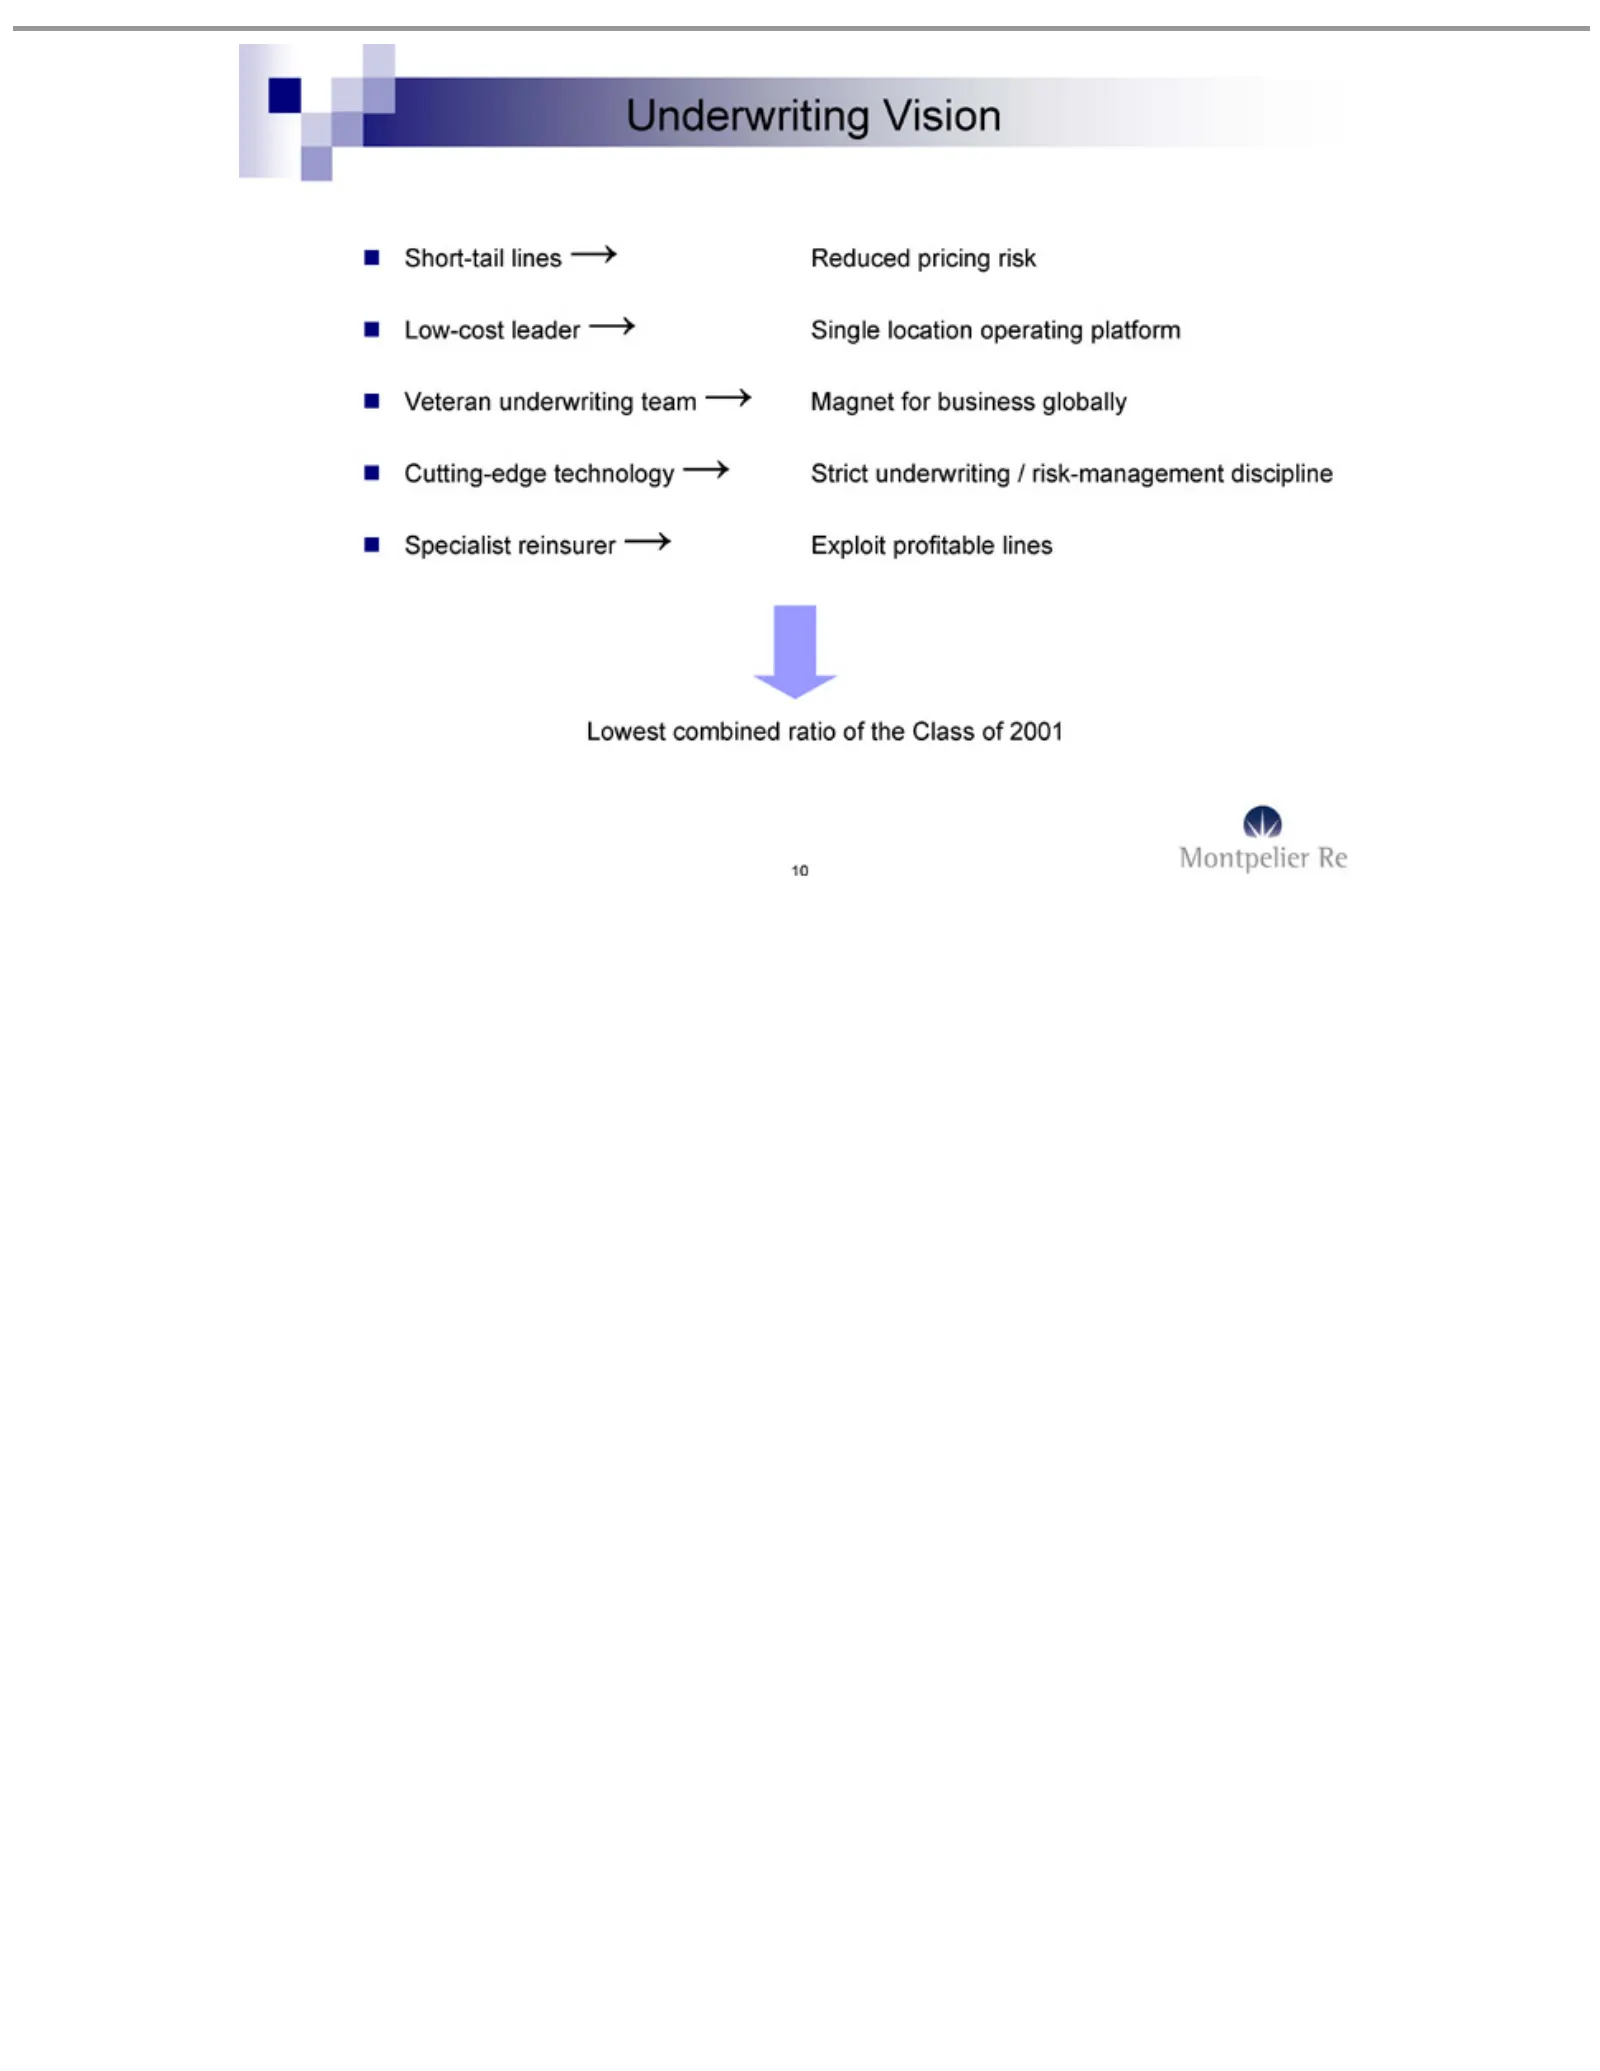
Slide 10: Underwriting Vision
Underwriting Short-tail Low-cost Veteran Cutting-edge Specialist Lowest 10 combined underwriting leader lines reinsurer technology Vision Reduced Single ratio Exploit team of location pricing Strict the Magnet profitable Class underwriting operating riskfor oflines 2001 business platform / risk-mana
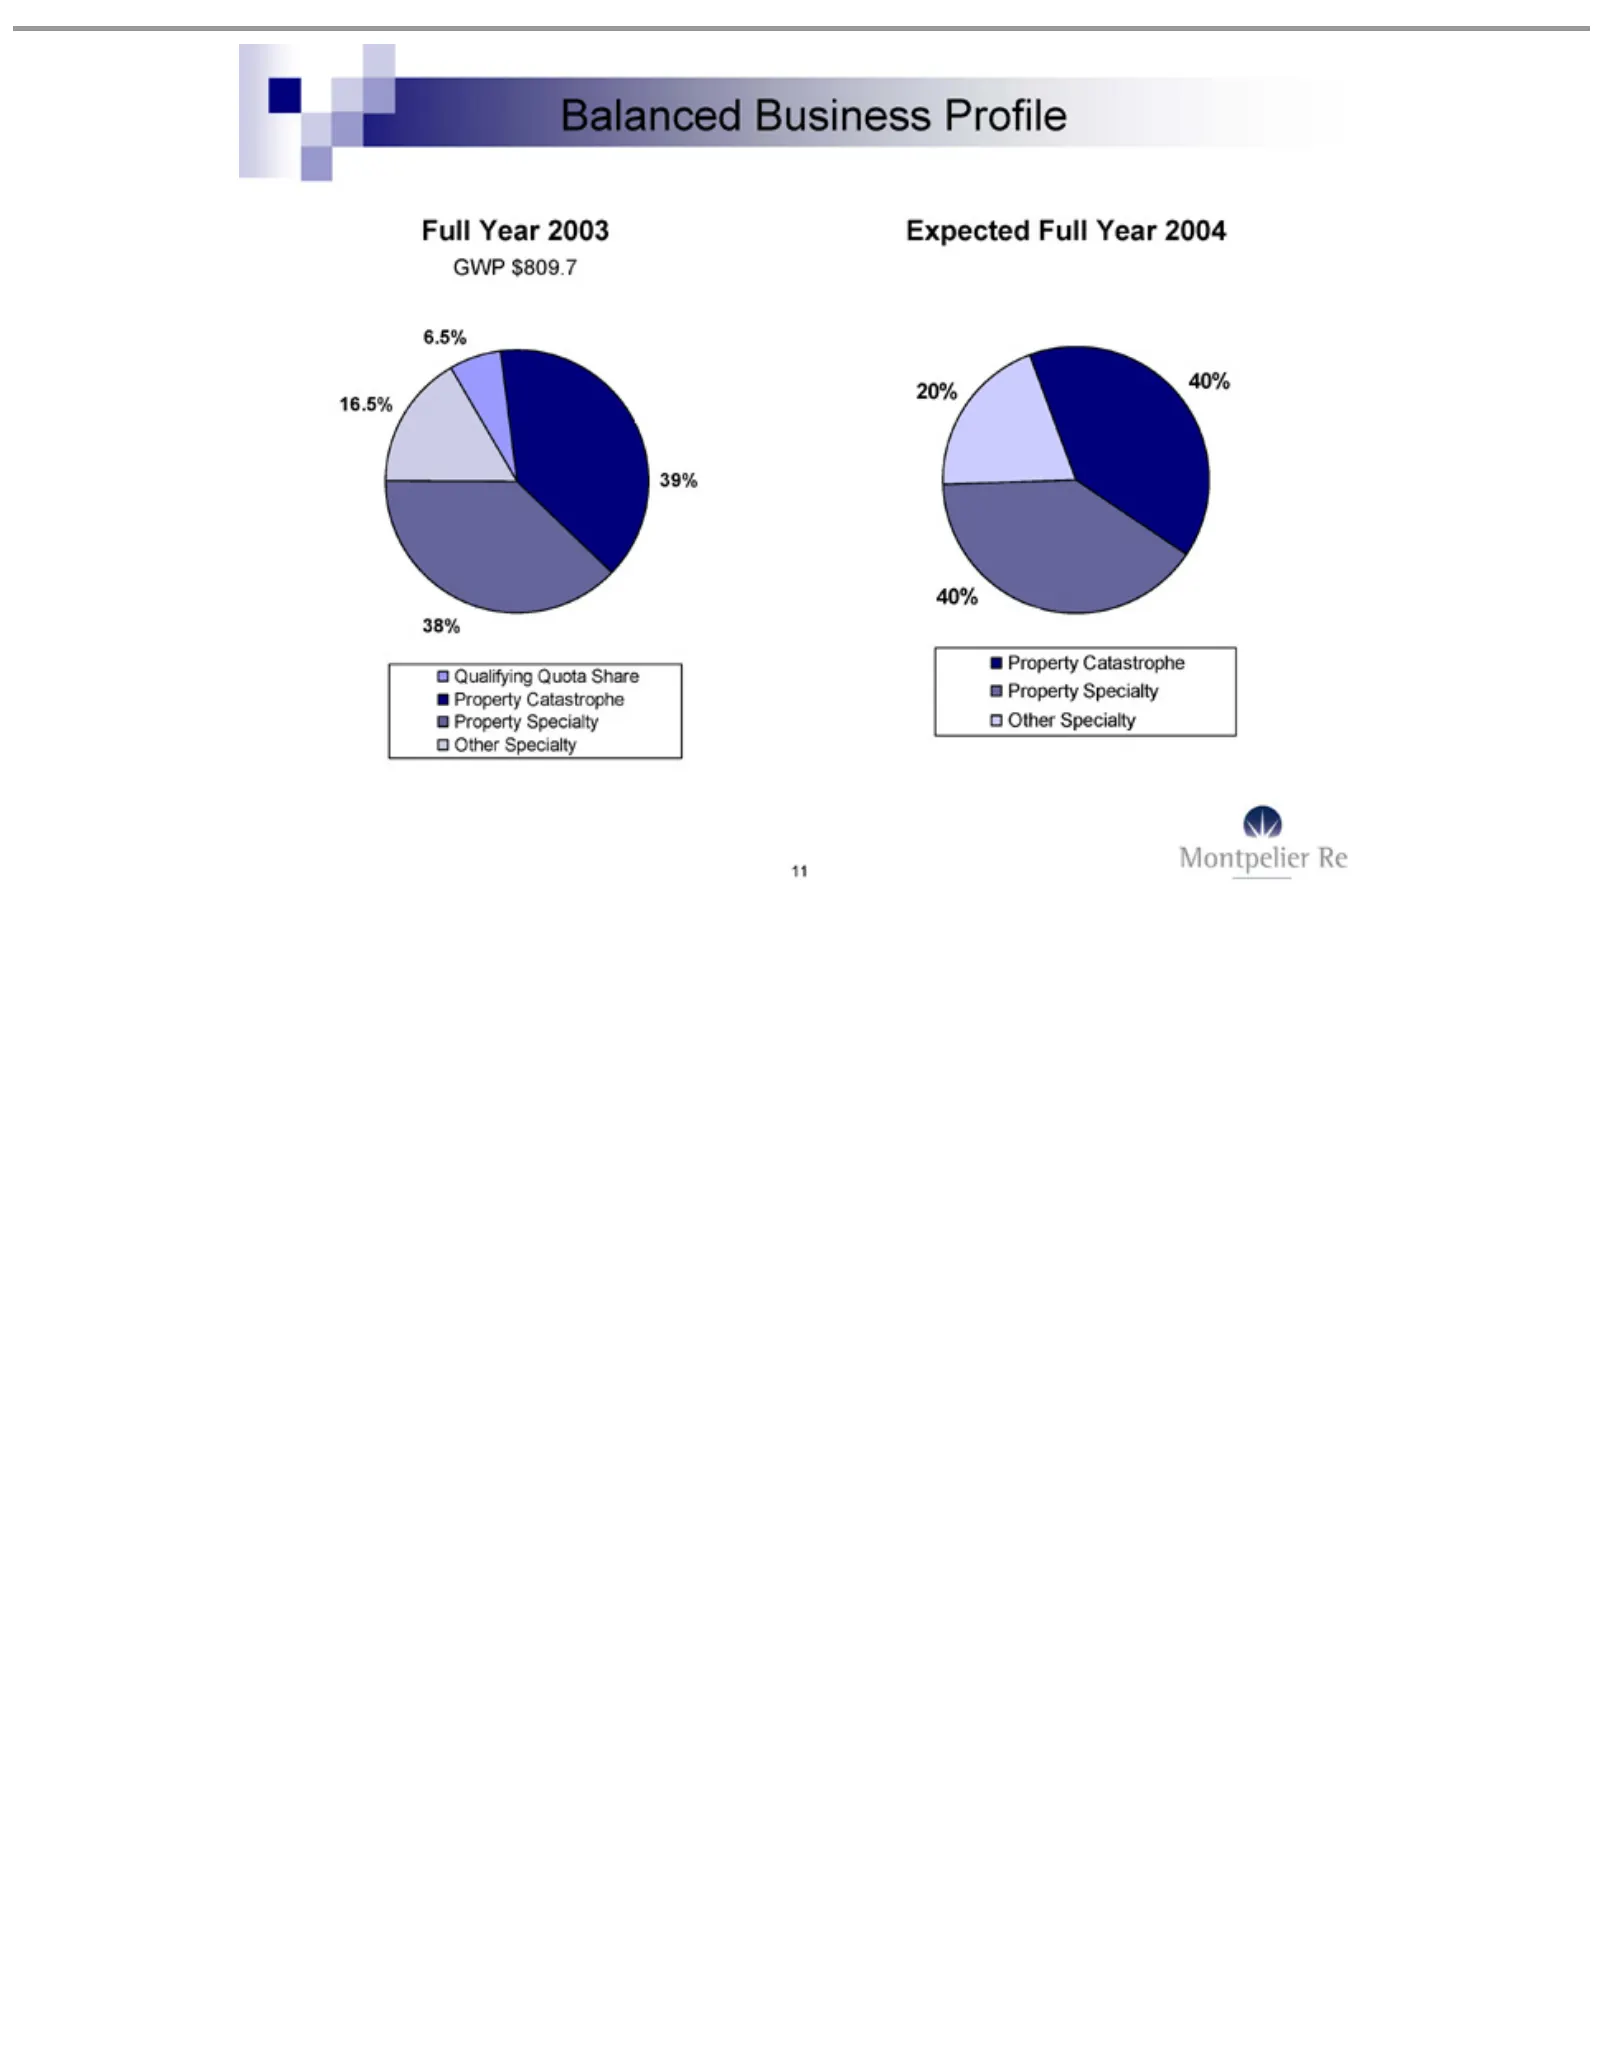
Slide 11: Balanced Business Profile
Balanced Full GWP Qualifying 39% 38% 16.5% 6.5% Expected 40% 20% Property Other 11 Year $809.7 Specialty Catastrophe Specialty 2003 Full Business Quota YearShare Profile 2004
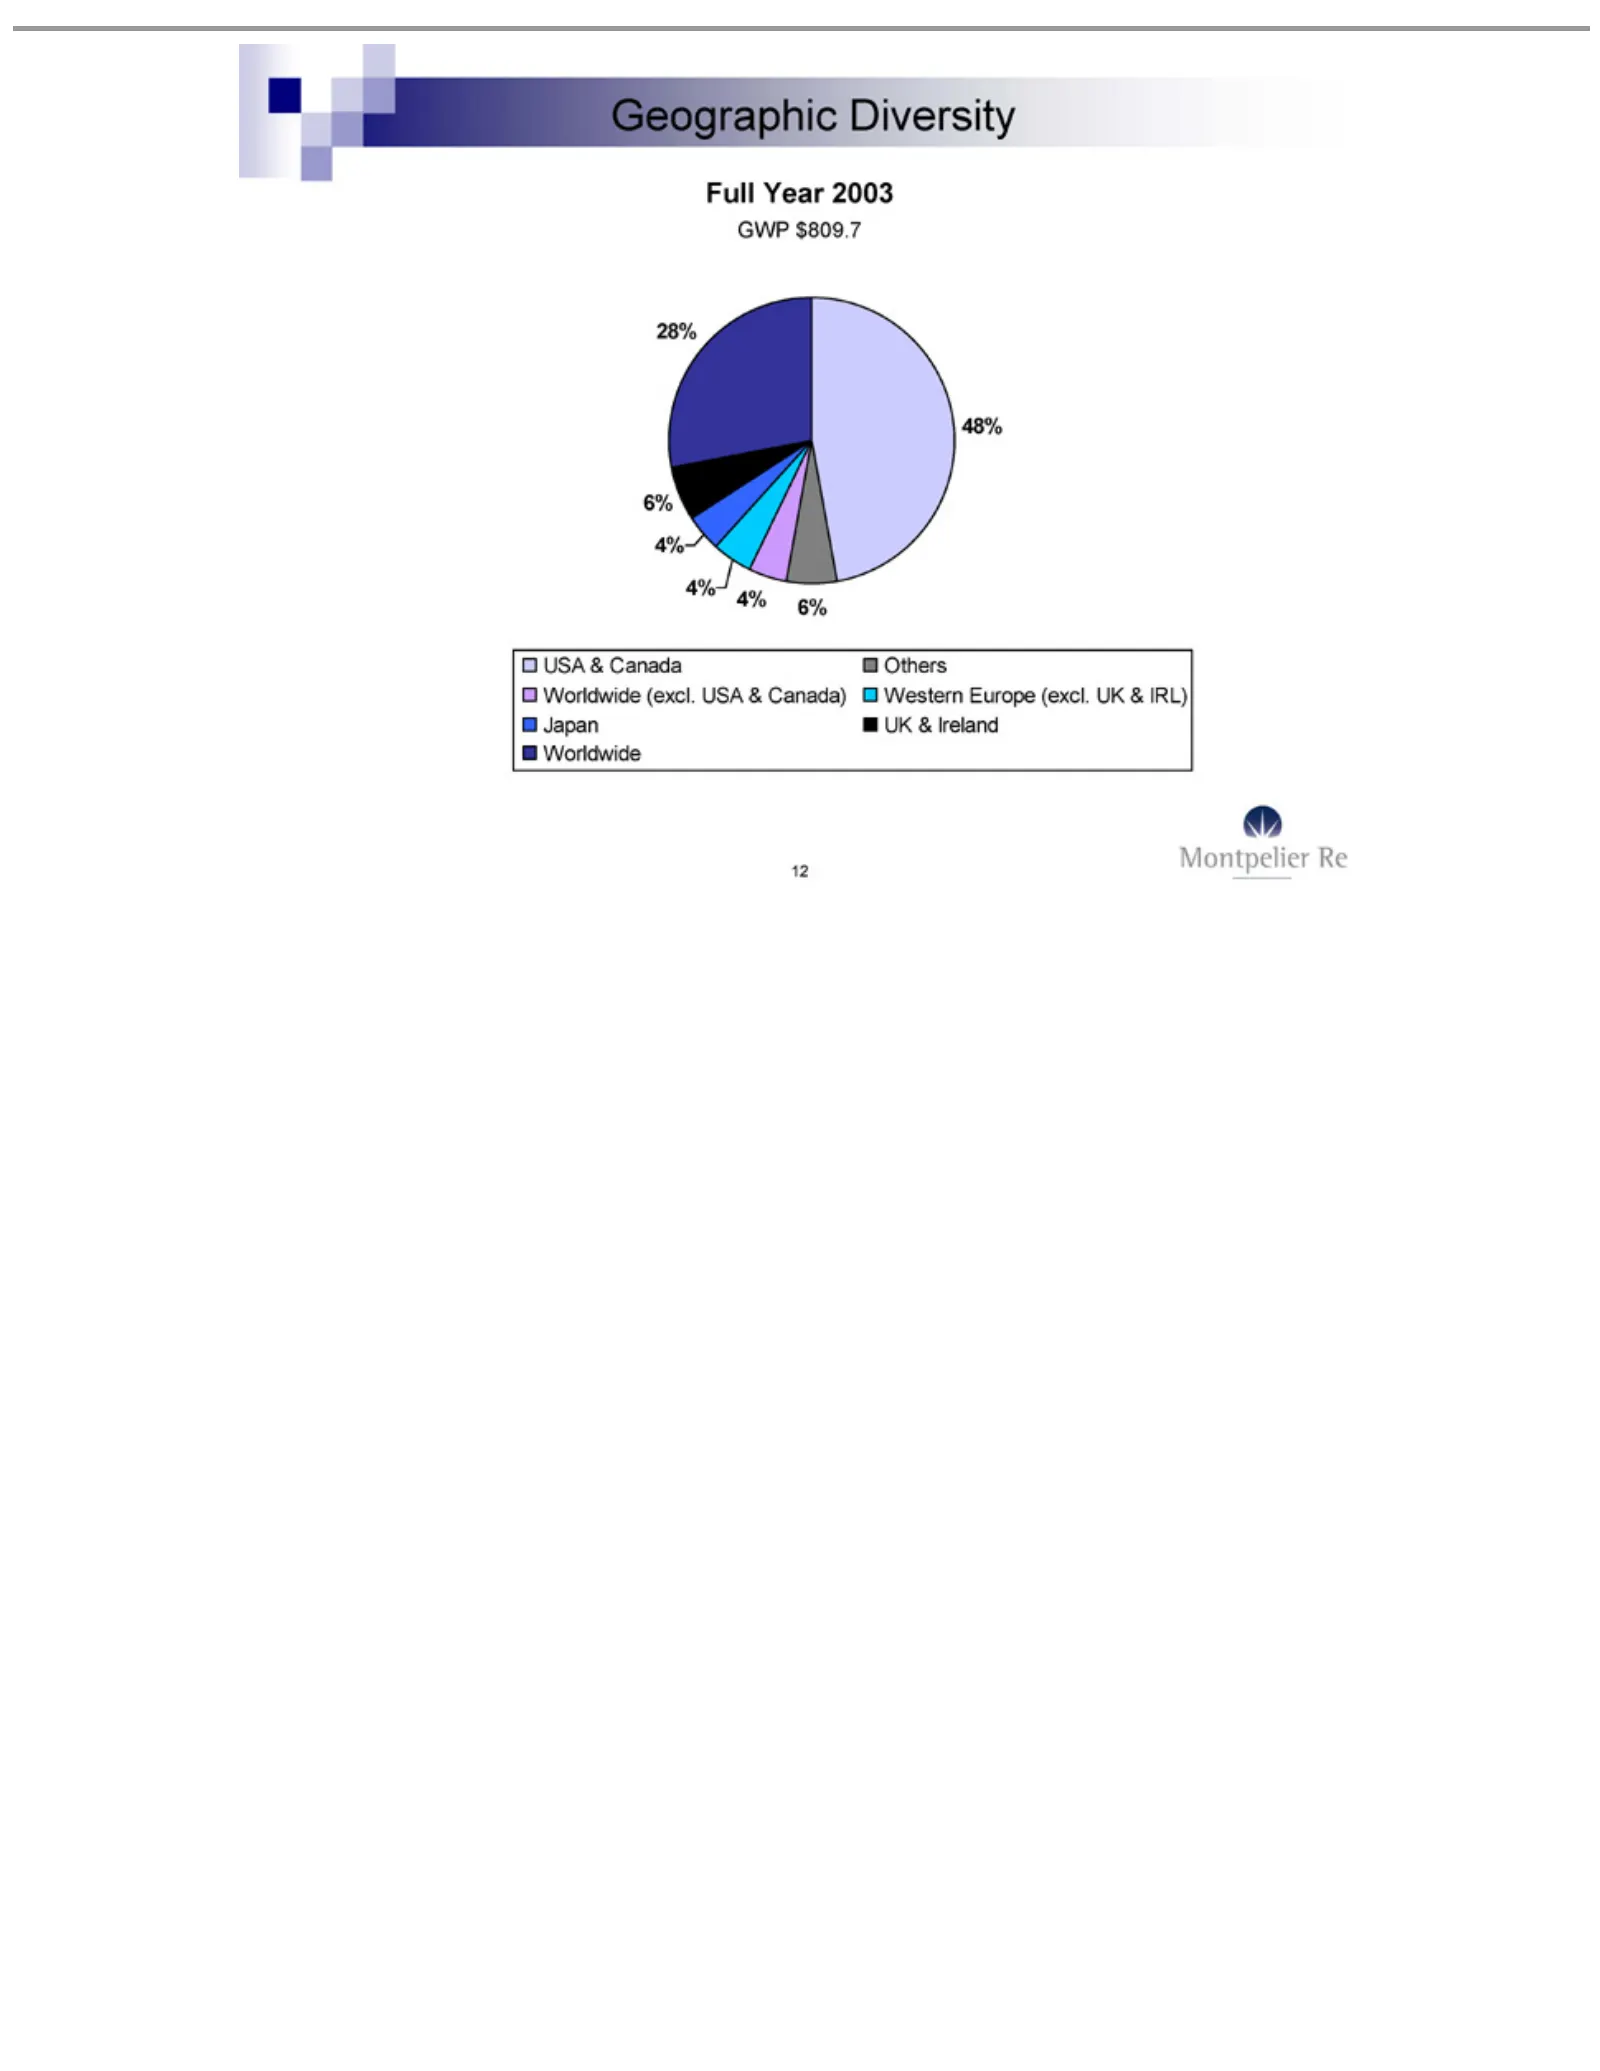
Slide 12: Geographic Diversity
Geographic Full GWP USA 48% 4% 6% 28% Western Others Worldwide Japan UK 12 & Year & $809.7 Ireland Canada Europe 2003 (excl. Diversity (excl. USAUK& Canada) & IRL)
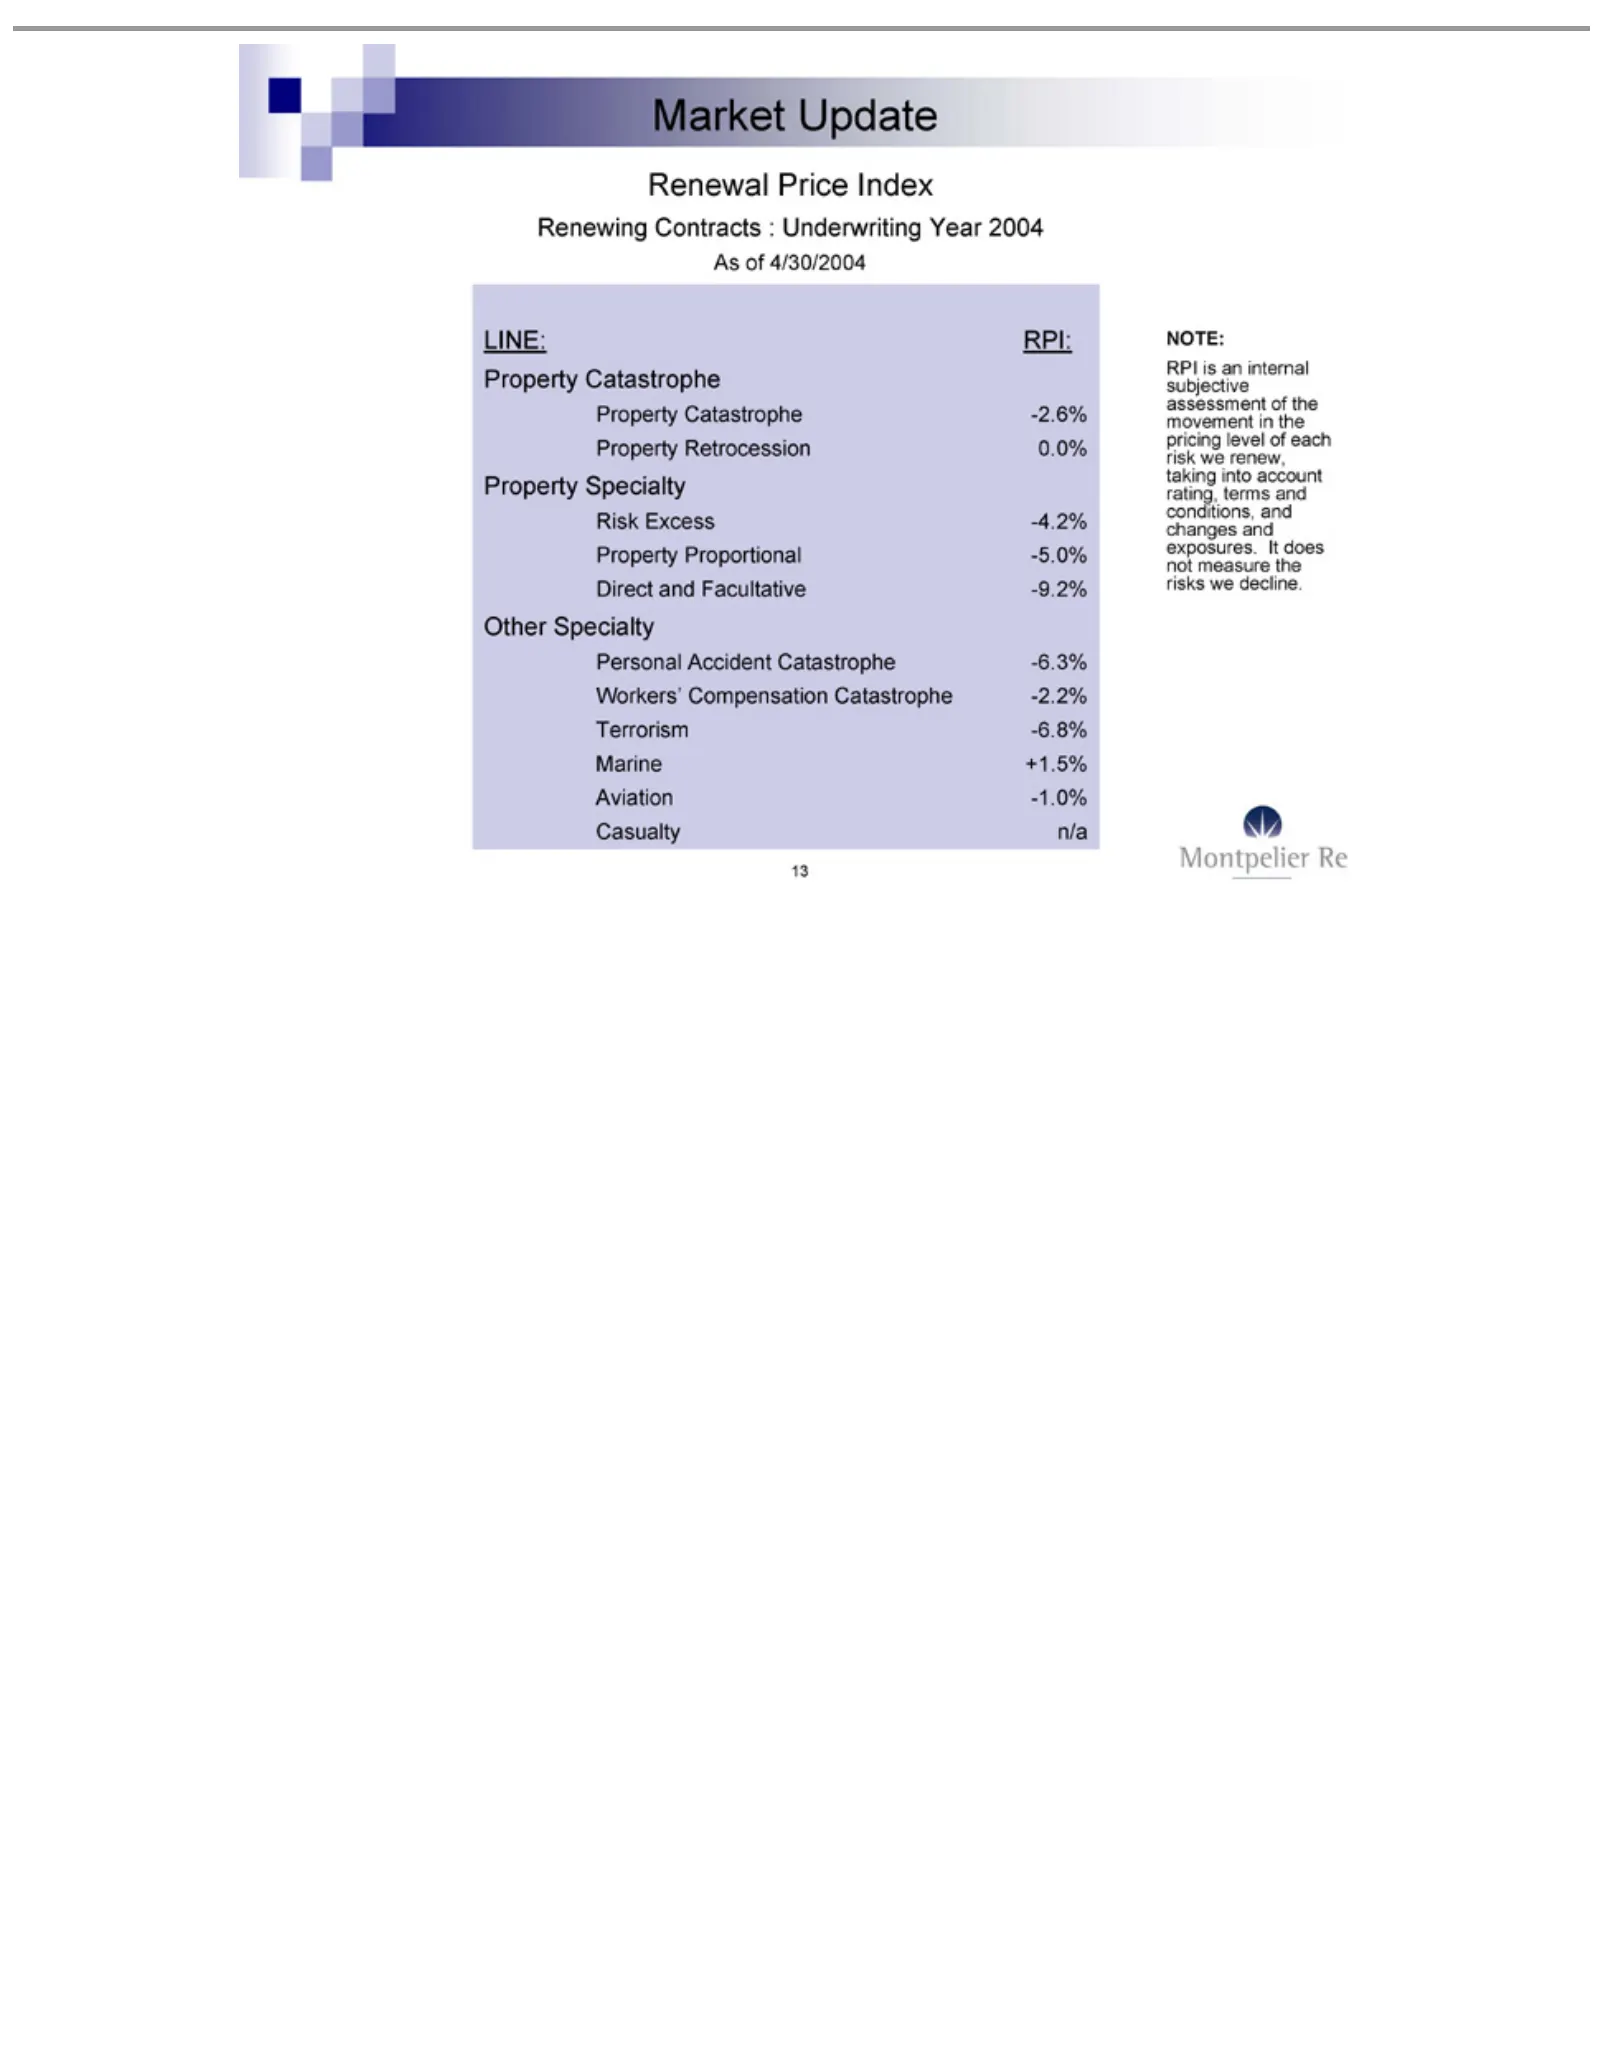
Slide 13: Market Update: Renewal Rate Changes
Market Renewal Renewing As LINE: Risk Property Direct Other Personal Workers’ Terrorism Marine Aviation Casualty RPI NOTE: 13 ofisExcess 4/30/2004 Specialty an and RPI: Update +1.5% Accident -1.0% Catastrophe Retrocession Specialty Proportional Price n/a Compensation internal -6.8% Contracts Faculta
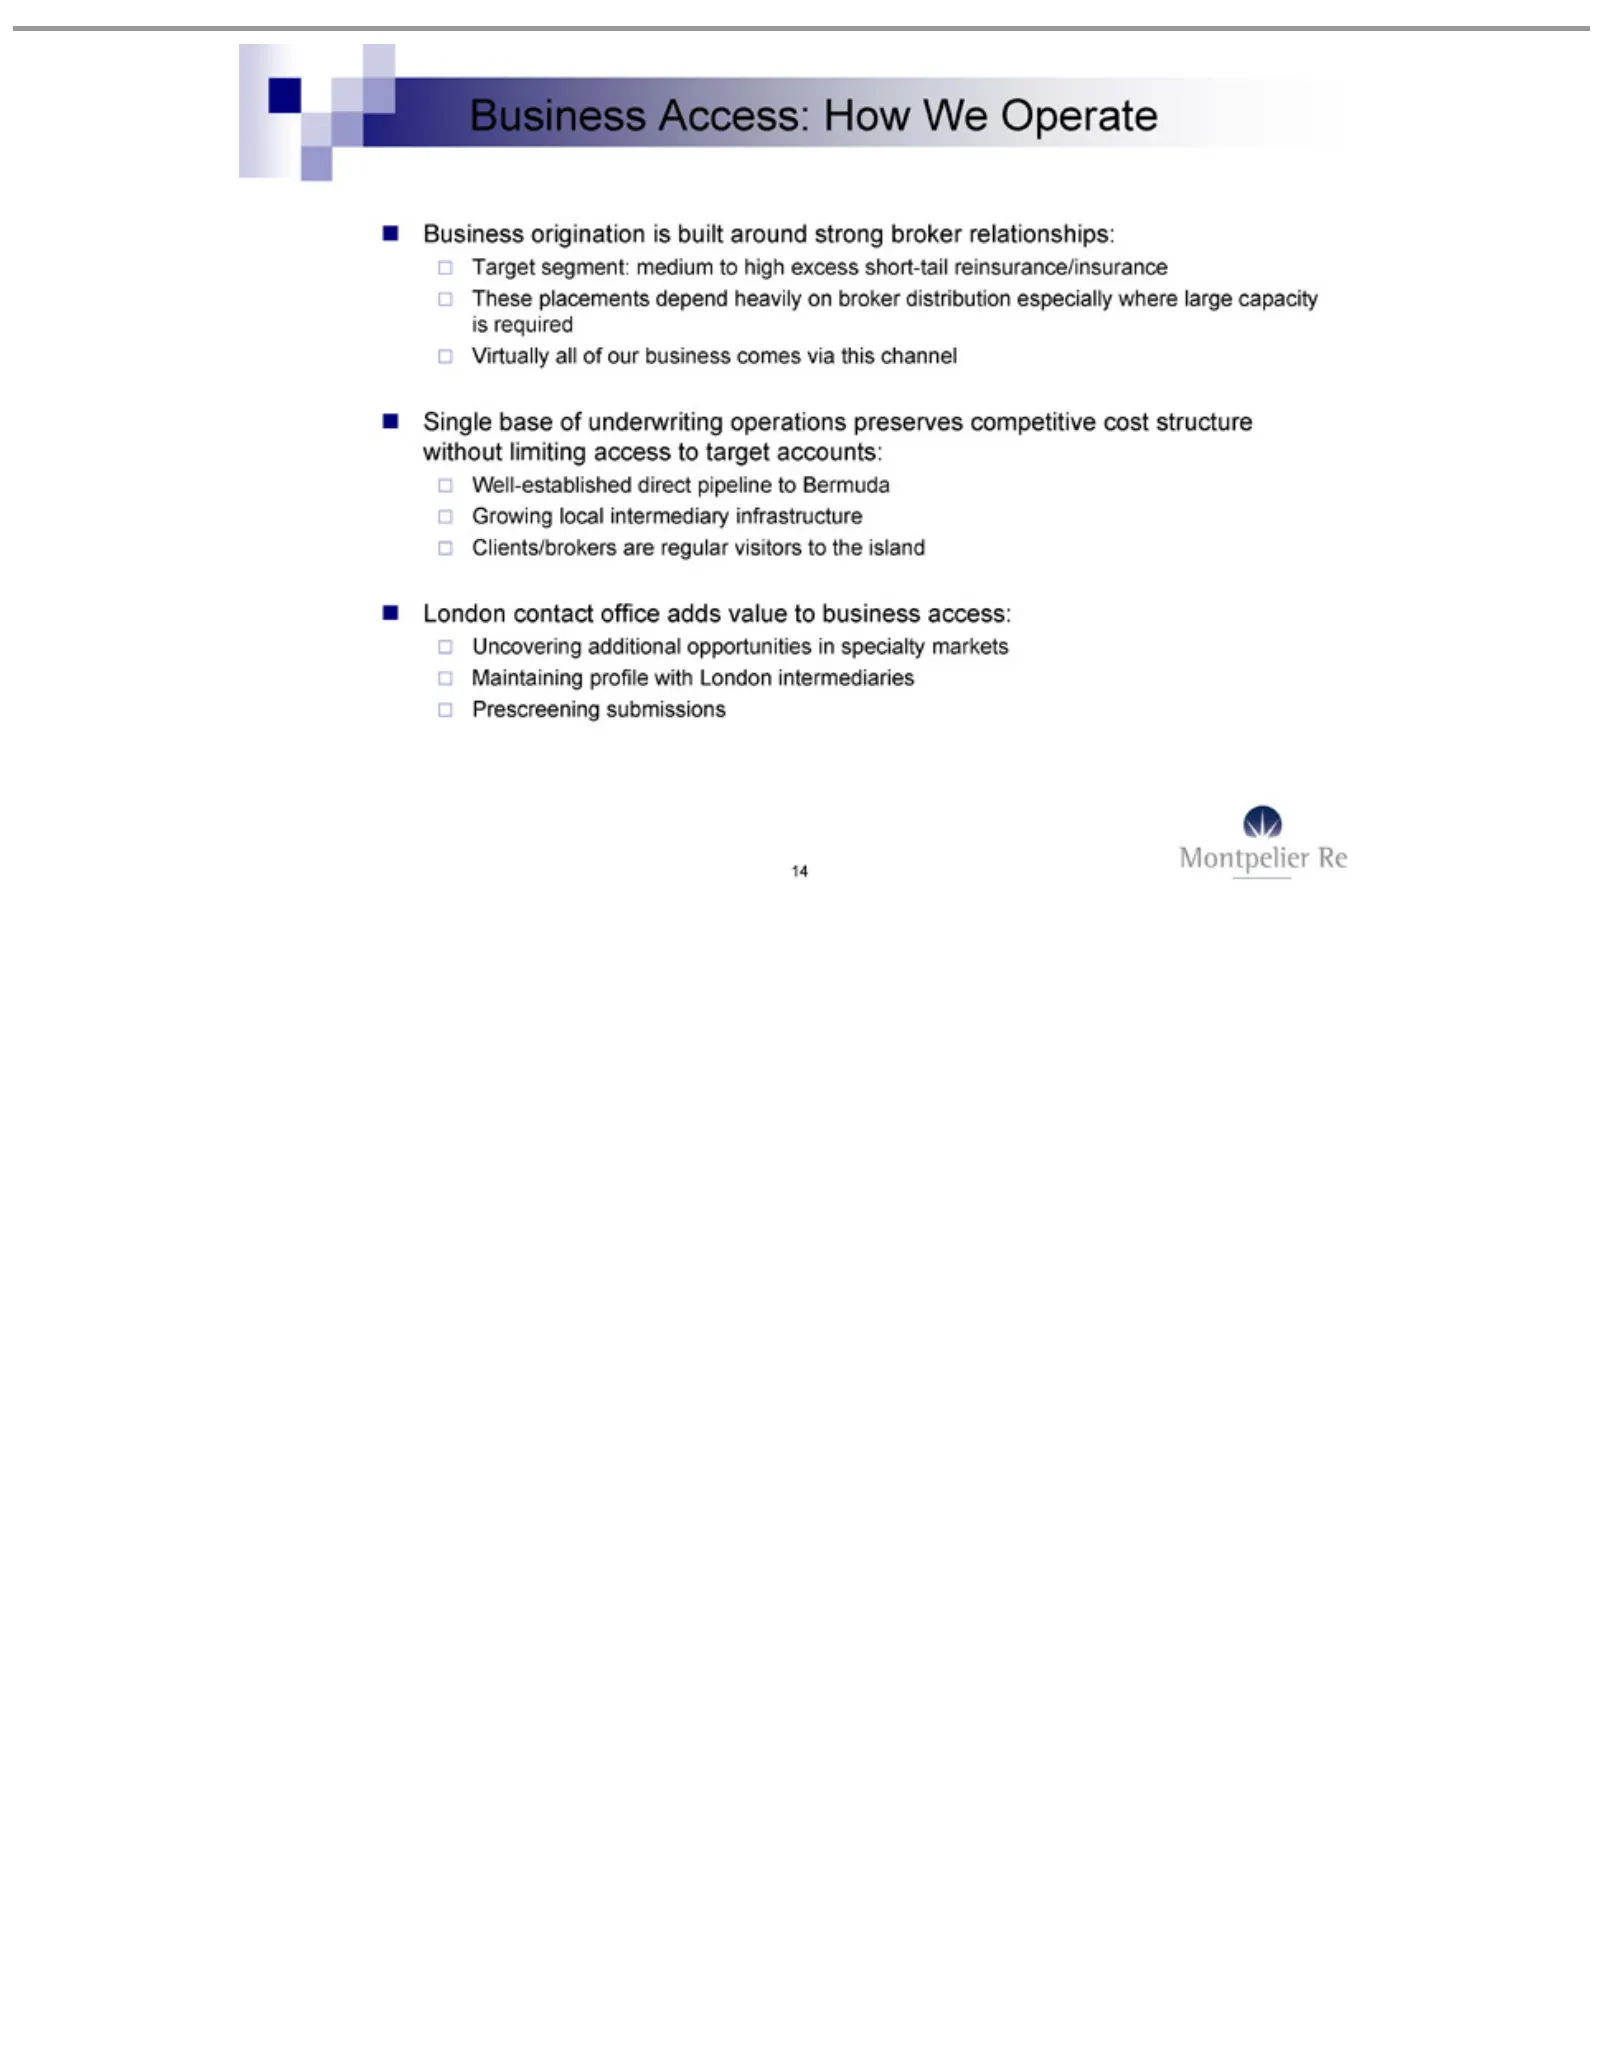
Slide 14: Business Origination
Business Target These Virtually Single Well-established Growing Clients/brokers London Uncovering Maintaining Prescreening 14 placements segment: base contact Access: all local origination of additional of profile submissions underwriting intermediary our are office medium direct How depend business
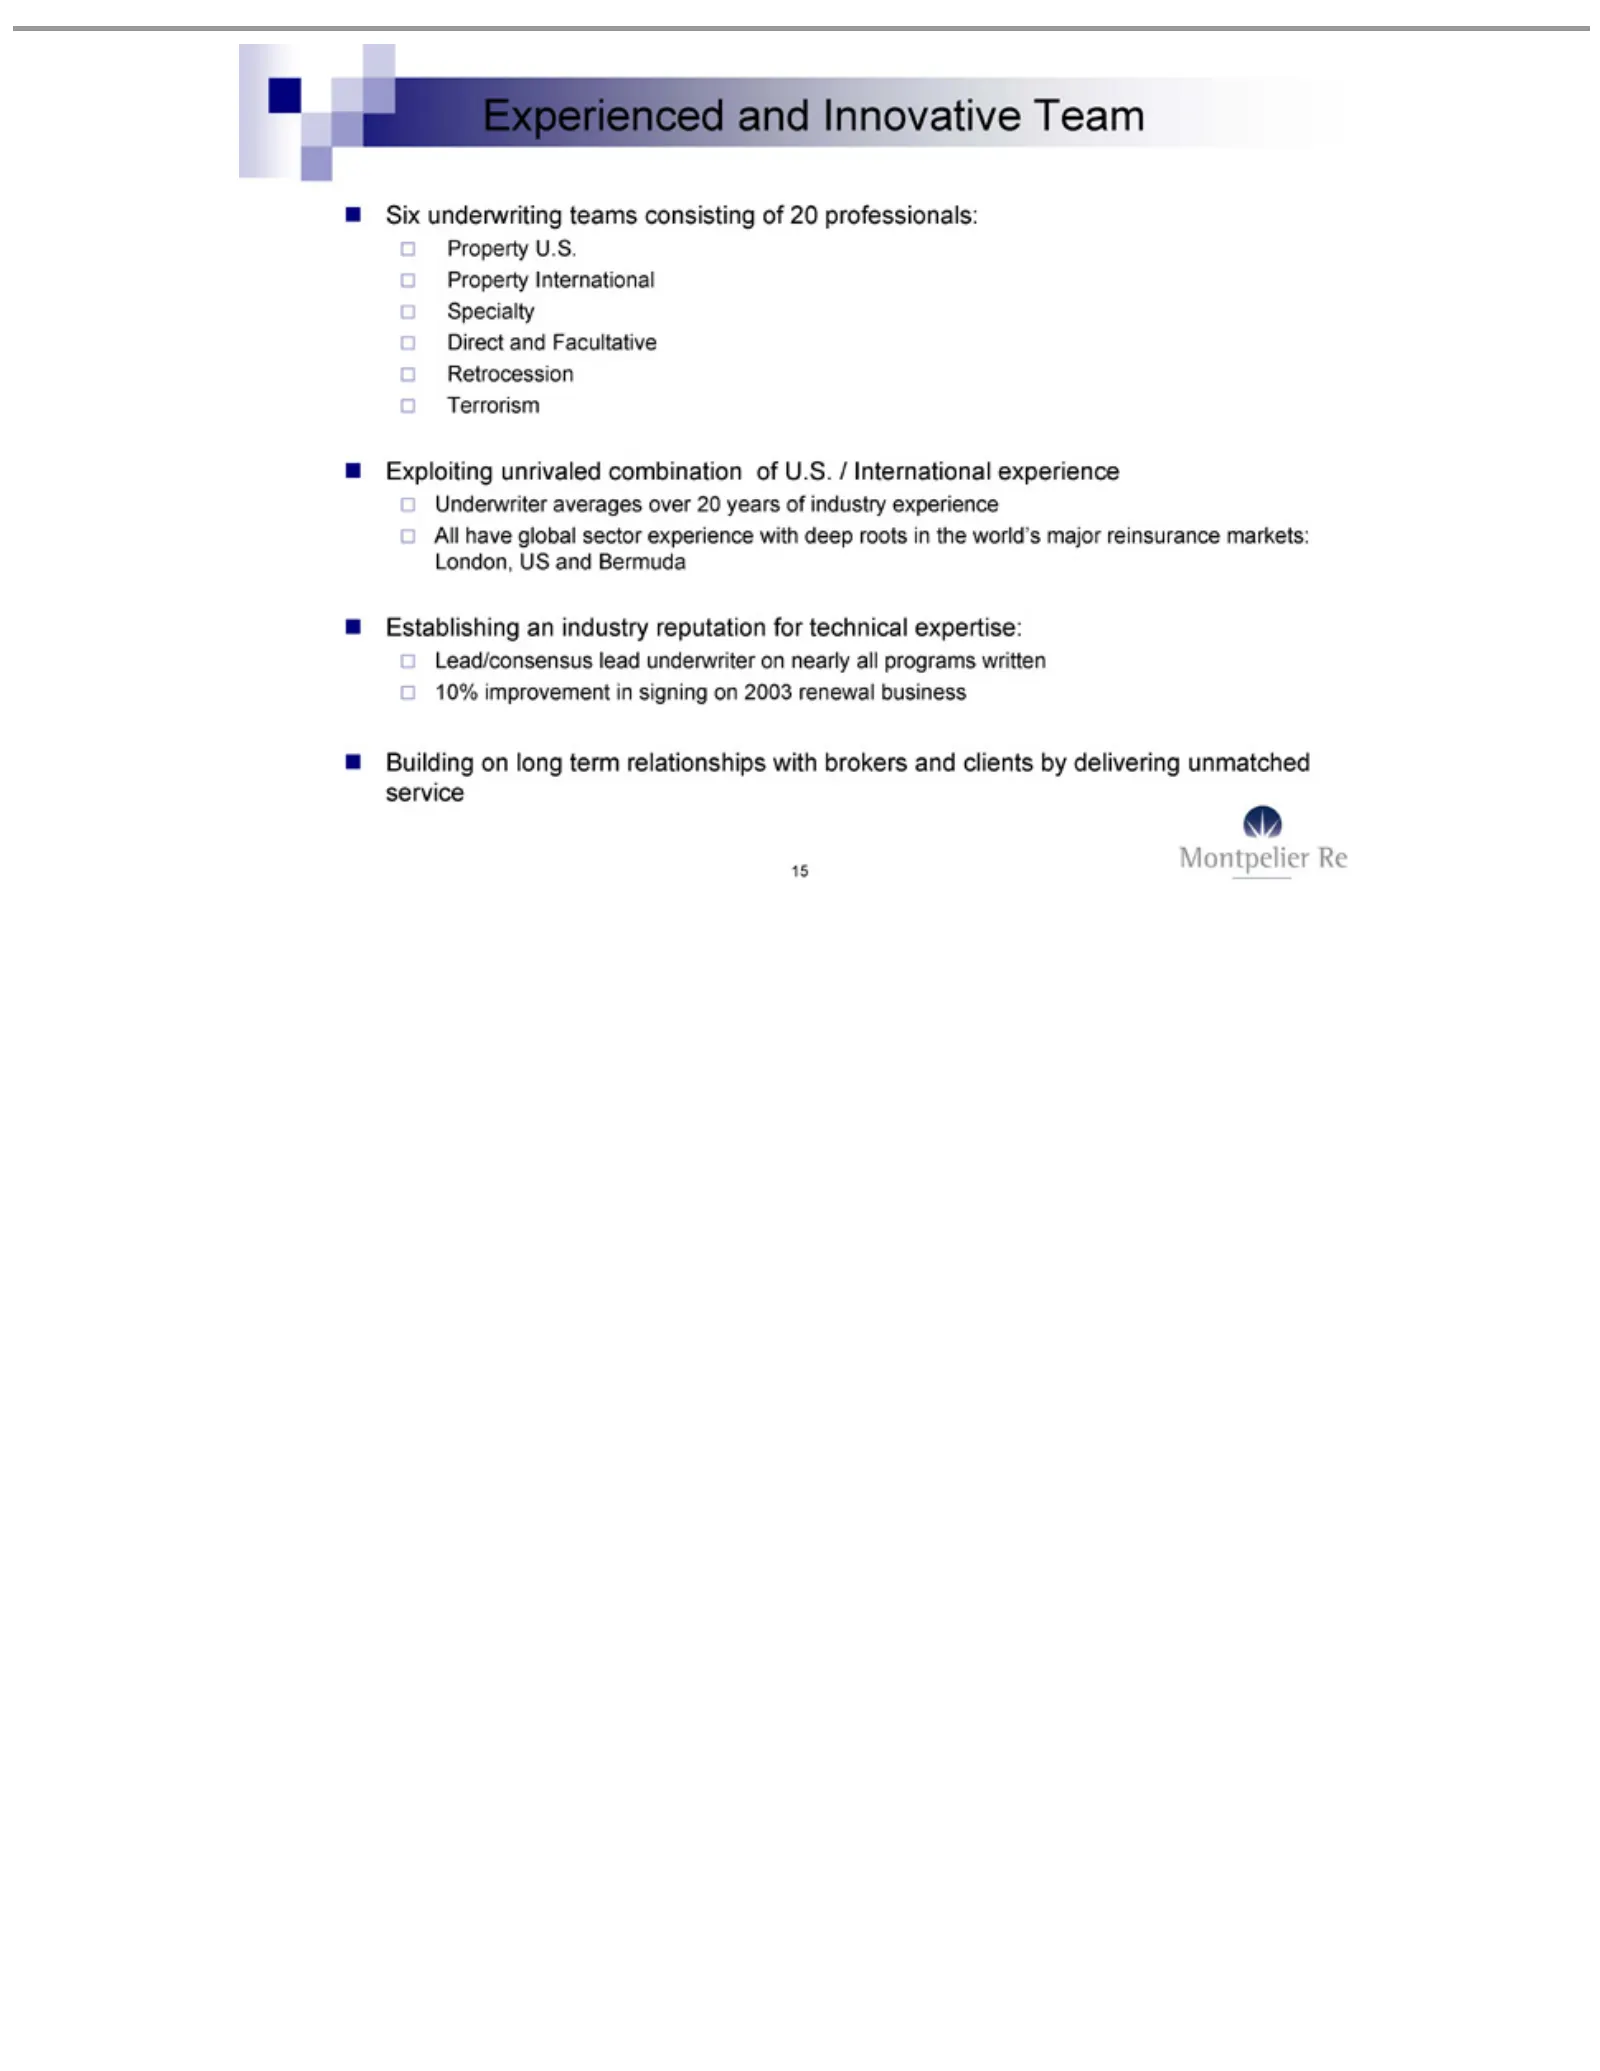
Slide 15: Experienced Underwriting Team
Experienced Six Property Direct Specialty Exploiting Terrorism Retrocession Underwriter All Establishing Lead/consensus 10% Building 15 have underwriting improvement and global U.S. International onFacultative unrivaled long averages an andindustry sector lead Innovative teams term in underwriter co
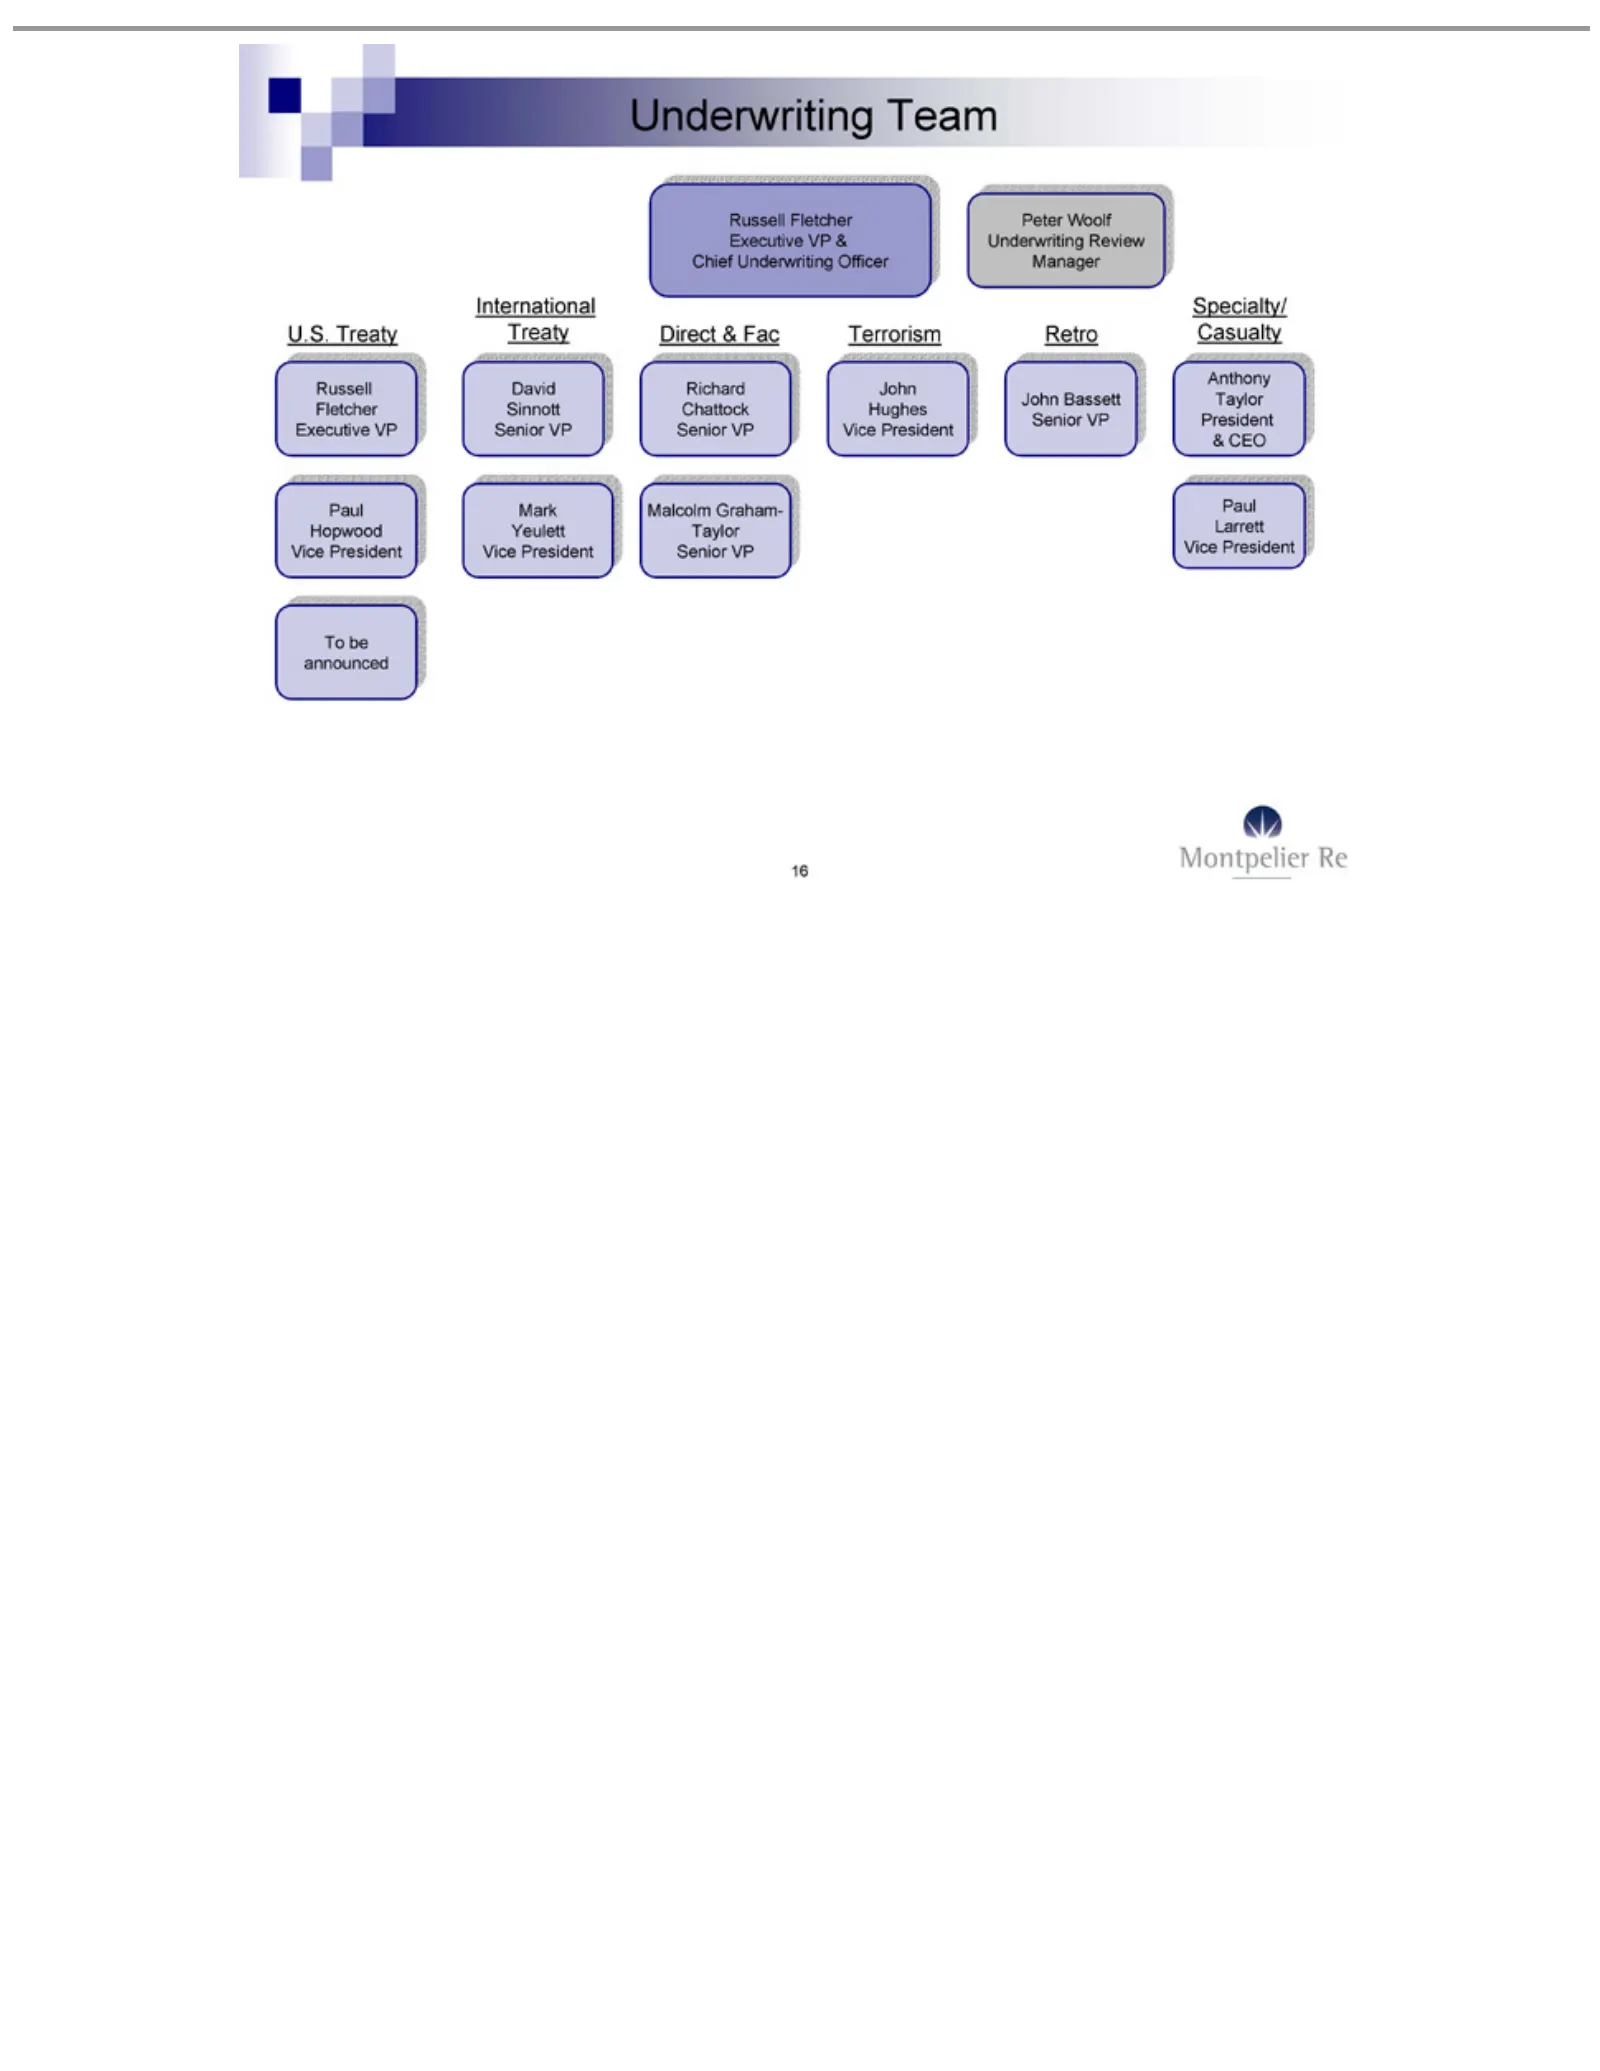
Slide 16: Underwriting Team
Underwriting Peter U.S. Russell To International David Mark Direct Richard Malcolm Terrorism John Retro Specialty/ Anthony Paul 16 beTreaty Hopwood Larrett Hughes Bassett Woolf Yeulett announced Sinnott &Fletcher Chattock Taylor Fac Graham-Taylor Casualty Vice Underwriting Senior Treaty Vice Team Se
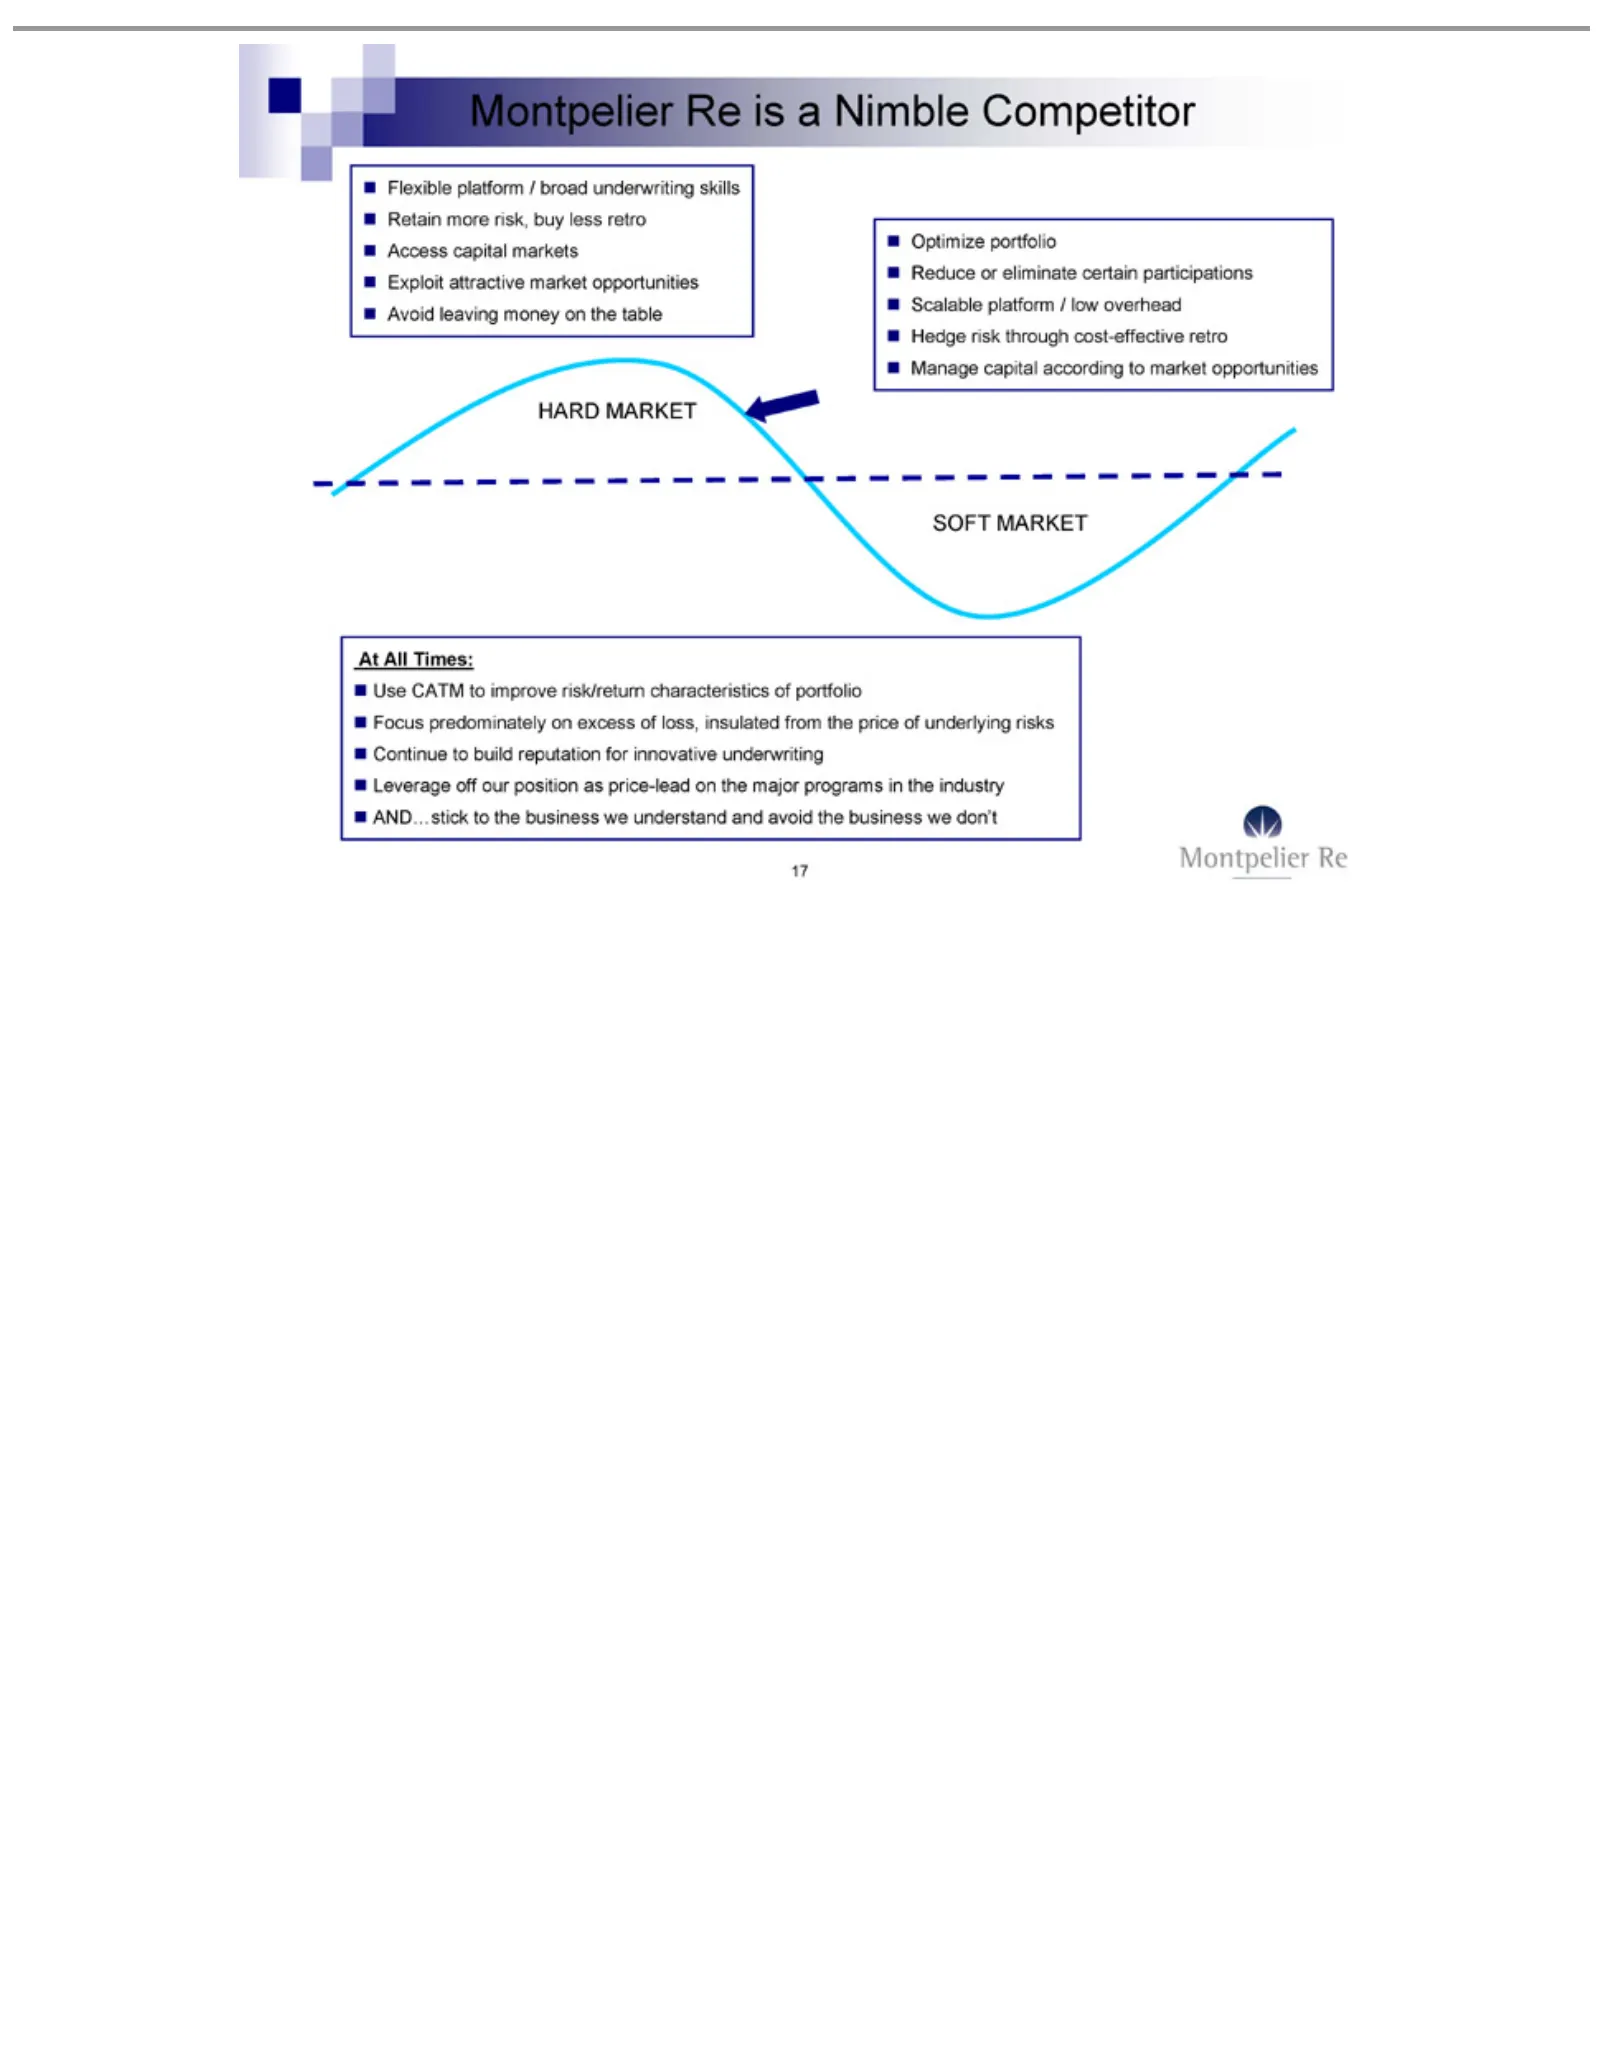
Slide 17: Montpelier Re: Flexible and Scalable Platform
Montpelier Flexible Retain Access Exploit Avoid Optimize Reduce Scalable Hedge Manage HARD SOFT At Use Focus Continue Leverage AND…stick 17 All CATM predominately leaving MARKET Times: risk more capital MARKET attractive or capital platform platform to off portfolio eliminate through Re to build ris
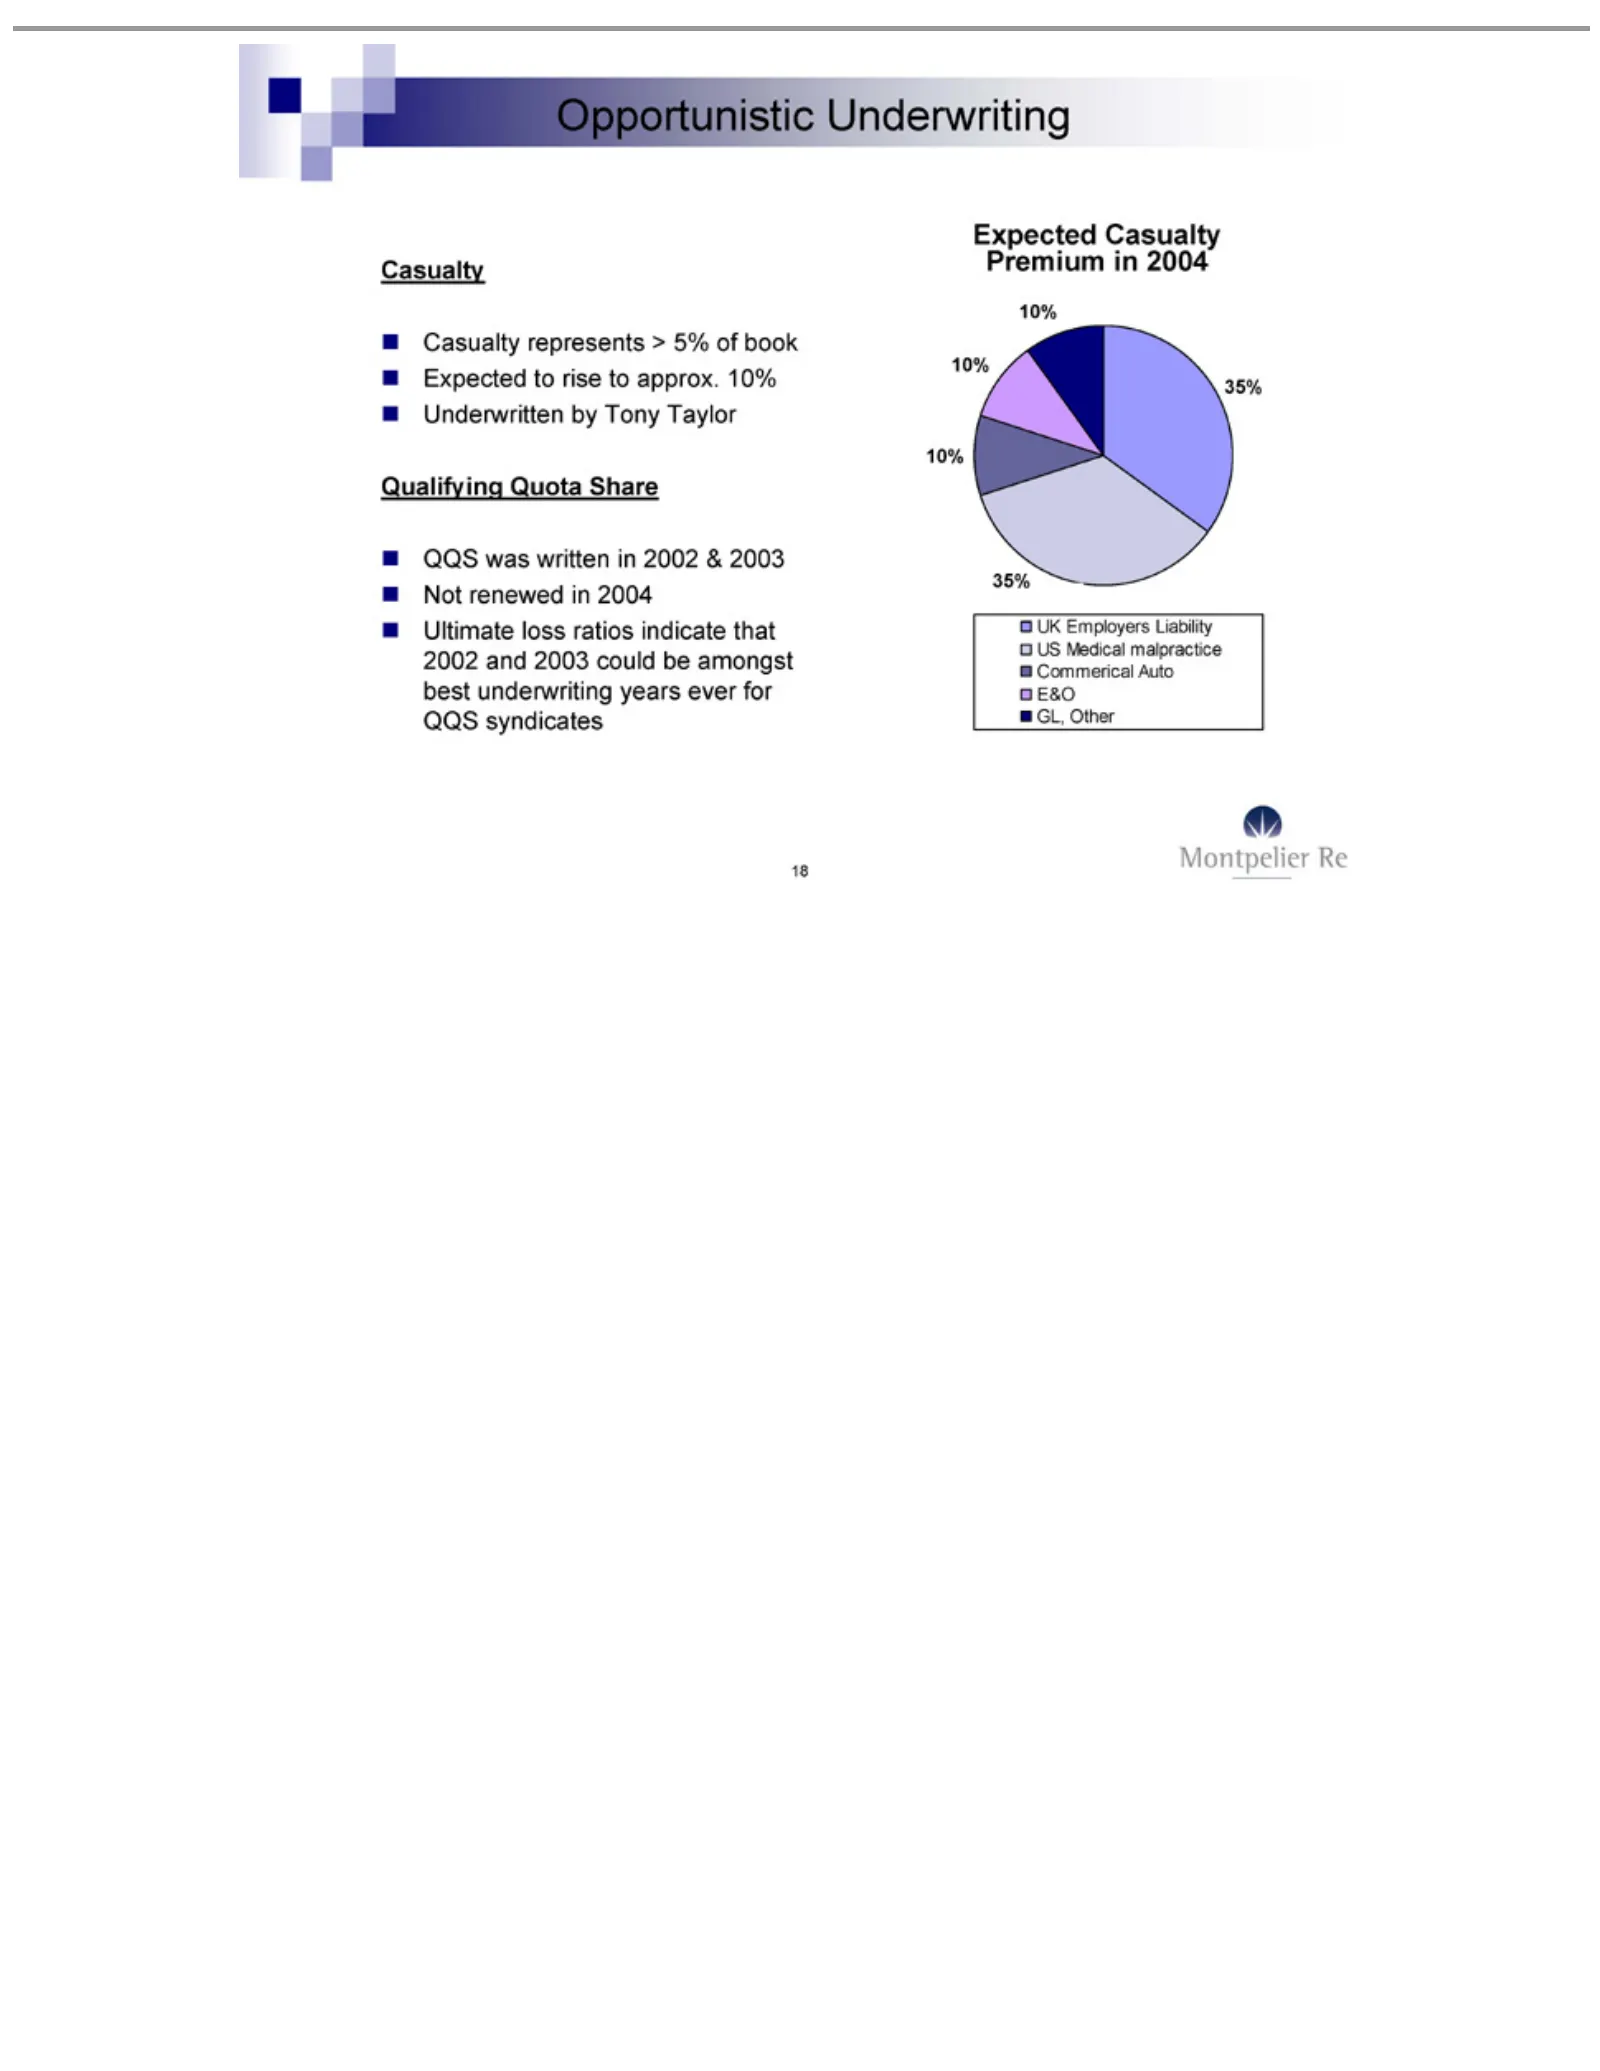
Slide 18: Opportunistic Casualty
Opportunistic Casualty Underwritten Qualifying QQS Not Ultimate Expected 10% UK US Commerical GL, E&O 18 Medical Employers renewed Other 10% wasloss represents to Casualty written 10% Quota rise malpractice Auto in ratios by Underwriting 35% Liability 2004 to Tony in Share approx. Premium indicate >
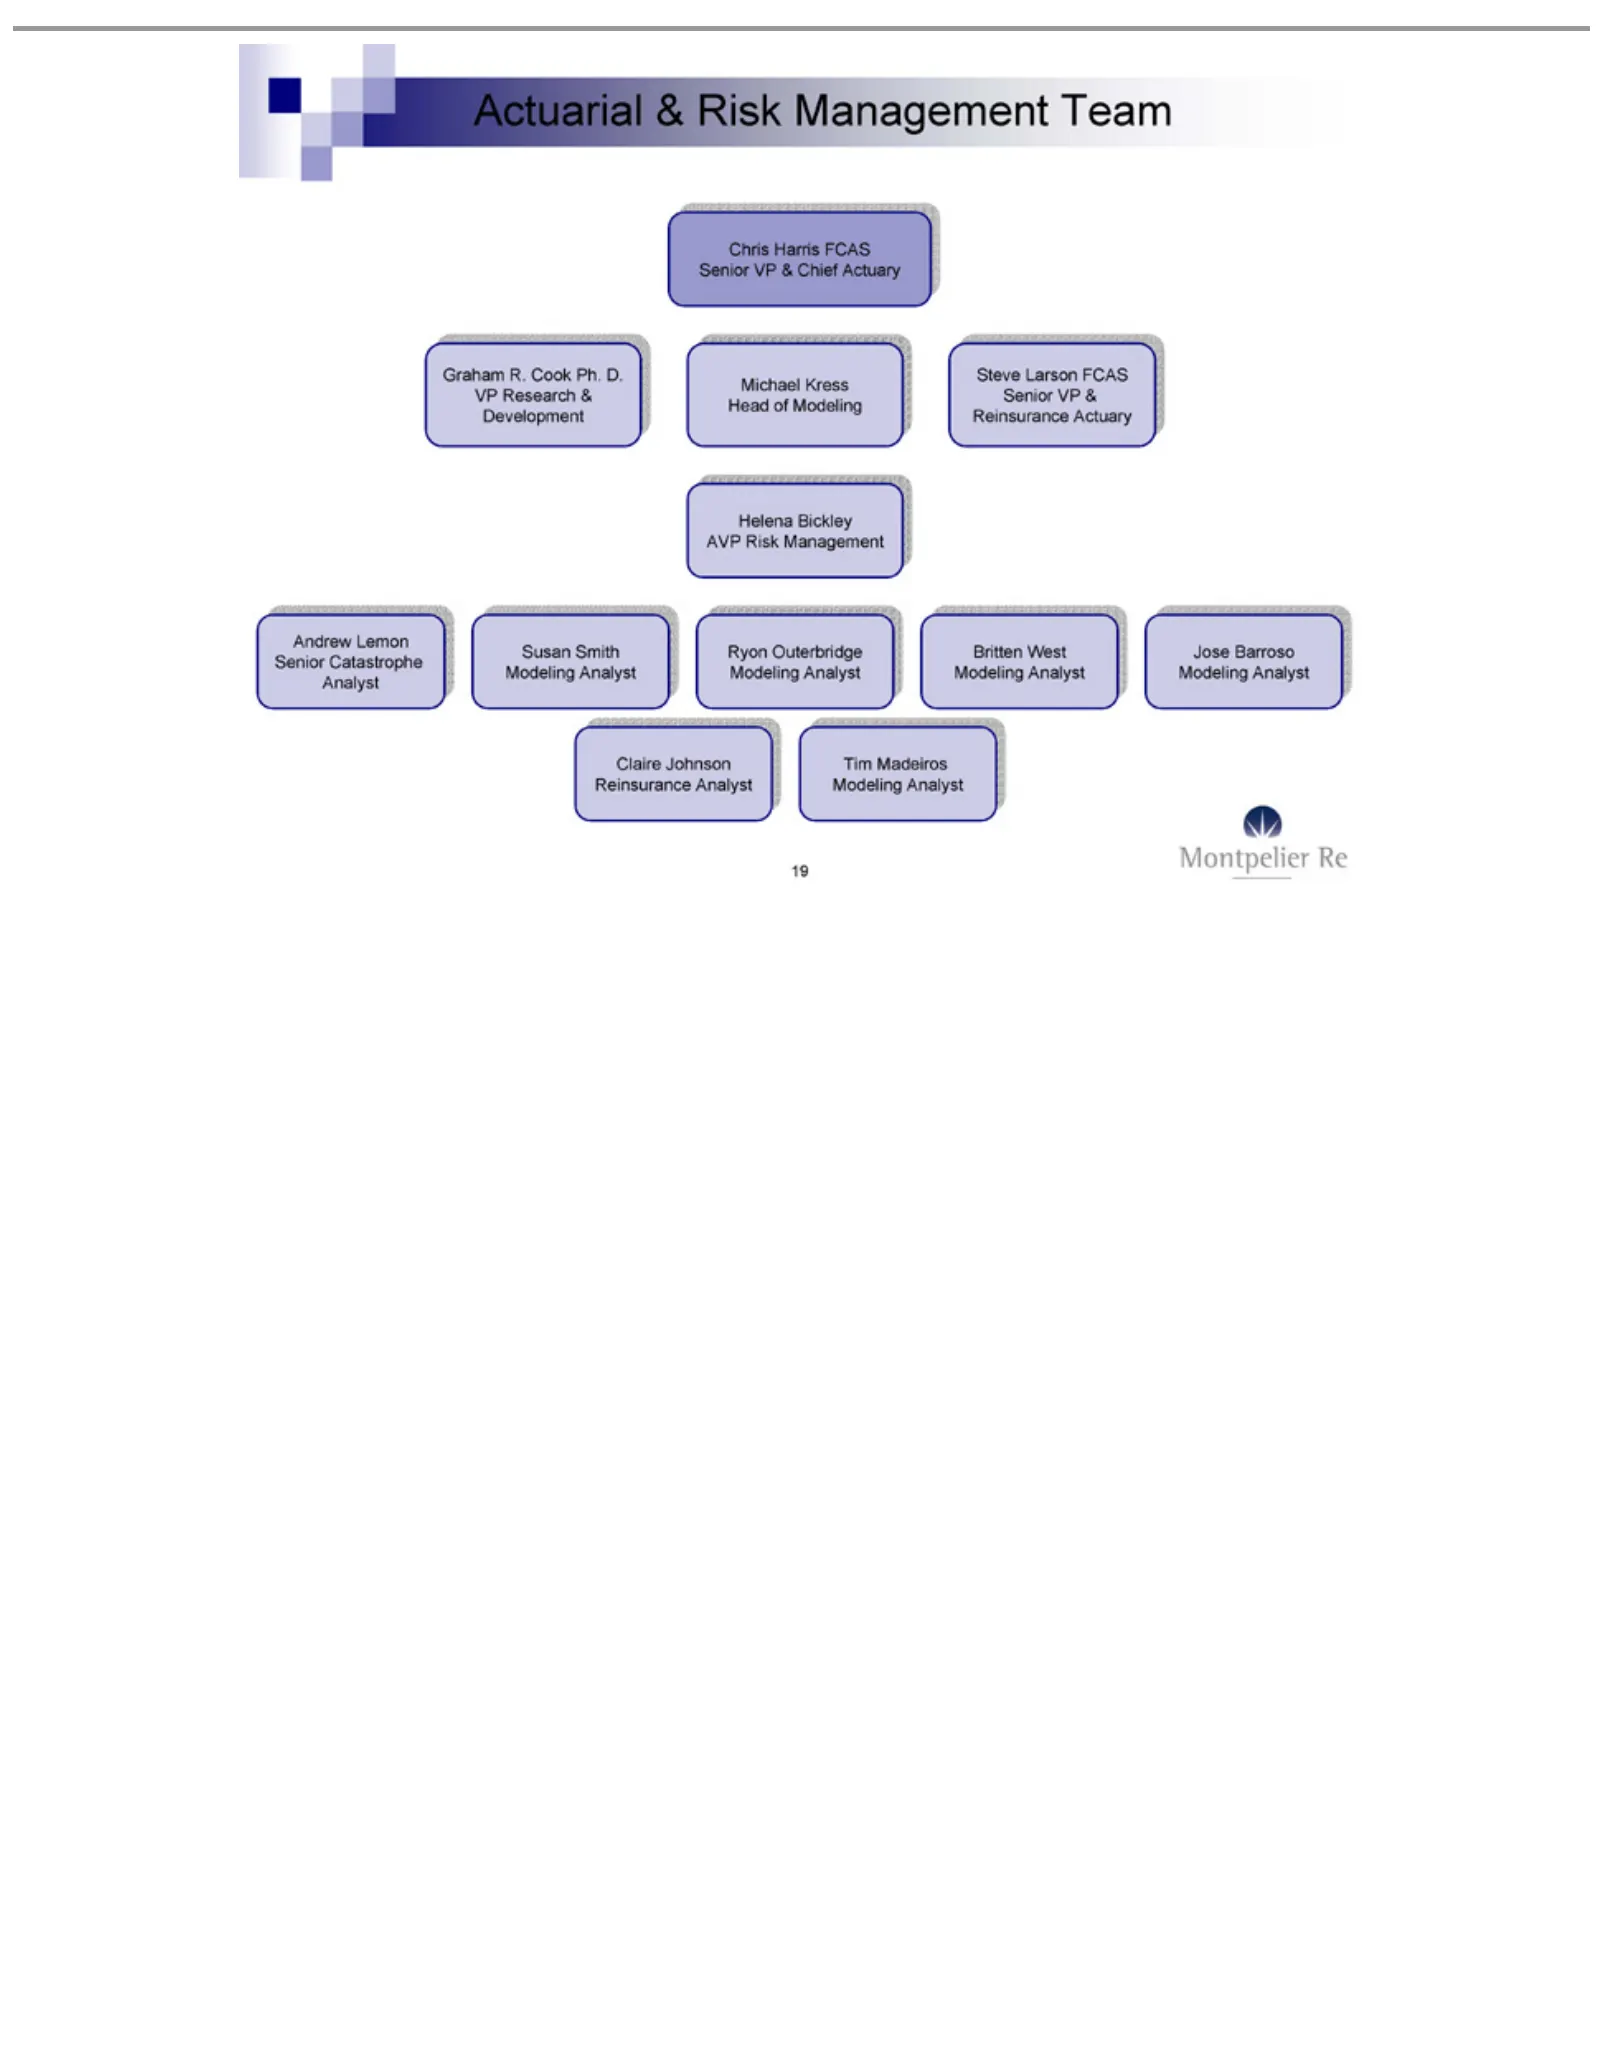
Slide 19: Actuarial Team
Actuarial Chris Graham VP Michael Steve Senior Helena Andrew Susan Ryon Britten Jose Claire Tim 19 Research Madeiros Barroso Outerbridge Harris Larson Smith Johnson VP West Bickley R. Lemon Kress &&Cook Risk FCAS Modeling Reinsurance Modeling & FCAS Modeling Head Reinsurance AVP Development Senior P
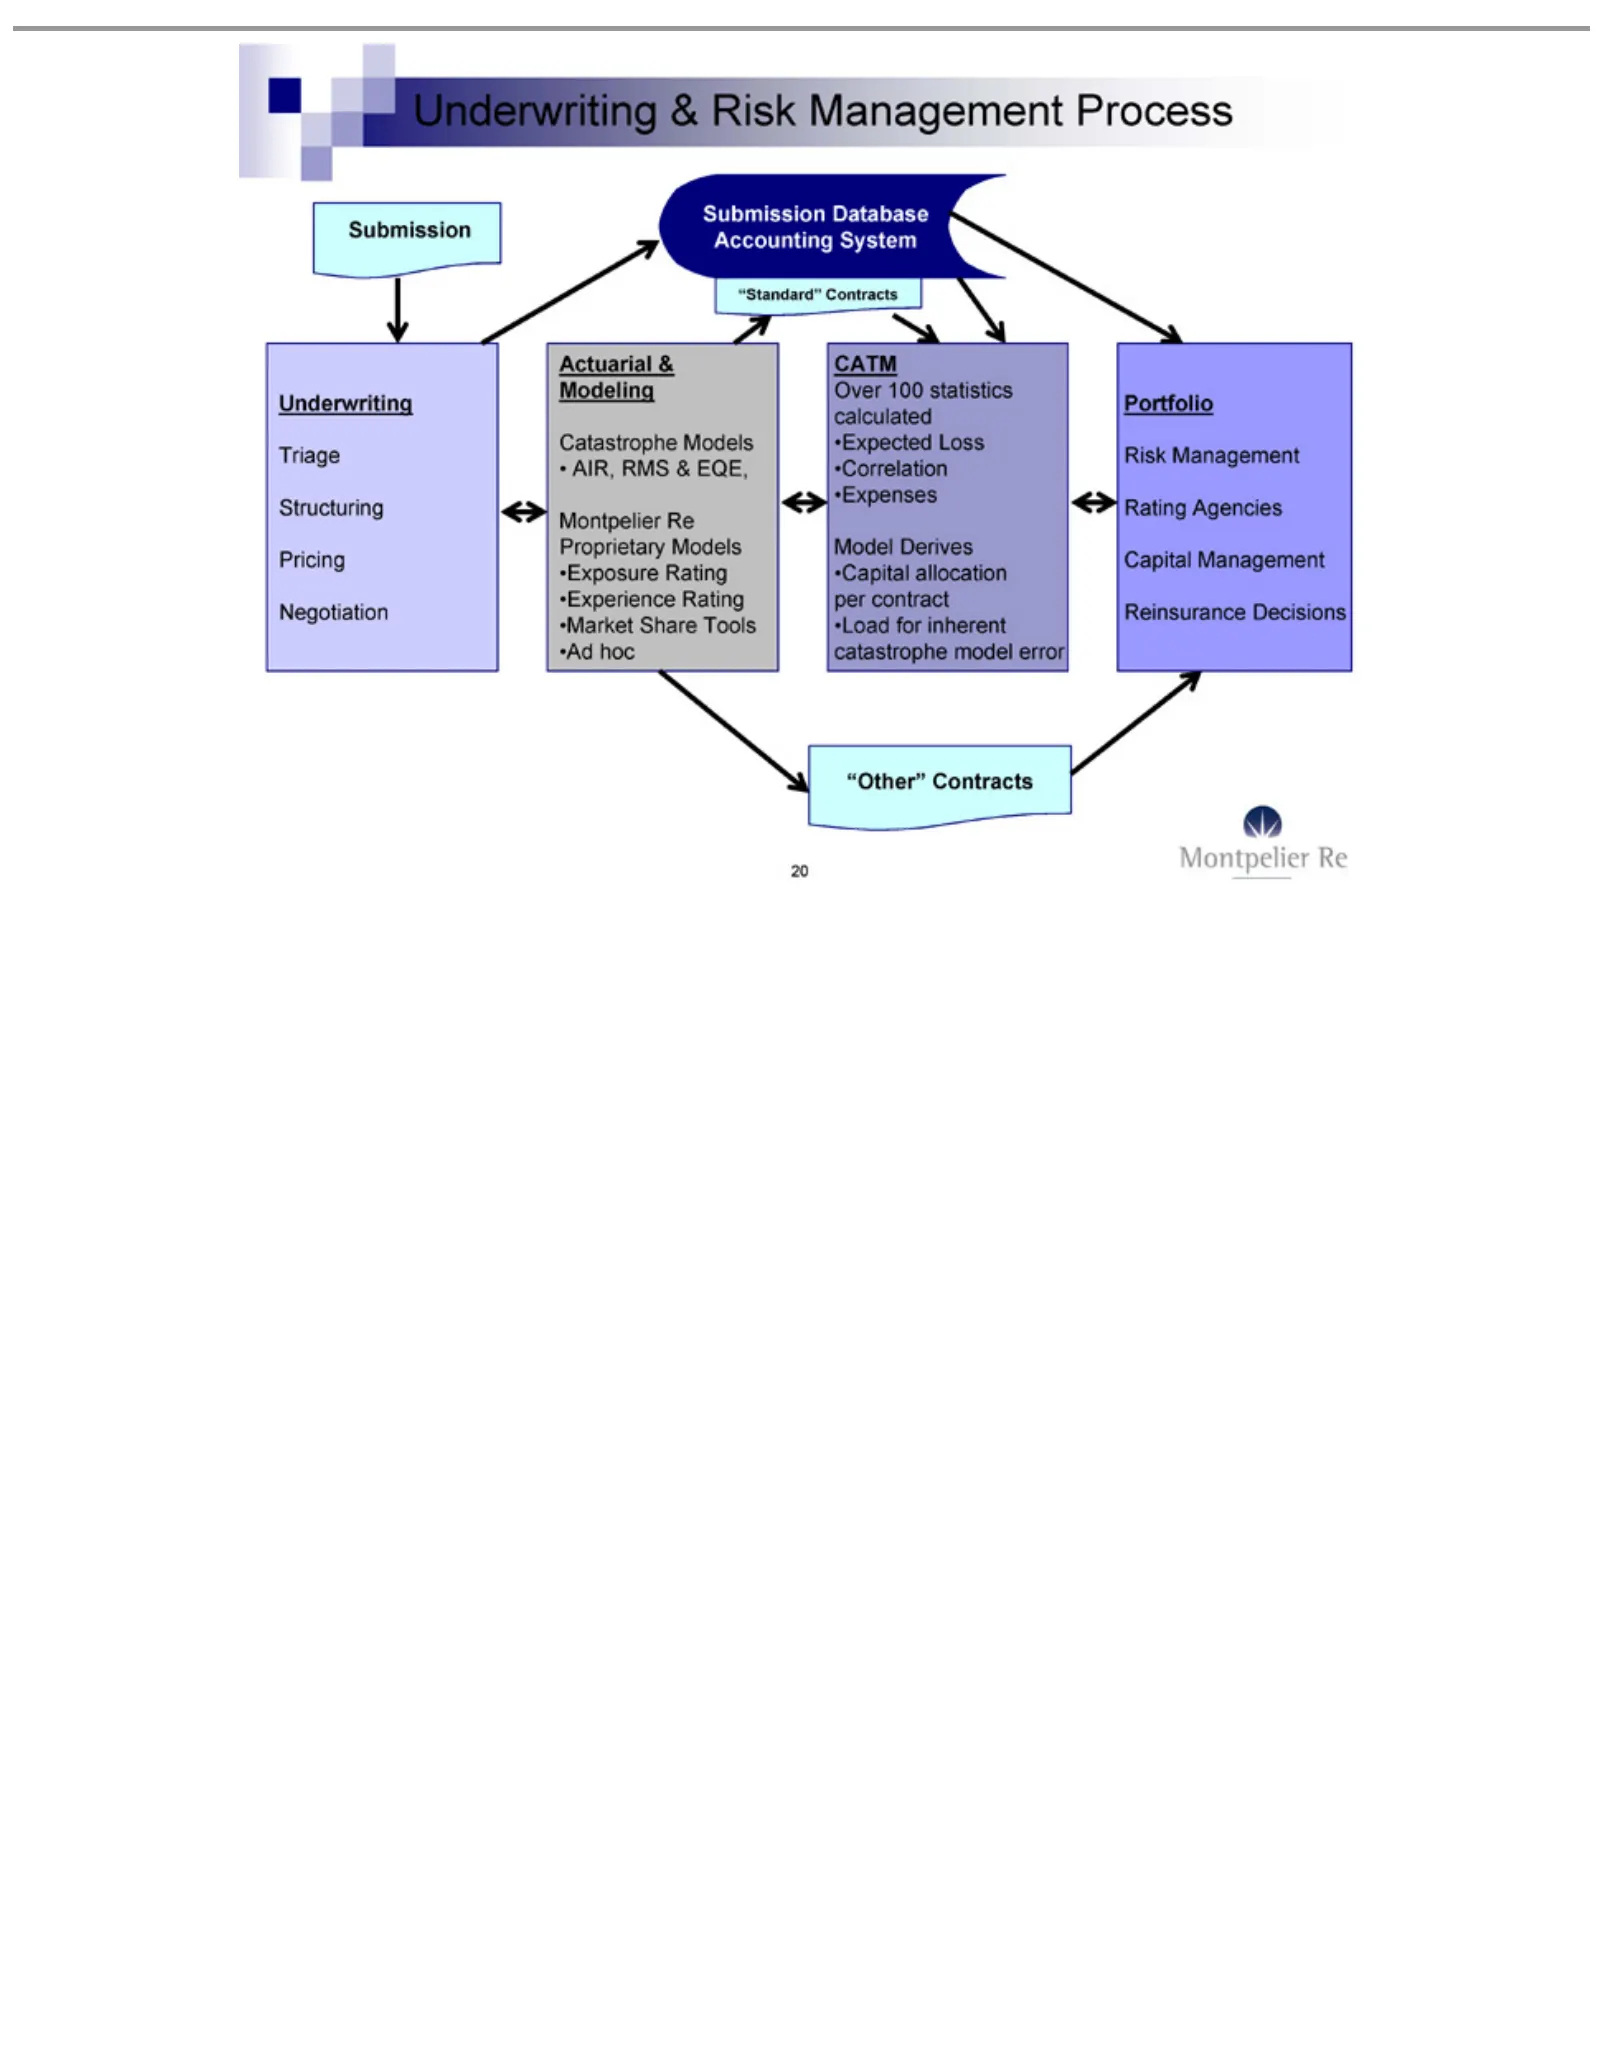
Slide 20: Submission Triage and Underwriting Process
Submission “Standard” Triage Underwriting Actuarial Catastrophe AIR, Montpelier Exposure Experience Market Ad Over CATM Expected Model Expenses Correlation Load Risk Portfolio Rating Capital Reinsurance “Other” 20 hoc Management RMS 100 for Structuring Derives Agencies Share allocation Management Co
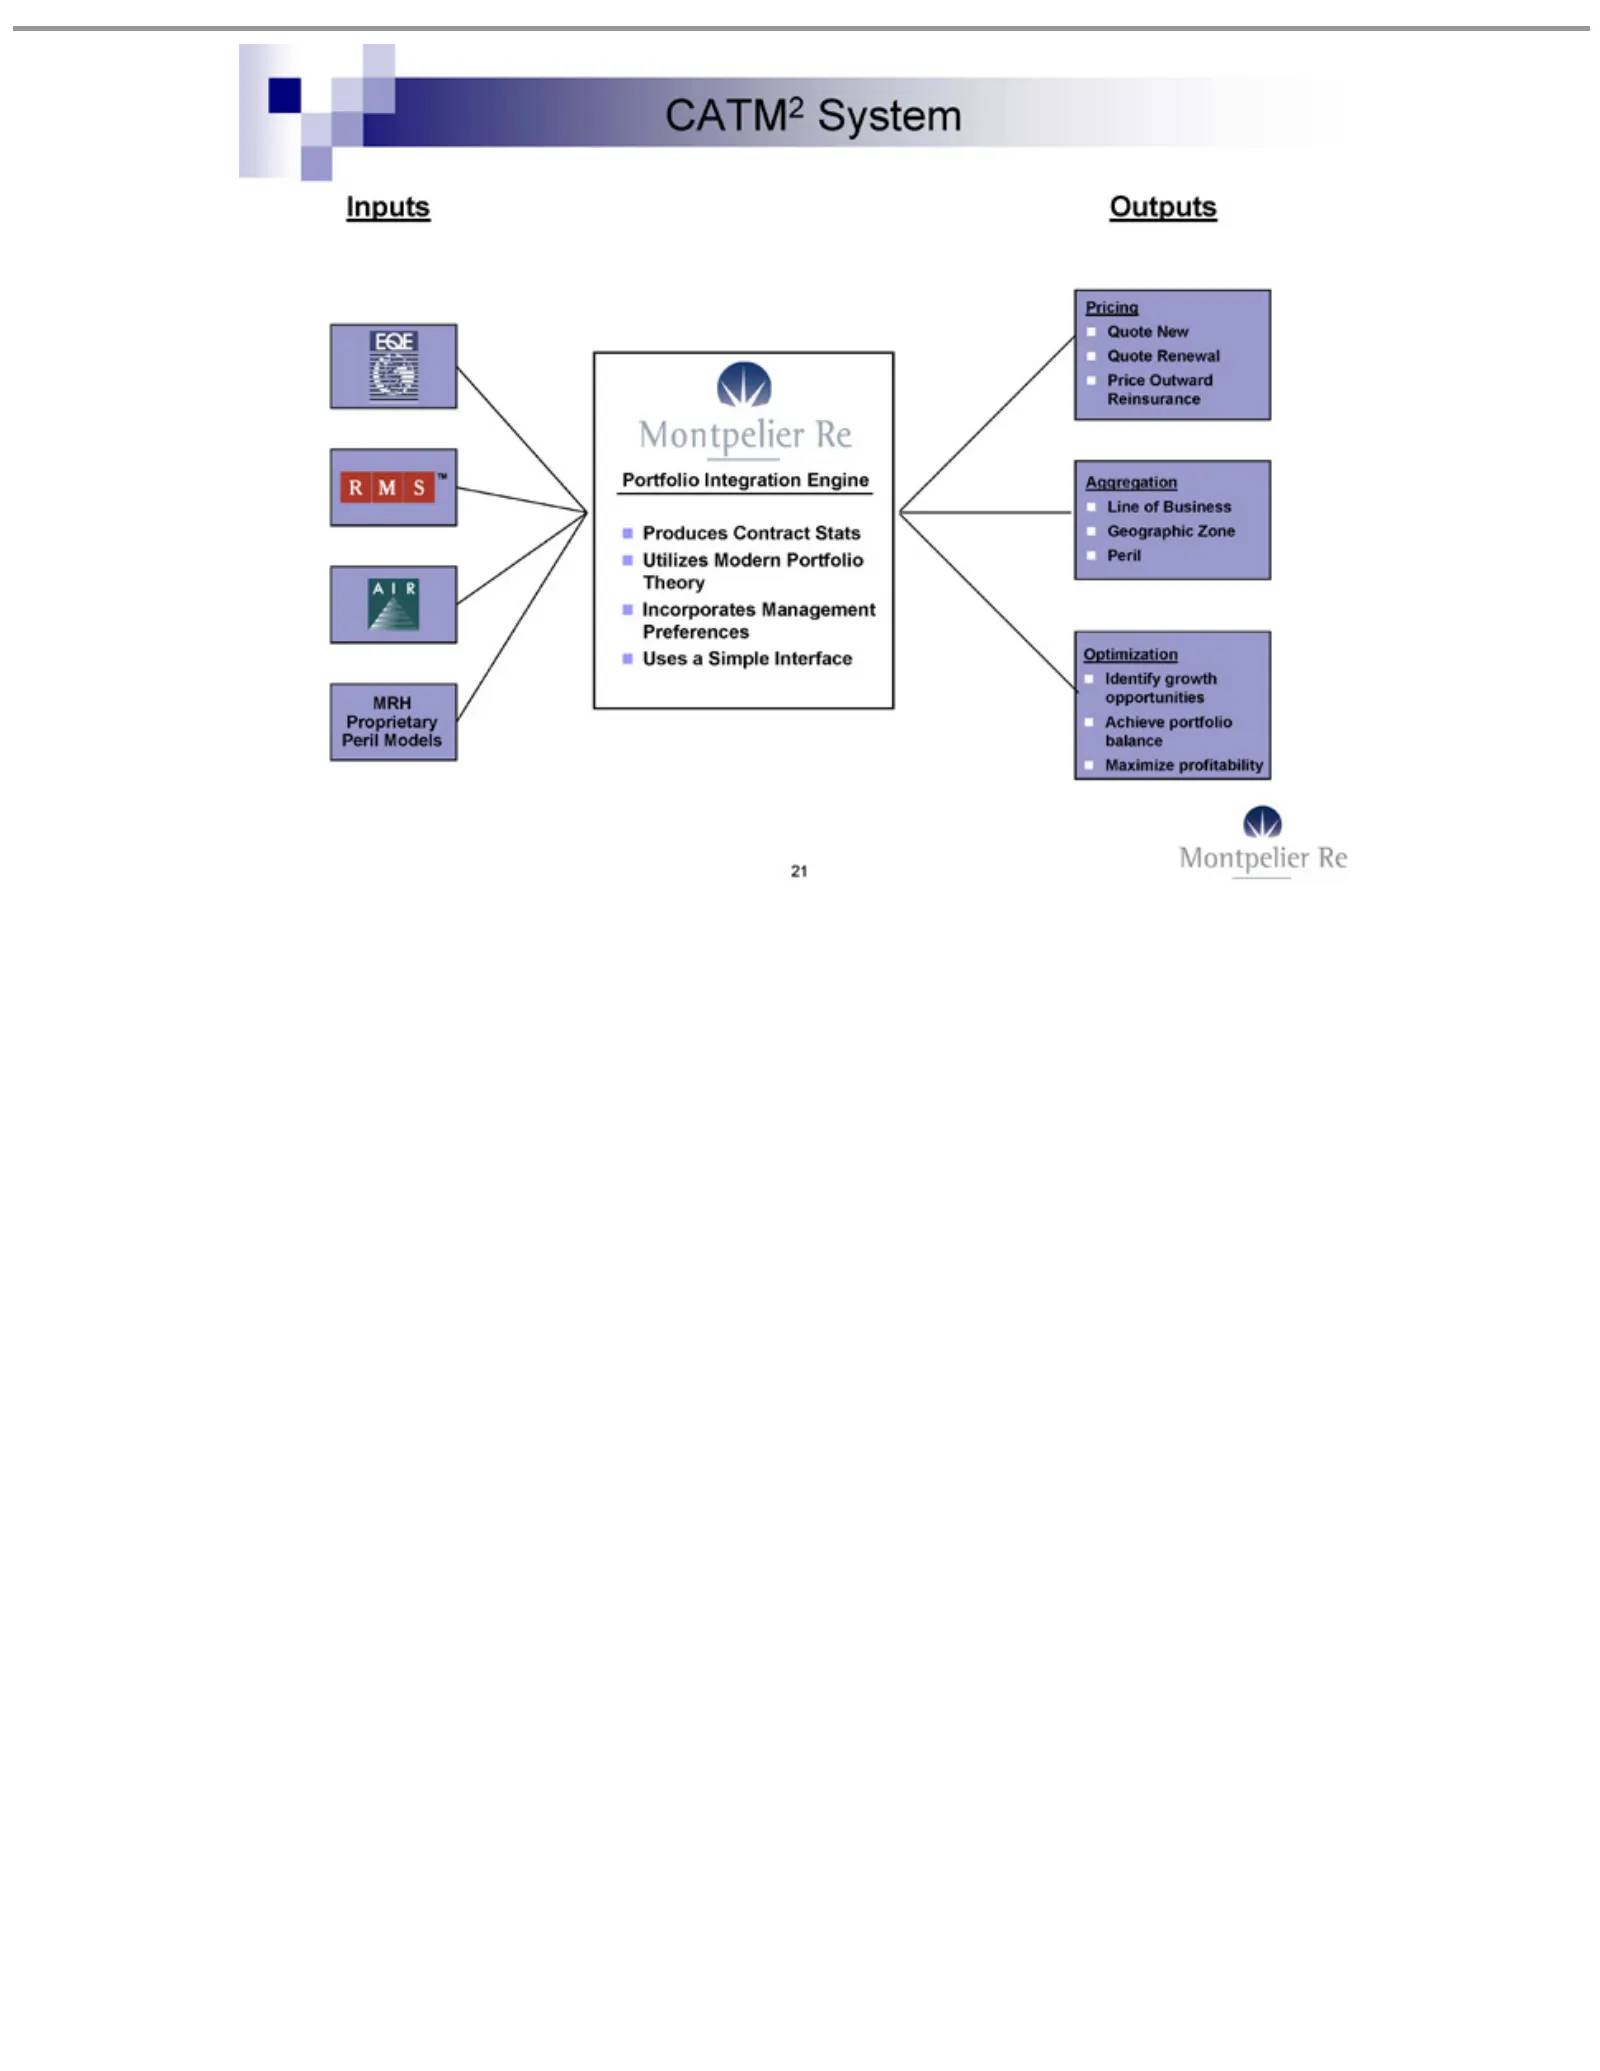
Slide 21: CATM2 Inputs and Outputs
CATM2 Inputs MRH Portfolio Produces Utilizes Incorporates Uses Pricing Quote Price Line Aggregation Geographic Identify Optimization Peril Achieve Maximize 21 of aOutward Proprietary New Renewal Outputs Simple Business Modern growth System portfolio Integration Contract profitability Zone Management
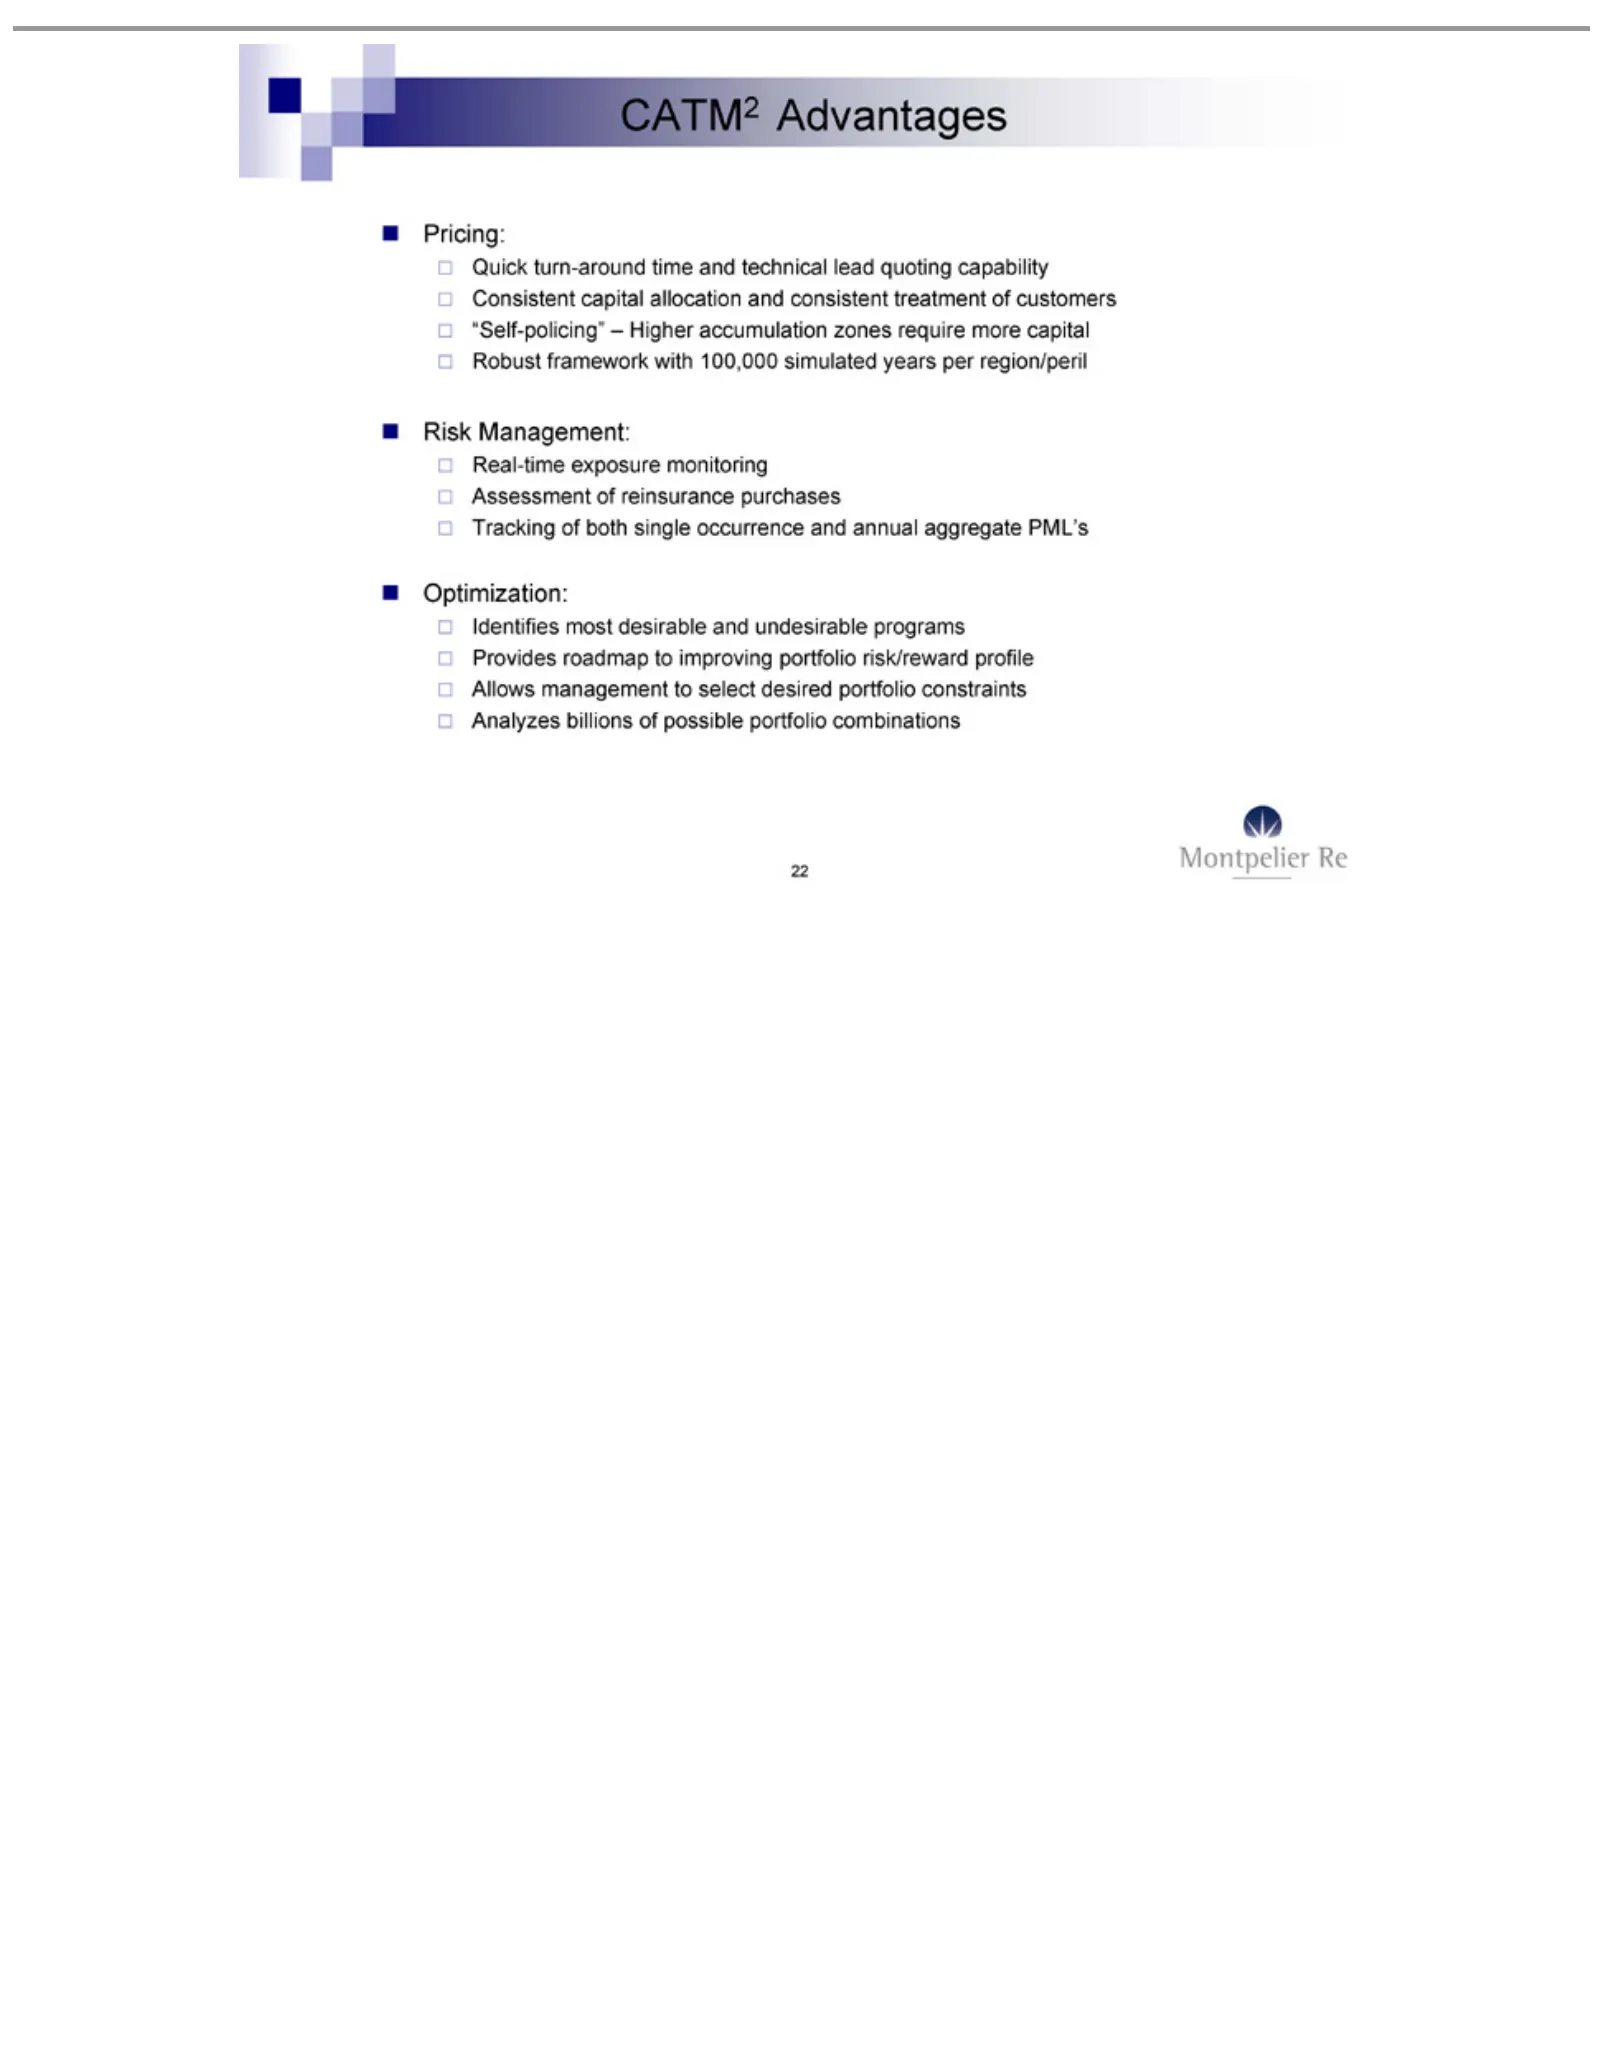
Slide 22: CATM2 Advantages: Quick Pricing and Risk Management
CATM2 Quick Pricing: Consistent “Self-policing” Robust Risk Real-time Assessment Tracking Identifies Optimization: Provides Allows Analyzes 22 Management: turn-around framework management Advantages roadmap of billions most exposure capital both of reinsurance desirable – single Higher of allocation
Slide 23: Financial Overview: Creating Value Through Strength and Flexibility
Financial “Creating Thomas Chief Neil SVP, McConachie Treasurer Financial Kemp Overview: Value&Officer Through Chief Accounting Strength and Officer Flexibility”
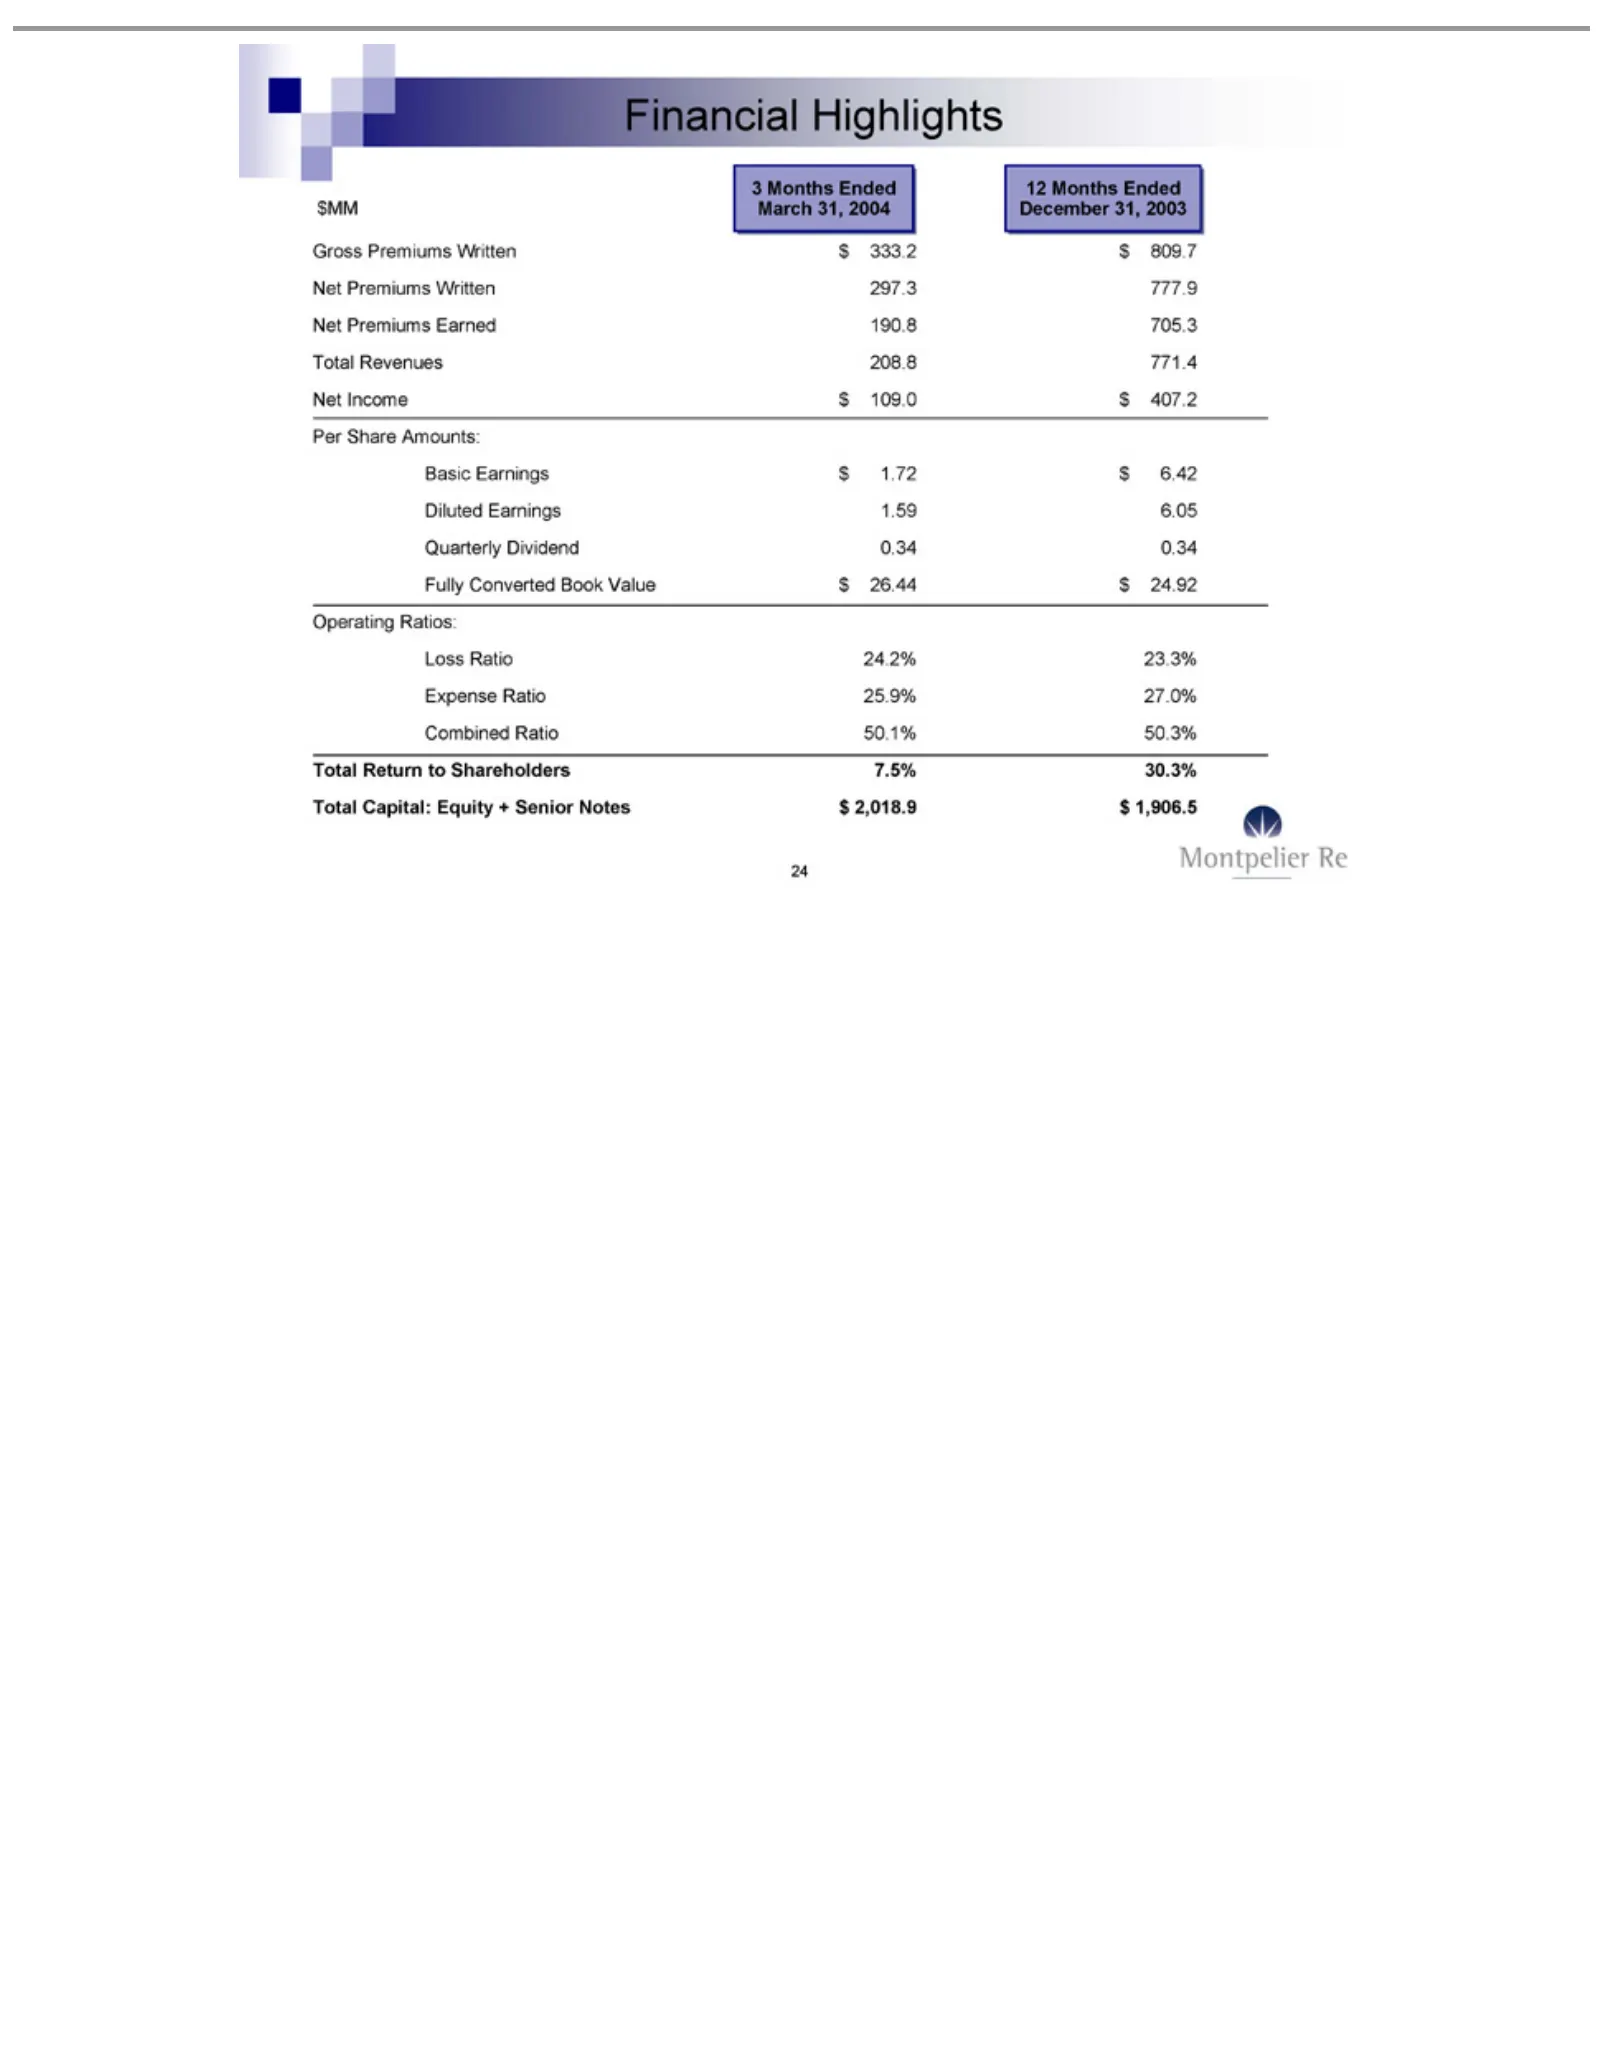
Slide 24: Financial Highlights
3Financial Gross $MM Net Per Basic Diluted Quarterly Fully Operating Loss Expense Combined Total 24Months Share Premiums Income Ratio Revenues Return Capital: Converted Earnings Premiums Earnings Ratio Highlights Amounts: Ended Dividend Ratios: Ratio 24.2% $to109.0 Equity Written Earned 25.9% $Share
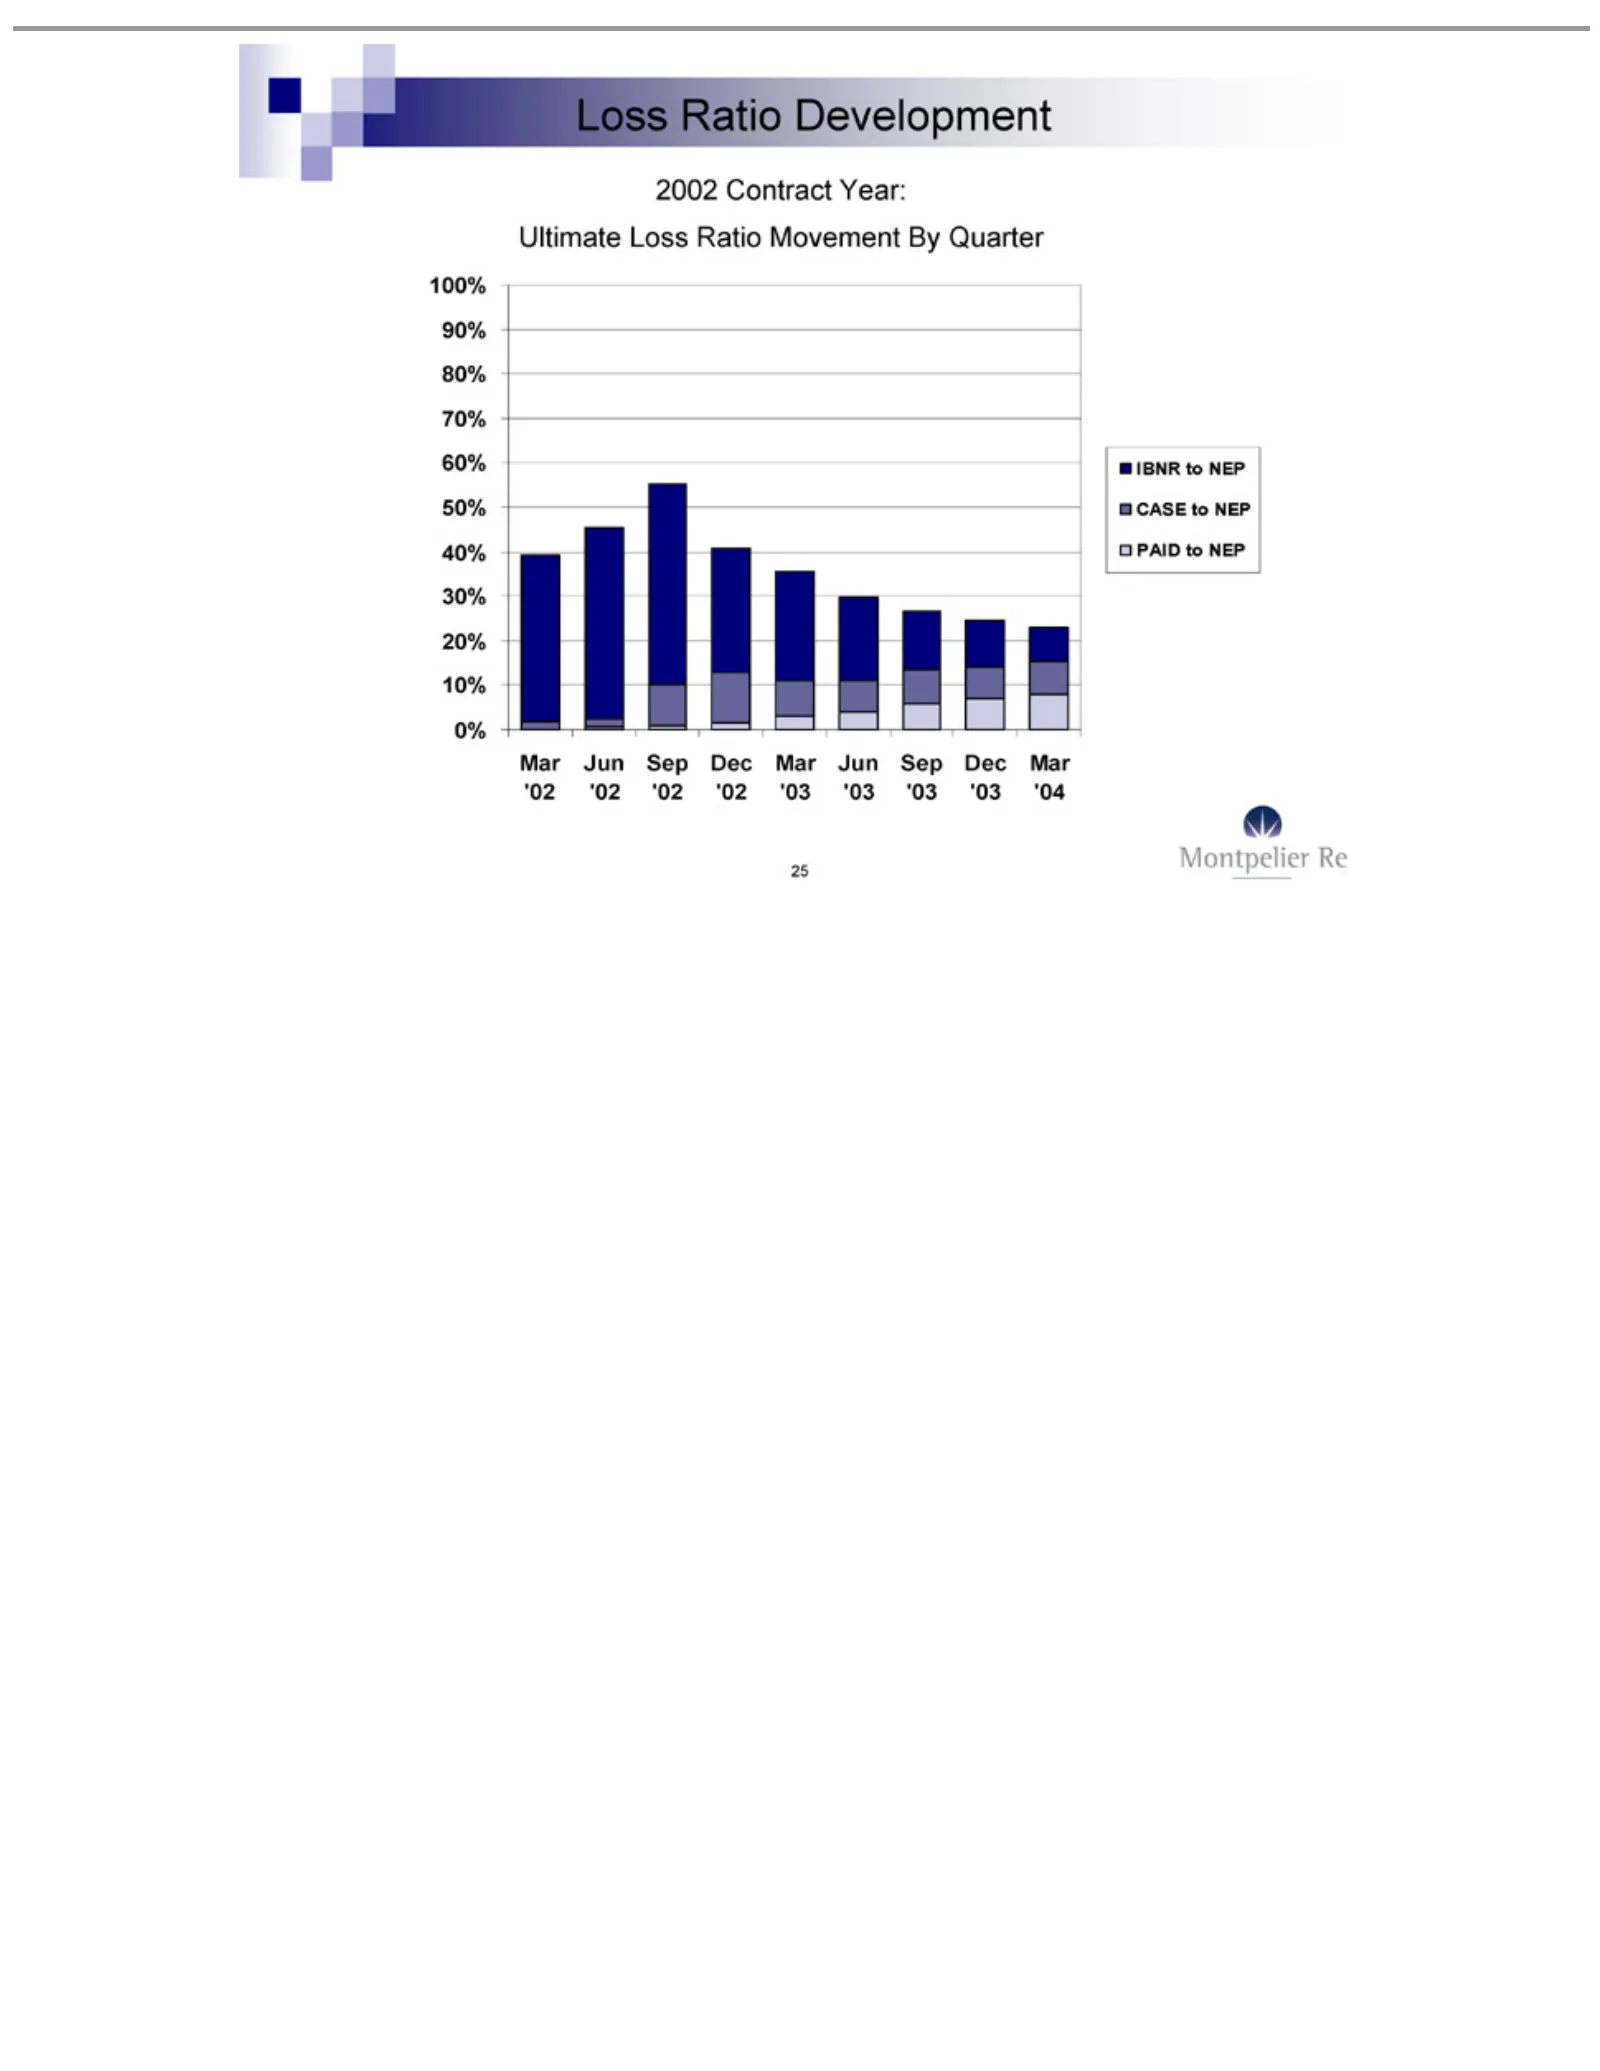
Slide 25: 2002 Ultimate Loss Ratio Development
Loss‘02 2002 Ultimate 100% Mar IBNR CASE PAID 25 Ratio Contract to 90% to toJun NEP NEP Loss NEP Development 80% ‘02 Ratio Year: Sep 70%Movement ‘02 60%Dec 50%‘02By 40% Mar Quarter 30% ‘03 Jun 20%‘03 10% Sep0% ‘03 Dec ‘03 Mar ‘04
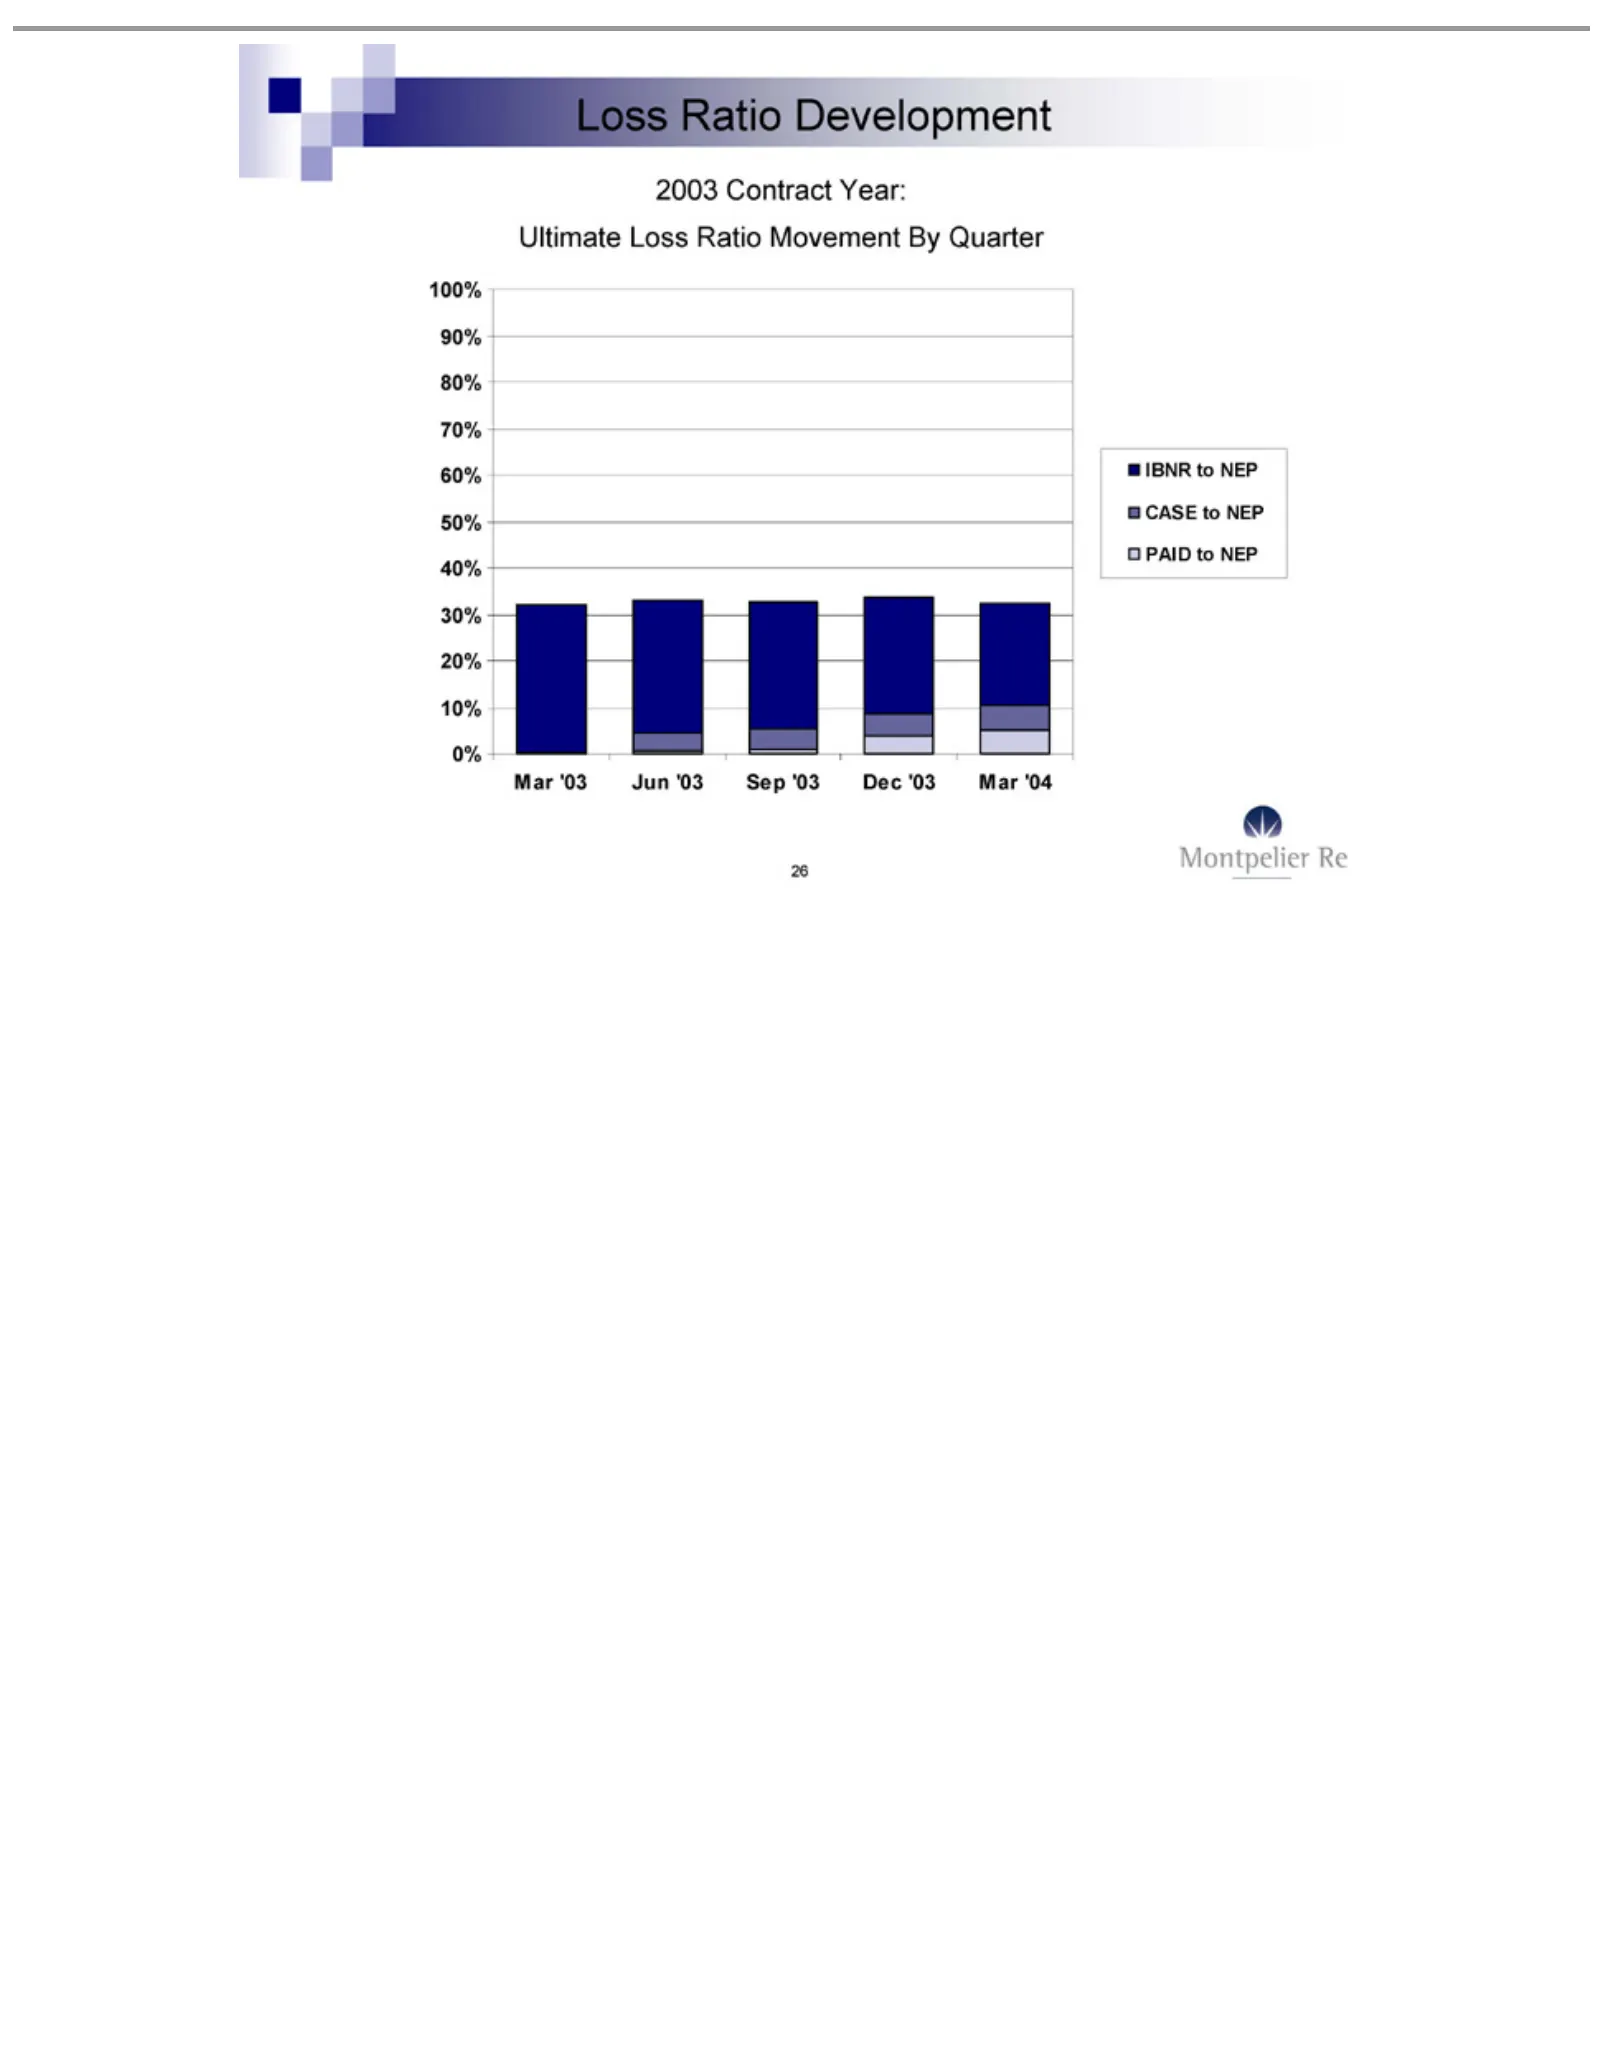
Slide 26: 2003 Ultimate Loss Ratio Development
Loss‘03 2003 Ultimate 100% Mar IBNR CASE PAID 26 Ratio Contract to 90% to toJun NEP NEP Loss NEP Development 80% ‘03 Ratio Year: Sep 70%Movement ‘03 60%Dec 50%‘03By 40% Mar Quarter 30% ‘04 20% 10% 0%
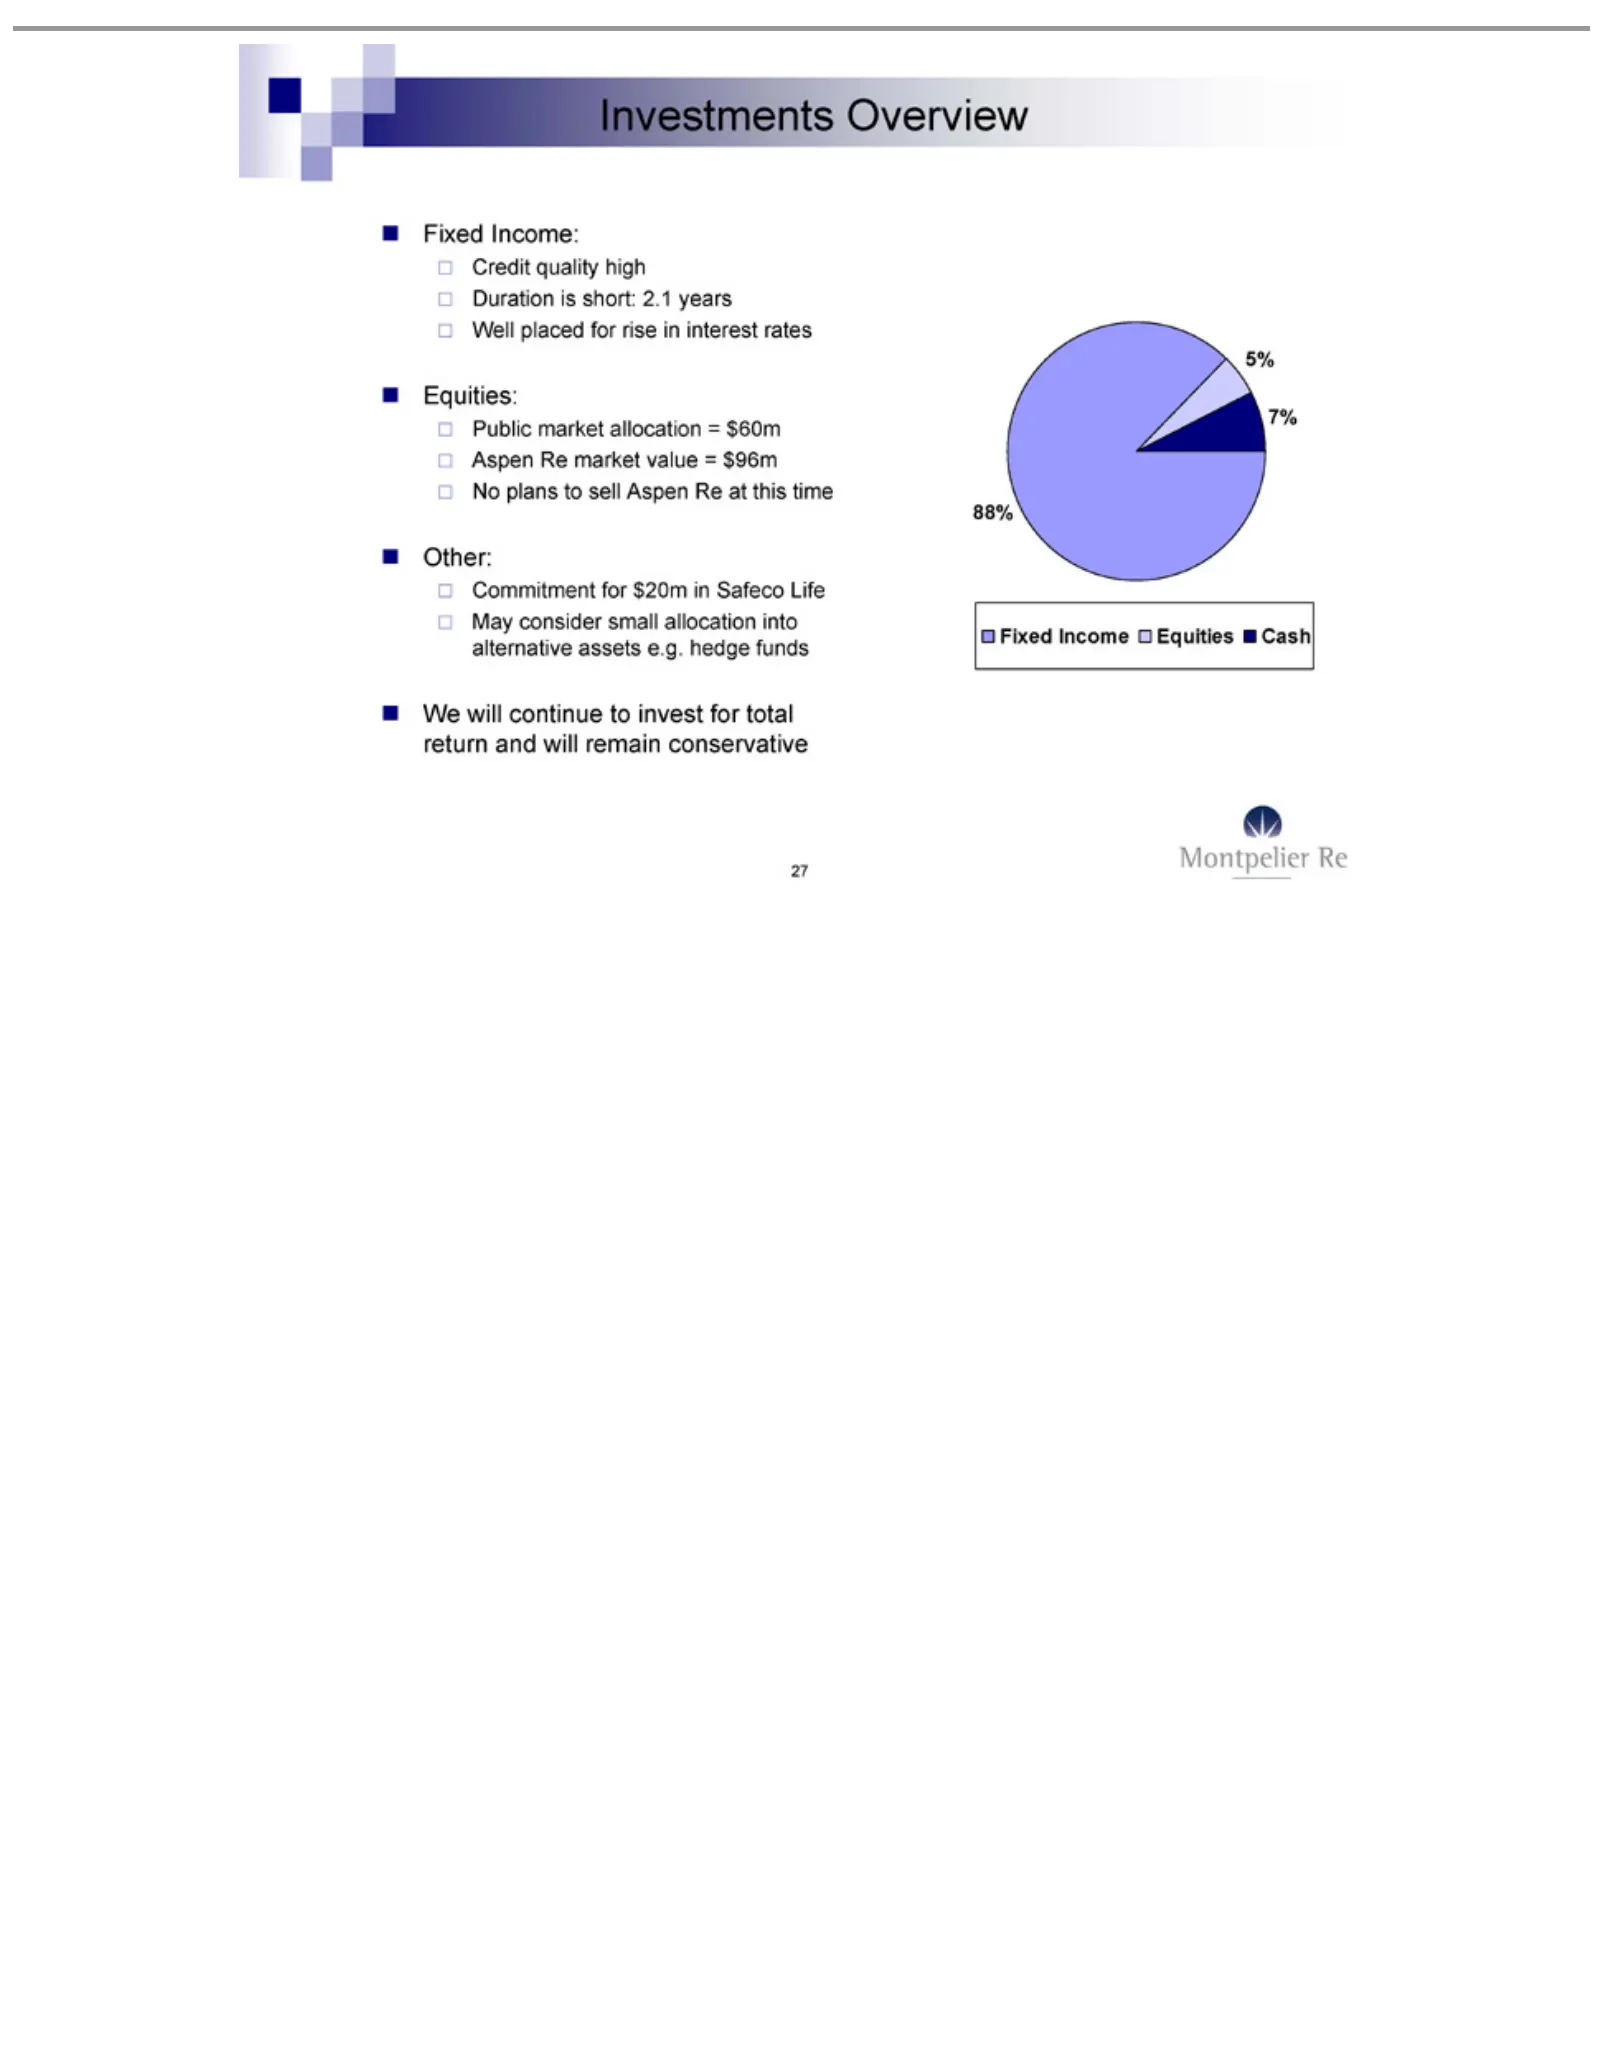
Slide 27: Investments Overview
Investments Credit Duration Well Public Equities: Aspen No Commitment Other: May We 5% Fixed 27 plans will 7% consider placed Income: Income quality Re market 88% continue is tomarket short: sell for Overview for small Equities high allocation rise Aspen $20m to value 2.1in invest allocation years i
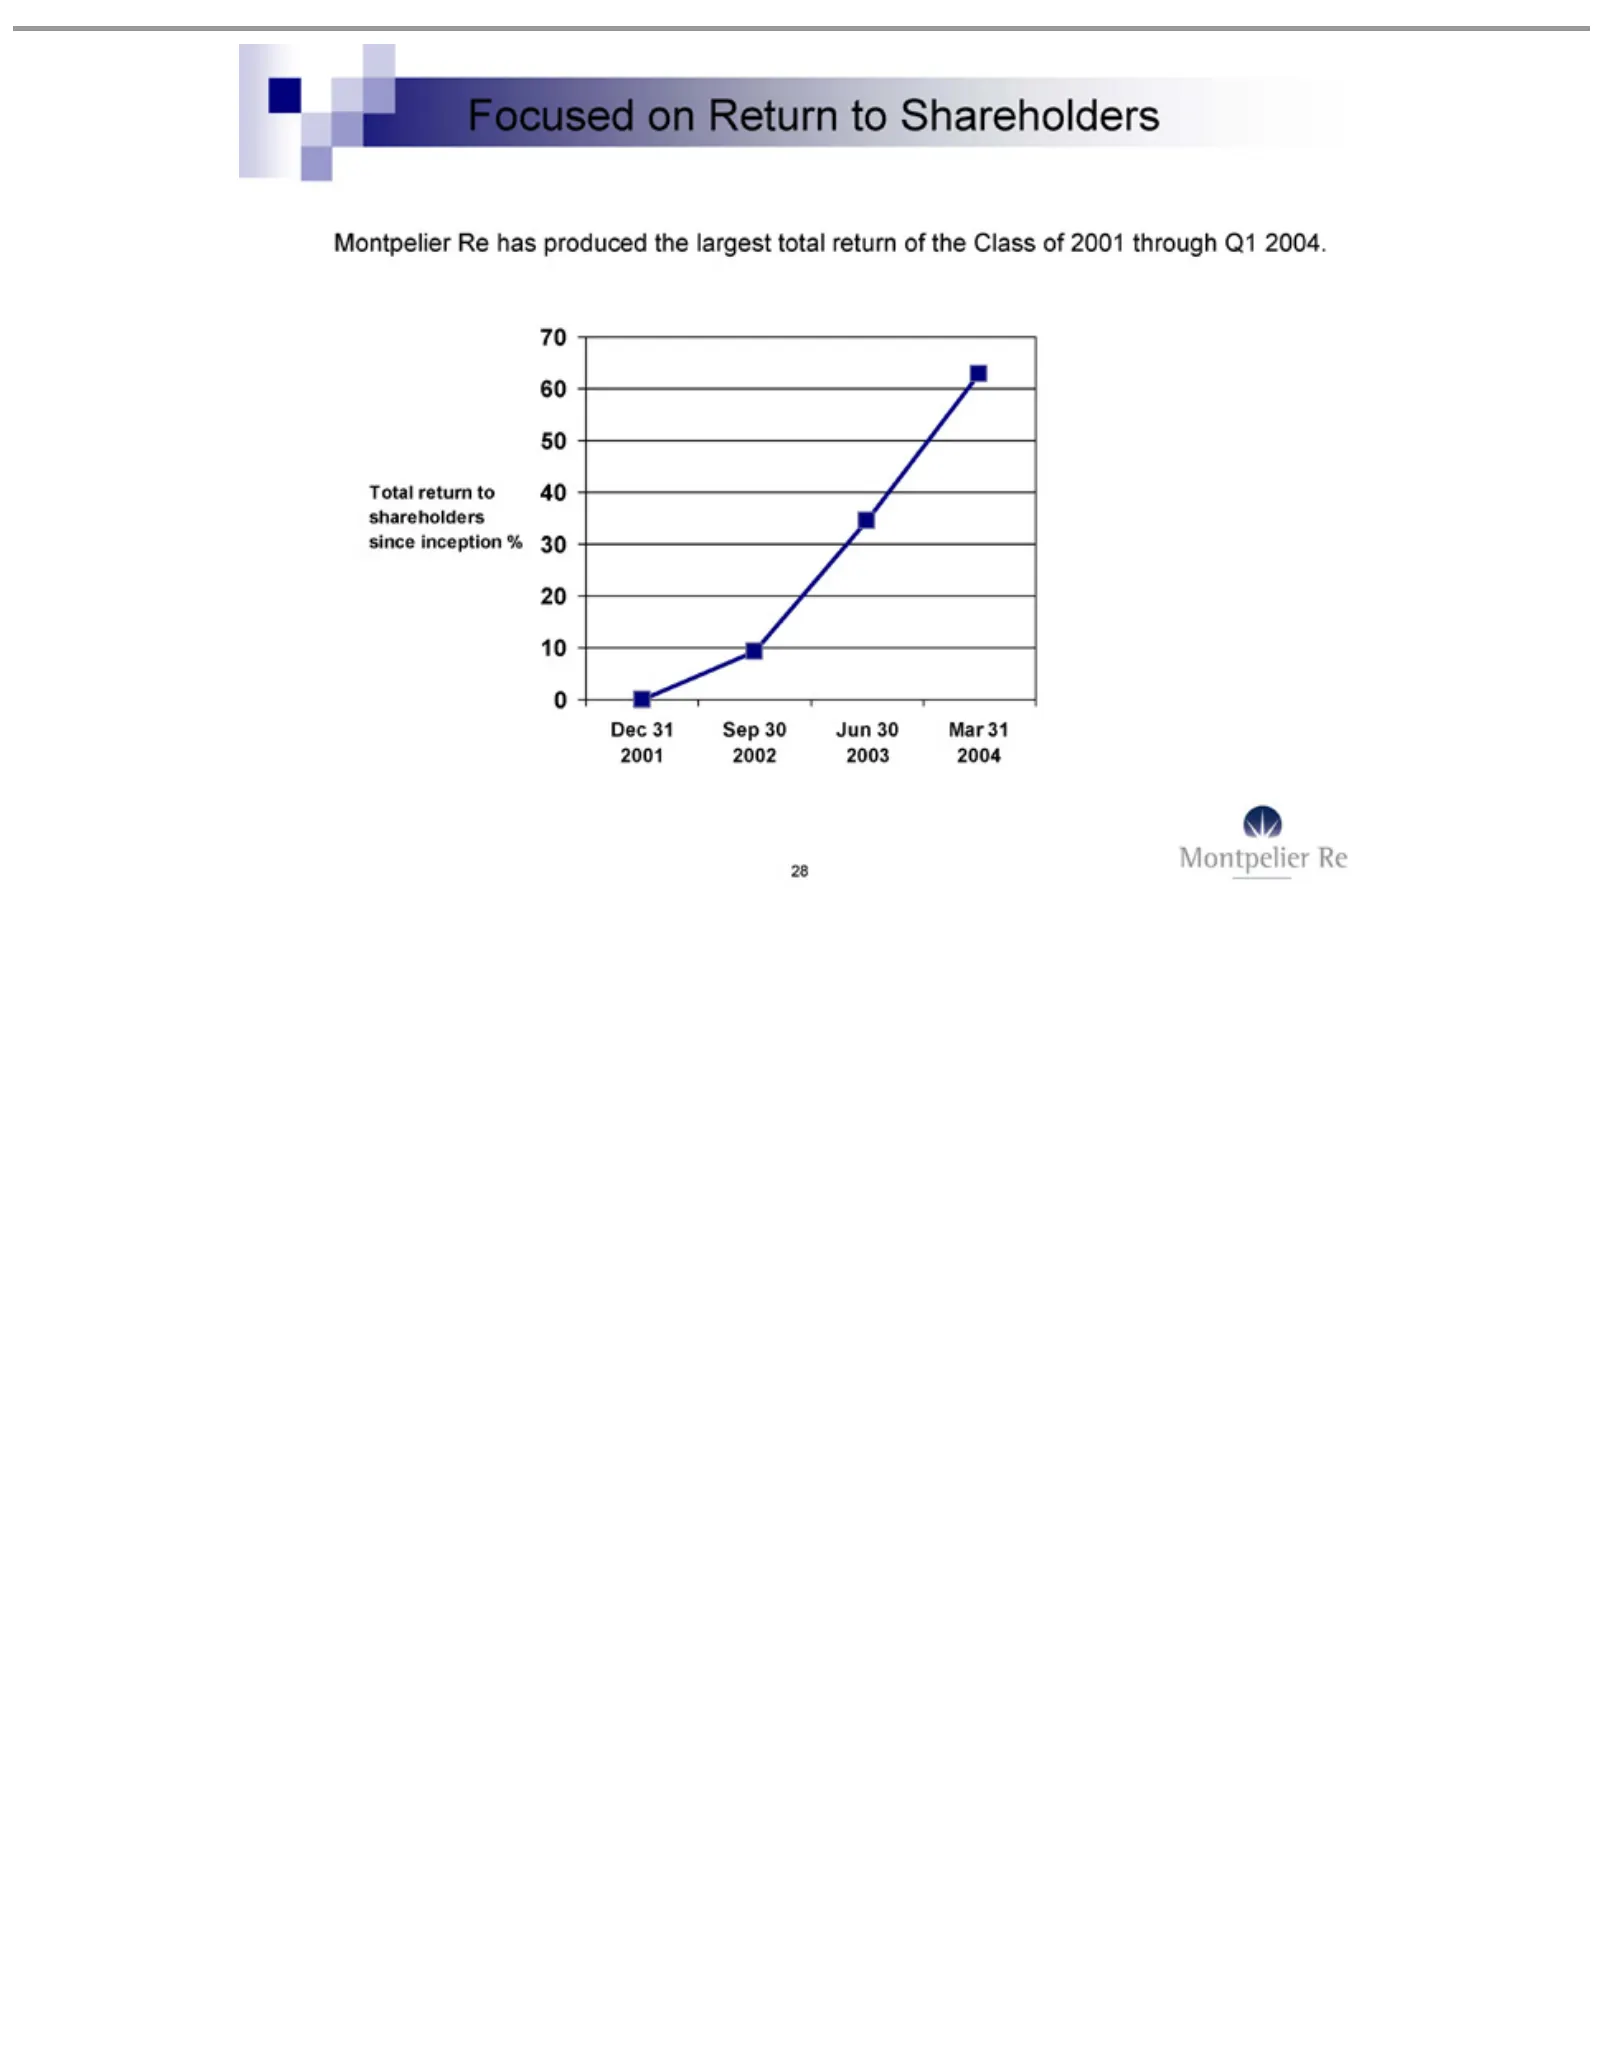
Slide 28: Focused on Total Return to Shareholders
Focused Montpelier Total 70 Dec 28 6031 return 502001 on 40Re Return to 30 Sep shareholders has 2030 10 produced to2002 0Shareholders Jun since the 30largest 2003 inception Mar total% 31 return 2004of the Class of 2001 through Q1 2004.
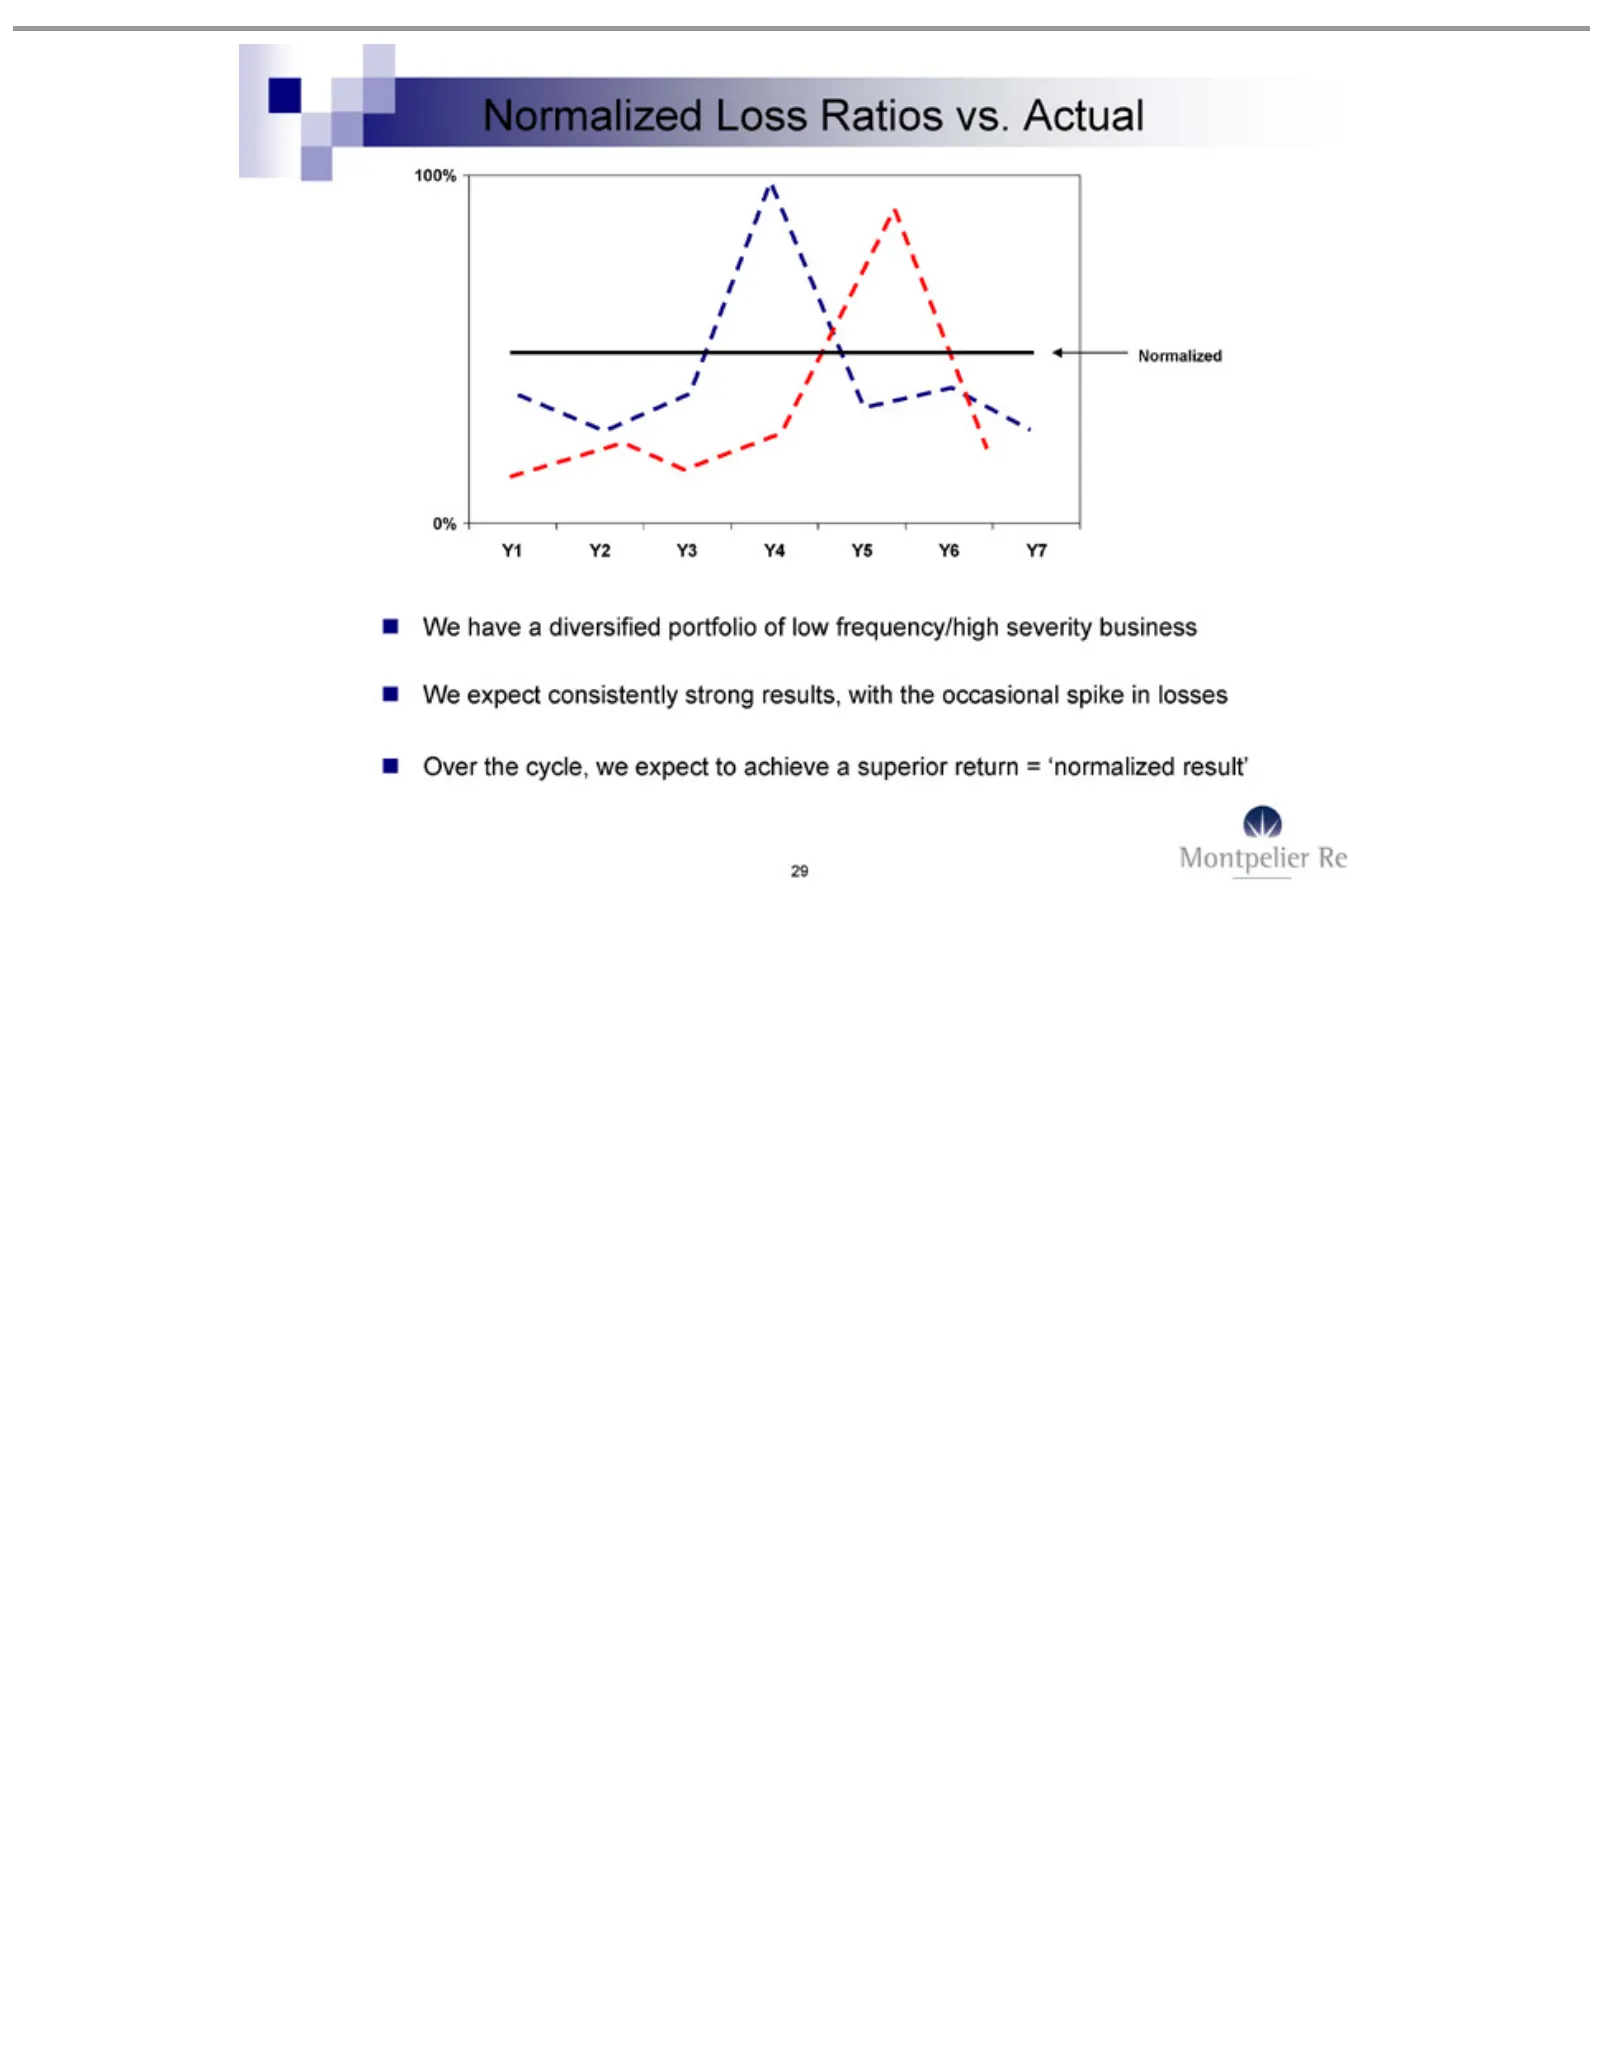
Slide 29: Normalized Loss Ratios vs. Actual
100% Y1 Normalized We Over 29 Y2 have expect the 0% Y3acycle, Y4 diversified consistently Loss Y5weRatios Y6 expect Y7 portfolio strong vs.toActual achieve results, of lowawith frequency/high superior the occasional return = severity ‘normalized spikebusiness in losses result’
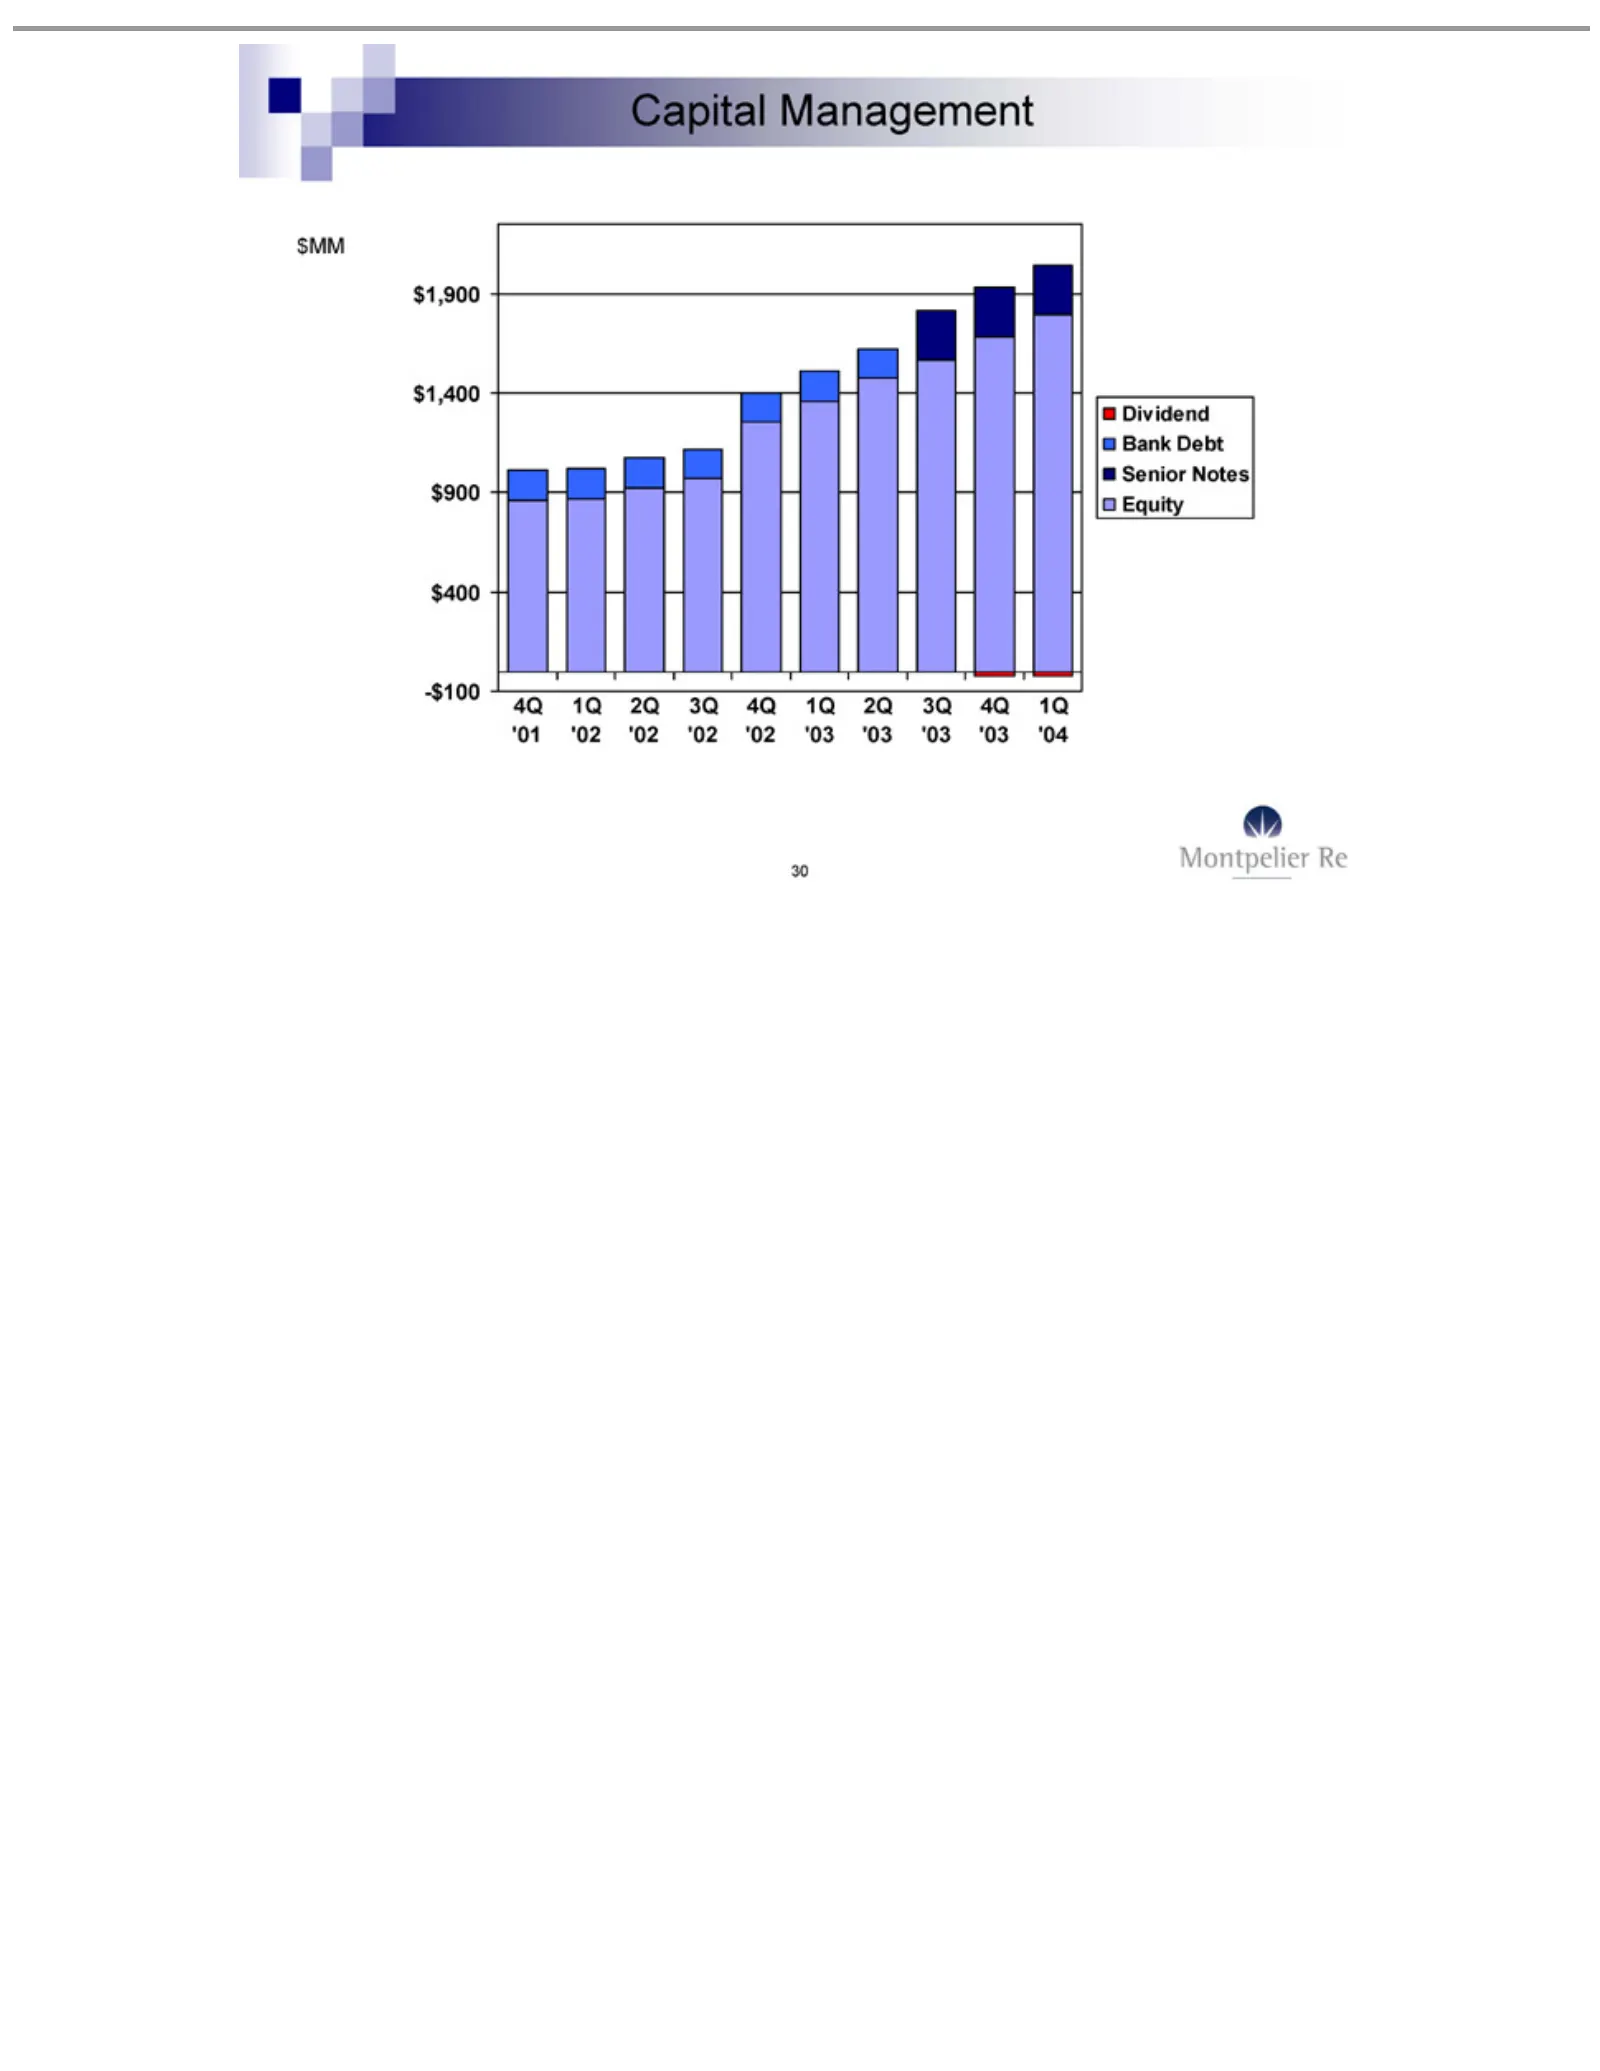
Slide 30: Capital Management
Capital $MM 4Q Dividend 30 ‘01$1,900 1Q Management Bank ‘02$1,400 2Q Debt ‘02Senior $900 3Q ‘02 $400 Notes 4Q-$‘02 Equity 1001Q ‘03 2Q ‘03 3Q ‘03 4Q ‘03 1Q ‘04
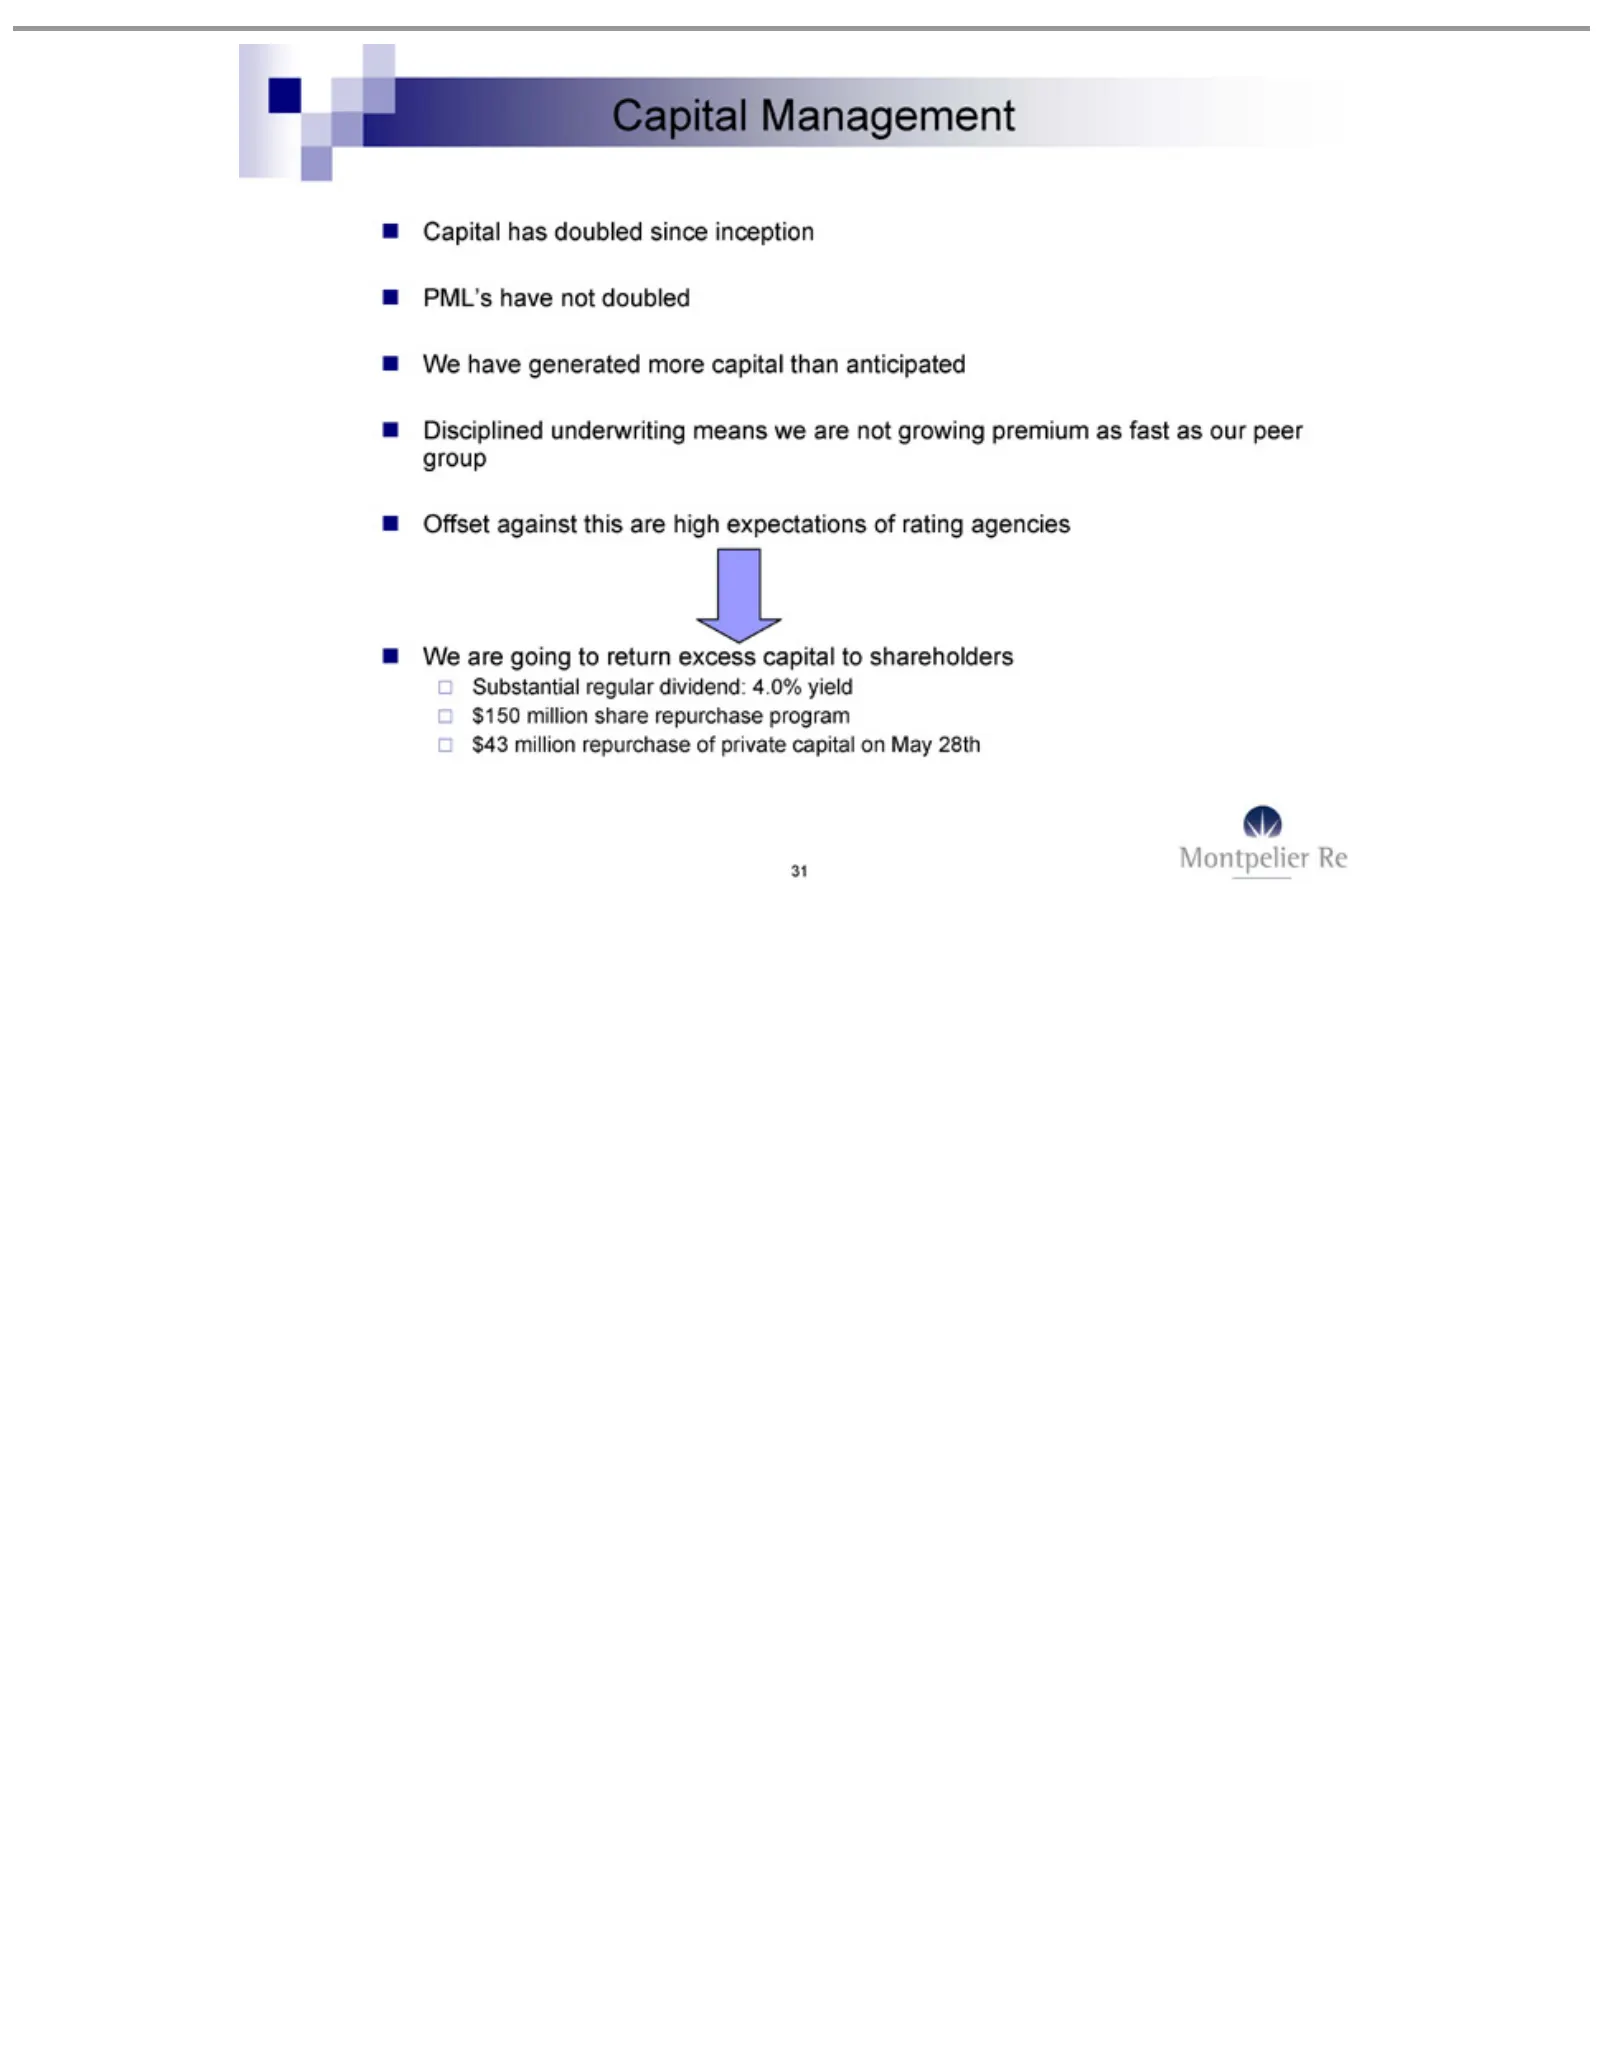
Slide 31: Disciplined Capital Management
Capital PML’s Disciplined Offset We Substantial $150 $43 31 have are million million against have going Management has generated regular doubled underwriting repurchase not share to this doubled return are repurchase dividend: more since high excess ofcapital means inception private expectations 4.0
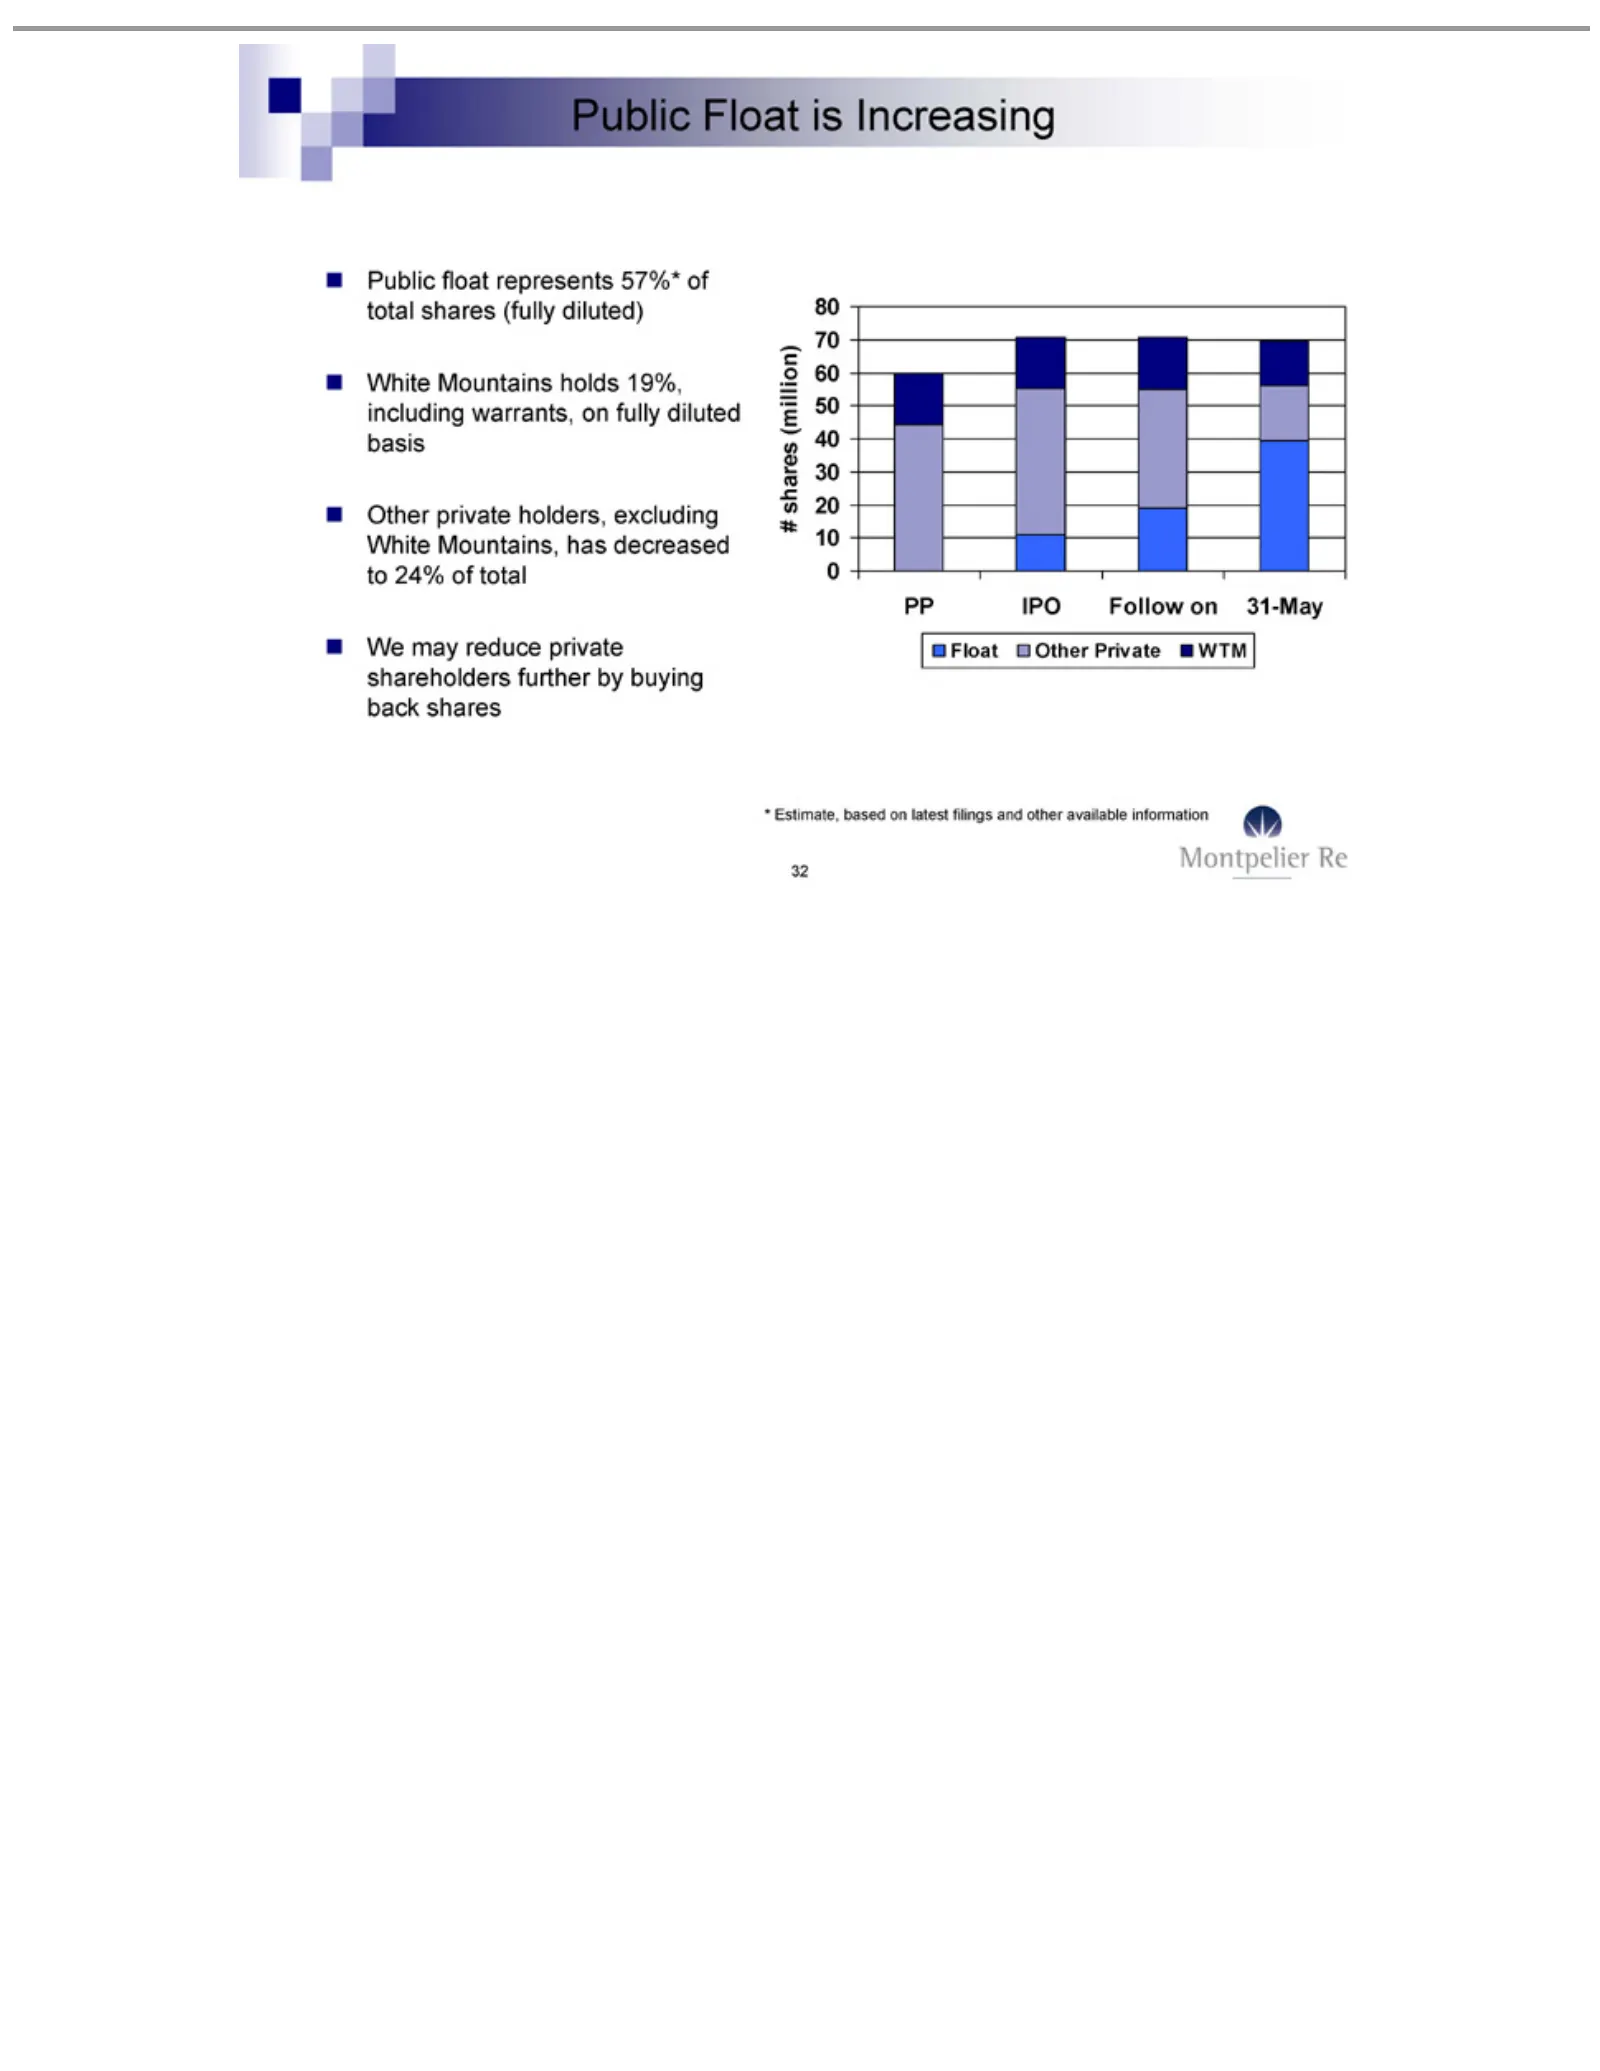
Slide 32: Public Float and Shareholders
Public White Other #We 80 PP *Float 32shares Estimate, 70 IPO may Other 60 private Mountains Float float Follow (million) reduce 50based Private represents 40 isholders, Increasing 30 on private holds on 20 31-May WTM latest 10 excluding 57%* shareholders 19%, 0 filings of including total White andf
Slide 33: Montpelier Re's Vision for the Future
Montpelier “Leadership. Thomas EVP Anthony Chairman, & Chief Busher Taylor President Re’s Knowledge. Operating Vision andfor Officer Chief Experience.” the Future: Executive Officer
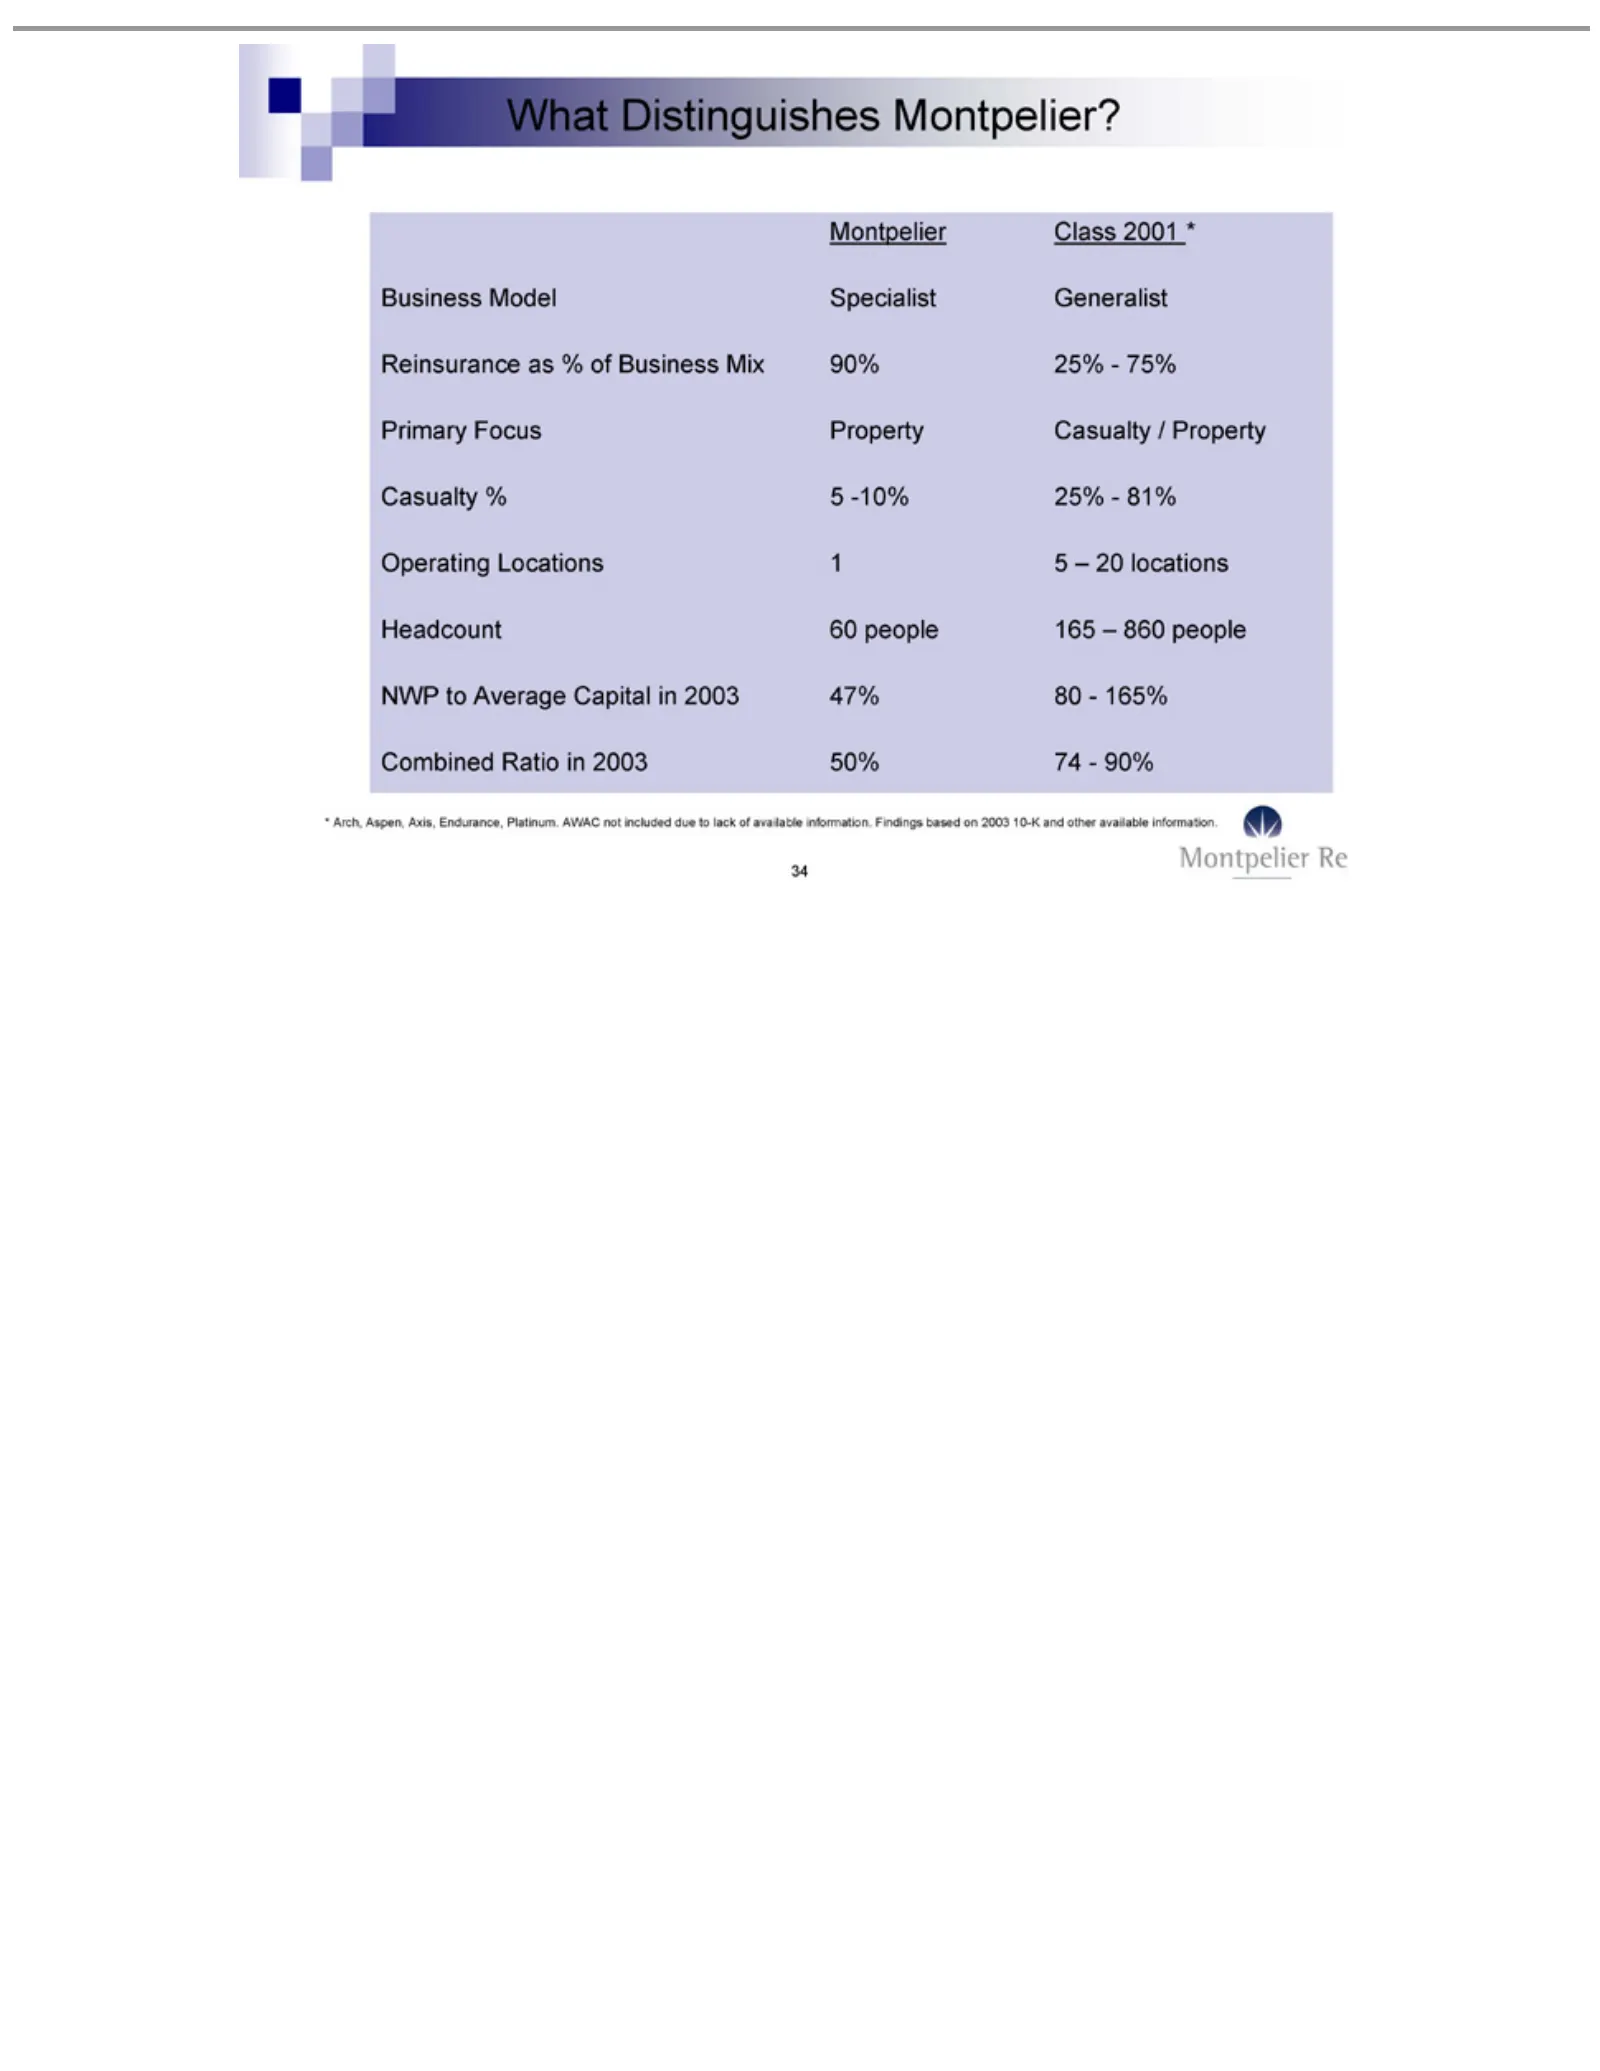
Slide 34: What Distinguishes Montpelier?
What Montpelier Business Reinsurance Primary Casualty Operating Headcount NWP *Combined 34 Arch, Distinguishes toAspen, Average Focus % Model Locations Ratio 60 Class 5as-10% people Property Axis, %Specialist in Capital 2001 of2003 25% Montpelier? Business 1Endurance, 165 5*Casualty –-in 50% –81% 20
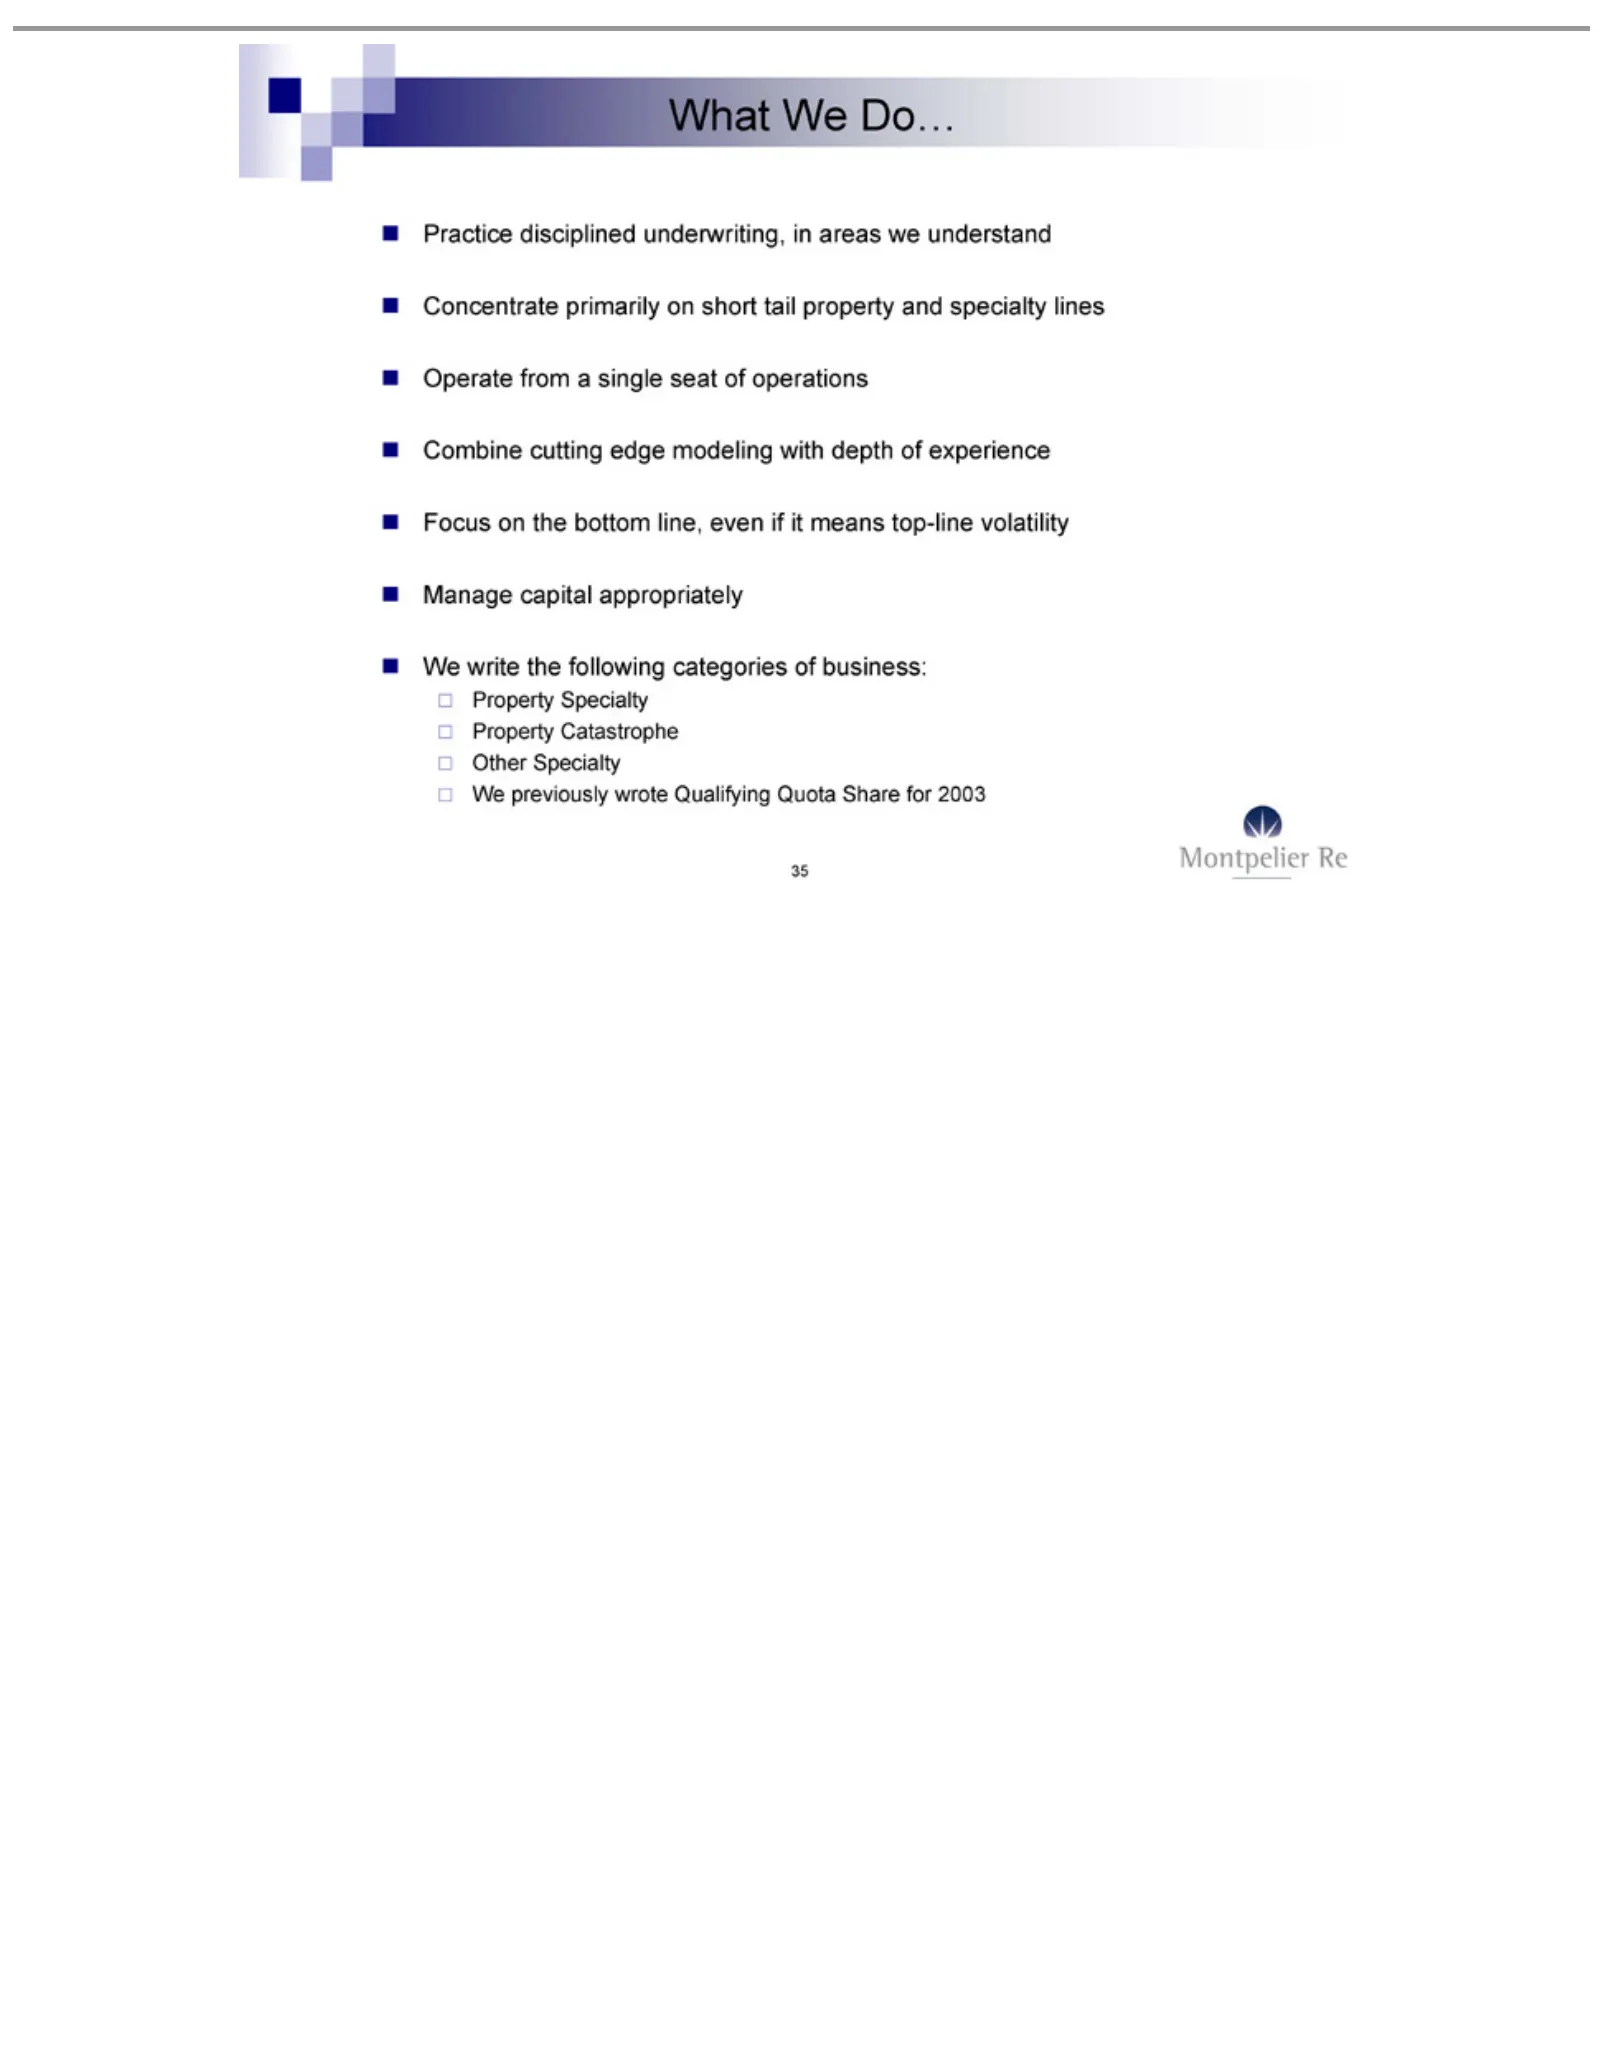
Slide 35: What We Do: Practice, Concentrate, Operate
What Practice Concentrate Operate Combine Focus Manage Property Other We 35 write previously We Specialty onfrom disciplined capital Specialty Catastrophe the cutting Do…primarily following bottom awrote single appropriately edge underwriting, line, Qualifying seat on modeling categories short even
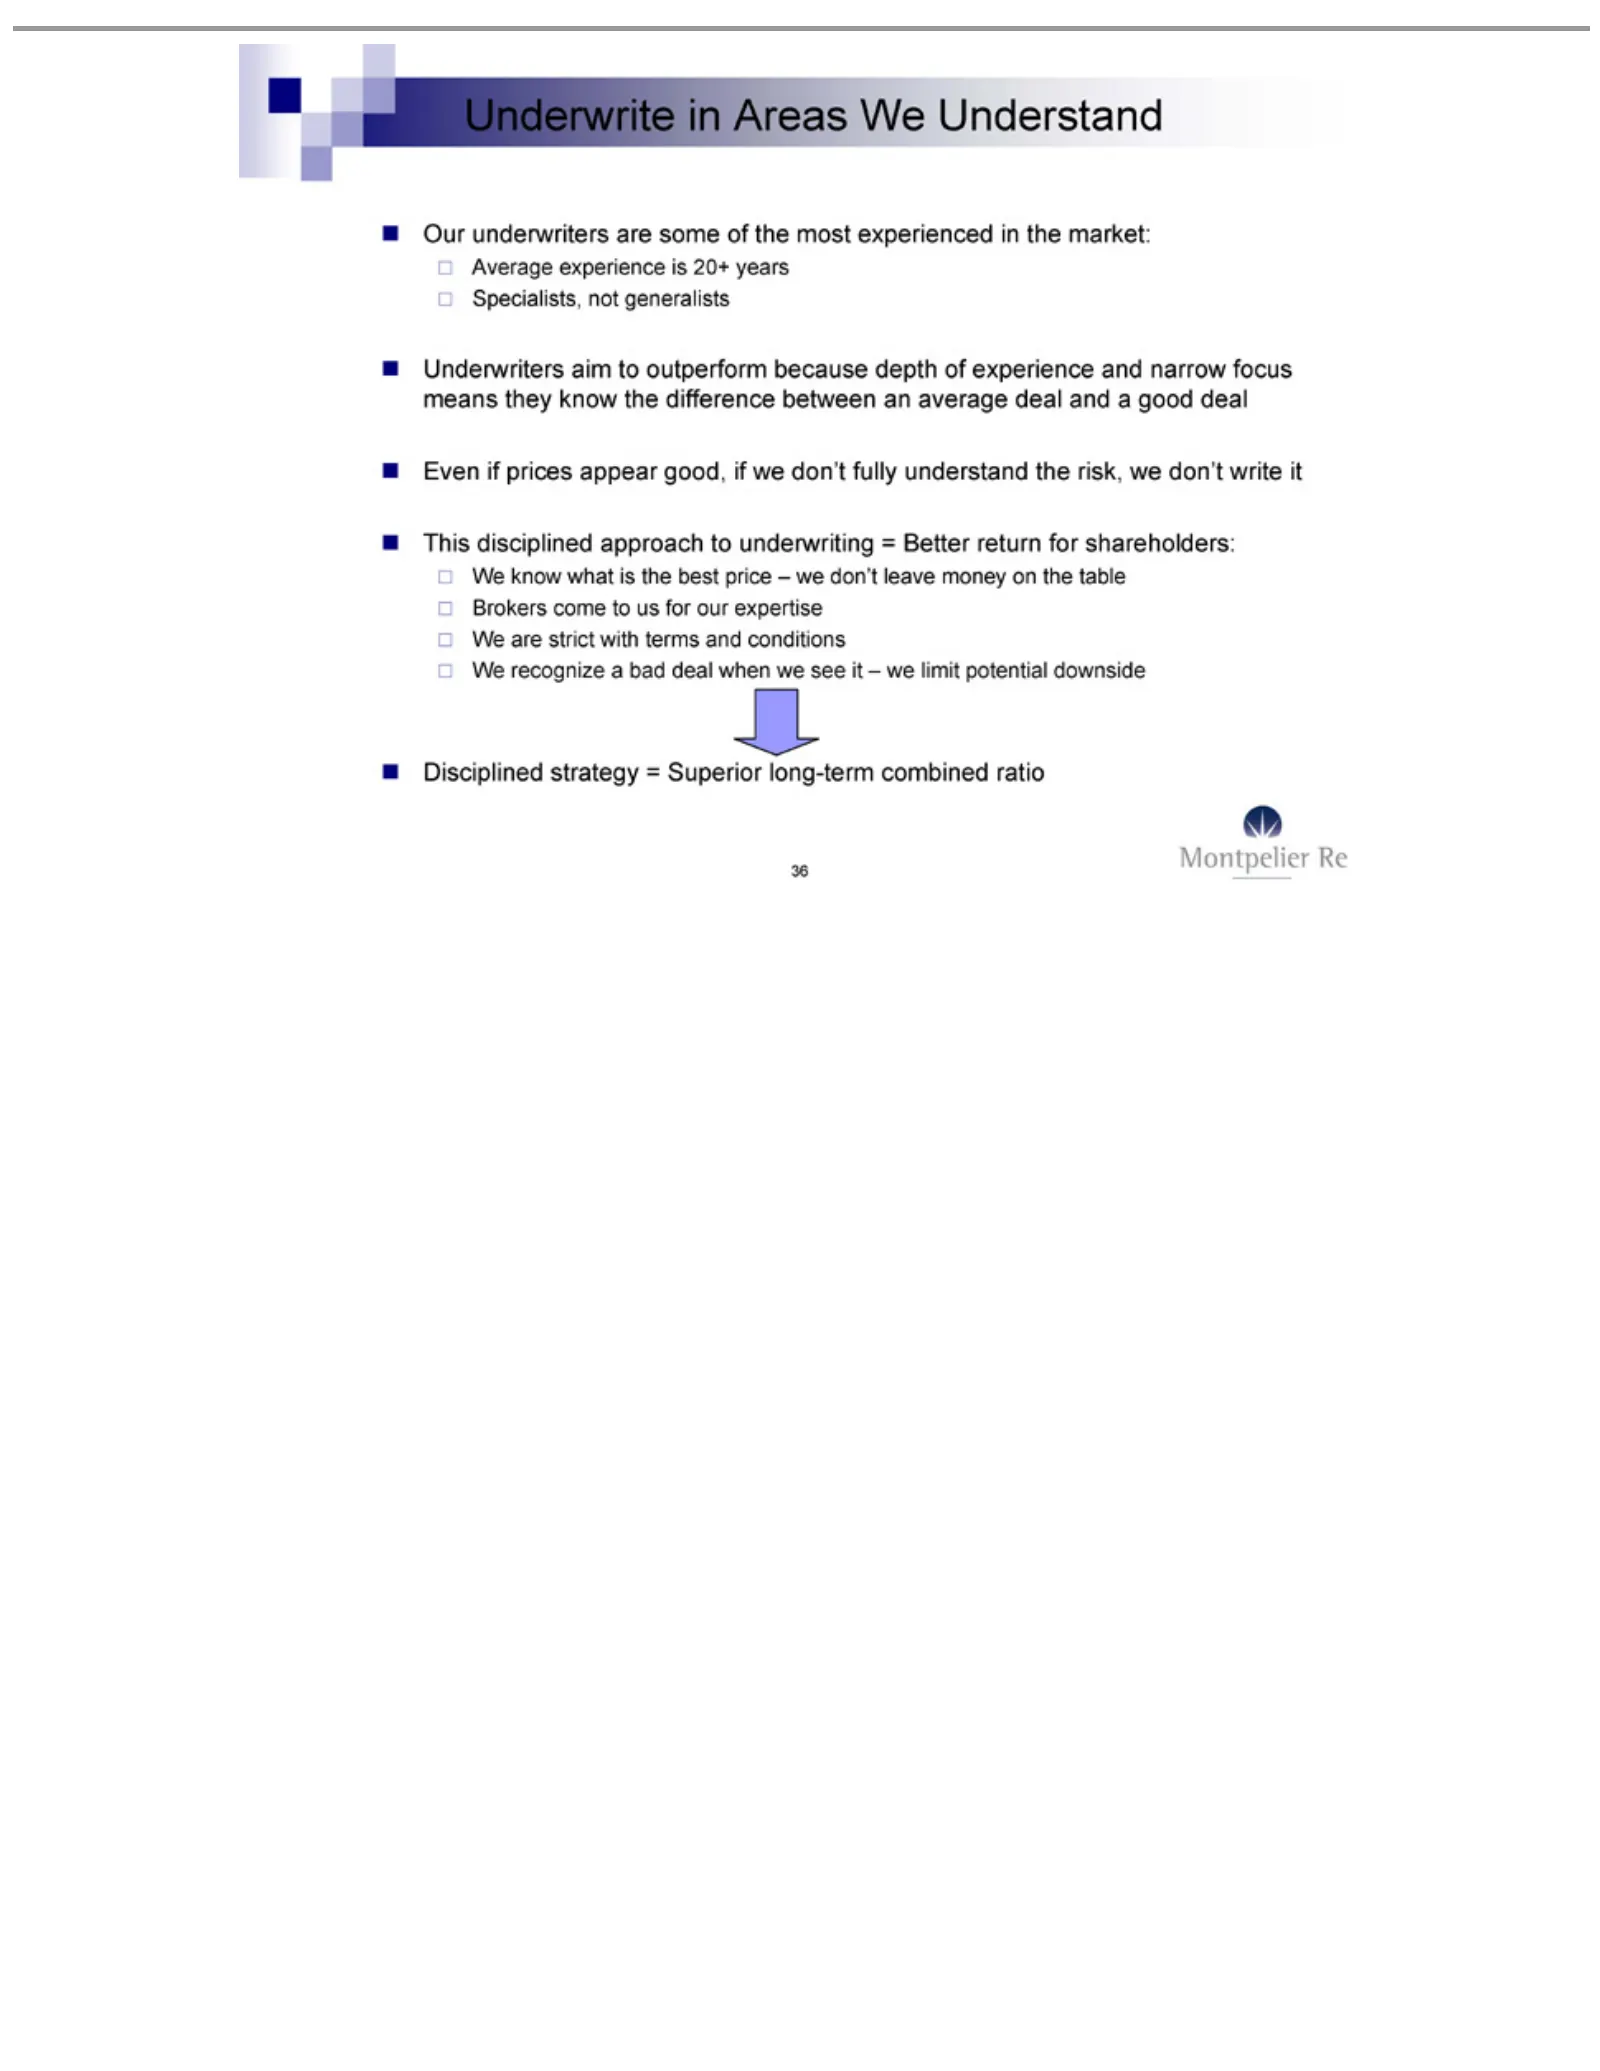
Slide 36: Underwrite: Our Specialists, Average Underwriters
Underwrite Our Average Specialists, Underwriters Even This Brokers We Disciplined 36 know are recognize underwriters disciplined if strict prices come experience what not in strategy with aim aAreas appear tois generalists bad approach us are the to terms for deal is = outperform We some best good,
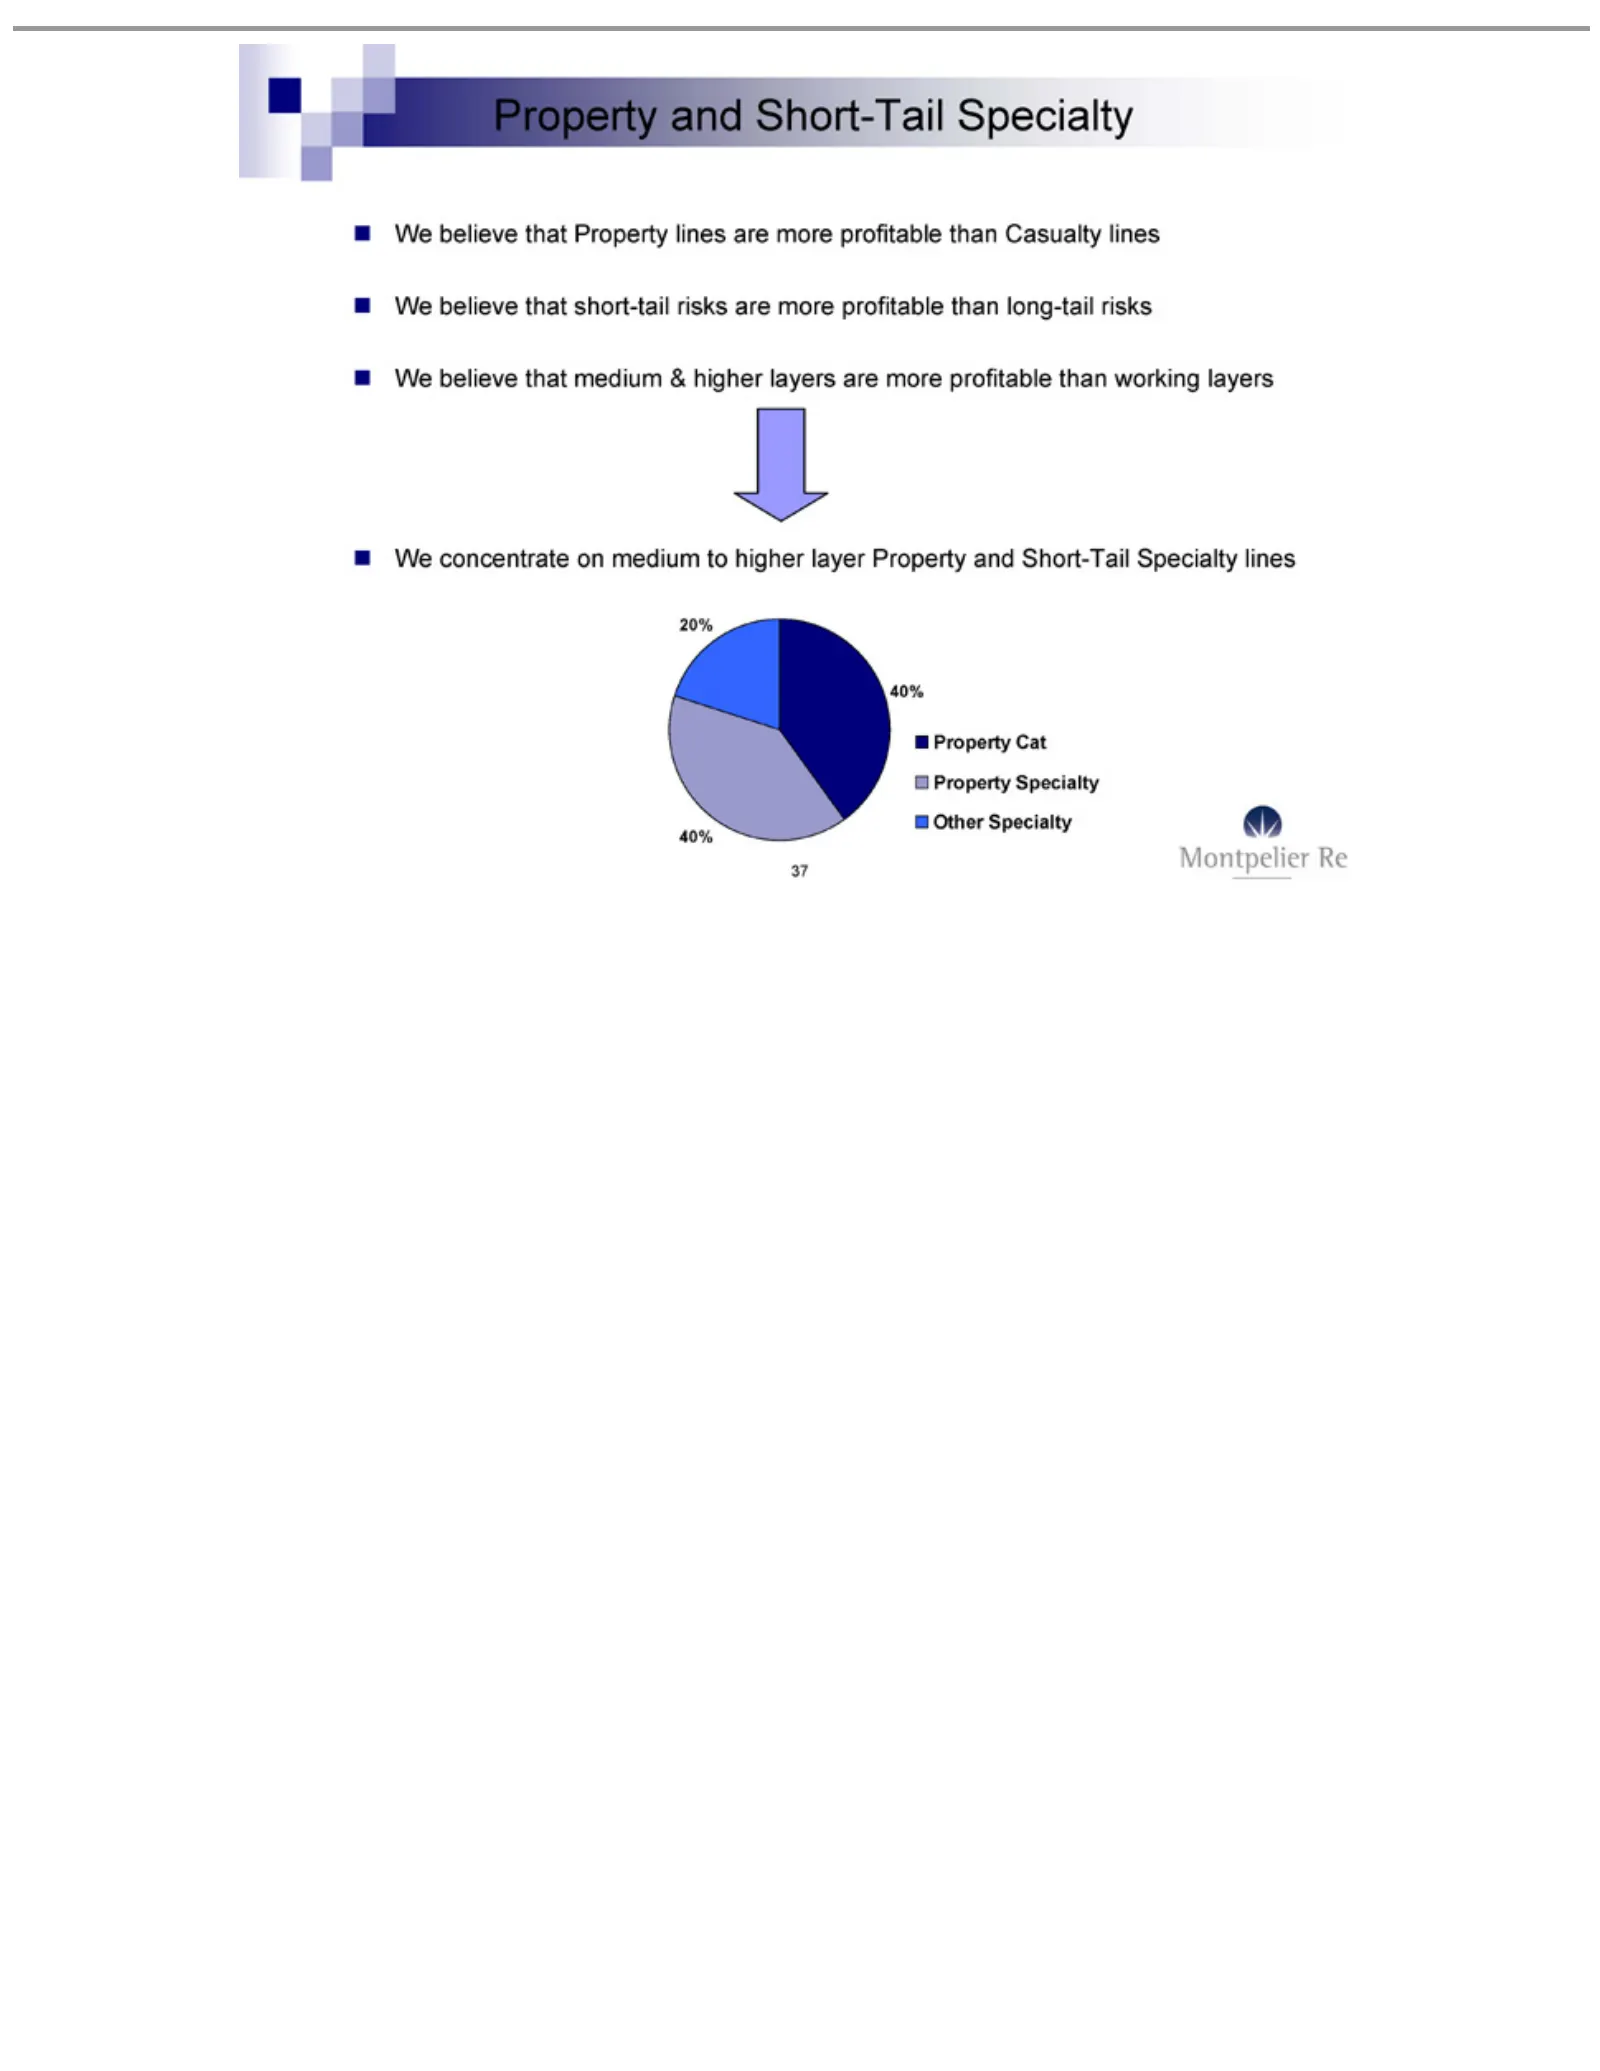
Slide 37: We Concentrate on Short-Tail Property and Specialty
We concentrate 20% Property 37 believe 40%Cat and 40% that Property Short-Tail on Property short-tail medium medium Specialty Specialty &lines risks higher to higher are are Other more layers more layer Specialty profitable profitable areProperty more than profitable than andCasualty long-tail Short
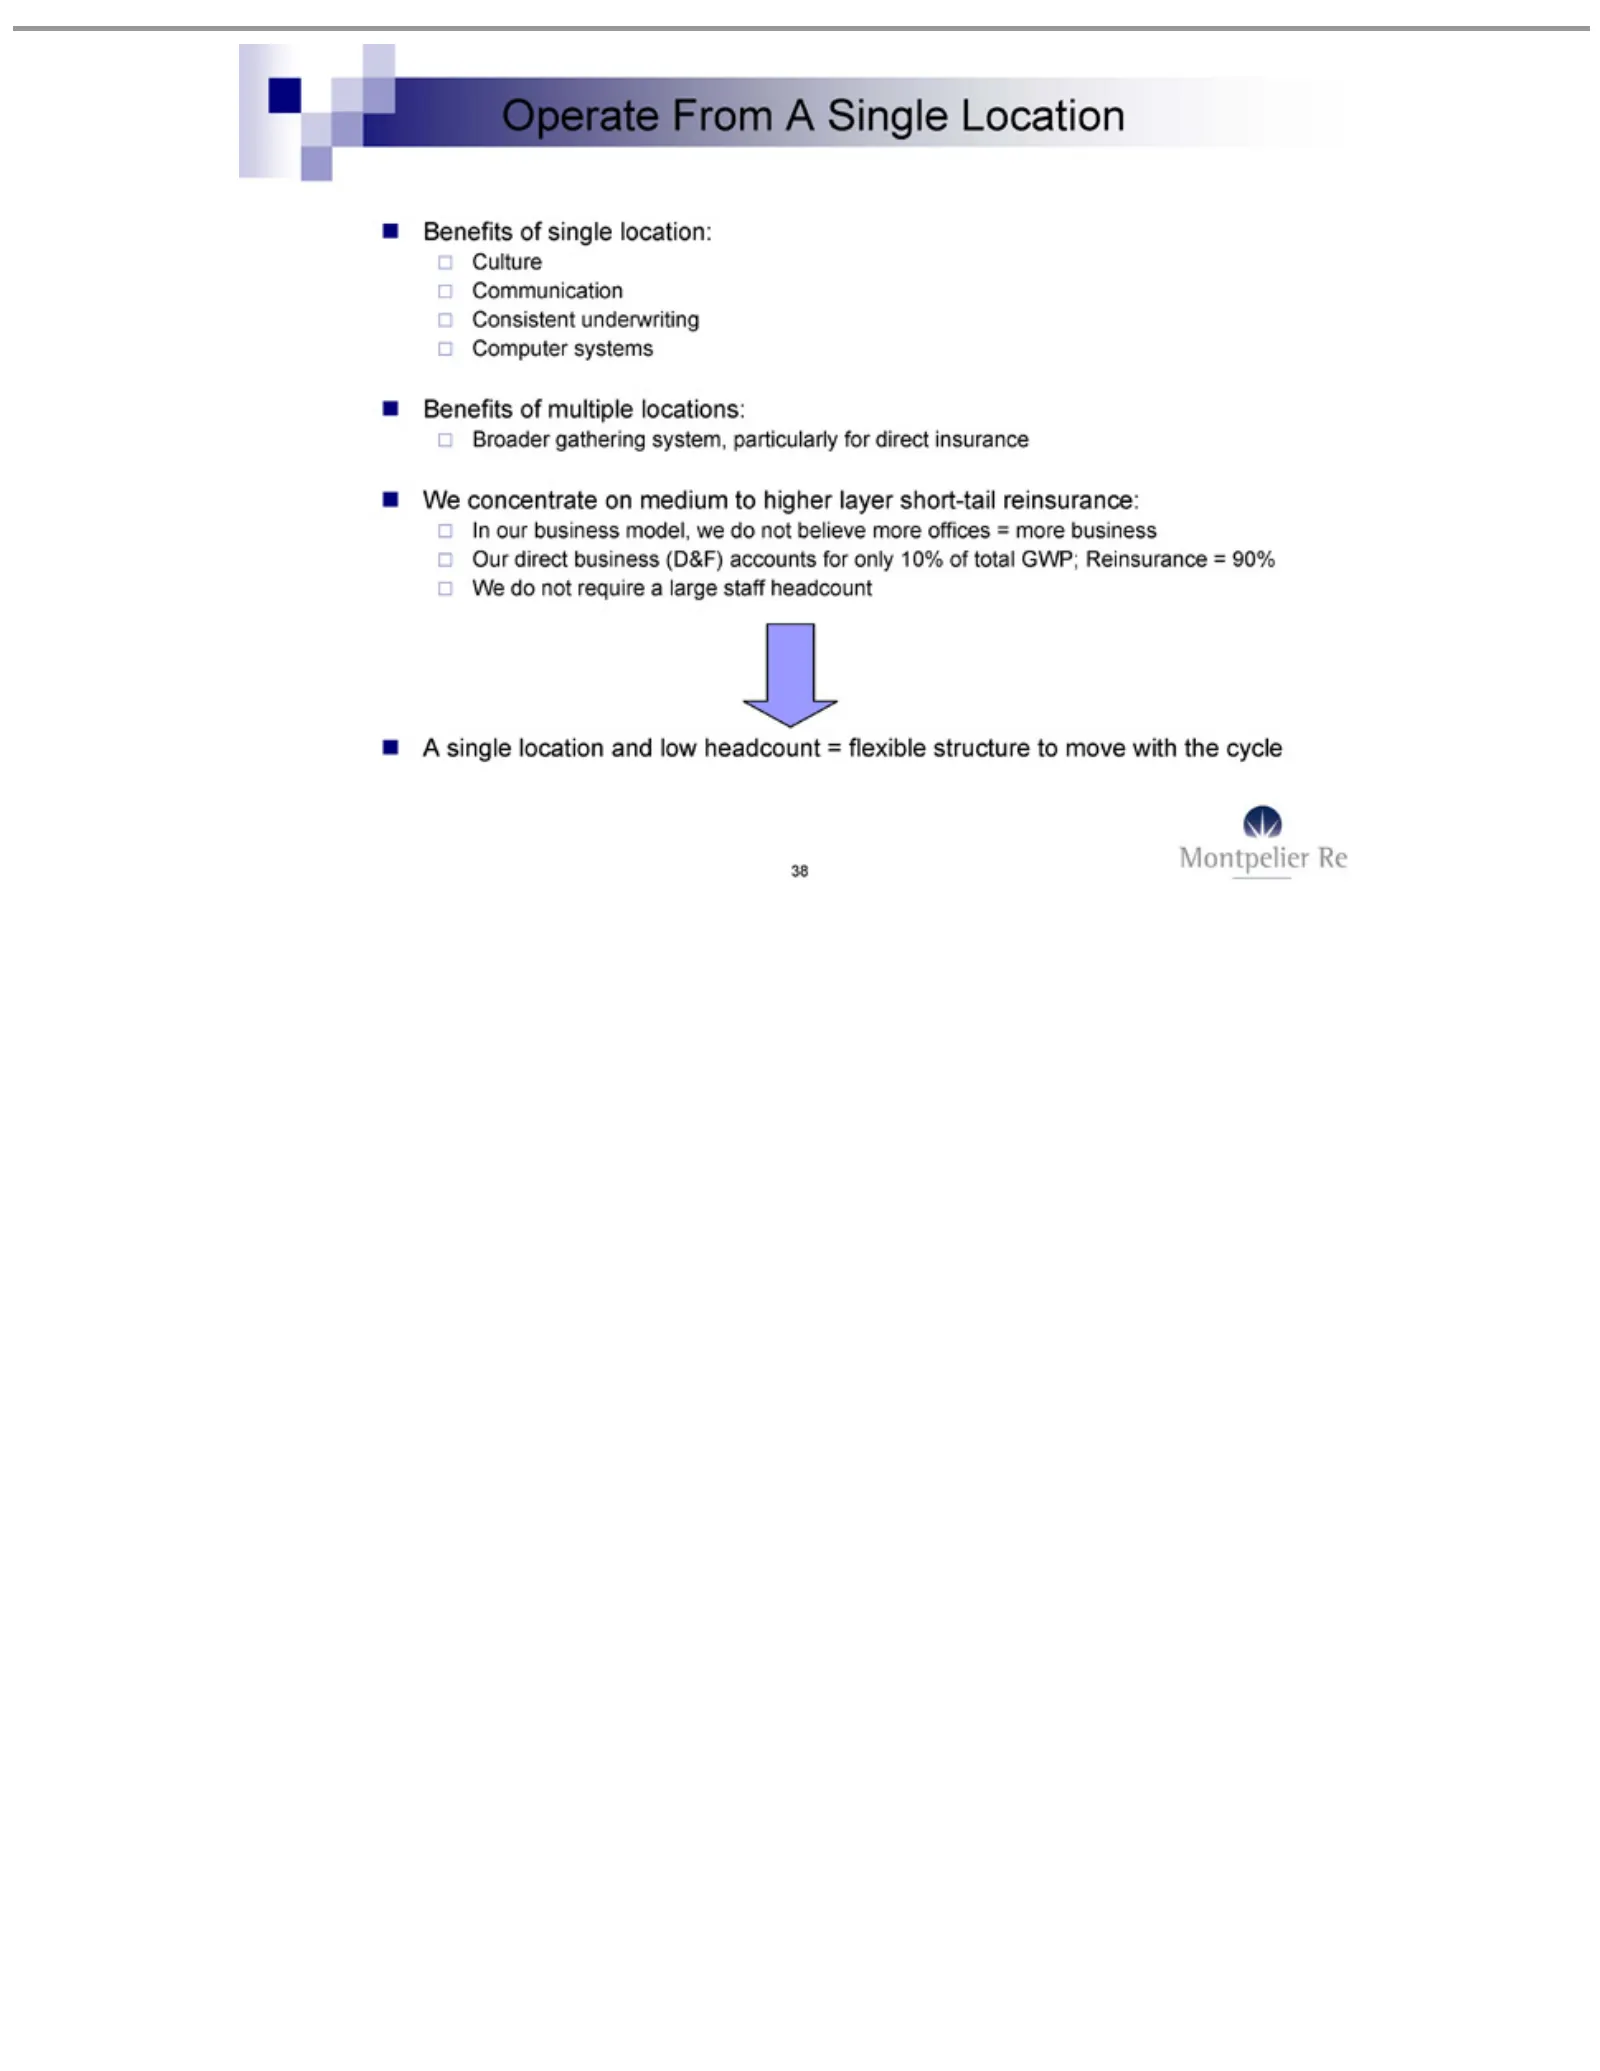
Slide 38: Operate: Single Location Benefits
Operate Consistent Communication Culture Computer Benefits Broader In Our We A 38 single our concentrate do direct business not From gathering location ofsystems business require underwriting single multiple Amodel, on Single and location: asystem, medium (D&F) large locations: low we Location staff
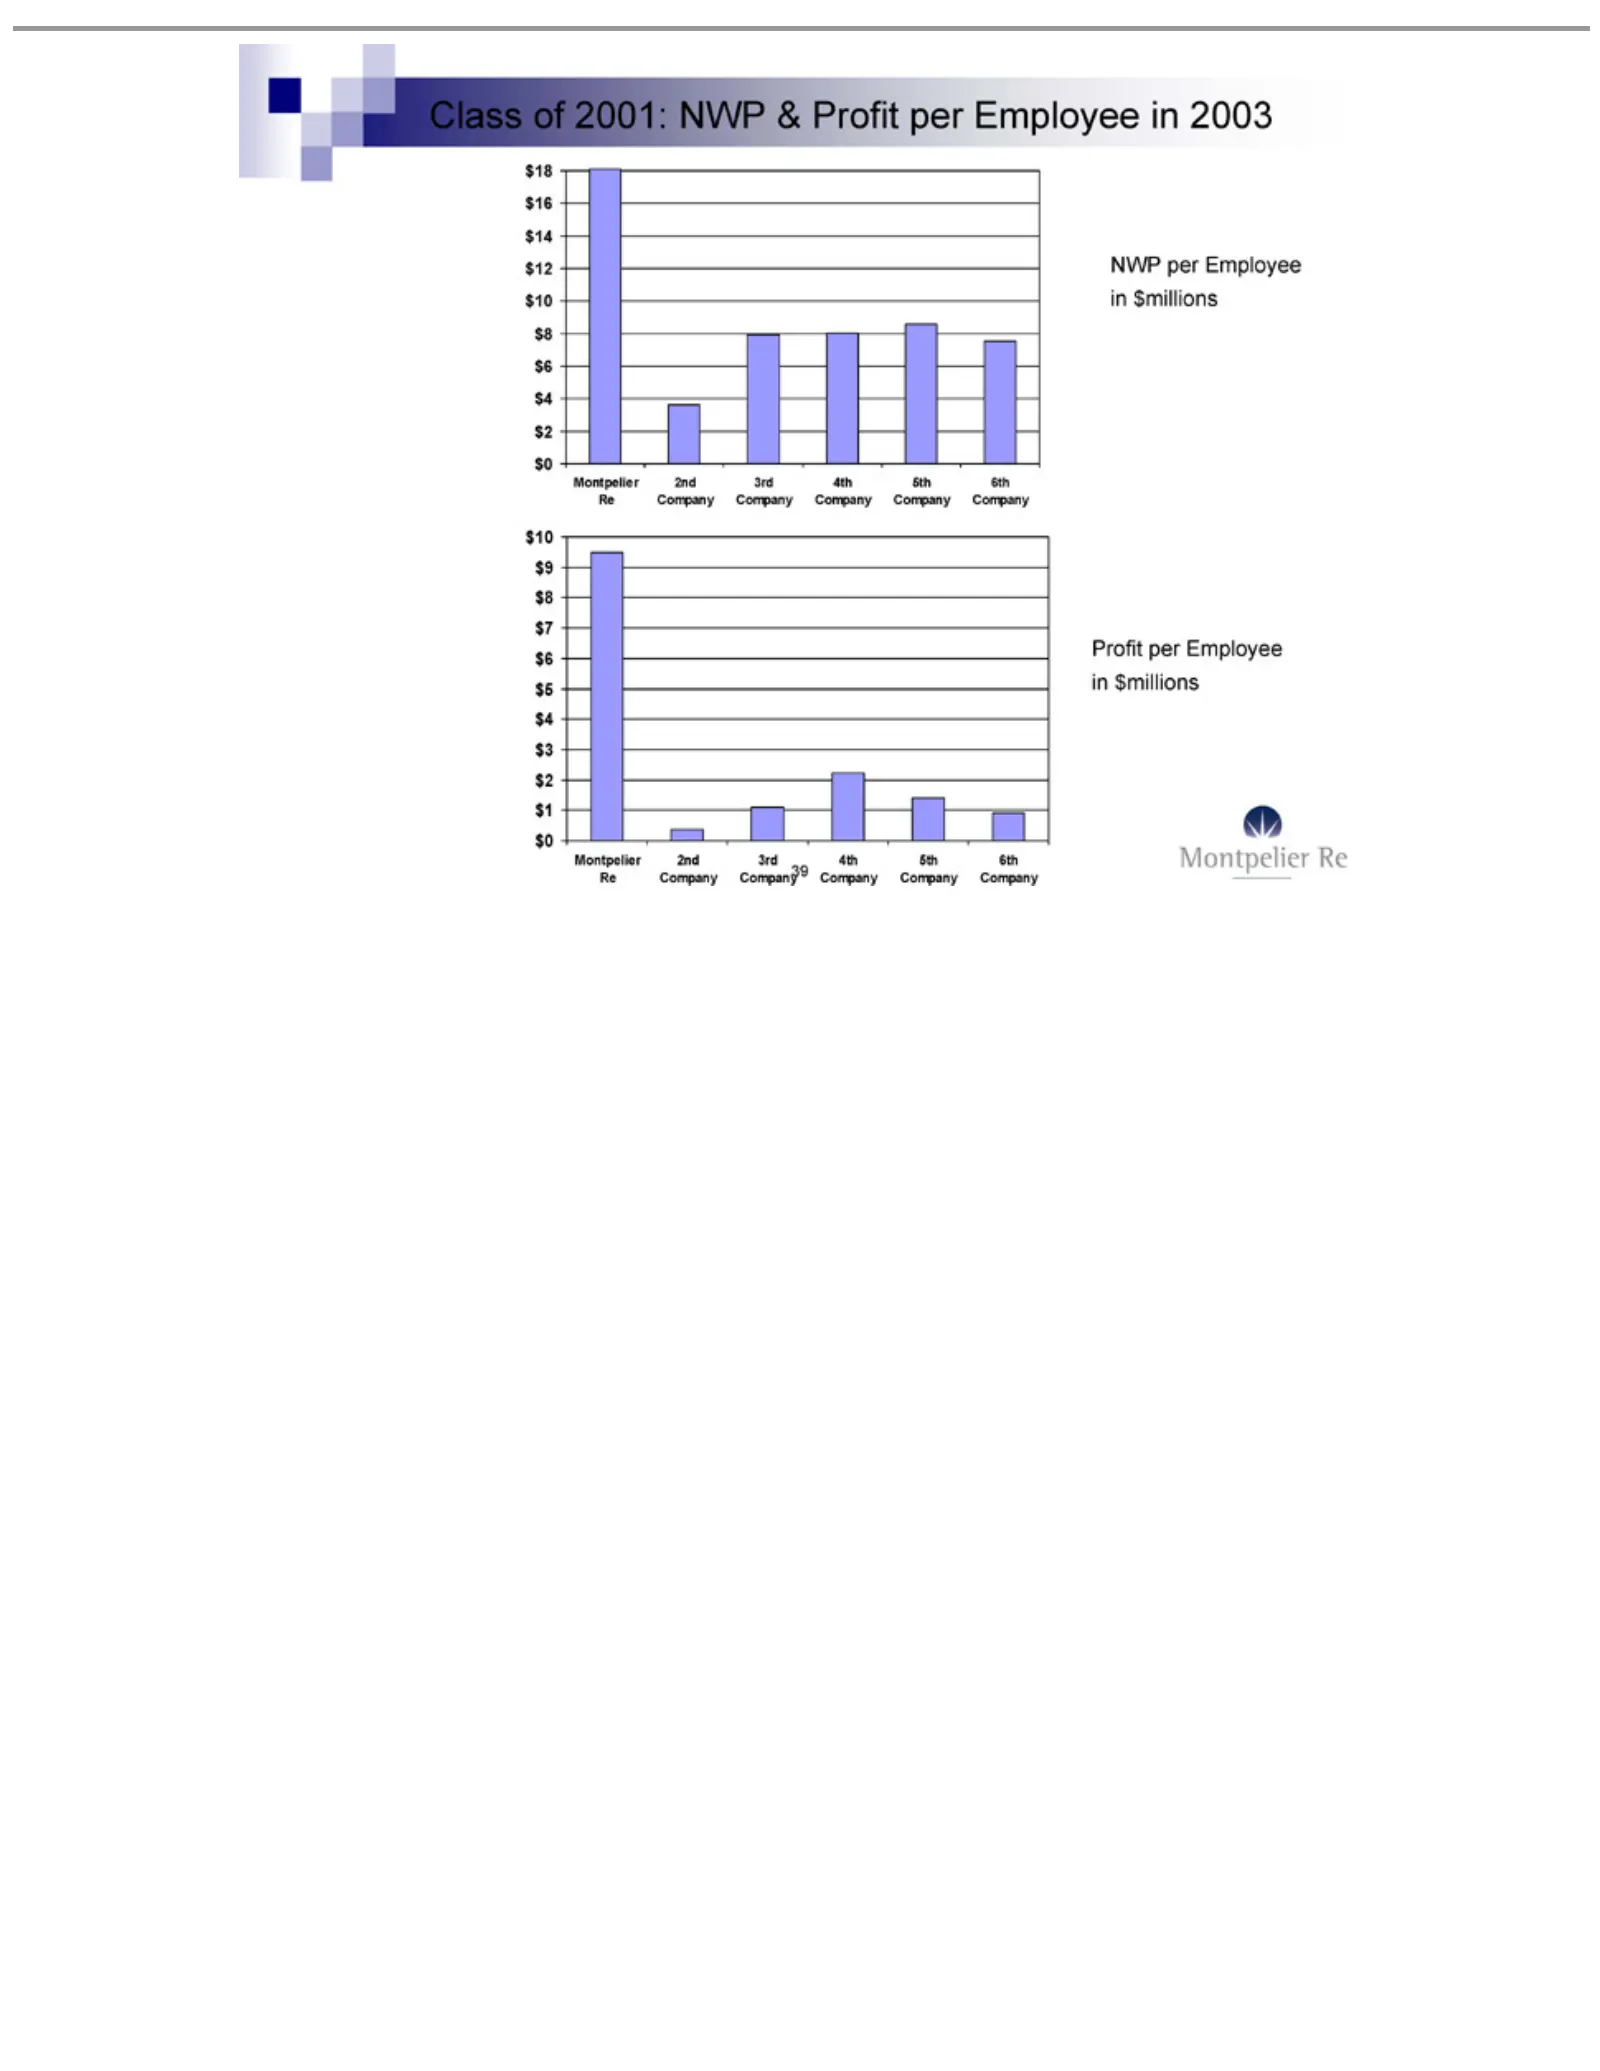
Slide 39: Class of 2001: NWP and Profit per Employee
Class$9 $18 NWP $10 Montpelier Profit 39 $16of per $8$14 2001: Employee $7 Re$12 $6NWP 2nd $5 $10 Company $4 in &$8 $3 $millions Profit $6 $2$4 $1 3rd per $2 $0Company Employee $0 4th in 2003 Company 5th Company 6th Company
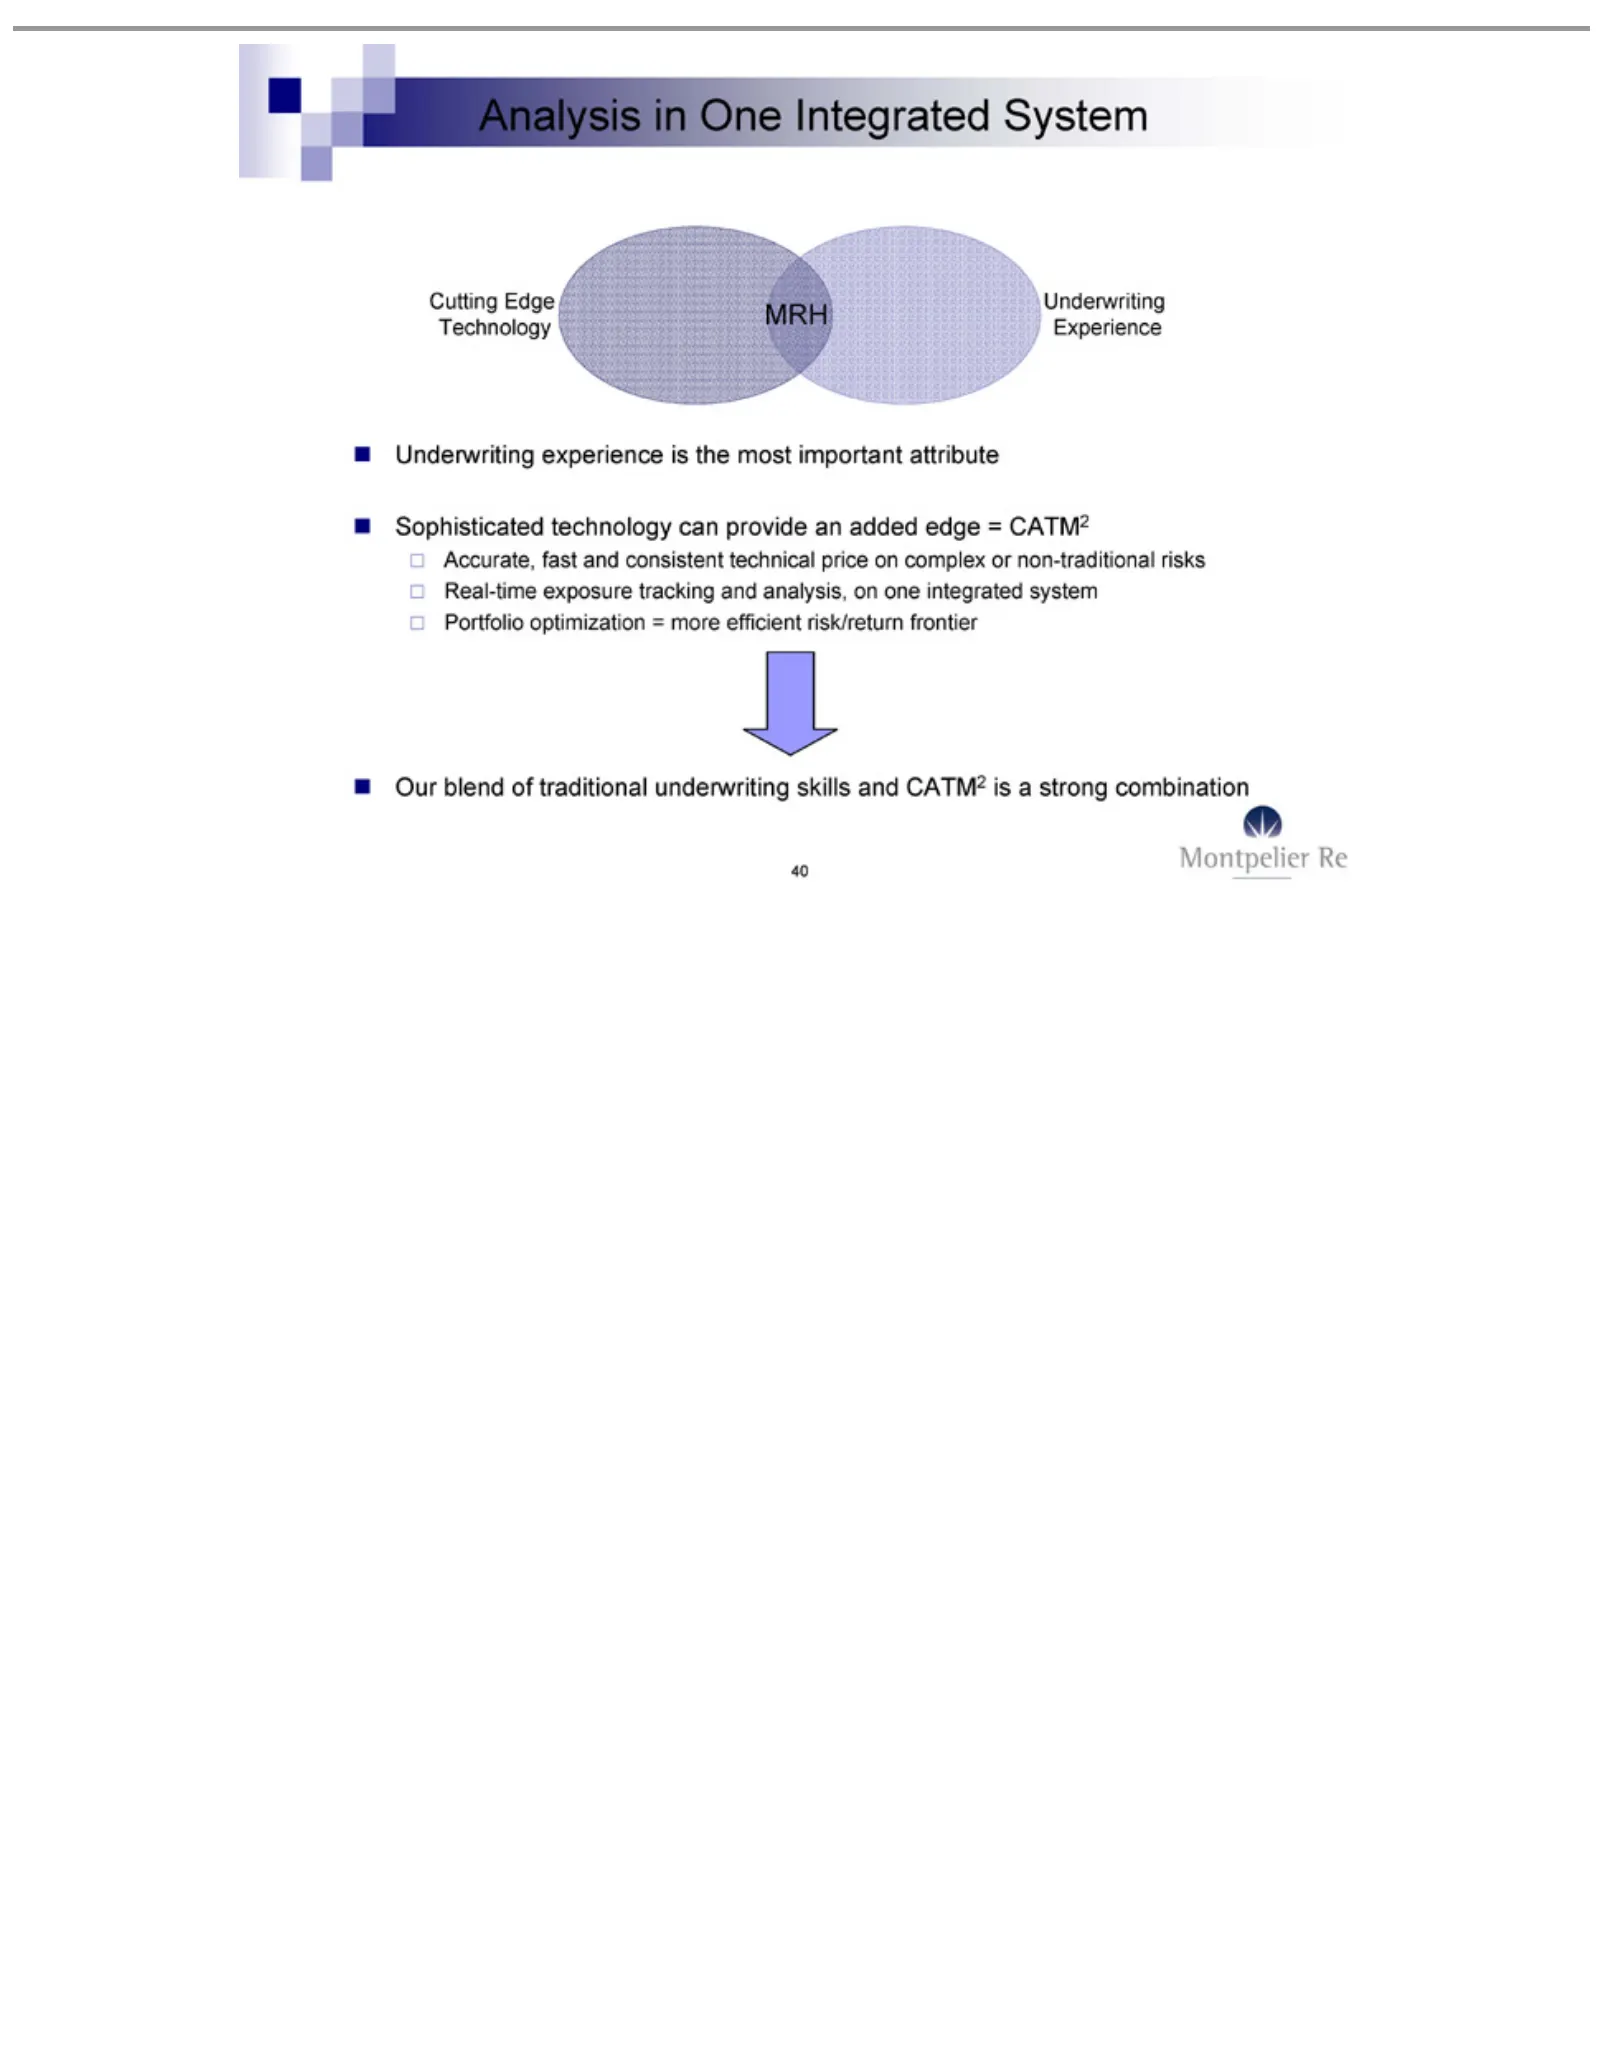
Slide 40: Cutting Edge Technology and Analysis
Analysis Cutting MRH Underwriting Sophisticated Accurate, Real-time Portfolio Our 40 blend Edge in optimization fast exposure ofOne traditional Technology Experience experience technology and Integrated consistent tracking = underwriting more is canSystem the and technical provide efficient most ana
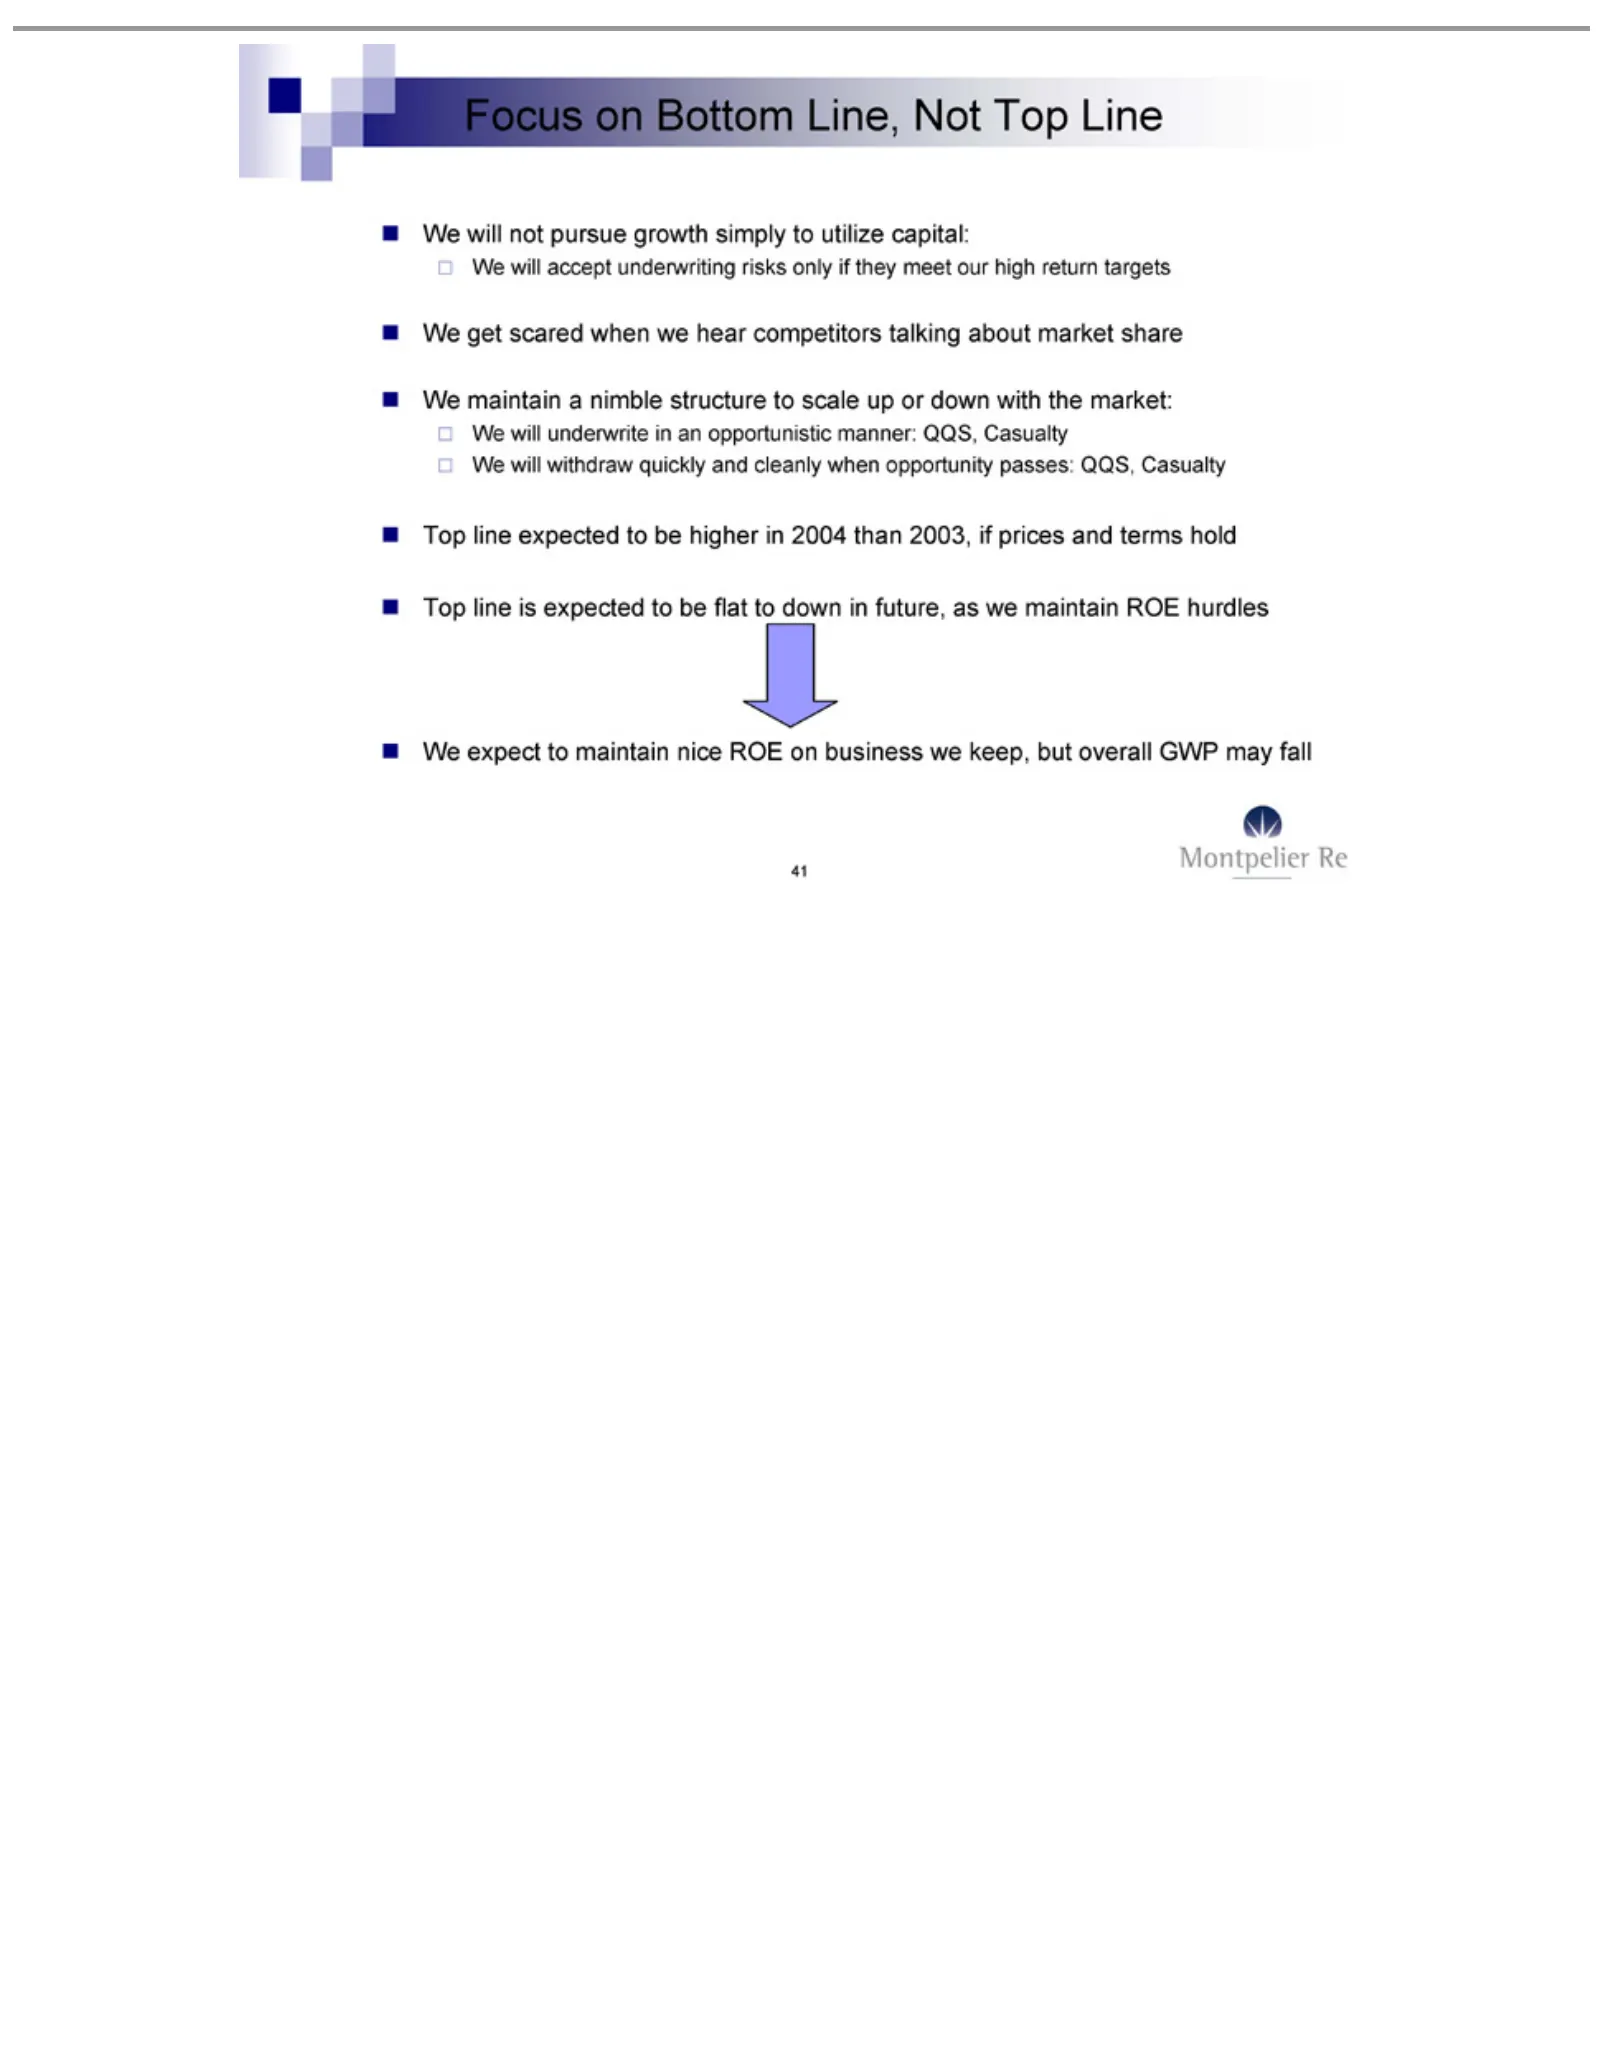
Slide 41: Focus on Bottom Line, Not Top Line
Focus Top We 41 get maintain will expect line on scared not accept underwrite withdraw expected is Bottom to expected pursue amaintain when nimble underwriting Line, to quickly growth inwe to bean structure nice be Not higher hear opportunistic flat and simply ROE Top risks competitors to cleanly in
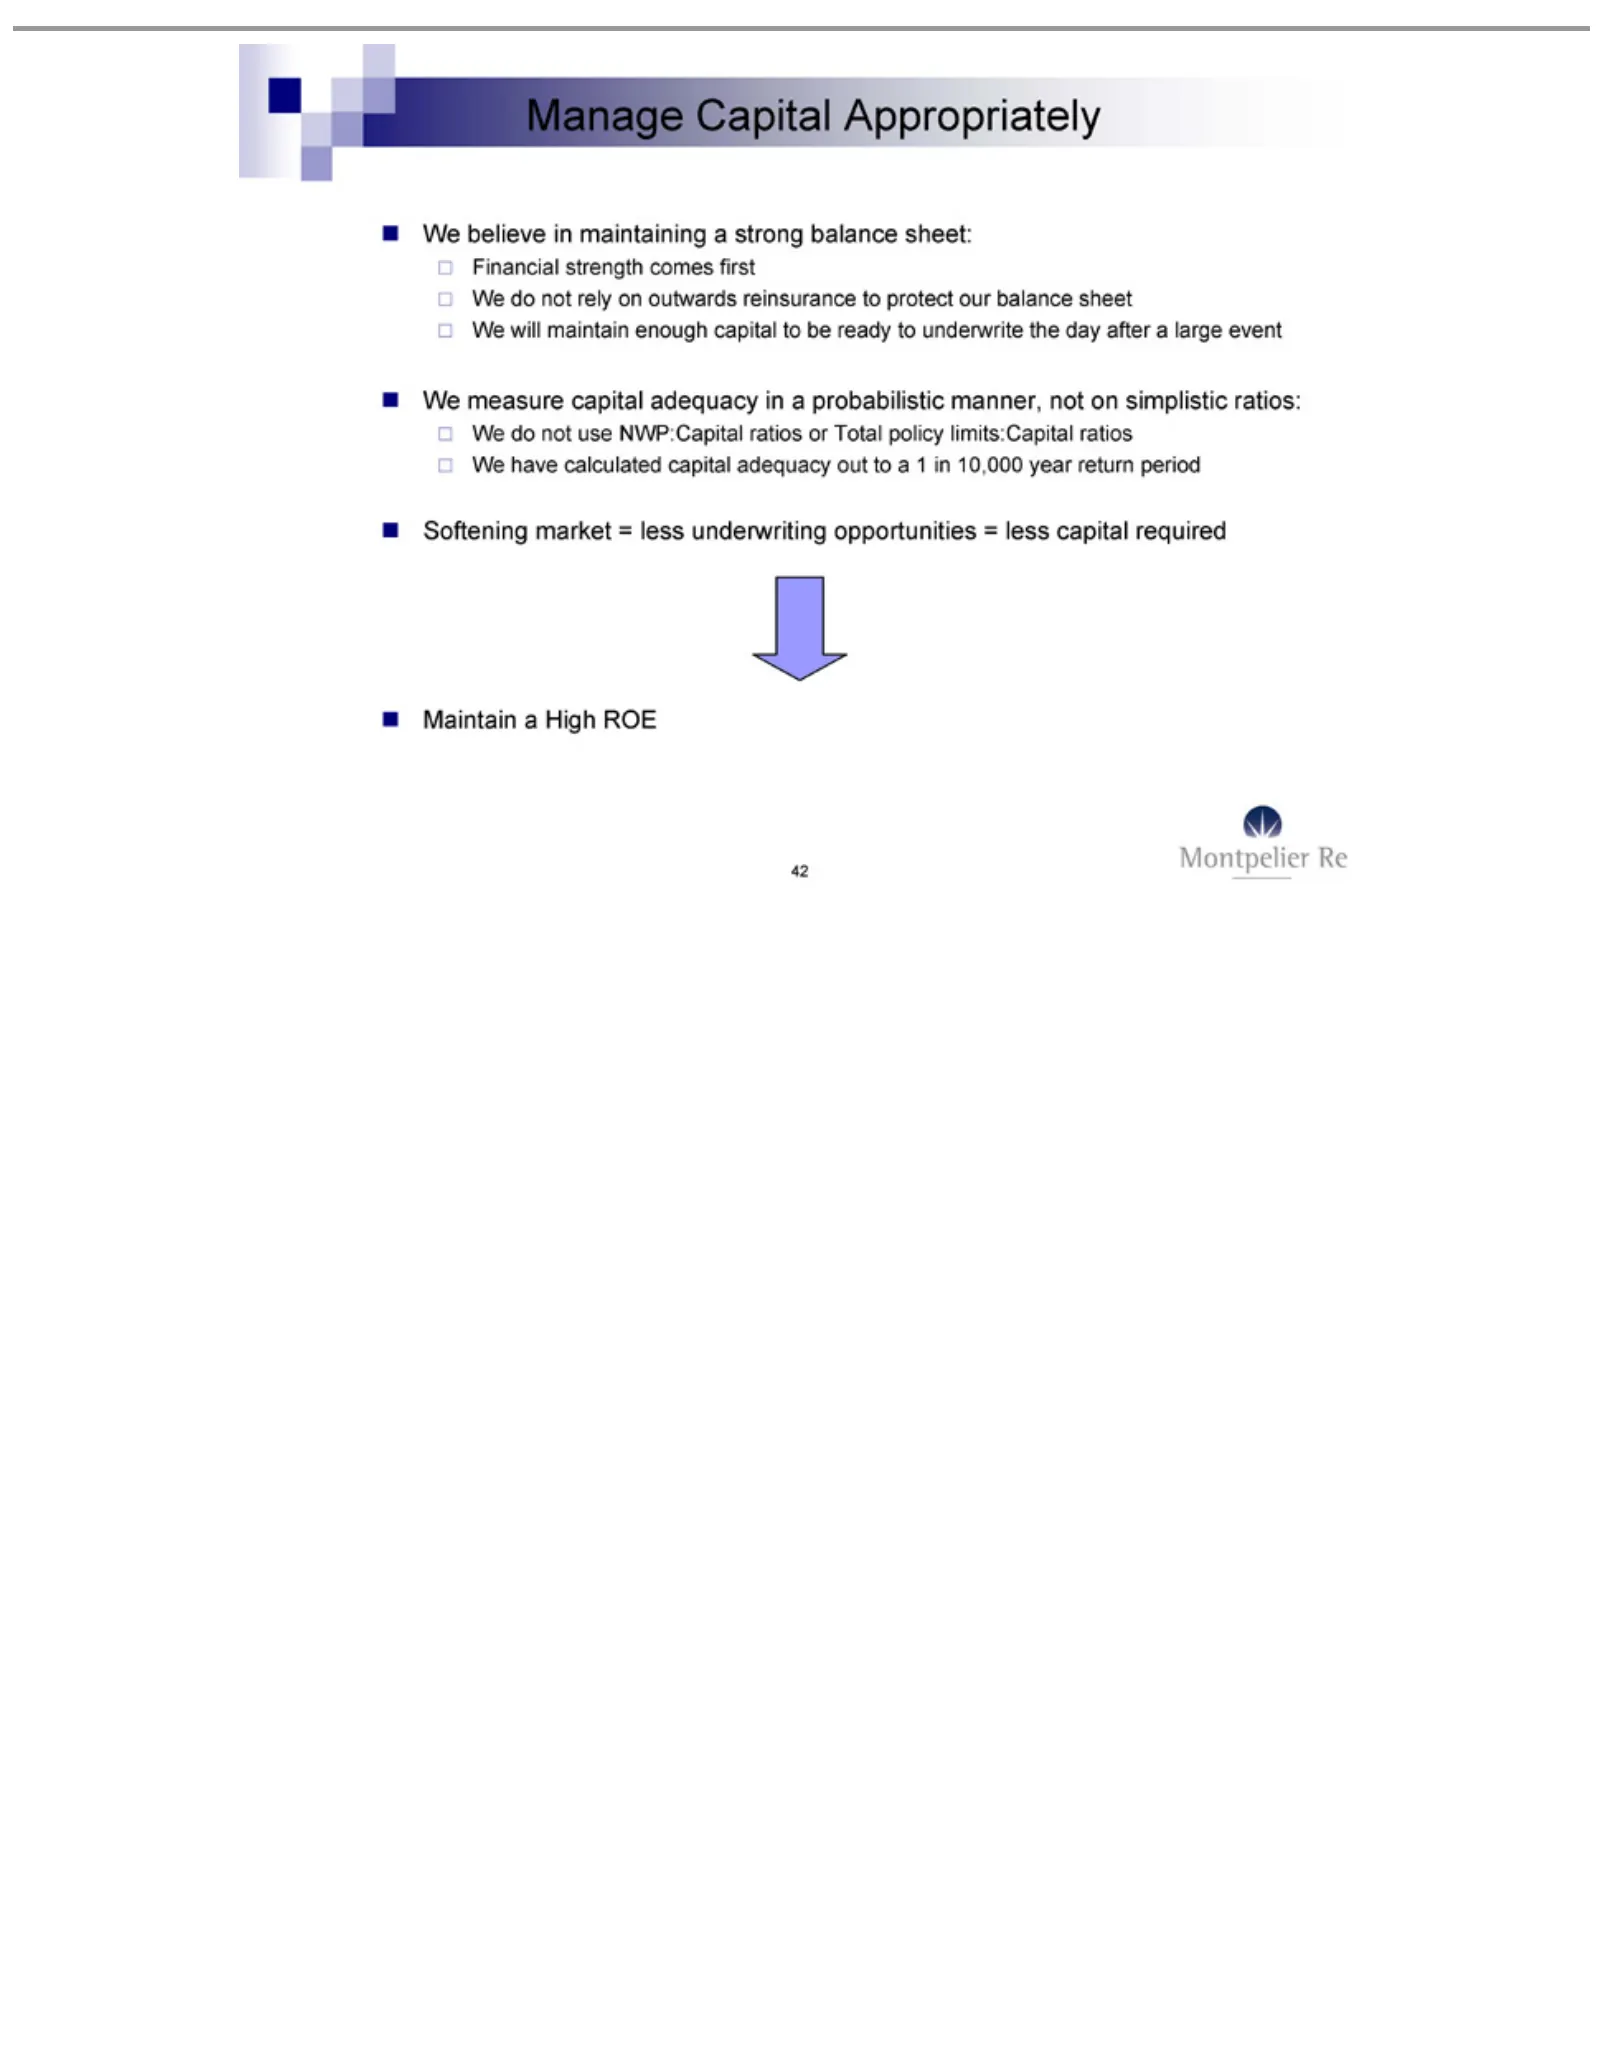
Slide 42: Manage Financial Capital
Manage Financial We Softening Maintain 42 believe will measure do have not maintain Capital calculated astrength market rely use High incapital maintaining NWP:Capital on Appropriately ROE enough =outwards comes less capital adequacy underwriting first capital aadequacy reinsurance strong ratios in
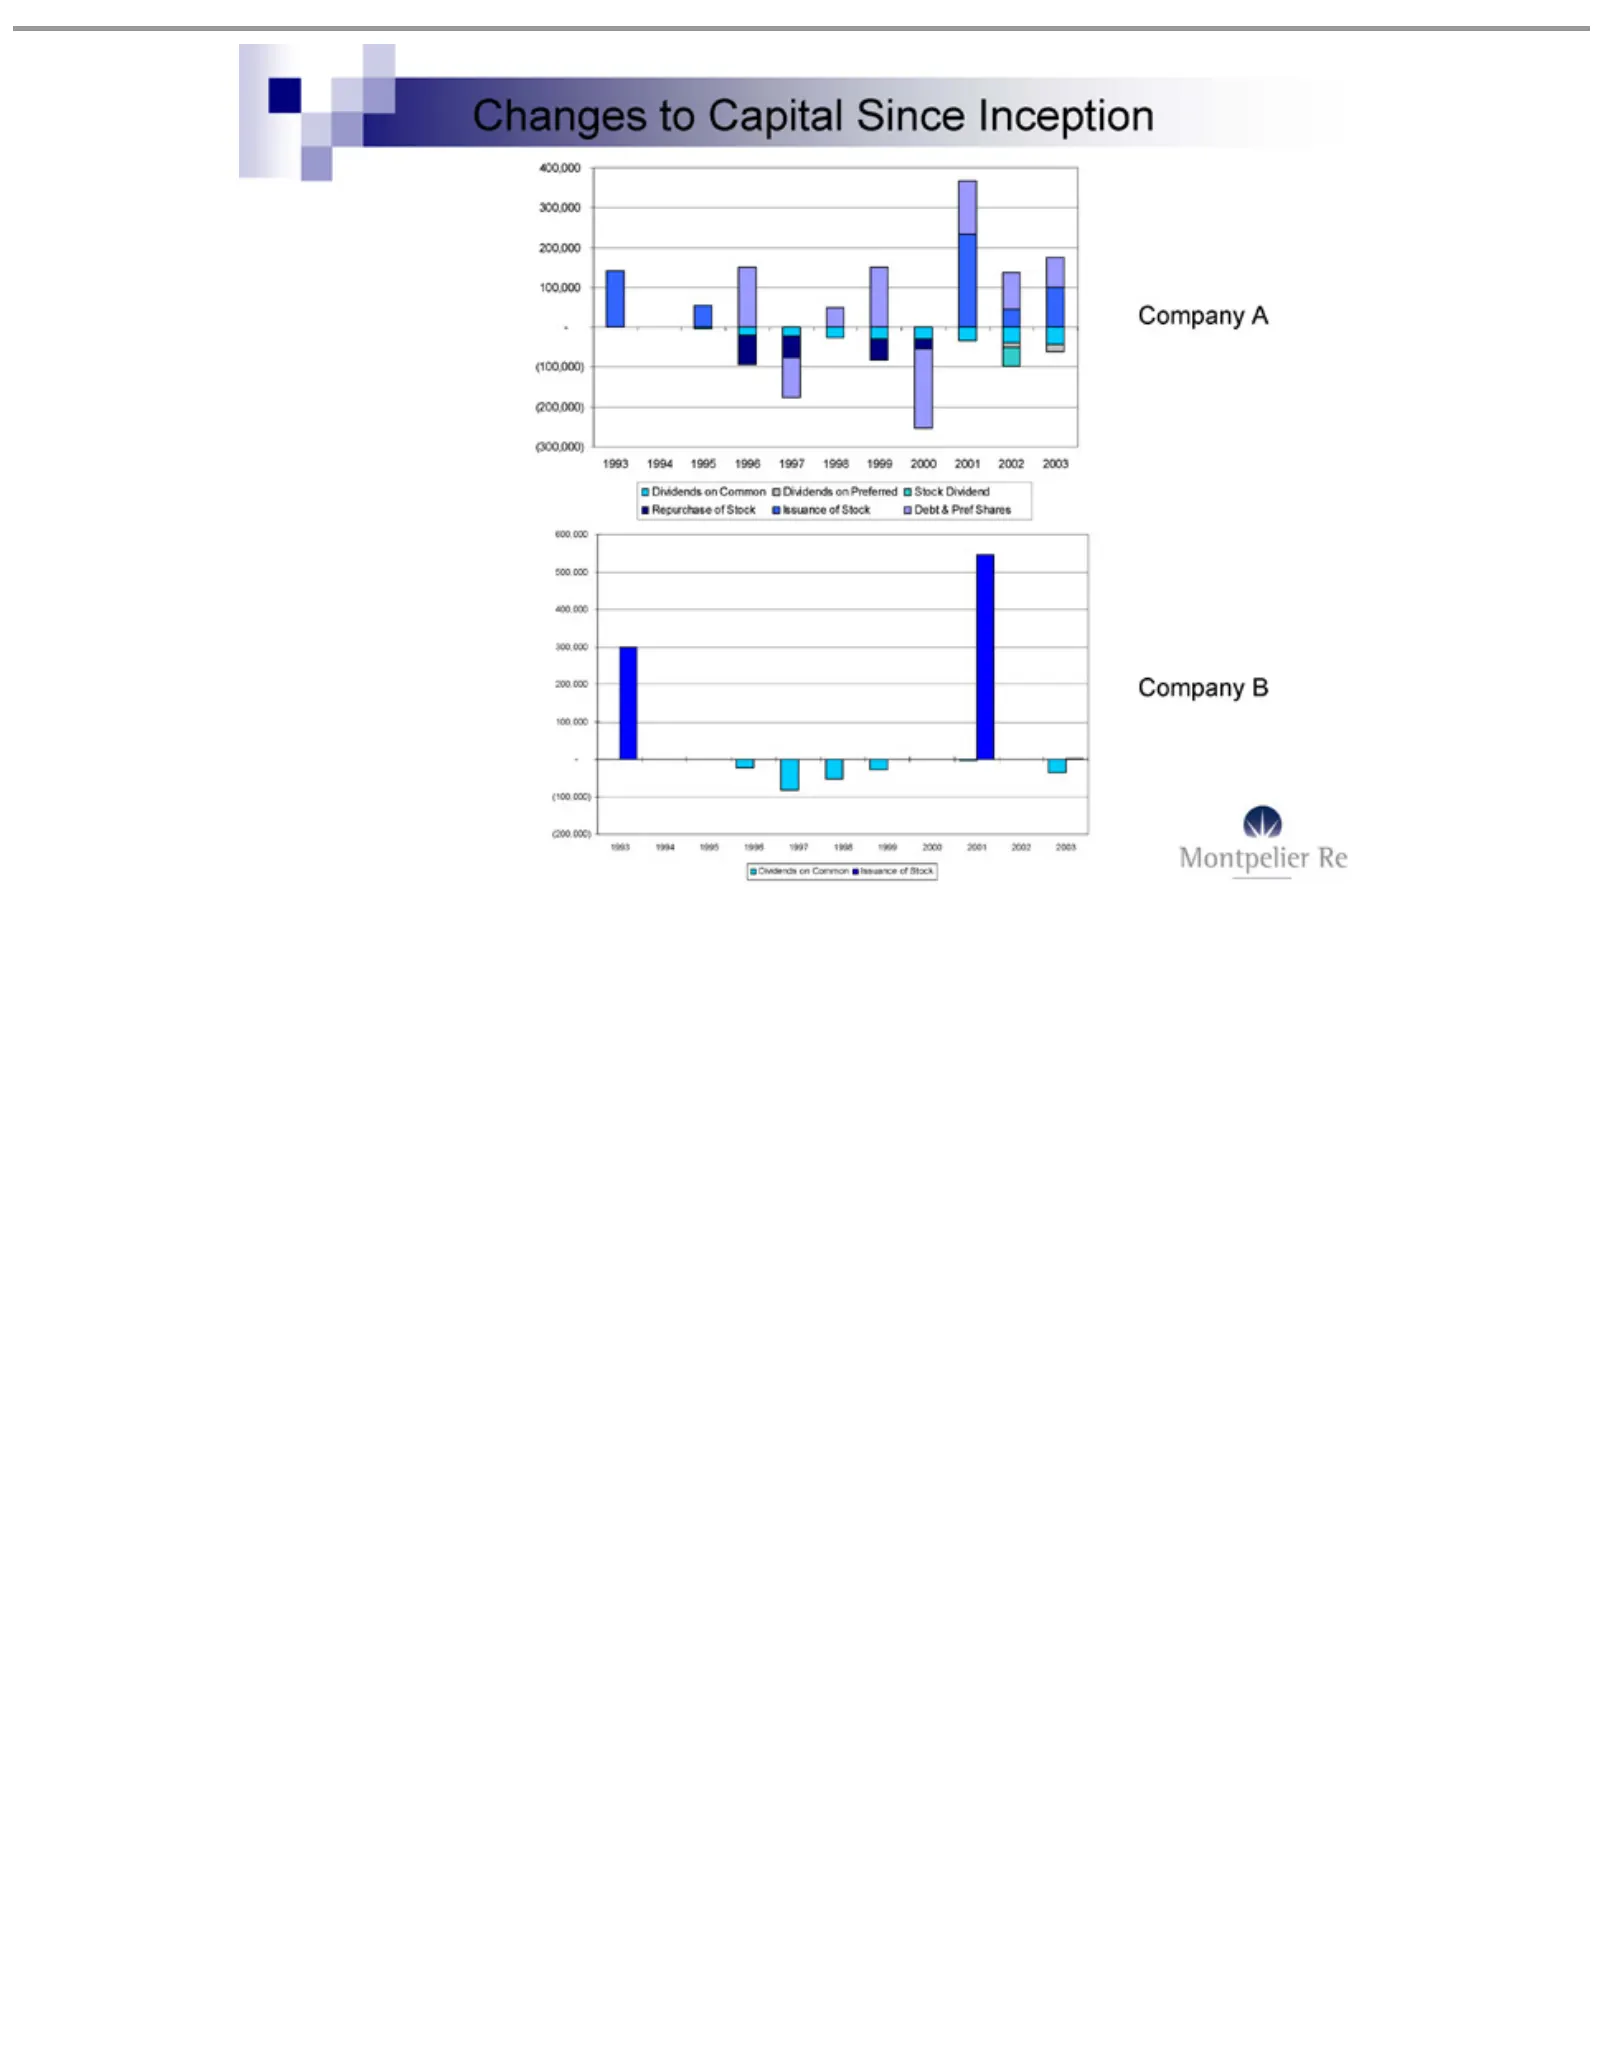
Slide 43: Changes in Capital: Stock Repurchase and Dividends
Changes 400,000 Stock Repurchase Issuance Debt Company 600,000 1993 Dividends & 1994 Dividend Pref 300,000 500,000 of toA Bon 1995 Capital Stock of Shares Preferred Common Stock 1996 200,000 400,000 Since 1997 Issuance Inception 100,000 300,000 1998of 1999 -(100,000) 200,000 Stock 2000100,000—(100,0
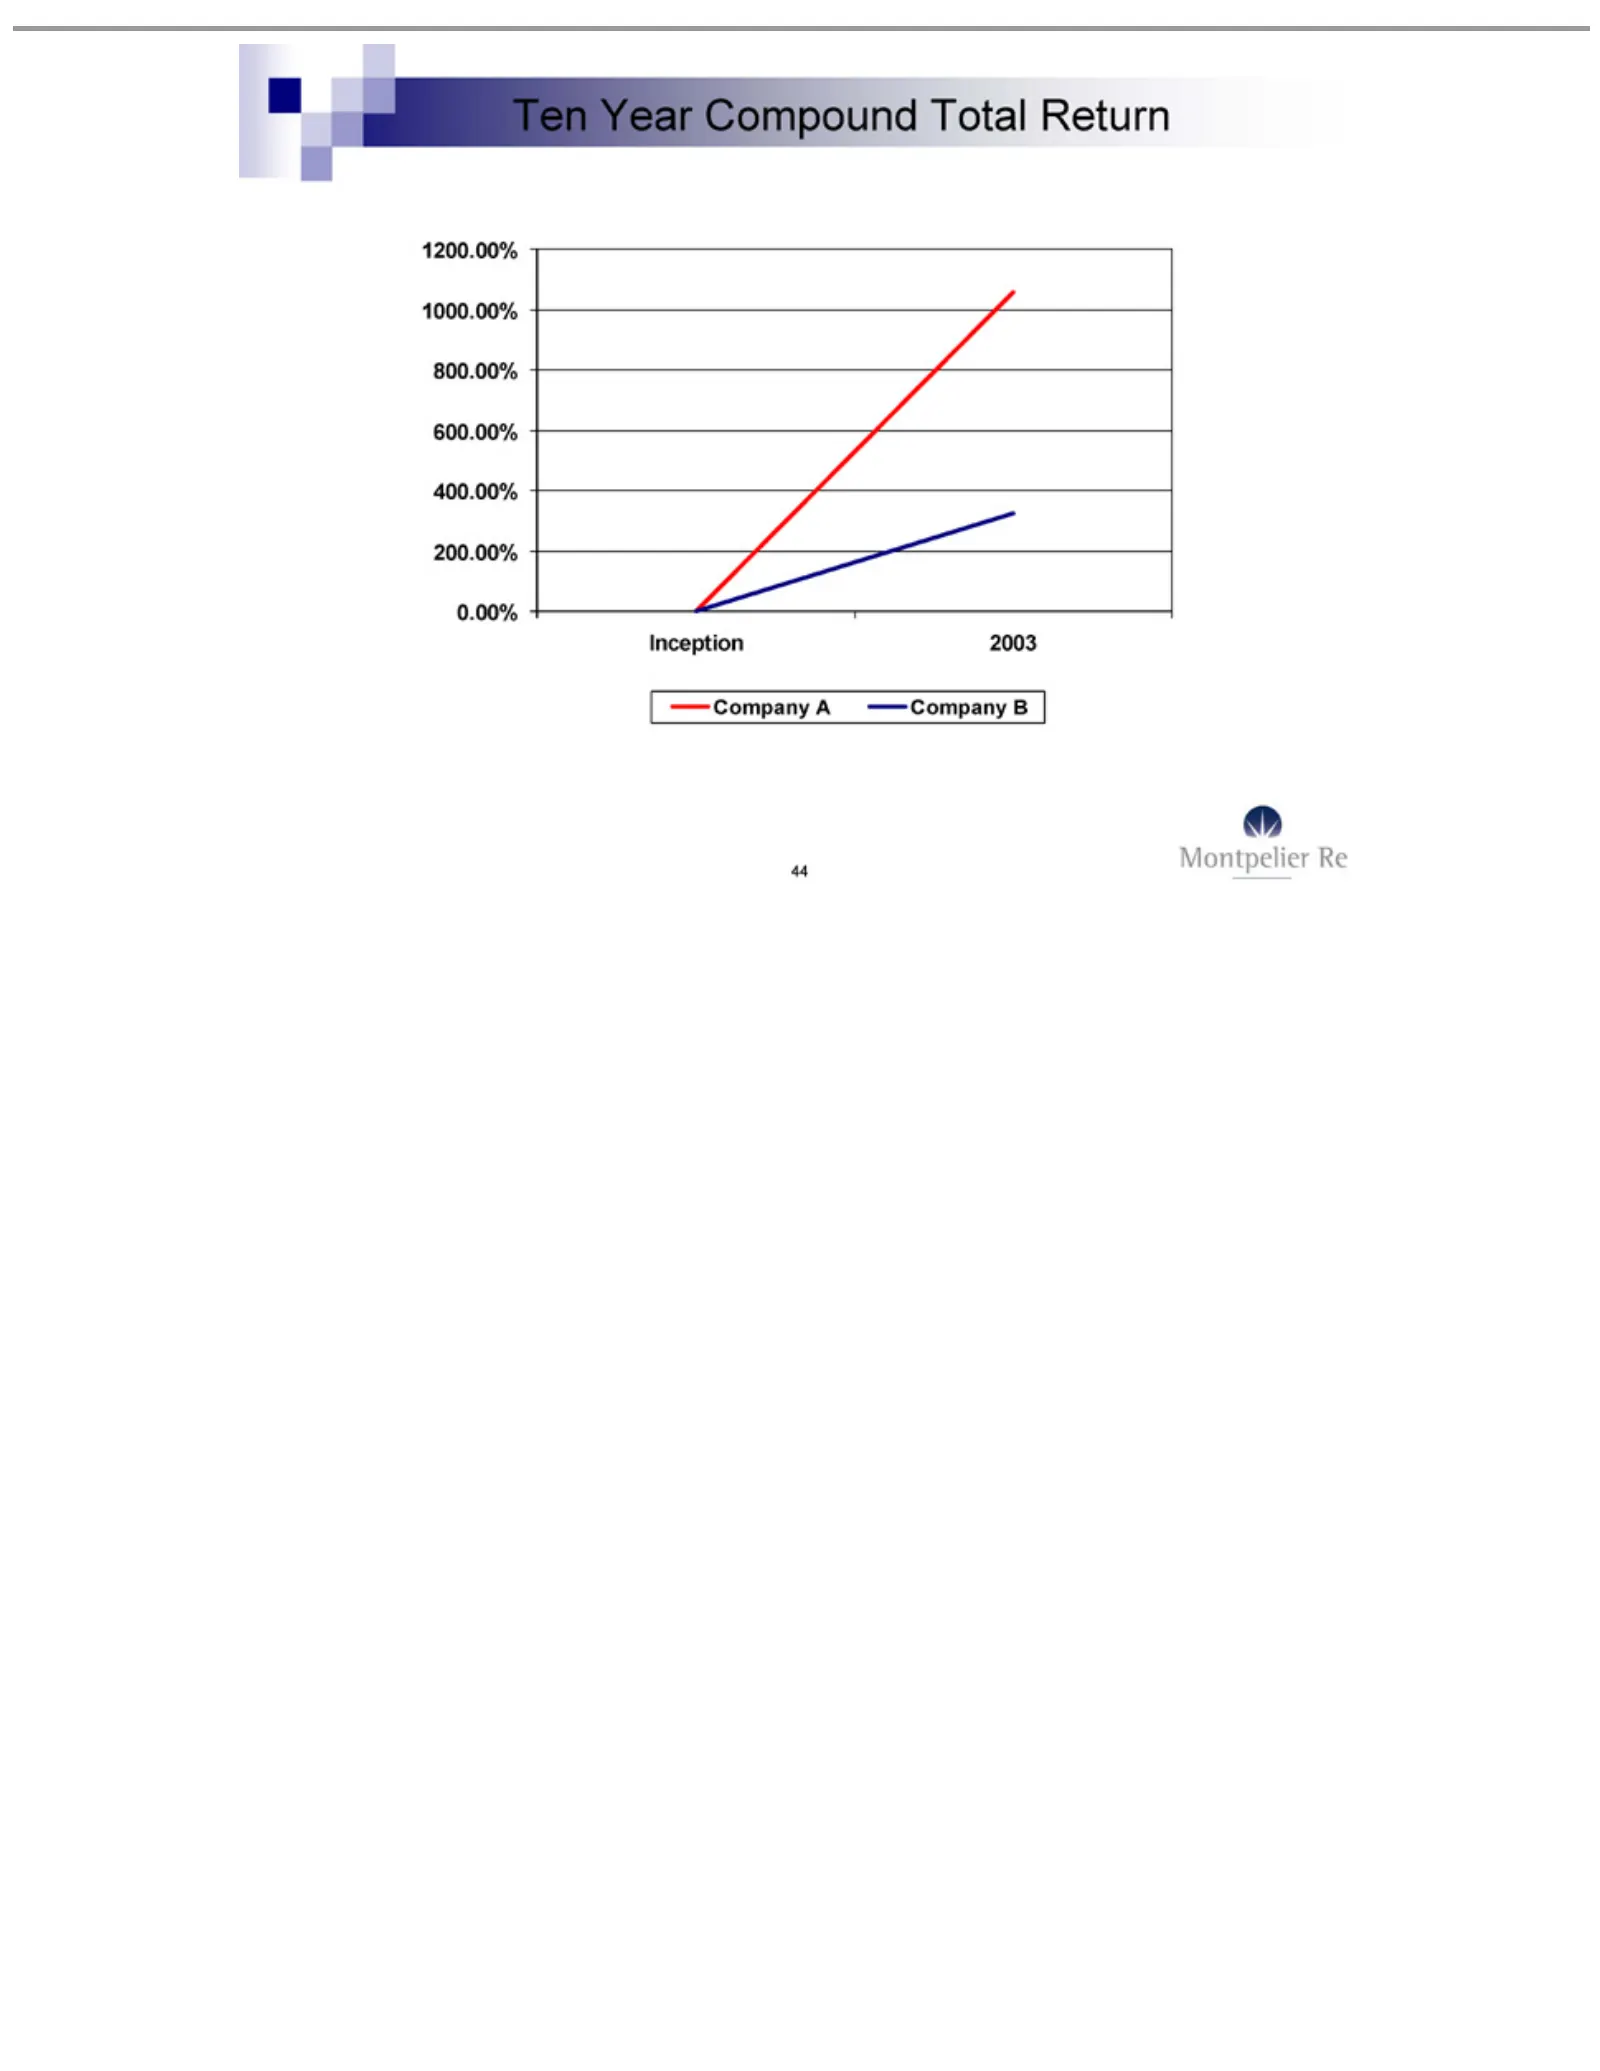
Slide 44: Ten Year Compound Total Return
Ten Year Compound 1200.00% Inception Company 44 2003 A1000.00% CompanyTotal 800.00% B Return 600.00% 400.00% 200.00% 0.00%
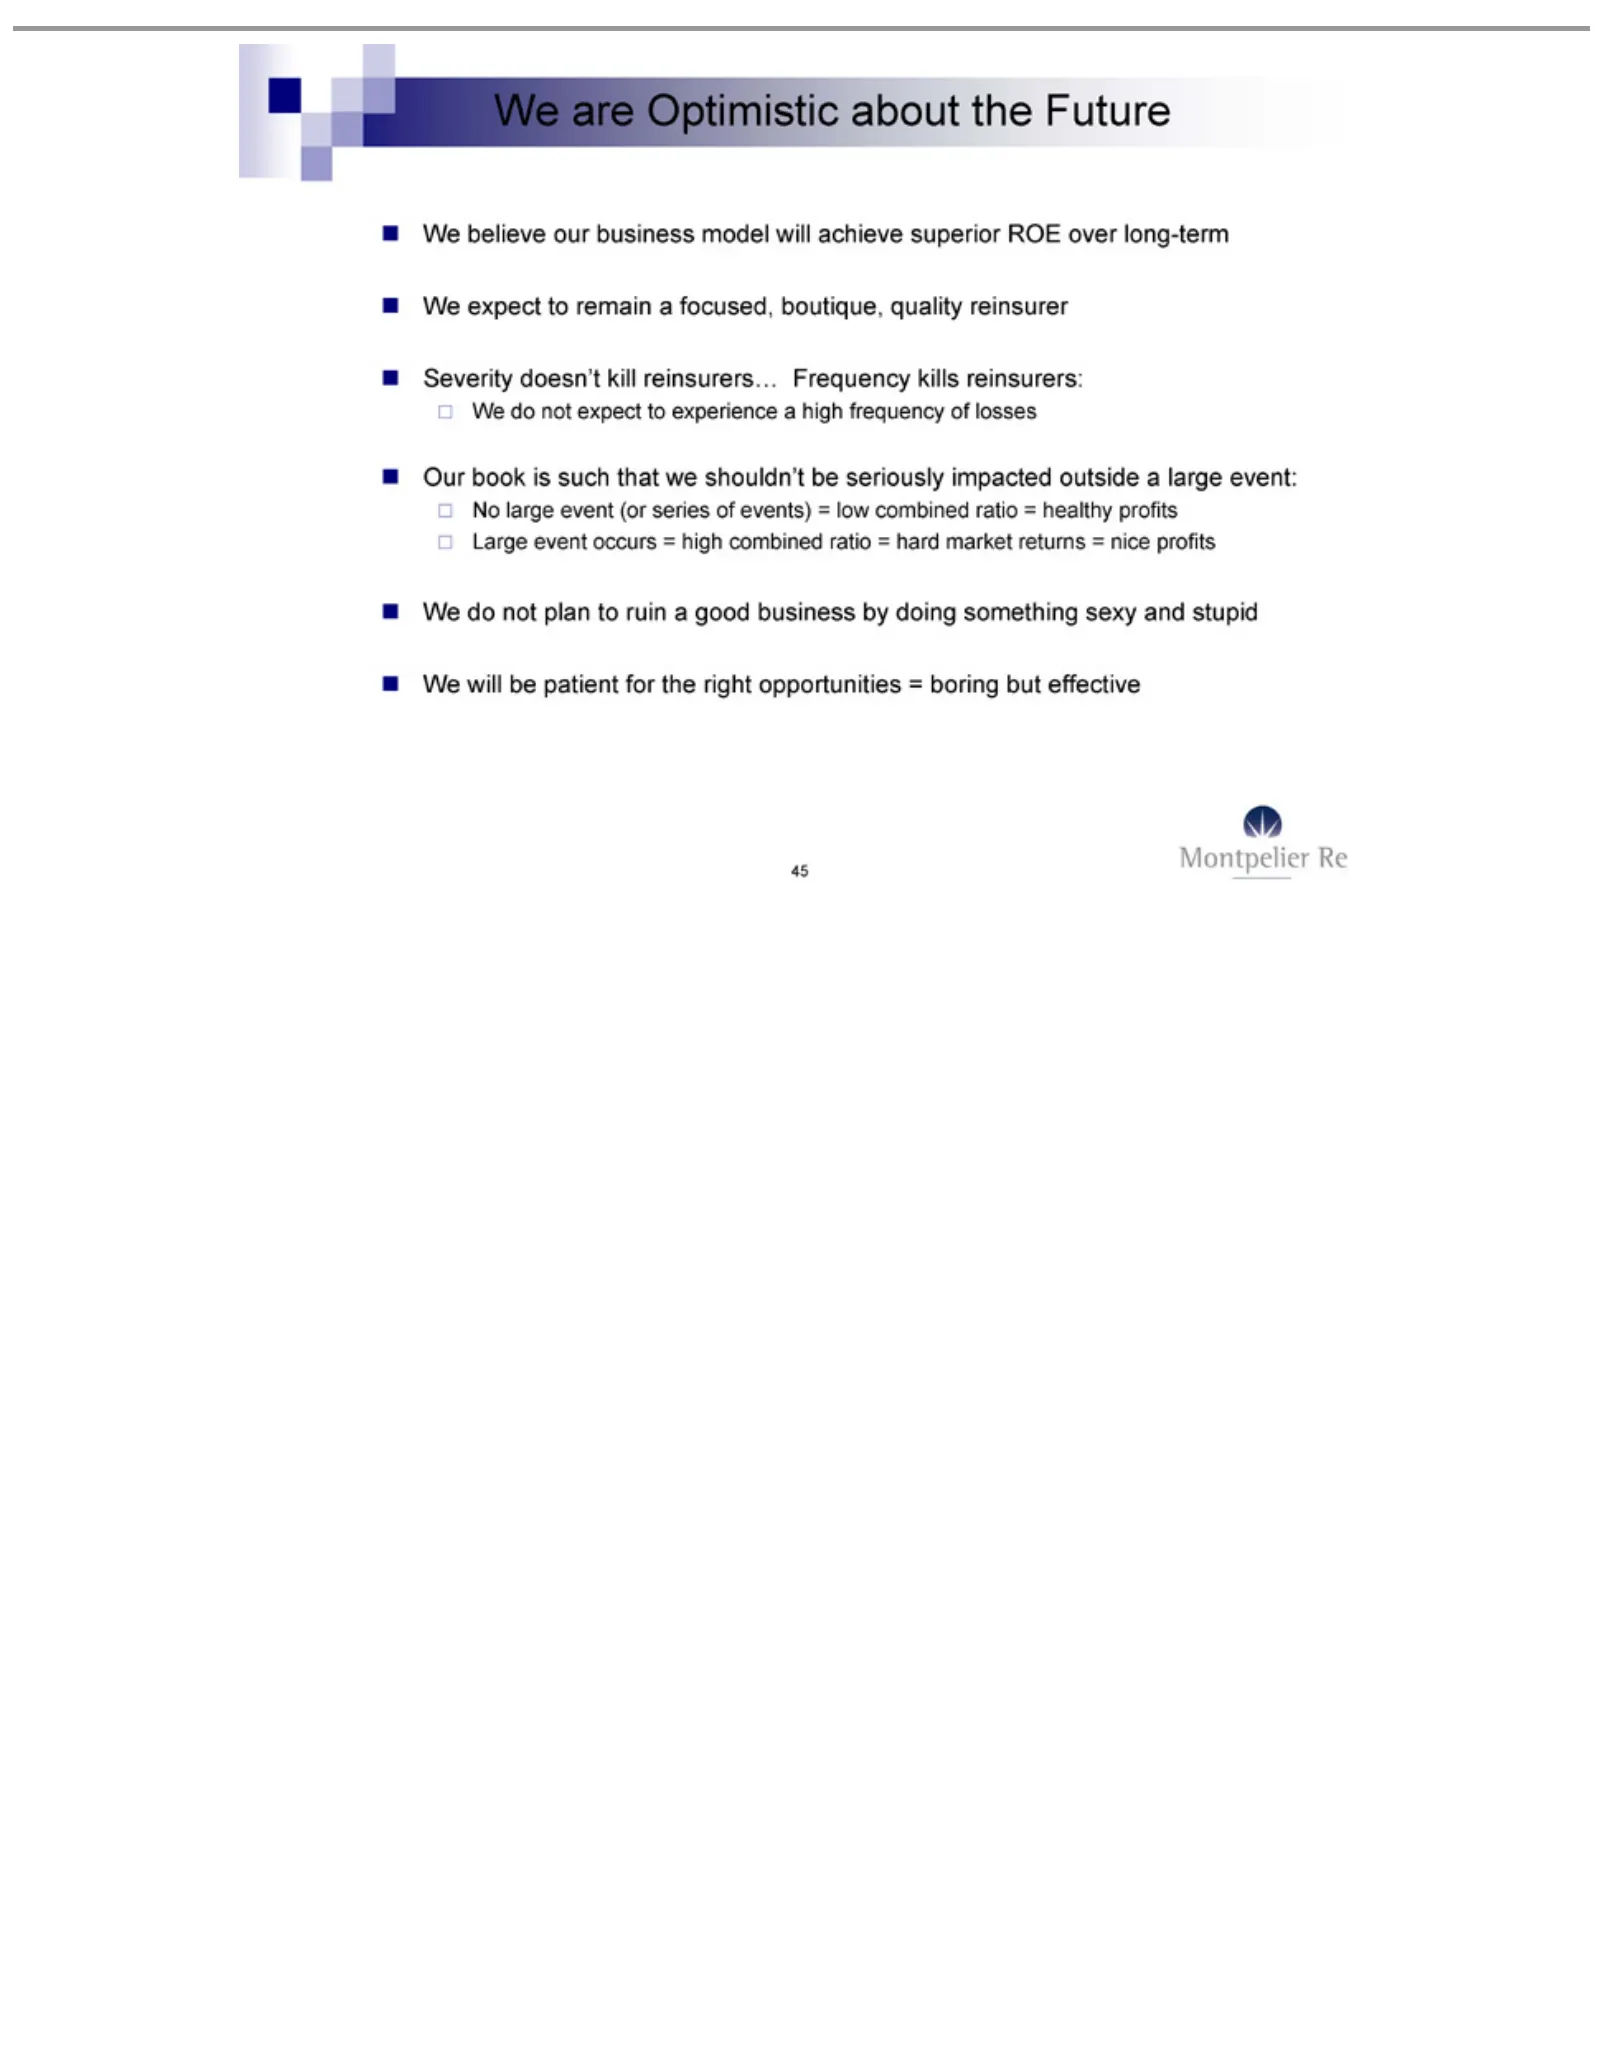
Slide 45: Severity: Our Expectations
Severity Our No Large We 45 large are believe expect do will book event not Optimistic be doesn’t event isplan expect to patient our such occurs remain (or business tokill that to ruin about for series =experience reinsurers… ahigh we the focused, a good model the of shouldn’t right combined events)
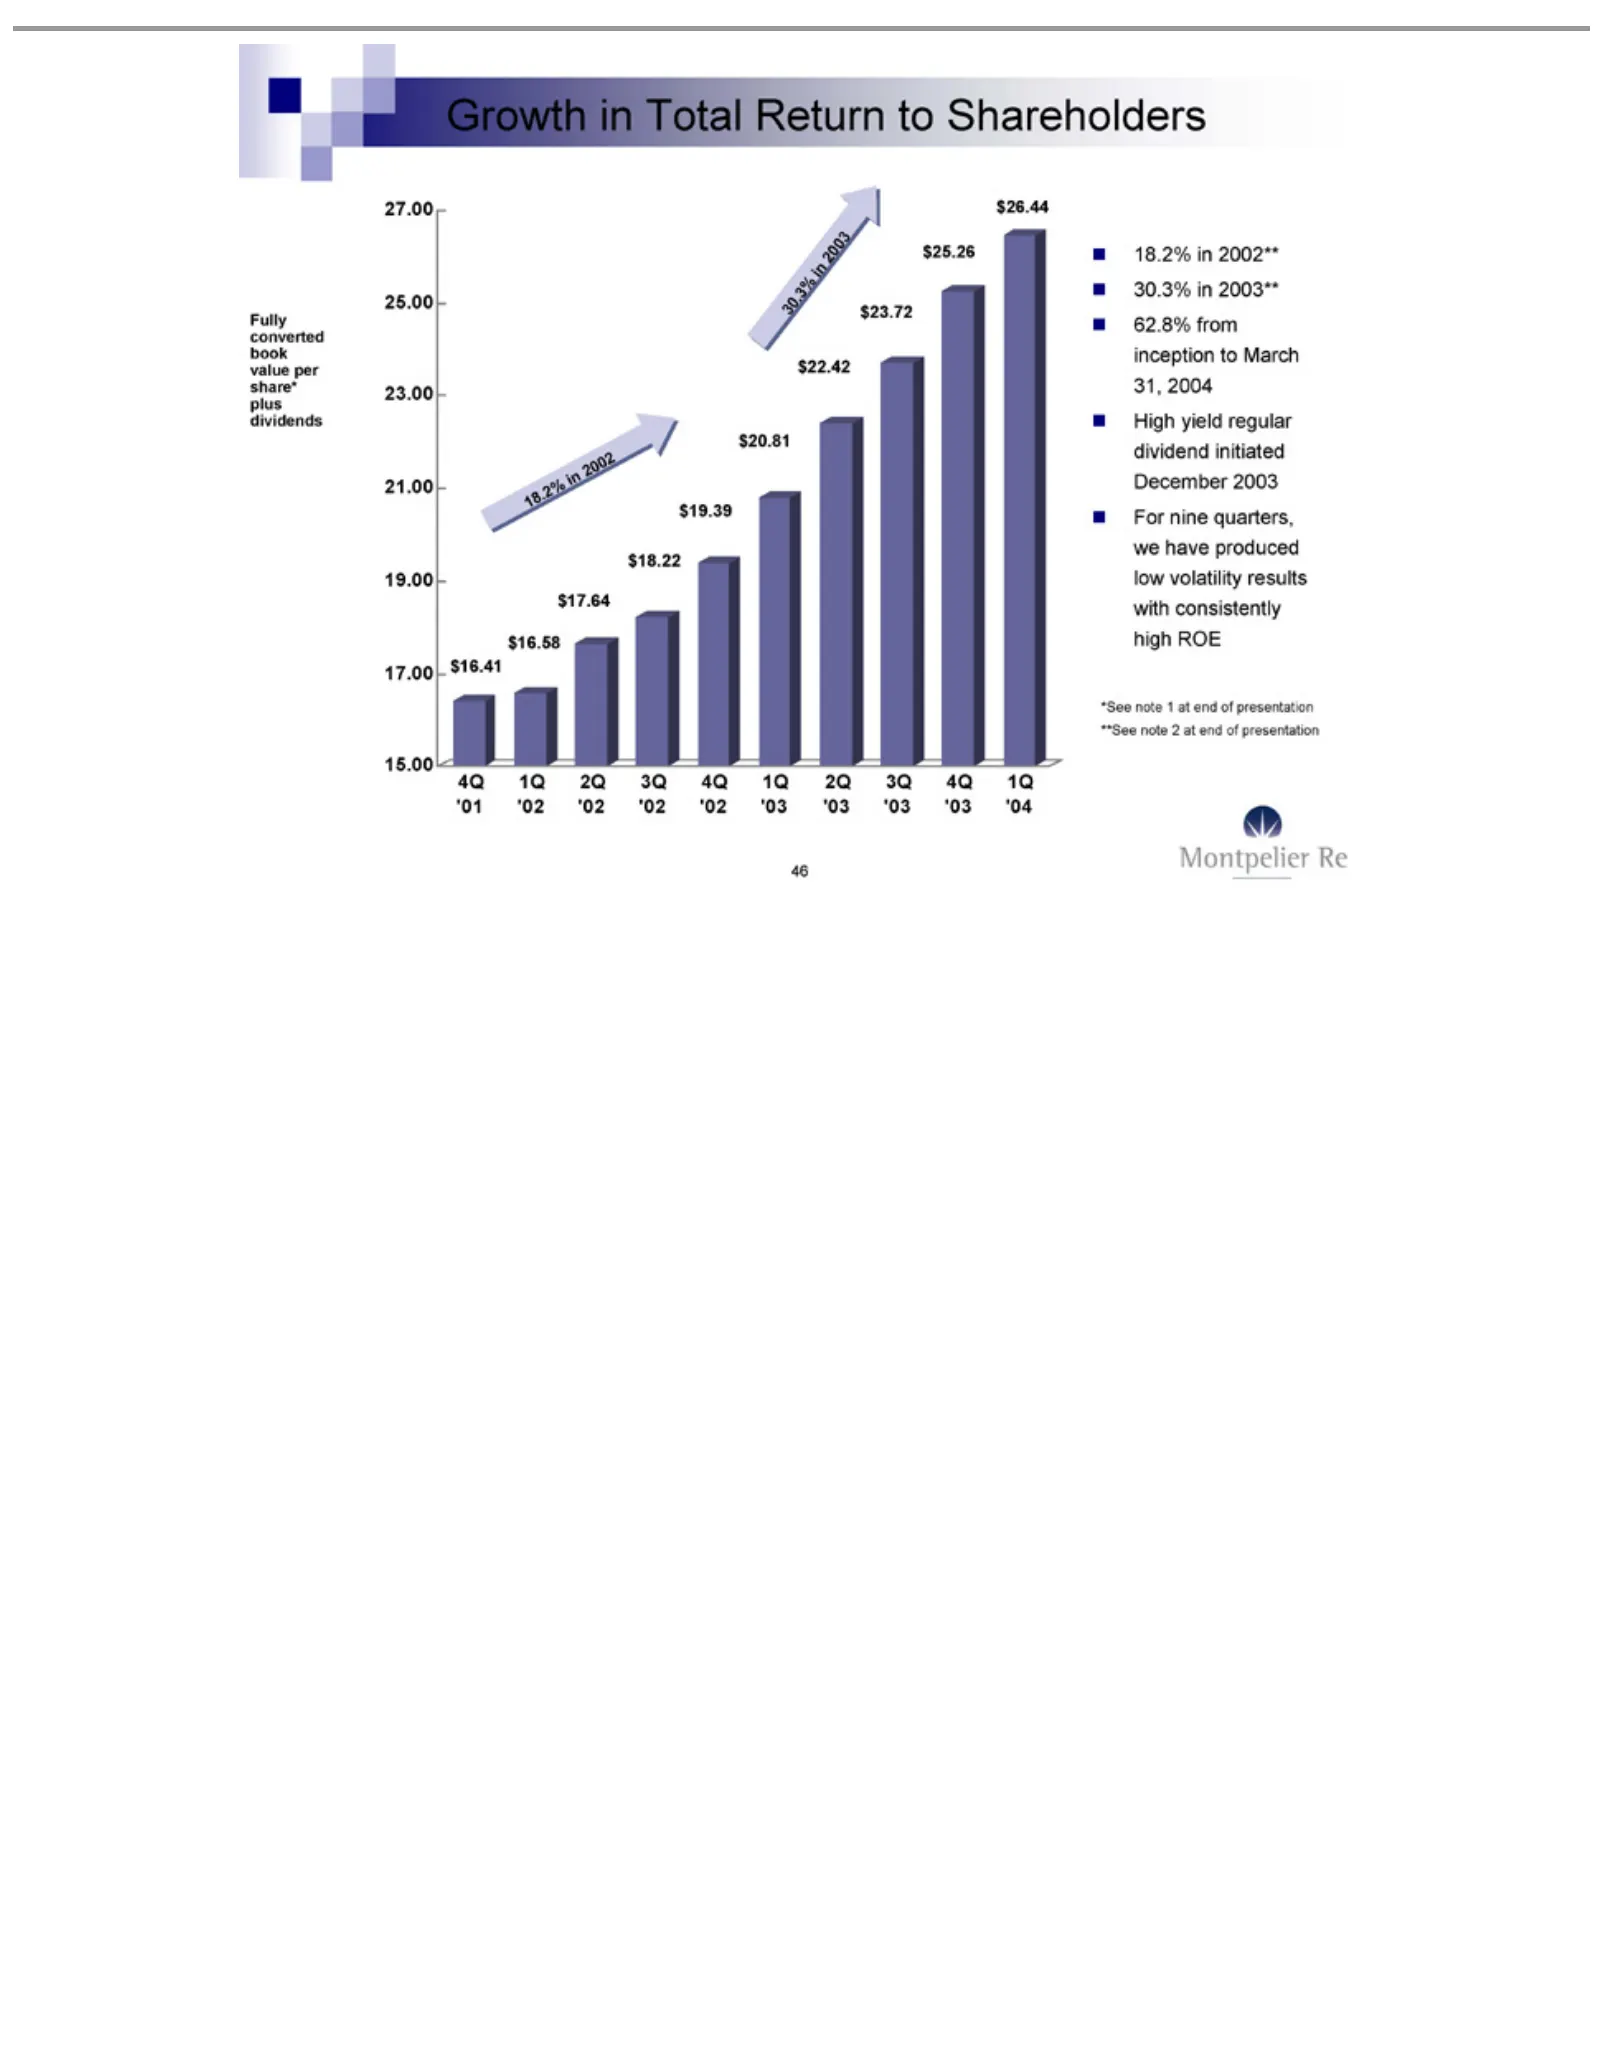
Slide 46: Growth in Fully Converted Book Value per Share
Growth Fully 27.00 4Q $16.41 18.2% 30.3% 62.8% High For *See **See 46 ‘01 nine note yield converted 25.00 note in from $16.58 1Q inquarters, 2002 2003 2002** 2003** 1Total regular ‘02 2at 23.00 inception atend $17.64 2Q end book Return we 21.00 dividend of ‘02 ofpresentation have value to $18.22 pre
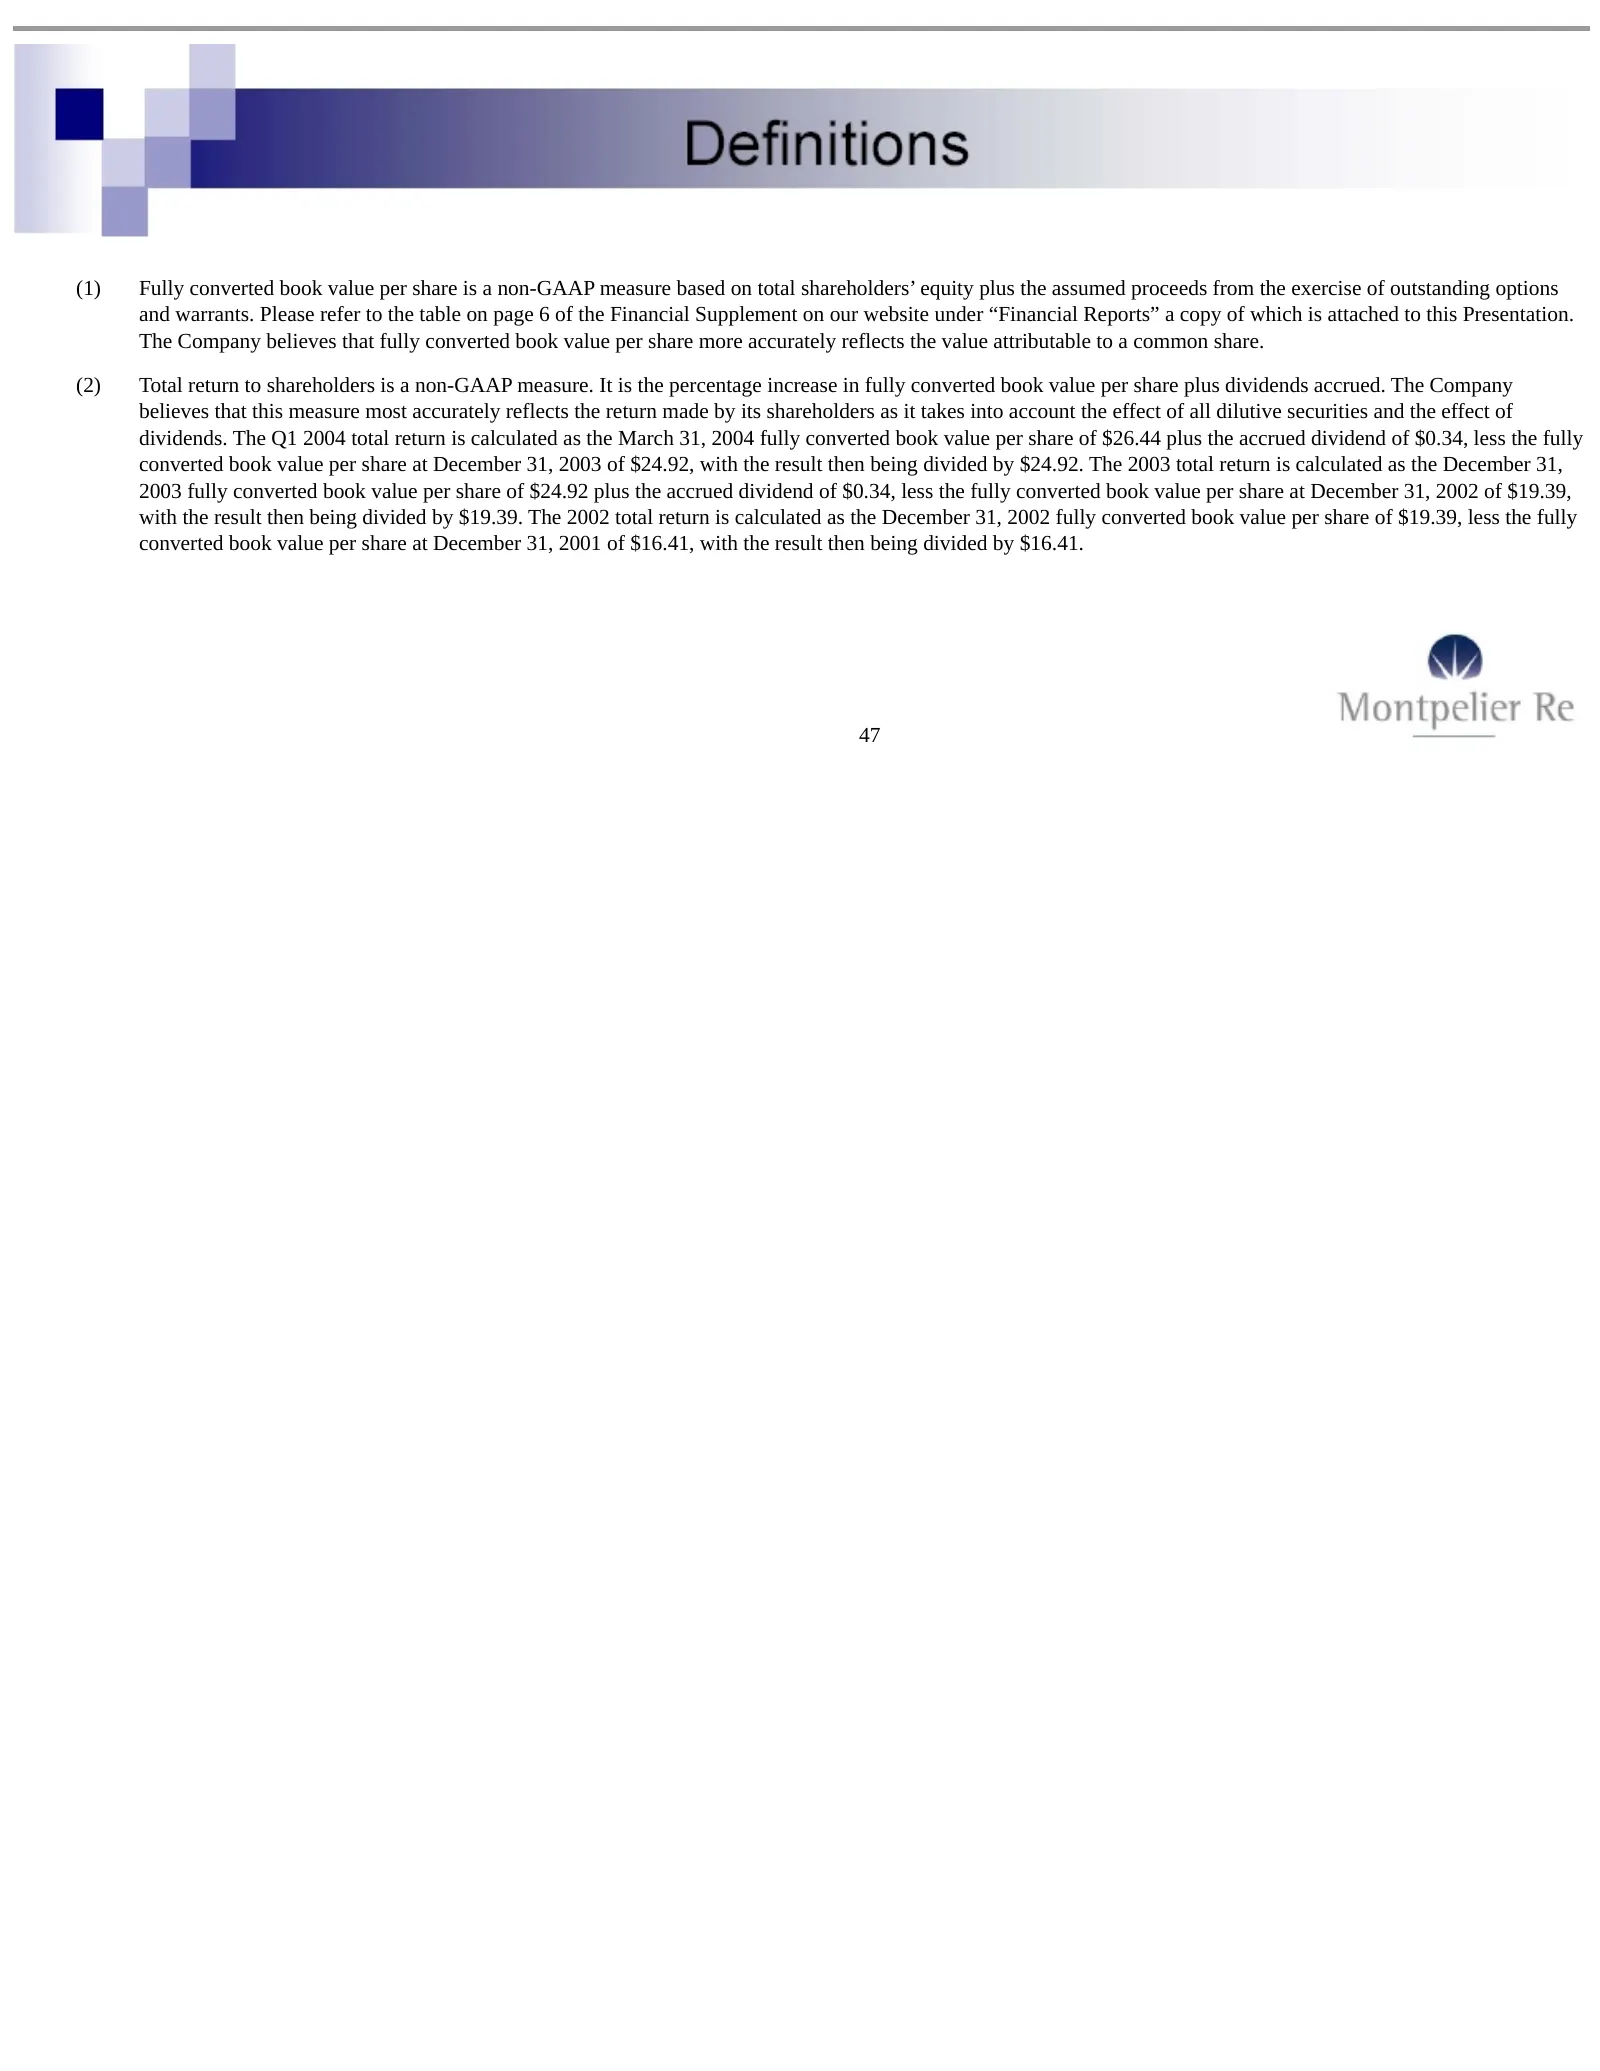
Slide 47: Notes on Non-GAAP Measures
(1) Fully converted book value per share is a non-GAAP measure based on total shareholders’ equity plus the assumed proceeds from the exercise of outstanding options and warrants. Please refer to the table on page 6 of the Financial Supplement on our website under “Financial Reports” a copy of which
Slide 48: Q & A Session
Q & A Session Anthony Chairman, Taylor President and Chief Executive Officer

Slide 49: Montpelier Re Contact Information
Montpelier For Or Keil contact: more Gunther, information ReInformation Holdings on Ltd. our Manager Company, (441) please 297-9570 visit our [email protected] website: www.montpelierre.bm
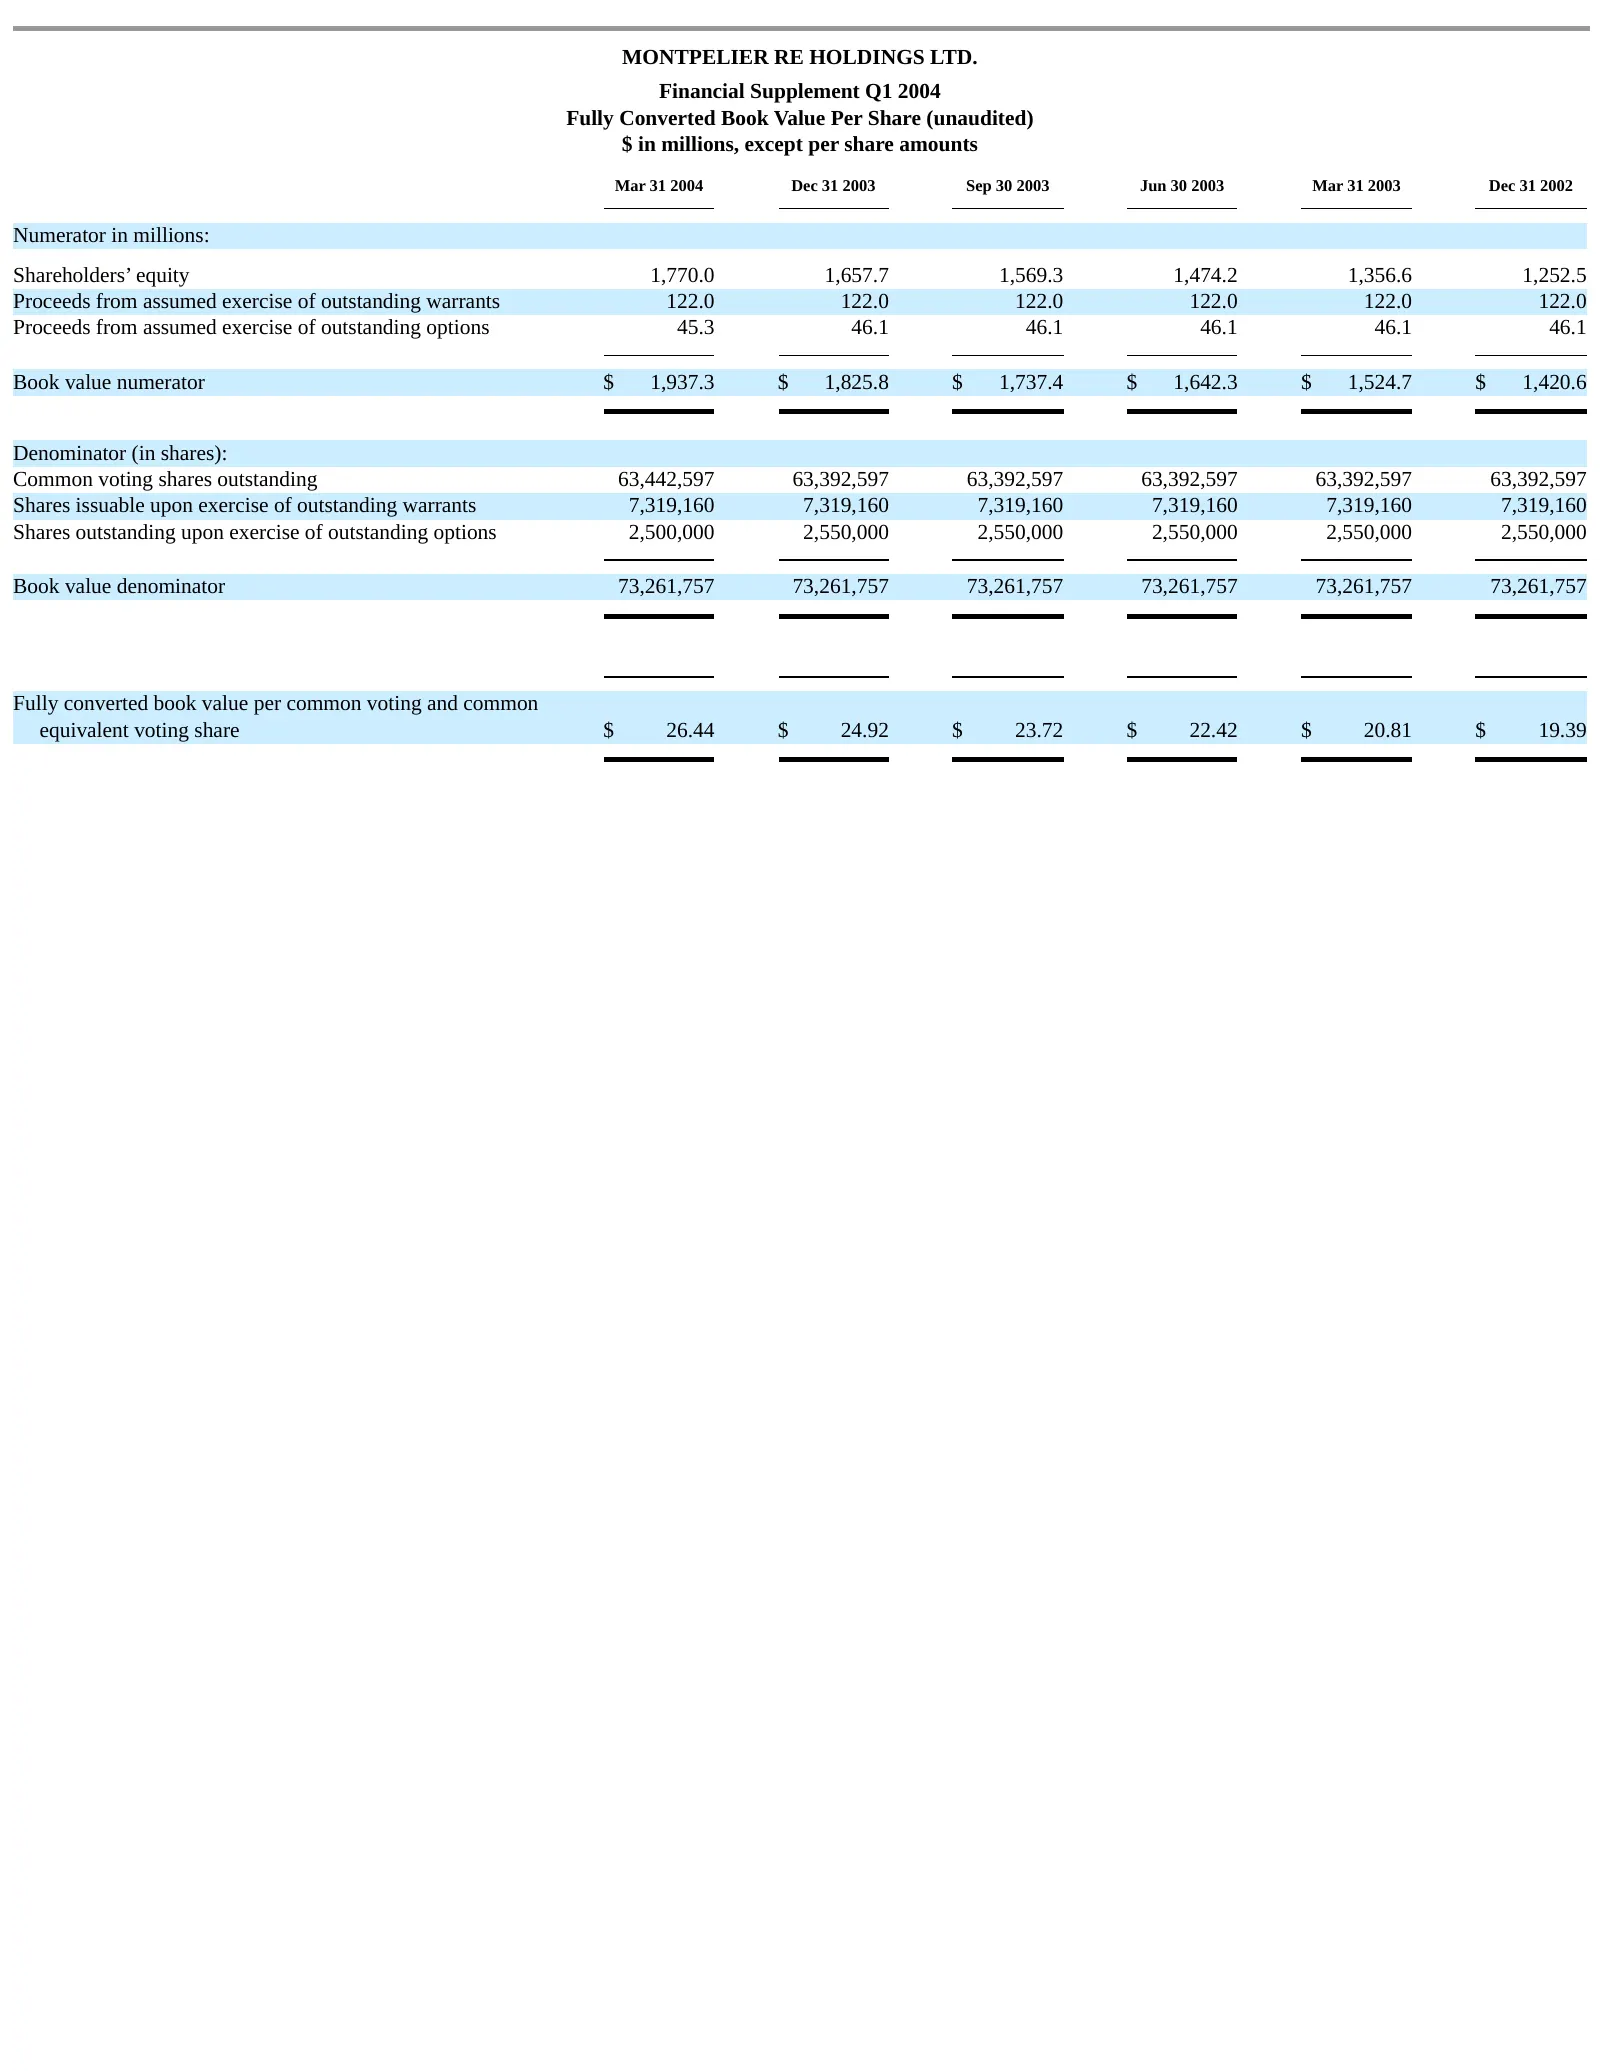
Slide 50: Financial Supplement Q1 2004: Fully Converted Book Value Per Share
MONTPELIER RE HOLDINGS LTD. Financial Supplement Q1 2004 Fully Converted Book Value Per Share (unaudited) $ in millions, except per share amounts Mar 31 2004 Dec 31 2003 Sep 30 2003 Jun 30 2003 Mar 31 2003 Dec 31 2002 Numerator in millions: Shareholders’ equity 1,770.0 1,657.7 1,569.3 1,474.2 1,356.
Source: SEC EDGAR · 8-K filed Jun 4, 2004
More decks from Montpelier Re Holdings Ltd
 Merger or Acquisition (March 2015)11 slides · Mar 31, 2015
 Merger or Acquisition (March 2015)11 slides · Mar 31, 2015
 Q4 2011 Earnings Presentation26 slides · Mar 5, 2012
 Investor Presentation (September 2011)27 slides · Sep 7, 2011
 KBW Investor Conference 201018 slides · Sep 8, 2010
 Investor Day (May 2009)47 slides · May 7, 2009