Pinnacle Foods — Barclays Capital Back-to-School Conference 2014
47 slides from Pinnacle Foods's conference presentation, Sep 4, 2014
Slide 1: Barclays Capital Back-to-School Conference
1 1 PINNACLE FOODS INC. Barclays Capital Back-to-School Conference September 4, 2014
Slide 2: Pinnacle Management
2 2 Bob Gamgort Chief Executive Officer Craig Steeneck EVP & CFO Maria Sceppaguercio SVP IR & Communications Pinnacle Management
Slide 3: Forward-Looking Statements & Non-GAAP Financial Measures
3 3 Forward-Looking Statements & Non-GAAP Financial Measures This presentation contains “forward-looking statements” within the meaning of U.S. federal securities laws. Forward-looking statements are not historical facts, and are based upon management’s current expectations, beliefs, projections and
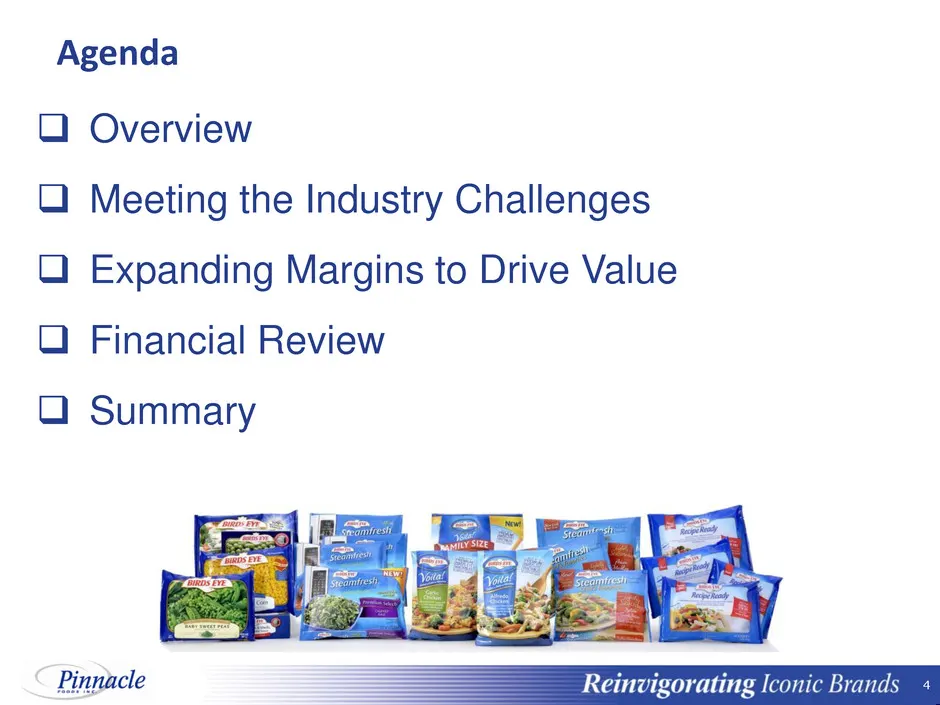
Slide 4: Agenda
4 4 Agenda Overview Meeting the Industry Challenges Expanding Margins to Drive Value Financial Review Summary
Slide 5: Attractive Value Creation Potential
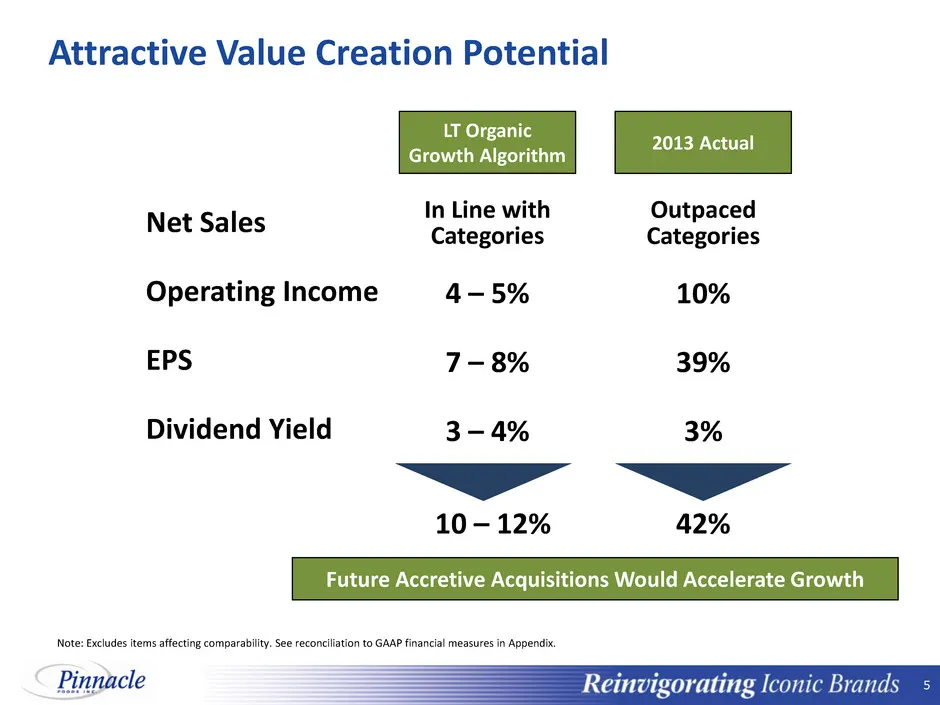
5 5 Attractive Value Creation Potential Net Sales Operating Income EPS Dividend Yield In Line with Categories 10 – 12% 4 – 5% 7 – 8% 3 – 4% LT Organic Growth Algorithm 10% 39% 3% Outpaced Categories 42% 2013 Actual Future Accretive Acquisitions Would Accelerate Growth Note: Excludes items affecting
Slide 6: Industry Challenges
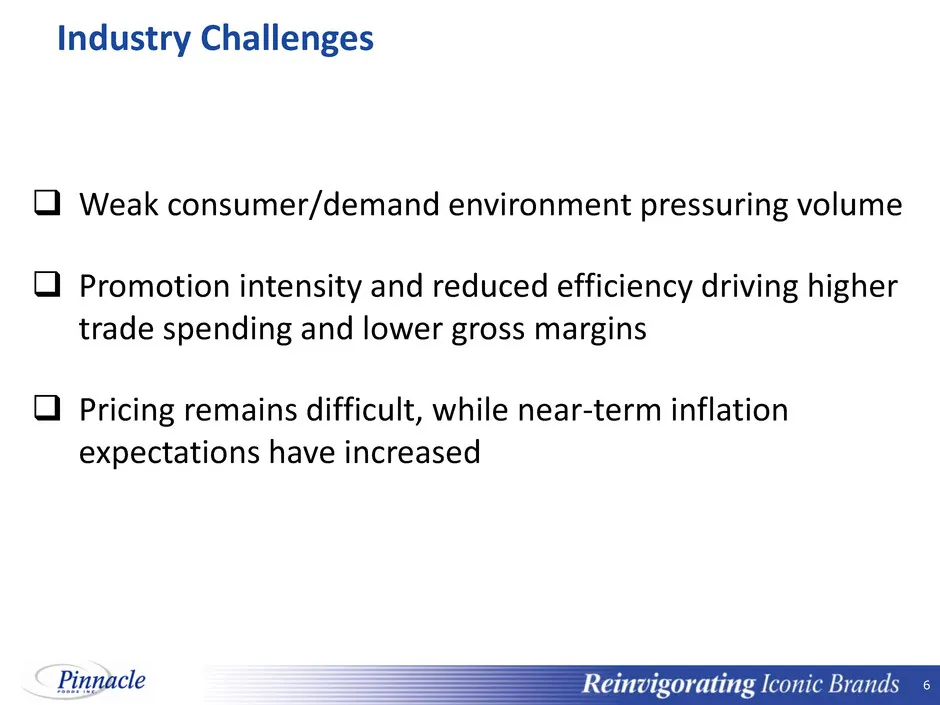
6 6 Industry Challenges Weak consumer/demand environment pressuring volume Promotion intensity and reduced efficiency driving higher trade spending and lower gross margins Pricing remains difficult, while near-term inflation expectations have increased
Slide 7: Attractive Value Creation Potential
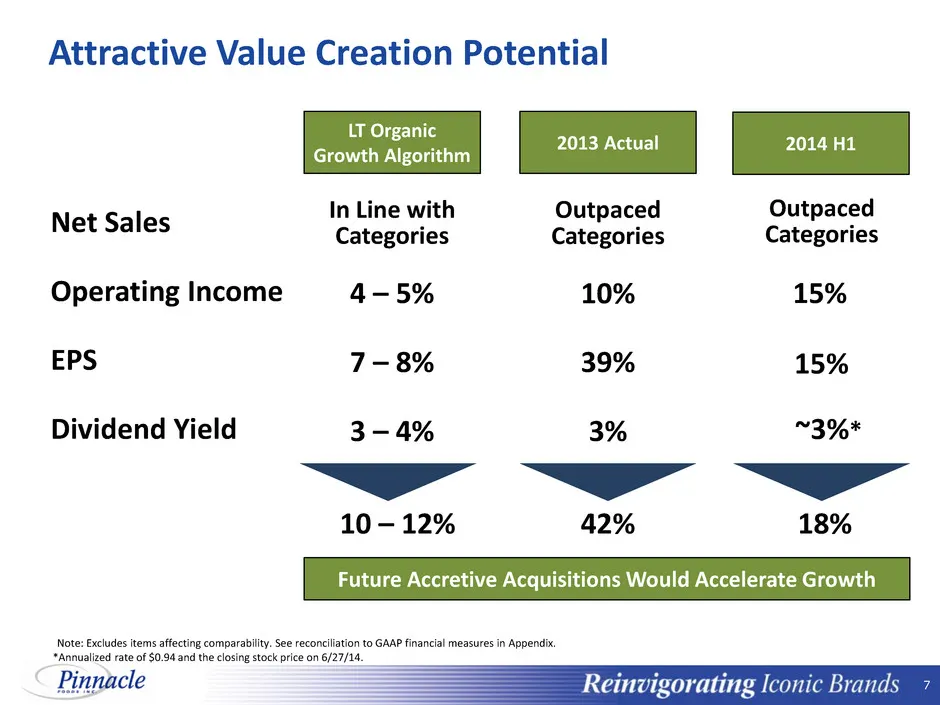
7 7 Attractive Value Creation Potential *Annualized rate of $0.94 and the closing stock price on 6/27/14. Net Sales Operating Income EPS Dividend Yield In Line with Categories 10 – 12% 4 – 5% 7 – 8% 3 – 4% LT Organic Growth Algorithm 10% 39% 3% Outpaced Categories 42% 2013 Actual 18% 15% 2014 H1 Out
Slide 8: Agenda
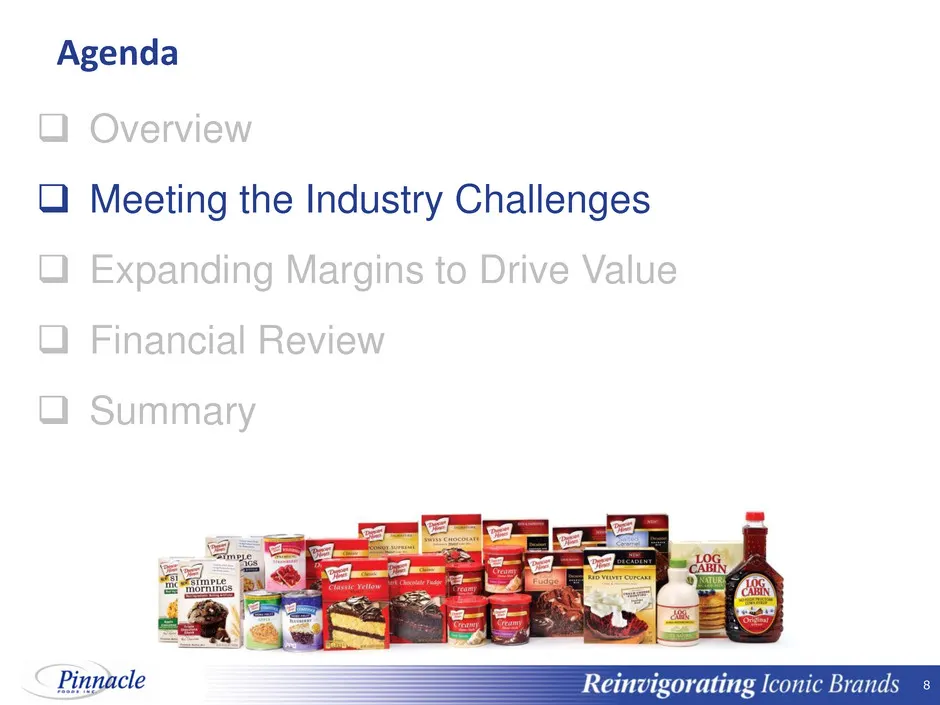
8 8 Agenda Overview Meeting the Industry Challenges Expanding Margins to Drive Value Financial Review Summary
Slide 9: Portfolio Management Strategy
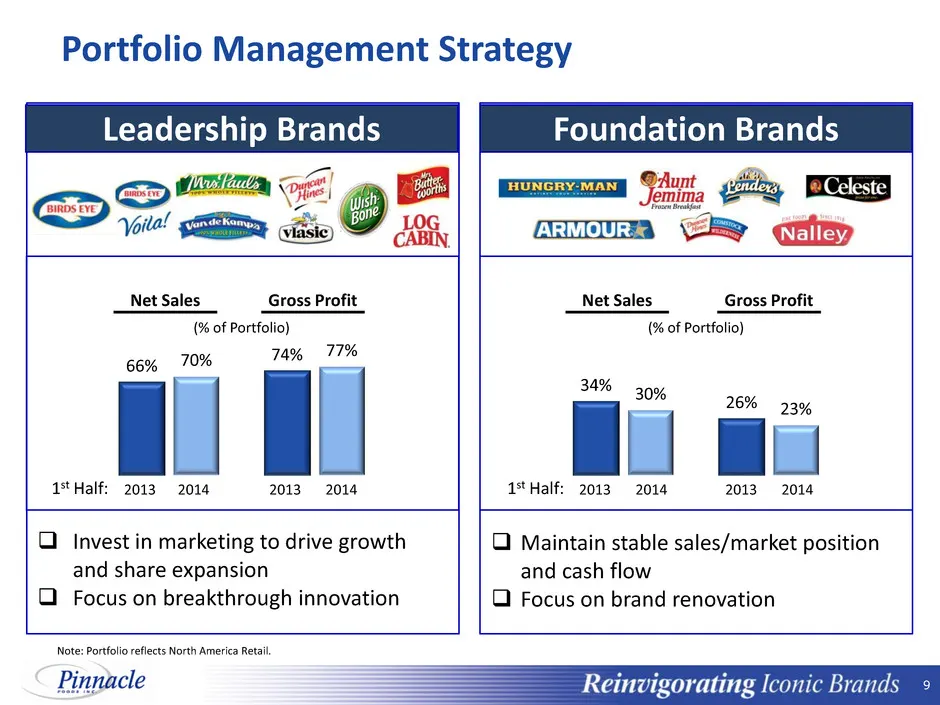
9 9 Portfolio Management Strategy 66% 74% 70% 77% Net Sales 2013 2014 2013 2014 34% 26% 30% 23% 2013 2014 2013 2014 Invest in marketing to drive growth and share expansion Focus on breakthrough innovation Gross Profit Net Sales Gross Profit Maintain stable sales/market position and cash flow
Slide 10: Strong Share Performance
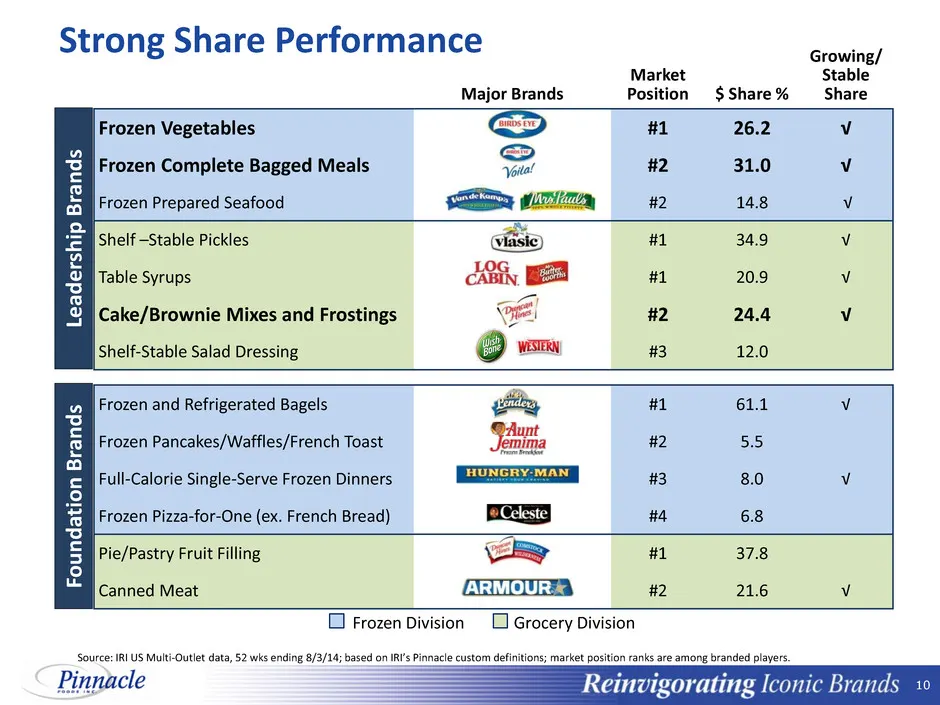
10 10 Strong Share Performance Source: IRI US Multi-Outlet data, 52 wks ending 8/3/14; based on IRI’s Pinnacle custom definitions; market position ranks are among branded players. Major Brands Market Position $ Share % Growing/ Stable Share Frozen Vegetables #1 26.2 √ Frozen Complete Bagged Meals #2
Slide 11: Birds Eye: $1 Billion Health & Wellness Brand
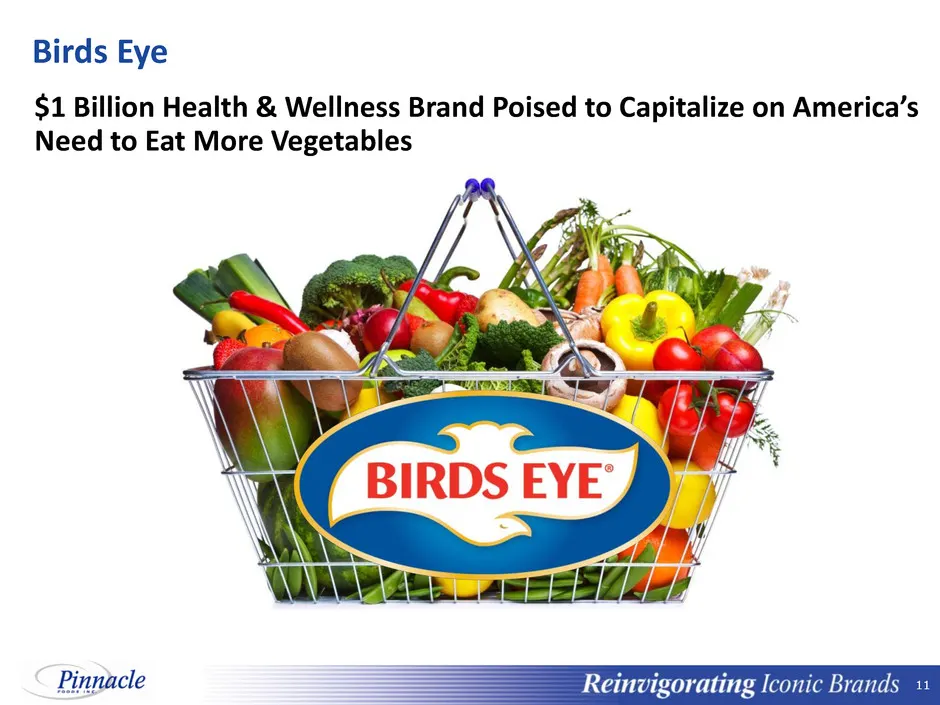
11 11 Birds Eye $1 Billion Health & Wellness Brand Poised to Capitalize on America’s Need to Eat More Vegetables
Slide 12: Birds Eye Brand
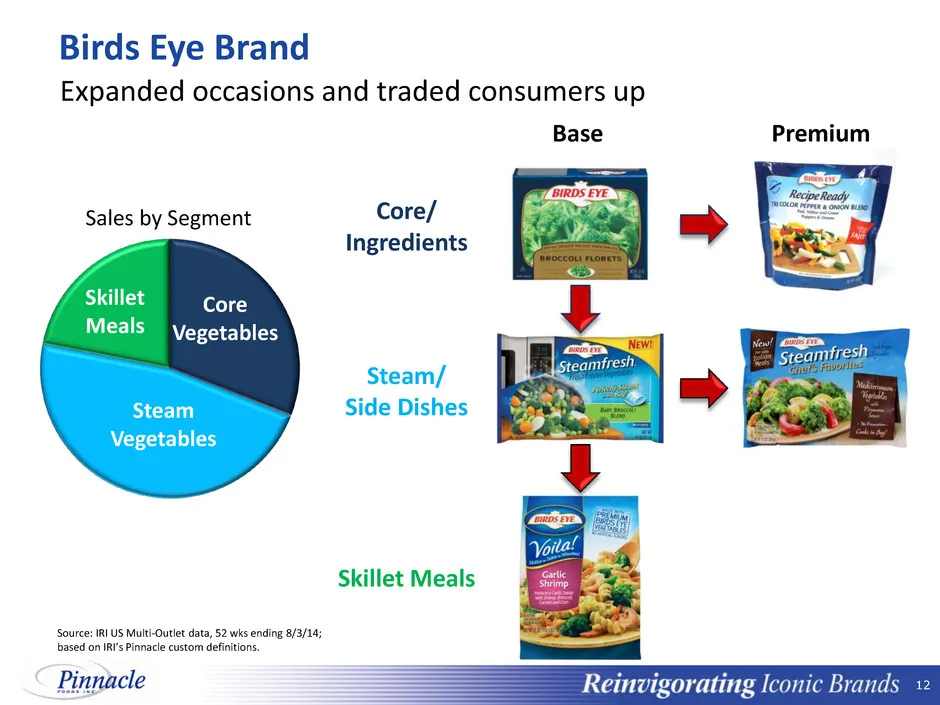
12 12 Birds Eye Brand Steam Vegetables Skillet Meals Core Vegetables Steam/ Side Dishes Skillet Meals Core/ Ingredients Sales by Segment Expanded occasions and traded consumers up Source: IRI US Multi-Outlet data, 52 wks ending 8/3/14; based on IRI’s Pinnacle custom definitions. Base Premium
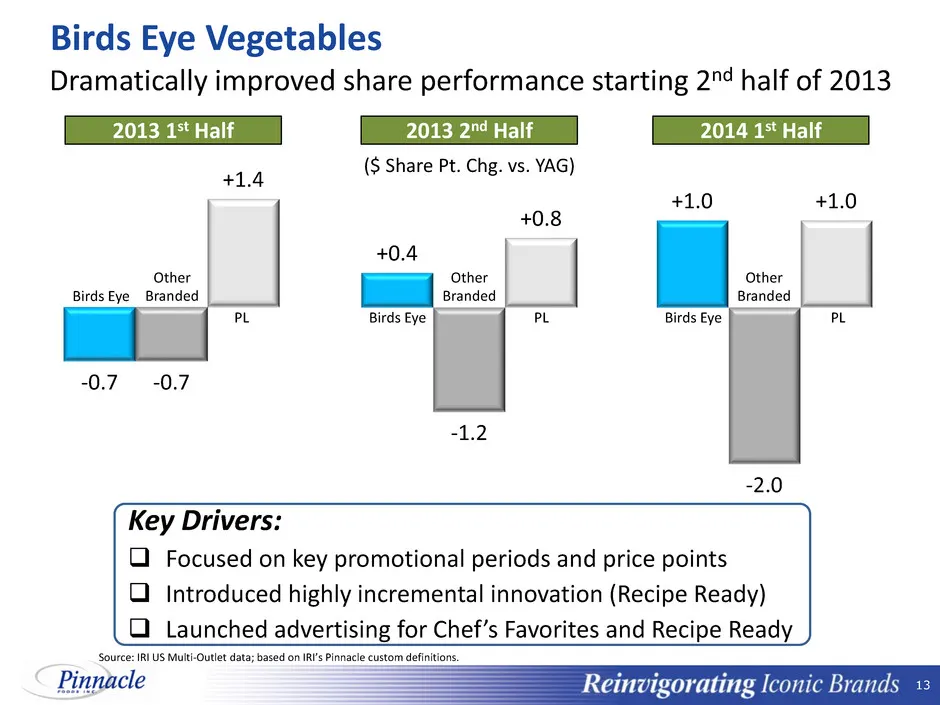
Slide 13: Birds Eye Vegetables share performance
13 13 -0.7 -0.7 +1.4 +0.4 +1.0 -1.2 -2.0 +0.8 +1.0 Birds Eye Vegetables 2013 1st Half 2013 2nd Half 2014 1st Half ($ Share Pt. Chg. vs. YAG) Birds Eye Birds Eye Birds Eye PL Other Branded Other Branded Other Branded PL PL Key Drivers: Focused on key promotional periods and price points Introduce
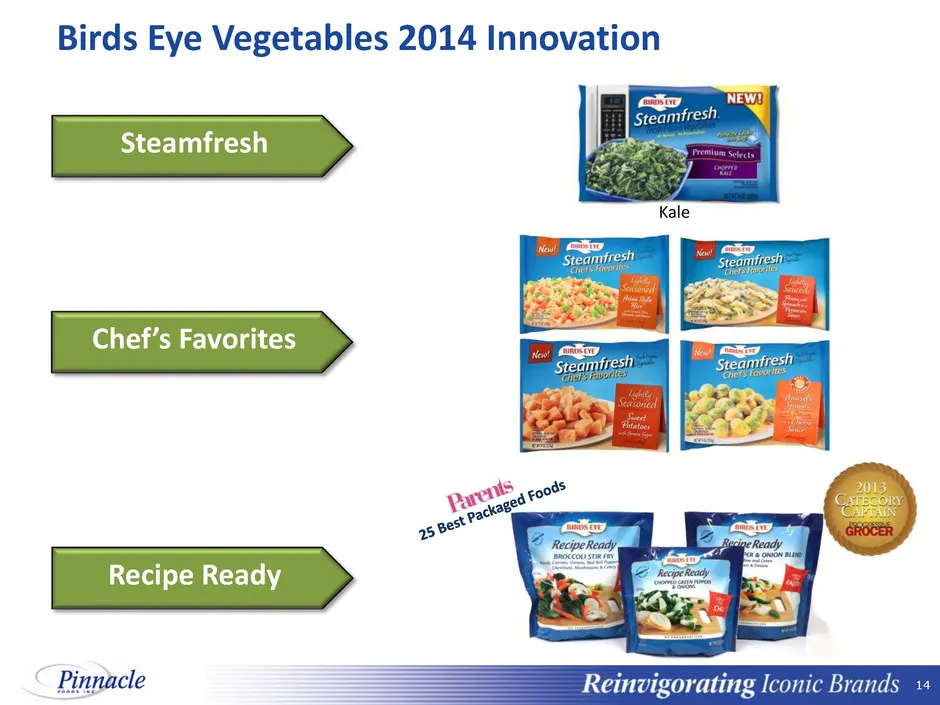
Slide 14: Birds Eye Vegetables 2014 Innovation
14 14 Birds Eye Vegetables 2014 Innovation Kale Recipe Ready Steamfresh Chef’s Favorites
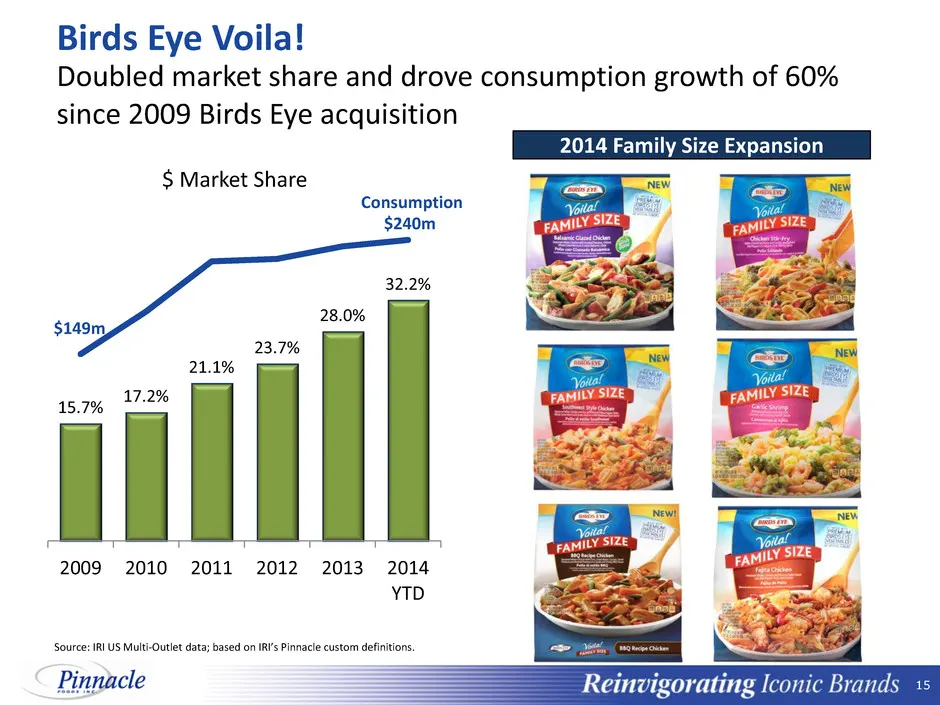
Slide 15: Birds Eye Voila!
15 15 Birds Eye Voila! 15.7% 17.2% 21.1% 23.7% 28.0% 32.2% 2009 2010 2011 2012 2013 2014 YTD $ Market Share Doubled market share and drove consumption growth of 60% since 2009 Birds Eye acquisition 2014 Family Size Expansion Source: IRI US Multi-Outlet data; based on IRI’s Pinnacle custom definition
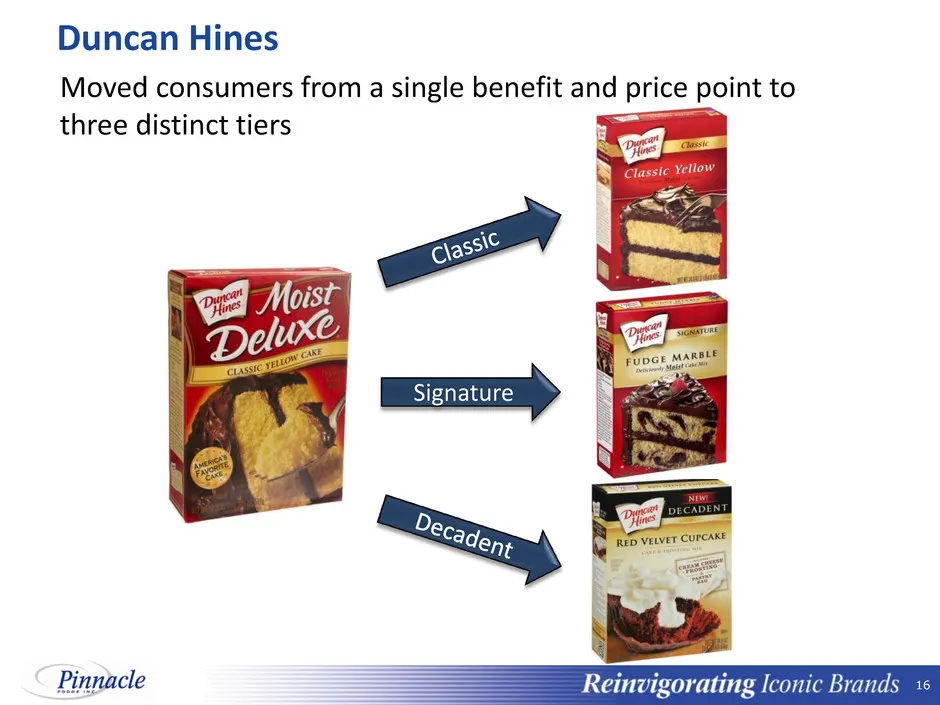
Slide 16: Duncan Hines Signature
16 16 Duncan Hines Signature Moved consumers from a single benefit and price point to three distinct tiers
Slide 17: Duncan Hines share performance
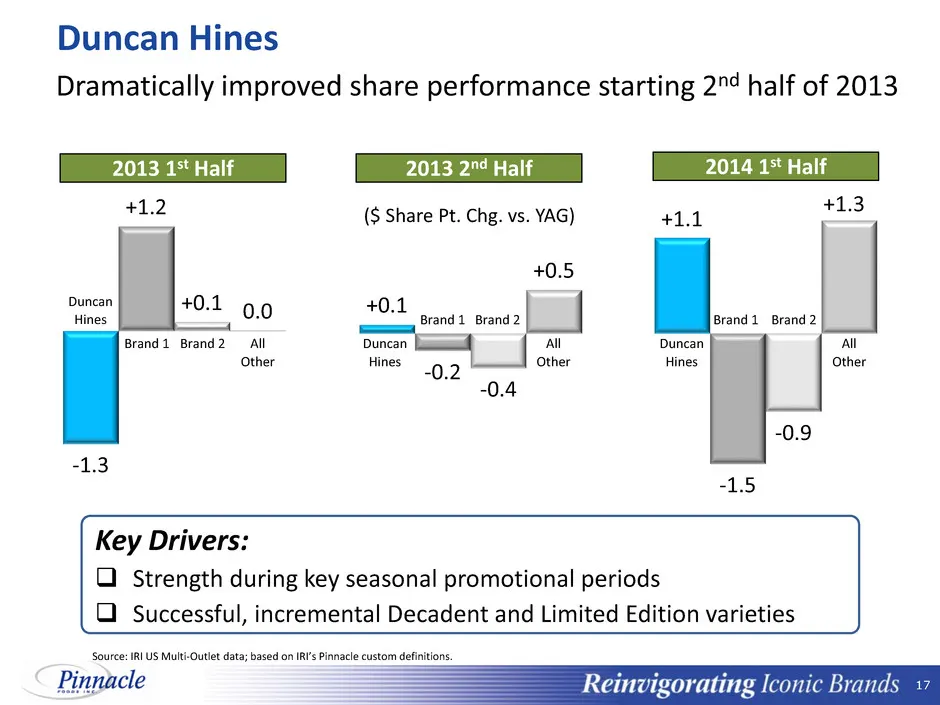
17 17 -1.3 +1.2 +0.1 0.0 +0.1 +1.1 -0.2 -1.5 -0.4 -0.9 +0.5 Duncan Hines Dramatically improved share performance starting 2nd half of 2013 Duncan Hines Duncan Hines Duncan Hines Brand 2 Brand 2 Brand 2 Brand 1 Key Drivers: Strength during key seasonal promotional periods Successful, incremental
Slide 18: Duncan Hines 2014 Innovation
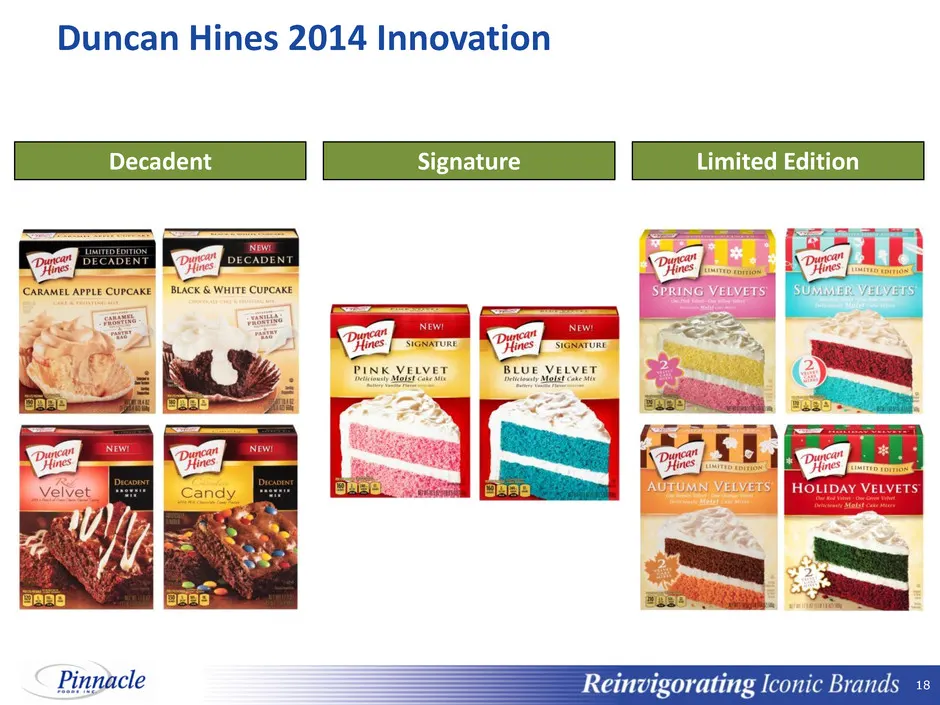
18 18 Duncan Hines 2014 Innovation Signature Limited Edition Decadent
Slide 19: Duncan Hines Digital Marketing
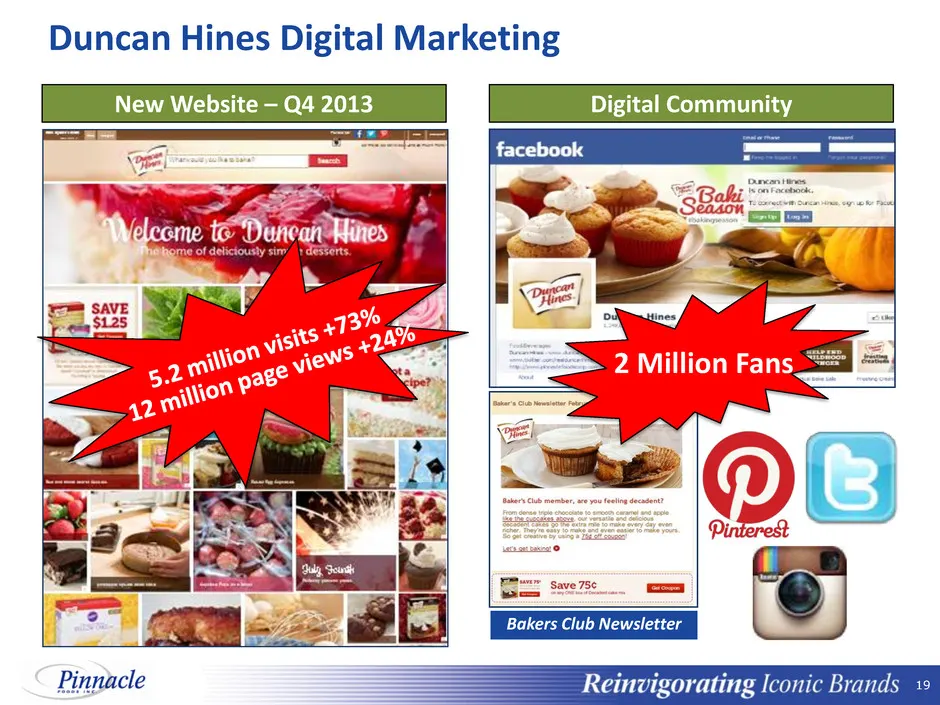
19 19 Duncan Hines Digital Marketing Bakers Club Newsletter Digital Community New Website – Q4 2013 2 Million Fans
Slide 20: Duncan Hines: Investing in Capabilities
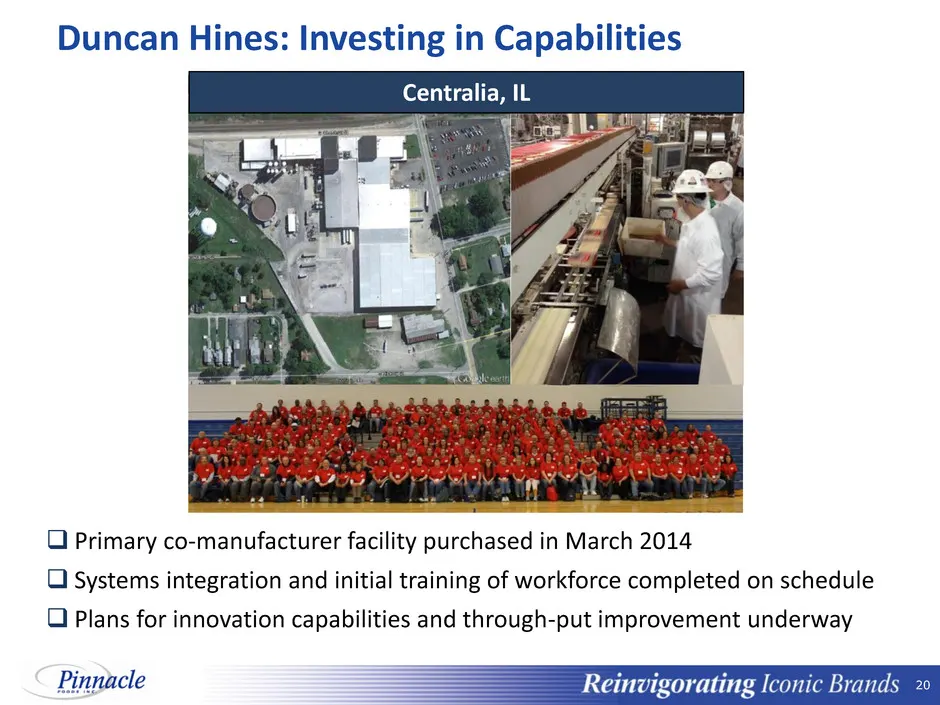
20 20 Duncan Hines: Investing in Capabilities Primary co-manufacturer facility purchased in March 2014 Systems integration and initial training of workforce completed on schedule Plans for innovation capabilities and through-put improvement underway Centralia, IL
Slide 21: Wish-Bone Acquisition Update
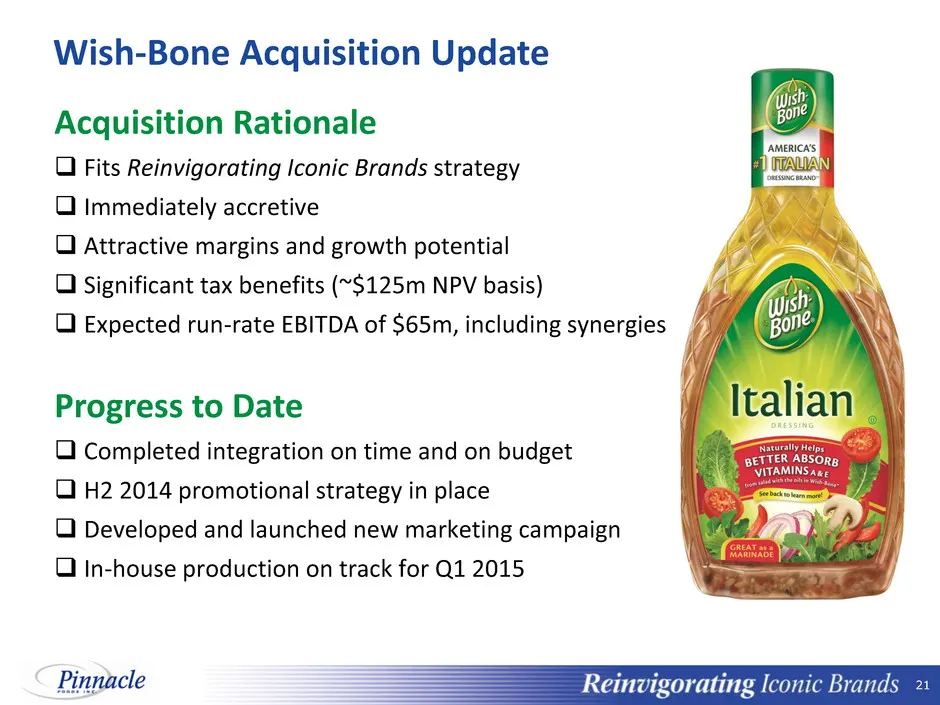
21 21 Wish-Bone Acquisition Update Acquisition Rationale Fits Reinvigorating Iconic Brands strategy Immediately accretive Attractive margins and growth potential Significant tax benefits (~$125m NPV basis) Expected run-rate EBITDA of $65m, including synergies Progress to Date Completed i
Slide 22: Wish-Bone 2014 Marketing Campaign
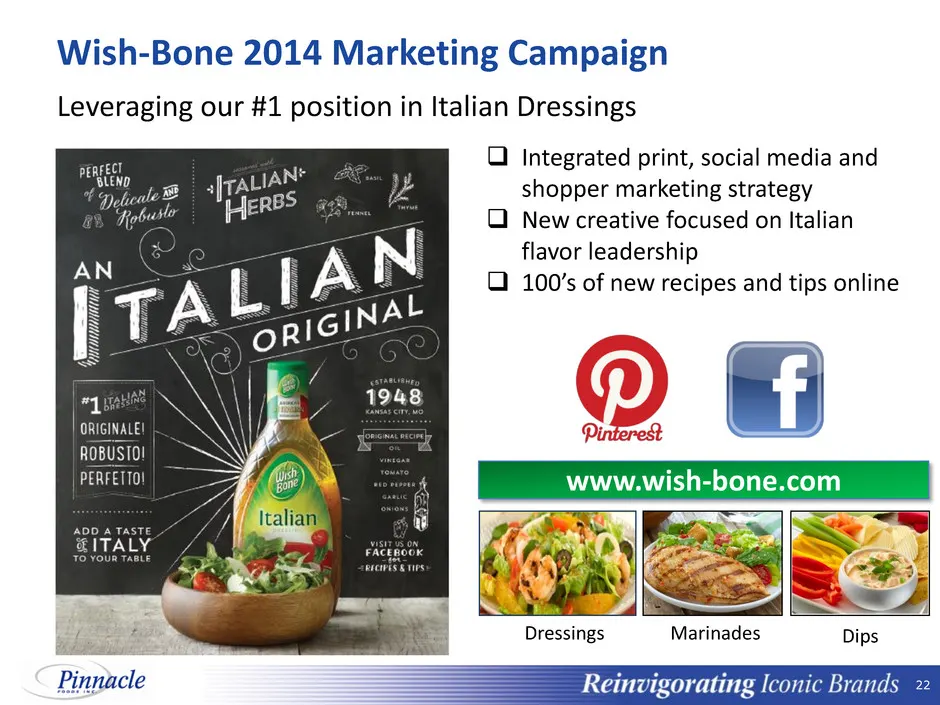
22 22 Wish-Bone 2014 Marketing Campaign Leveraging our #1 position in Italian Dressings www.wish-bone.com Dips Dressings Marinades Integrated print, social media and shopper marketing strategy New creative focused on Italian flavor leadership 100’s of new recipes and tips online
Slide 23: Agenda
23 23 Agenda Overview Meeting the Industry Challenges Expanding Margins to Drive Value Financial Review Summary
Slide 24: Strong Emphasis on Margin Expansion
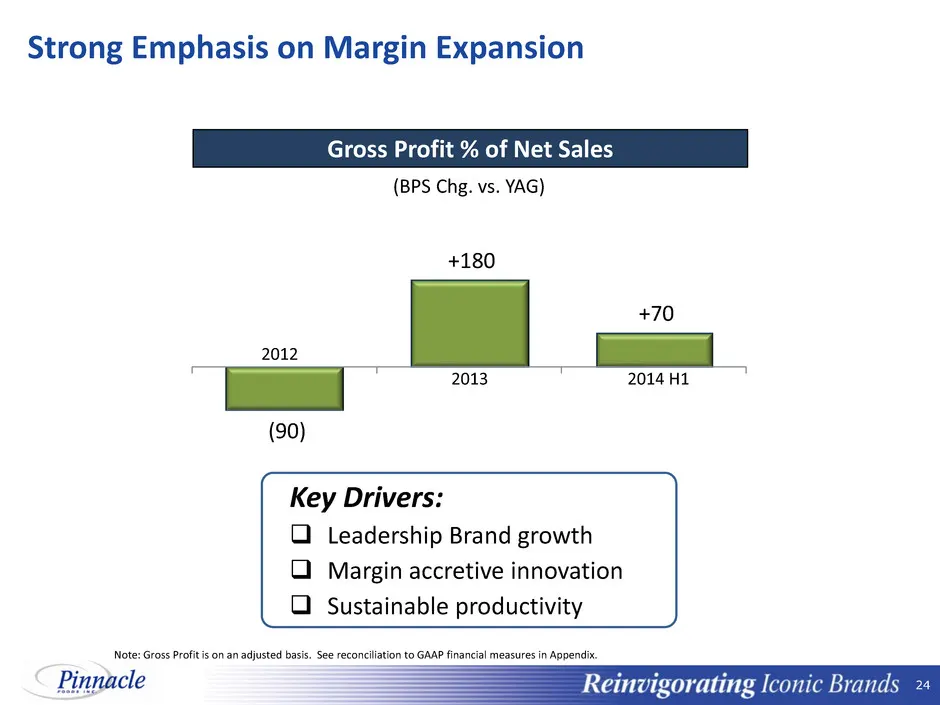
24 24 Strong Emphasis on Margin Expansion (90) +180 +70 (BPS Chg. vs. YAG) Key Drivers: Leadership Brand growth Margin accretive innovation Sustainable productivity Note: Gross Profit is on an adjusted basis. See reconciliation to GAAP financial measures in Appendix. Gross Profit % of Net Sale
Slide 25: Margin Accretive Innovation
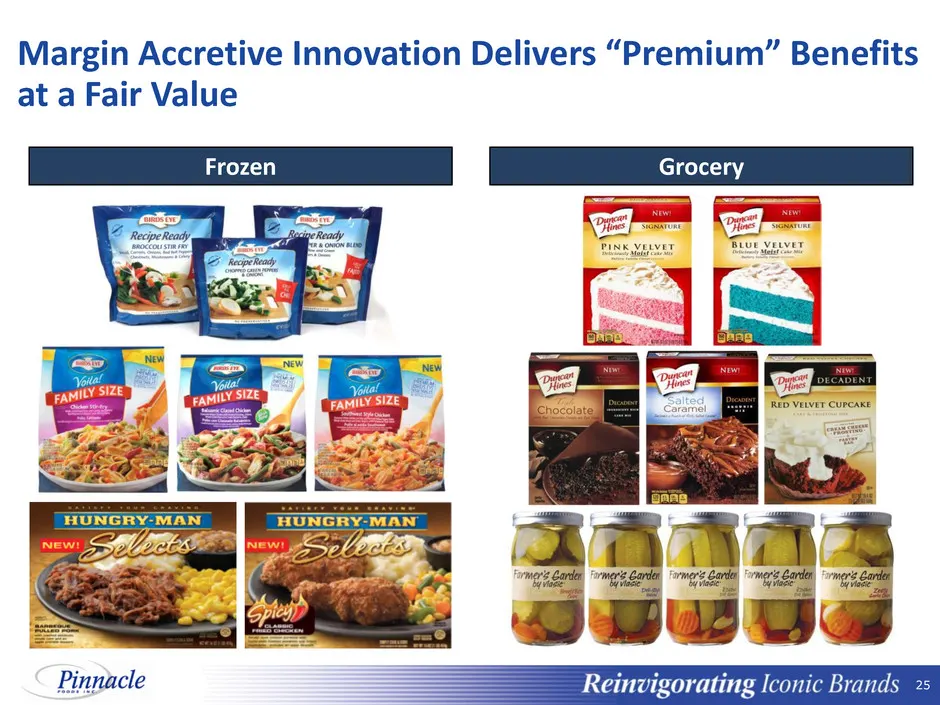
25 25 Margin Accretive Innovation Delivers “Premium” Benefits at a Fair Value Frozen Grocery
Slide 26: Maximizing Value through Productivity
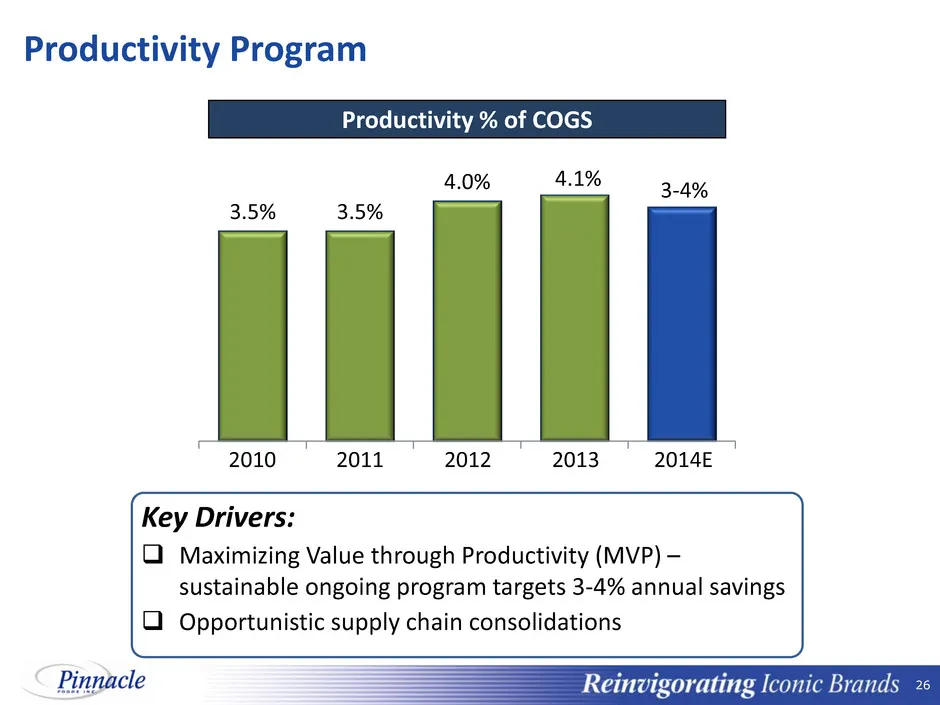
26 26 3.5% 3.5% 4.0% 4.1% 3-4% Productivity % of COGS Productivity Program Key Drivers: Maximizing Value through Productivity (MVP) – sustainable ongoing program targets 3-4% annual savings Opportunistic supply chain consolidations 2010 2011 2012 2013 2014E
Slide 27: Productivity and Inflation
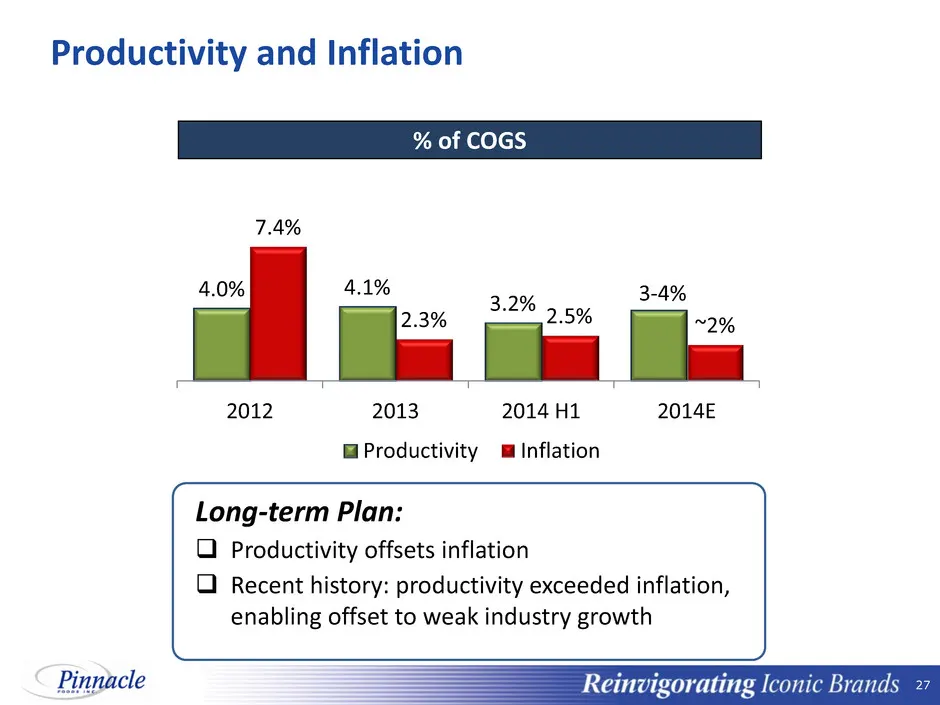
27 27 Productivity and Inflation 4.0% 4.1% 3.2% 3-4% 7.4% 2.3% 2.5% ~2% 2012 2013 2014 H1 2014E Productivity Inflation % of COGS Long-term Plan: Productivity offsets inflation Recent history: productivity exceeded inflation, enabling offset to weak industry growth
Slide 28: Lean Overhead
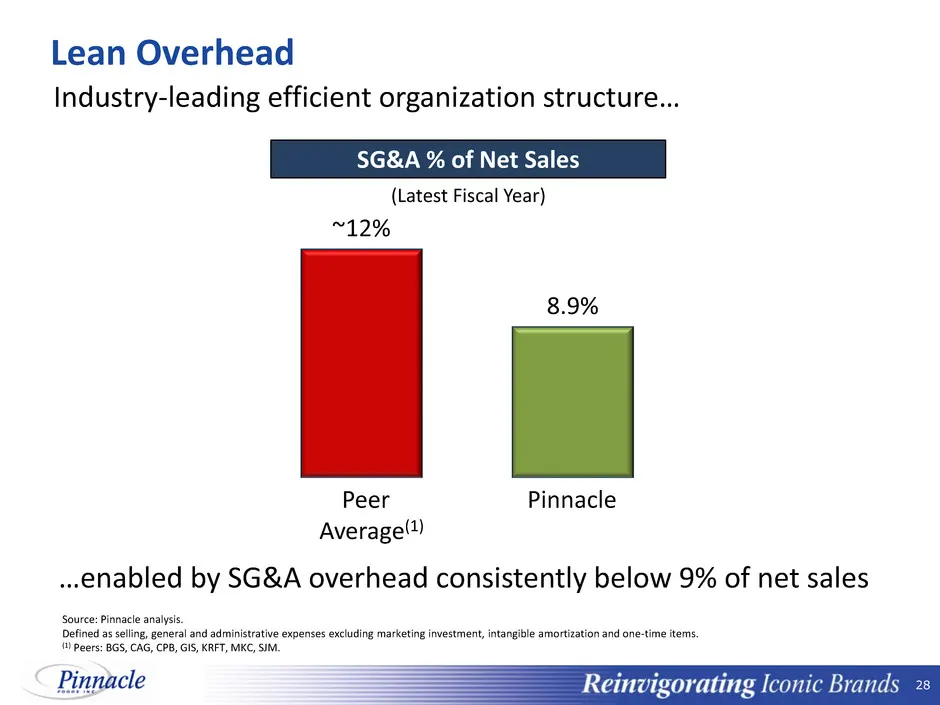
28 28 Source: Pinnacle analysis. Defined as selling, general and administrative expenses excluding marketing investment, intangible amortization and one-time items. (1) Peers: BGS, CAG, CPB, GIS, KRFT, MKC, SJM. Lean Overhead Industry-leading efficient organization structure… (Latest Fiscal Year) SG
Slide 29: Agenda
29 29 Agenda Overview Meeting the Industry Challenges Expanding Margins to Drive Value Financial Review Summary
Slide 30: Attractive Value Creation Potential
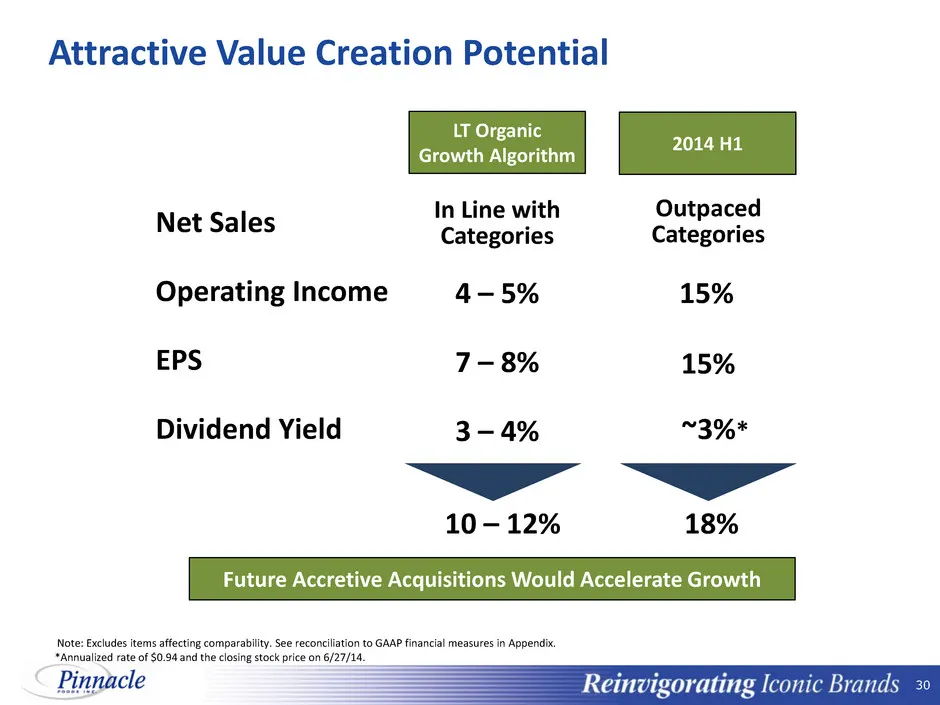
30 30 Attractive Value Creation Potential Net Sales Operating Income EPS Dividend Yield In Line with Categories 10 – 12% 4 – 5% 7 – 8% 3 – 4% LT Organic Growth Algorithm 18% 15% 2014 H1 Outpaced Categories ~3%* Future Accretive Acquisitions Would Accelerate Growth Note: Excludes items affecting comp
Slide 31: First Half 2014 Financial Results
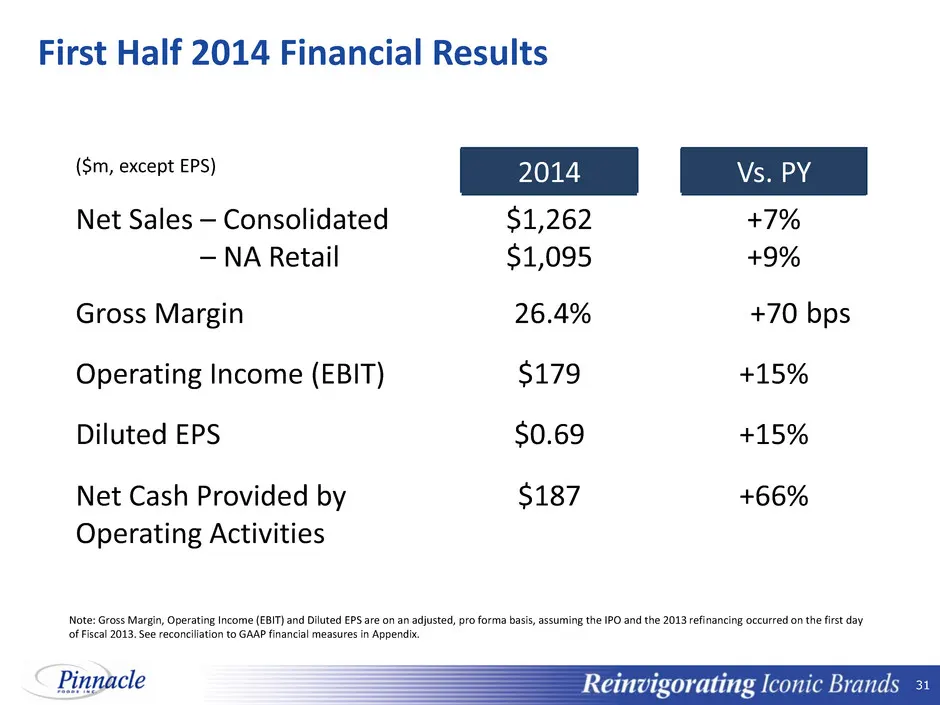
31 31 First Half 2014 Financial Results ($m, except EPS) 2014 Vs. PY Net Sales – Consolidated Net Sales – NA Retail $1,262 $1,095 +7% +9% Gross Margin 26.4% +70 Operating Income (EBIT) $179 +15% Diluted EPS $0.69 +15% Net Cash Provided by Operating Activities $187 +66% bps Note: Gross Margin, Operat
Slide 32: Merger Termination Fee and Debt Reduction
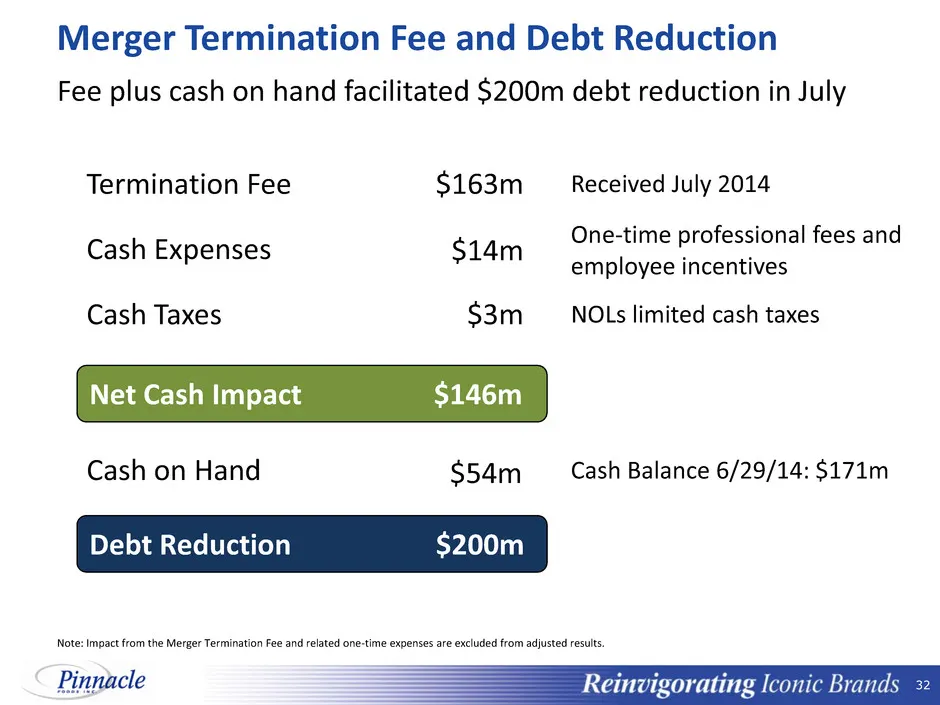
32 32 Merger Termination Fee and Debt Reduction Note: Impact from the Merger Termination Fee and related one-time expenses are excluded from adjusted results. One-time professional fees and employee incentives Received July 2014 NOLs limited cash taxes $163m $3m $14m Fee plus cash on hand facilitate
Slide 33: Debt Reduction
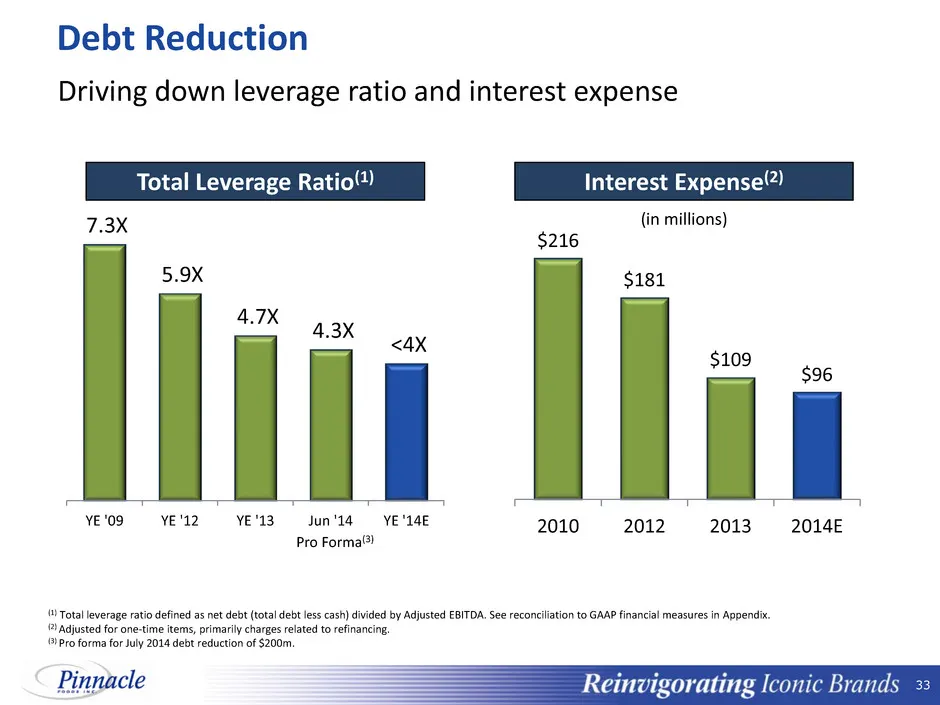
33 33 Debt Reduction 7.3X 5.9X 4.7X 4.3X <4X YE '09 YE '12 YE '13 Jun '14 YE '14E (1) Total leverage ratio defined as net debt (total debt less cash) divided by Adjusted EBITDA. See reconciliation to GAAP financial measures in Appendix. (2) Adjusted for one-time items, primarily charges related to r
Slide 34: Superior Free Cash Flow Generation
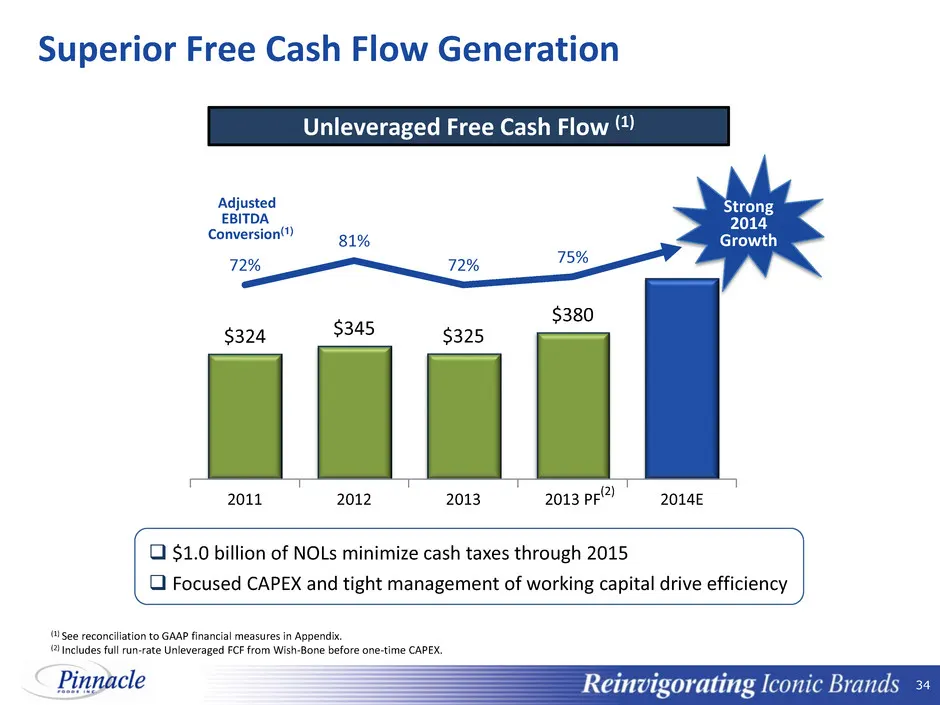
34 34 $324 $345 $325 $380 72% 81% 72% 75% 0% 25% 50% 75% 100% $0 $100 $200 $300 $400 $500 $600 $700 2011 2012 2013 2013 PF 2014E (1) See reconciliation to GAAP financial measures in Appendix. (2) Includes full run-rate Unleveraged FCF from Wish-Bone before one-time CAPEX. $1.0 billion of NOLs mini
Slide 35: Industry Leading Free Cash Flow Yield
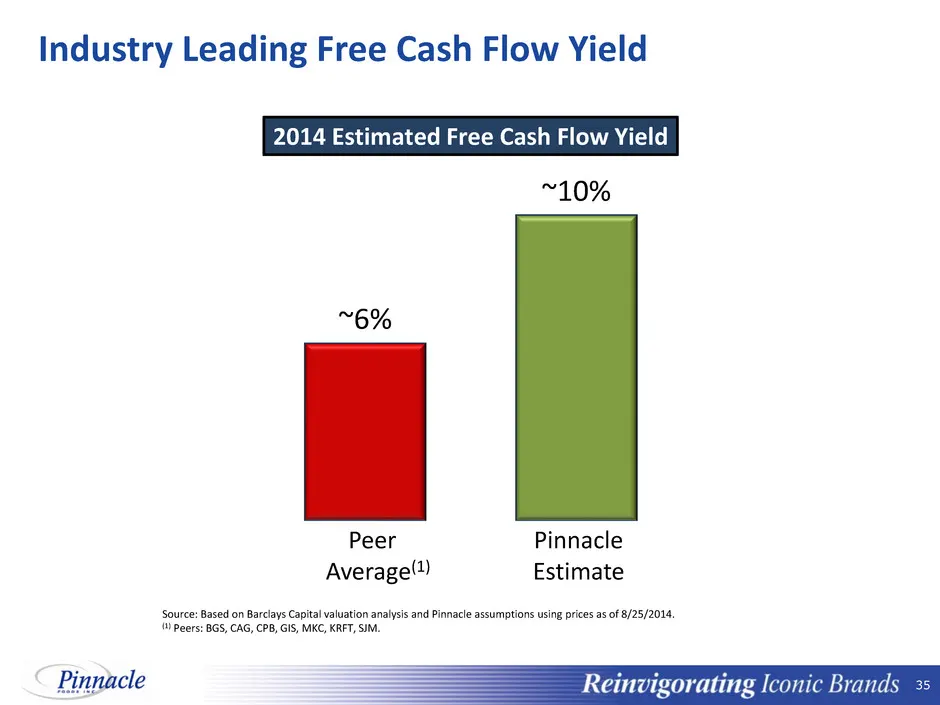
35 35 Industry Leading Free Cash Flow Yield 2014 Estimated Free Cash Flow Yield Source: Based on Barclays Capital valuation analysis and Pinnacle assumptions using prices as of 8/25/2014. (1) Peers: BGS, CAG, CPB, GIS, MKC, KRFT, SJM. ~6% ~10% Peer Average(1) Pinnacle Estimate
Slide 36: Cash Flow Enabled by NOLs and Other Tax Benefits
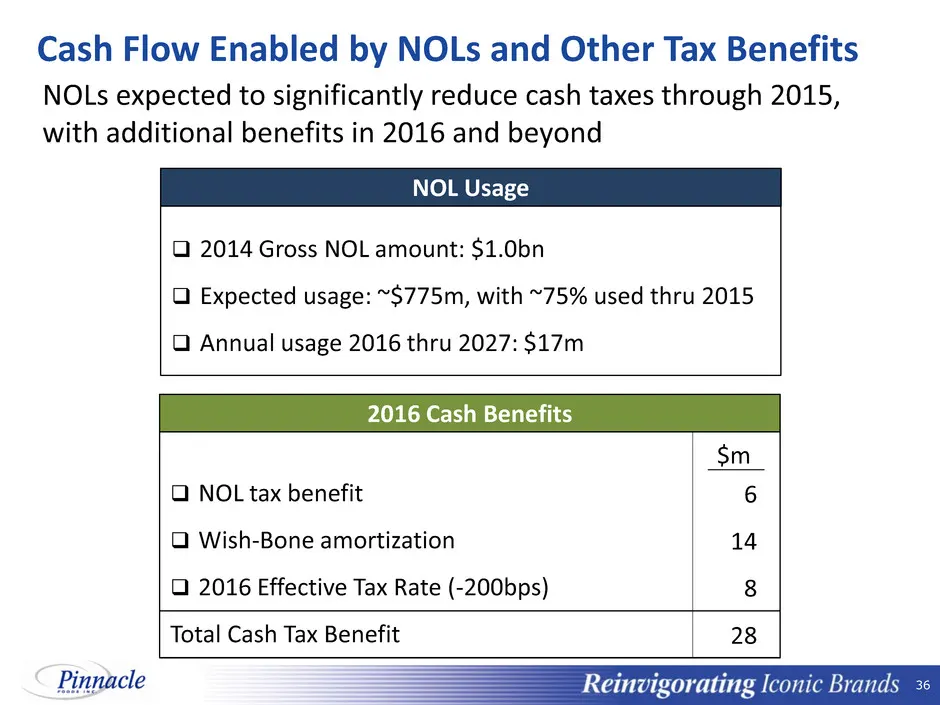
36 36 Cash Flow Enabled by NOLs and Other Tax Benefits NOLs expected to significantly reduce cash taxes through 2015, with additional benefits in 2016 and beyond 2016 Cash Benefits NOL Usage 2014 Gross NOL amount: $1.0bn Expected usage: ~$775m, with ~75% used thru 2015 Annual usage 2016 thru 2
Slide 37: Cash Flow Enables Value Creation Through Multiple Options
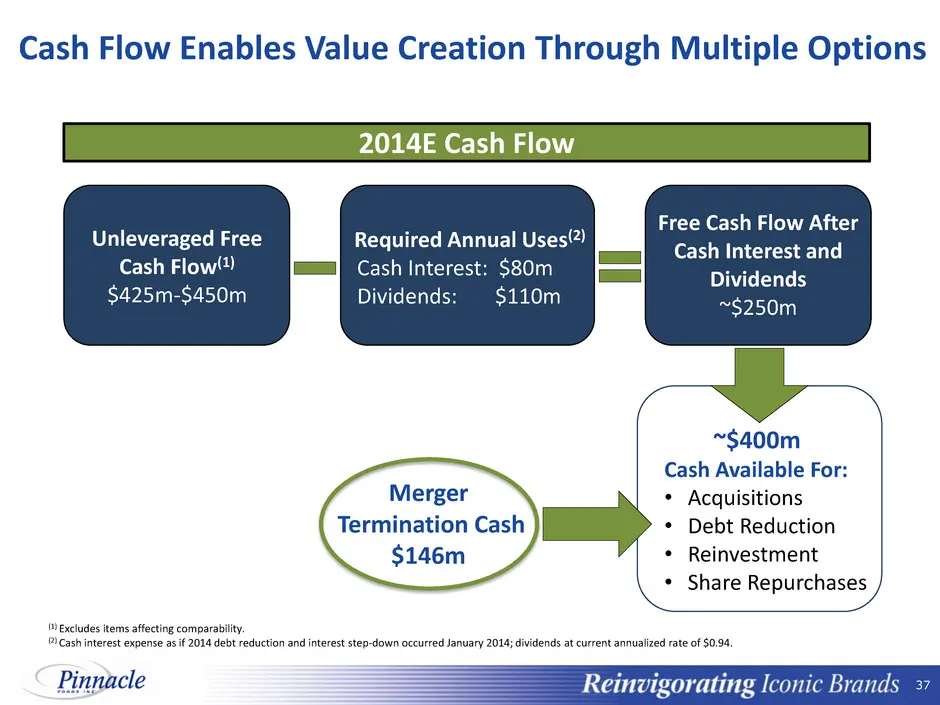
37 37 Cash Flow Enables Value Creation Through Multiple Options (1) Excludes items affecting comparability. (2) Cash interest expense as if 2014 debt reduction and interest step-down occurred January 2014; dividends at current annualized rate of $0.94. Unleveraged Free Cash Flow(1) $425m-$450m Requi
Slide 38: Increased Dividends Twice Since IPO
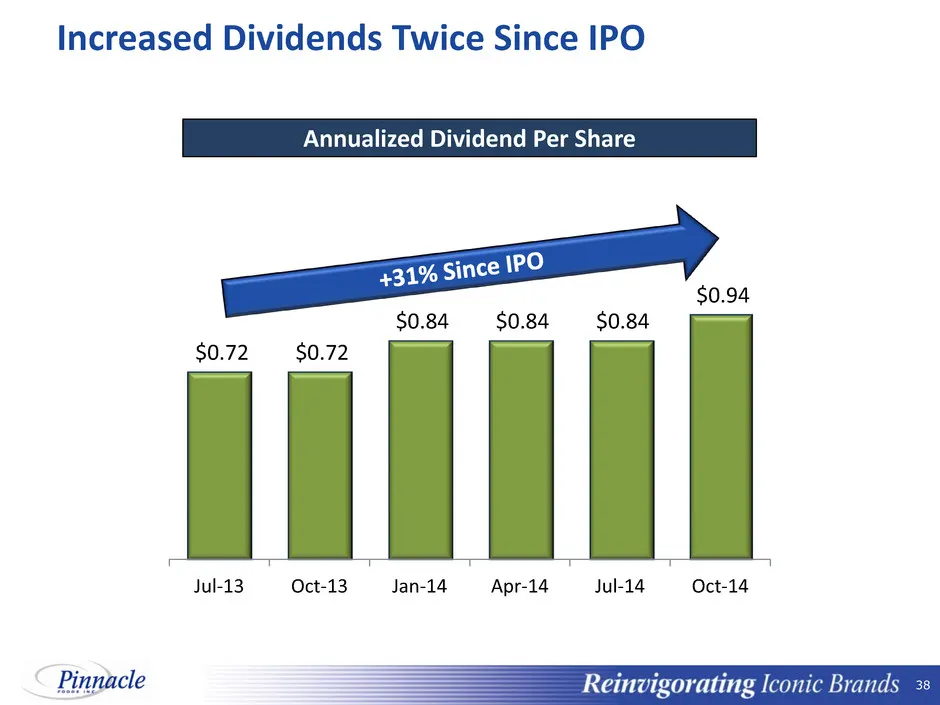
38 38 Increased Dividends Twice Since IPO $0.72 $0.72 $0.84 $0.84 $0.84 $0.94 Jul-13 Oct-13 Jan-14 Apr-14 Jul-14 Oct-14 Annualized Dividend Per Share
Slide 39: 2014 Full Year Outlook
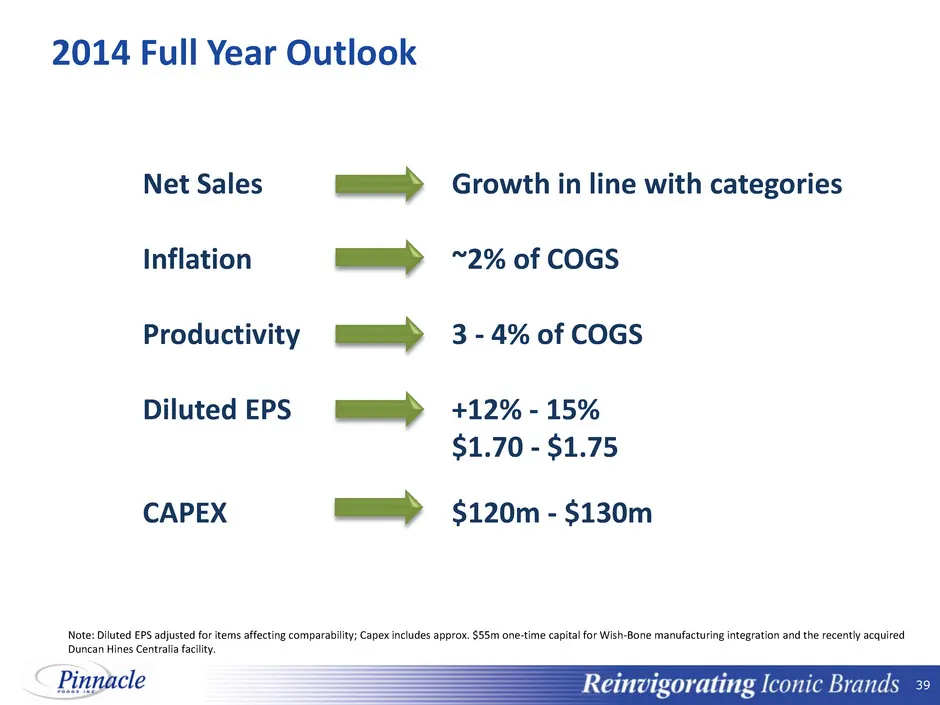
39 39 2014 Full Year Outlook Net Sales Growth in line with categories Inflation ~2% of COGS Productivity 3 - 4% of COGS Diluted EPS +12% - 15% $1.70 - $1.75 CAPEX $120m - $130m Note: Diluted EPS adjusted for items affecting comparability; Capex includes approx. $55m one-time capital for Wish-Bone ma
Slide 40: Agenda
40 40 Agenda Overview Meeting the Industry Challenges Expanding Margins to Drive Value Financial Review Summary
Slide 41: Attractive Value Creation Potential
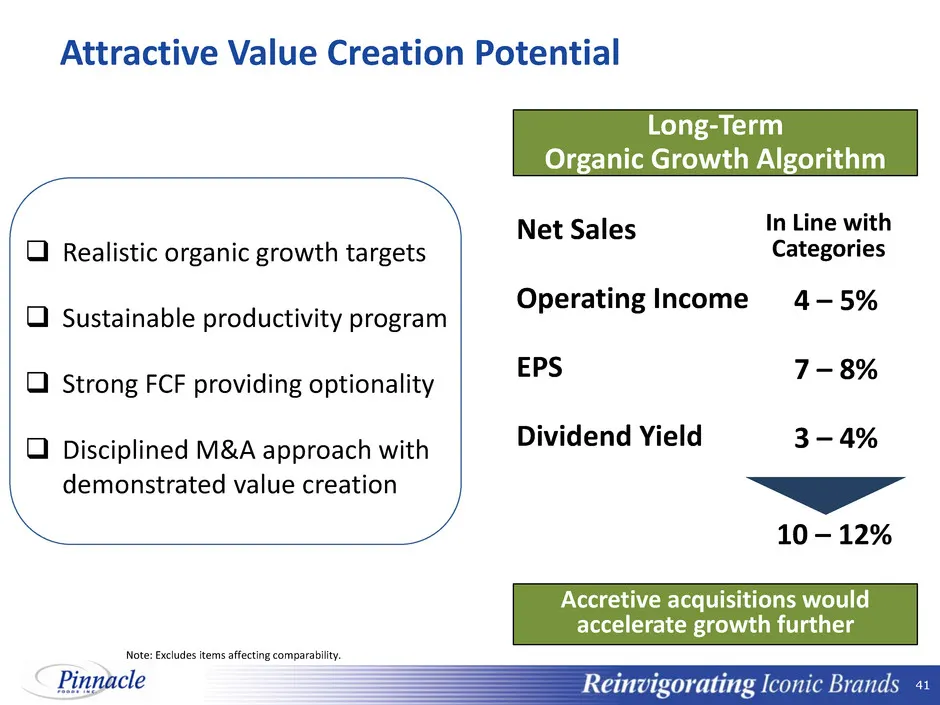
41 41 Attractive Value Creation Potential Long-Term Organic Growth Algorithm Net Sales Operating Income EPS Dividend Yield Note: Excludes items affecting comparability. In Line with Categories 10 – 12% 4 – 5% 7 – 8% 3 – 4% Accretive acquisitions would accelerate growth further Realistic organic gr
Slide 42: Appendix
42 42 PINNACLE FOODS INC. Appendix
Slide 43: Reconciliation to GAAP Financial Measures
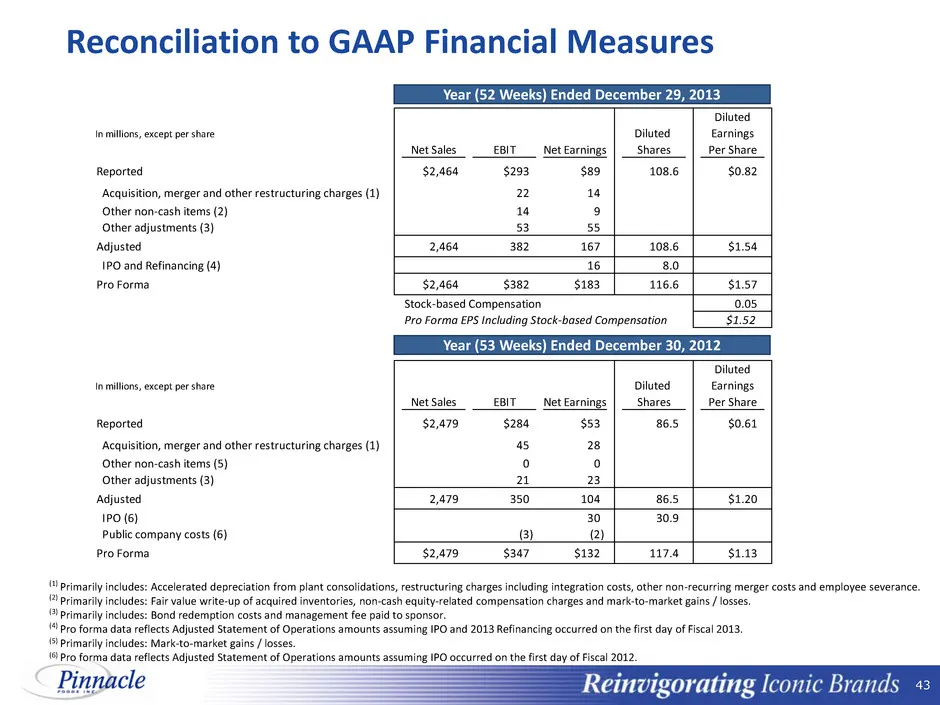
43 43 Reconciliation to GAAP Financial Measures (1) Primarily includes: Accelerated depreciation from plant consolidations, restructuring charges including integration costs, other non-recurring merger costs and employee severance. (2) Primarily includes: Fair value write-up of acquired inventories,
Slide 44: Reconciliation to GAAP Financial Measures
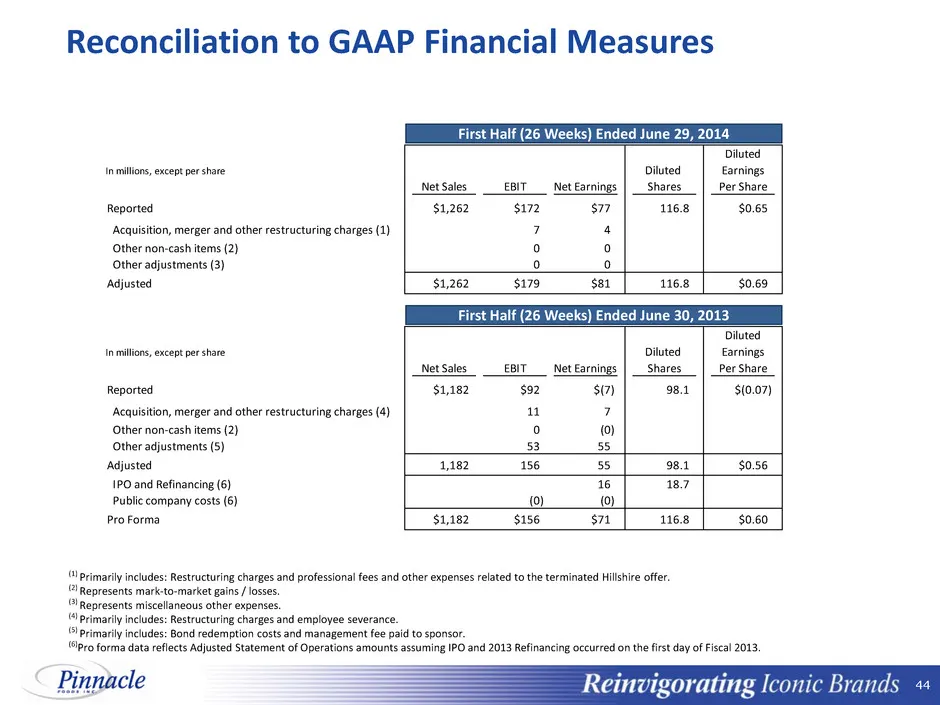
44 44 Reconciliation to GAAP Financial Measures (1) Primarily includes: Restructuring charges and professional fees and other expenses related to the terminated Hillshire offer. (2) Represents mark-to-market gains / losses. (3) Represents miscellaneous other expenses. (4) Primarily includes: Restruc
Slide 45: Reconciliation to GAAP Financial Measures
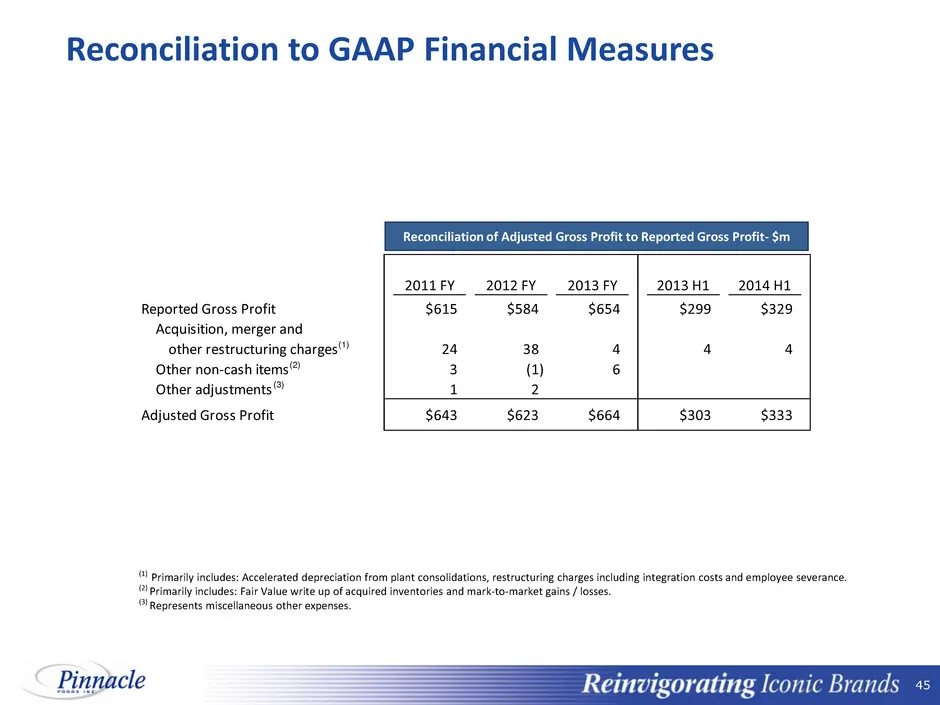
45 45 Reconciliation to GAAP Financial Measures (1) Primarily includes: Accelerated depreciation from plant consolidations, restructuring charges including integration costs and employee severance. (2) Primarily includes: Fair Value write up of acquired inventories and mark-to-market gains / losses.
Slide 46: Reconciliation to GAAP Financial Measures
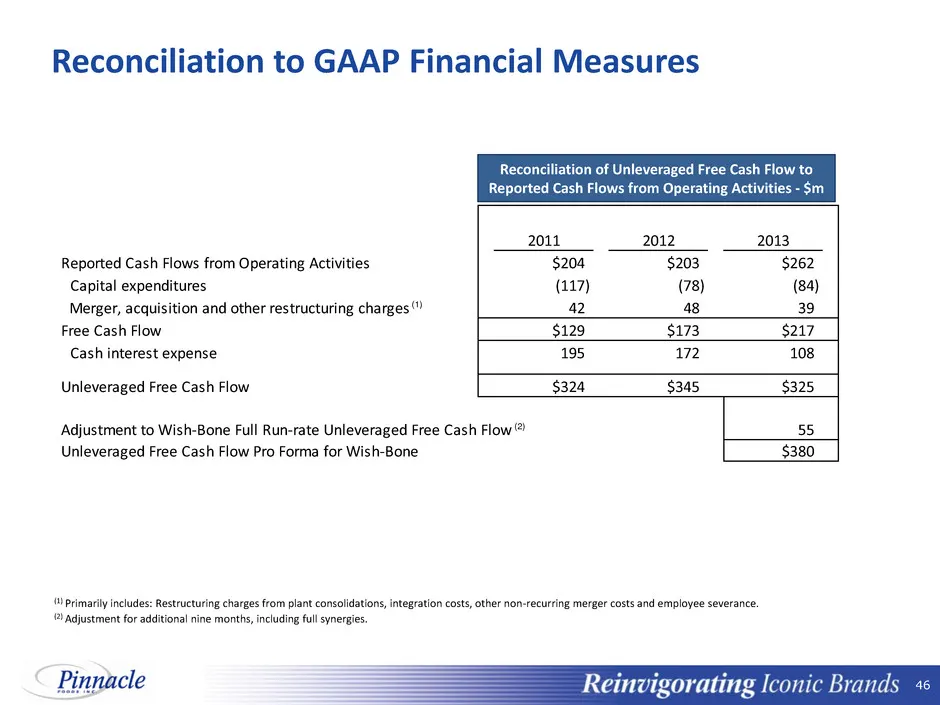
46 46 Reconciliation to GAAP Financial Measures (1) Primarily includes: Restructuring charges from plant consolidations, integration costs, other non-recurring merger costs and employee severance. (2) Adjustment for additional nine months, including full synergies. 2011 2012 2013 Reported Cash Flows
Slide 47: Reconciliation to GAAP Financial Measures
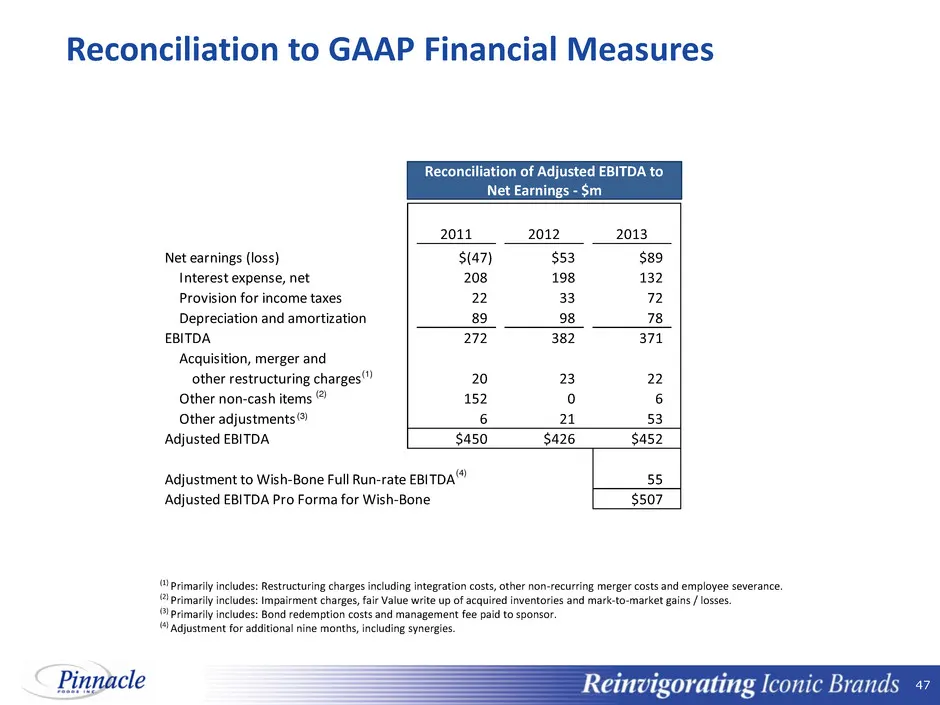
47 47 Reconciliation to GAAP Financial Measures (1) Primarily includes: Restructuring charges including integration costs, other non-recurring merger costs and employee severance. (2) Primarily includes: Impairment charges, fair Value write up of acquired inventories and mark-to-market gains / losse
Source: SEC EDGAR · 8-K filed Sep 4, 2014
More decks from Pinnacle Foods Inc
 Q1 FY2019 Earnings Presentation44 slides · Sep 27, 2018
 Q4 FY2018 Earnings Presentation59 slides · Jun 27, 2018
 Barclays Global Consumer Staples Conference 201767 slides · Sep 6, 2017
 Debt Investor Presentation (January 2017)55 slides · Jan 23, 2017
 Investor Day (December 2016)55 slides · Dec 15, 2016
 Barclays Global Consumer Staples Conference 201651 slides · Sep 6, 2016