Pinnacle Foods — Barclays Global Consumer Staples Conference 2016
51 slides from Pinnacle Foods's conference presentation, Sep 6, 2016
Slide 1: Barclay's Global Consumer Staples Conference - Amplify the Playbook
Barclay’s Global Consumer Staples Conference September 6, 2016 Pinnacle Foods AMPLIFY THE PLAYBOOK
Slide 2: Forward-looking statements and non-GAAP measures
This presentation contains “forward-looking statements” within the meaning of U.S. federal securities laws. Forward-looking statements are not historical facts, and are based upon management’s current expectations, beliefs, projections and targets, many of which, by their nature, are inherently unce
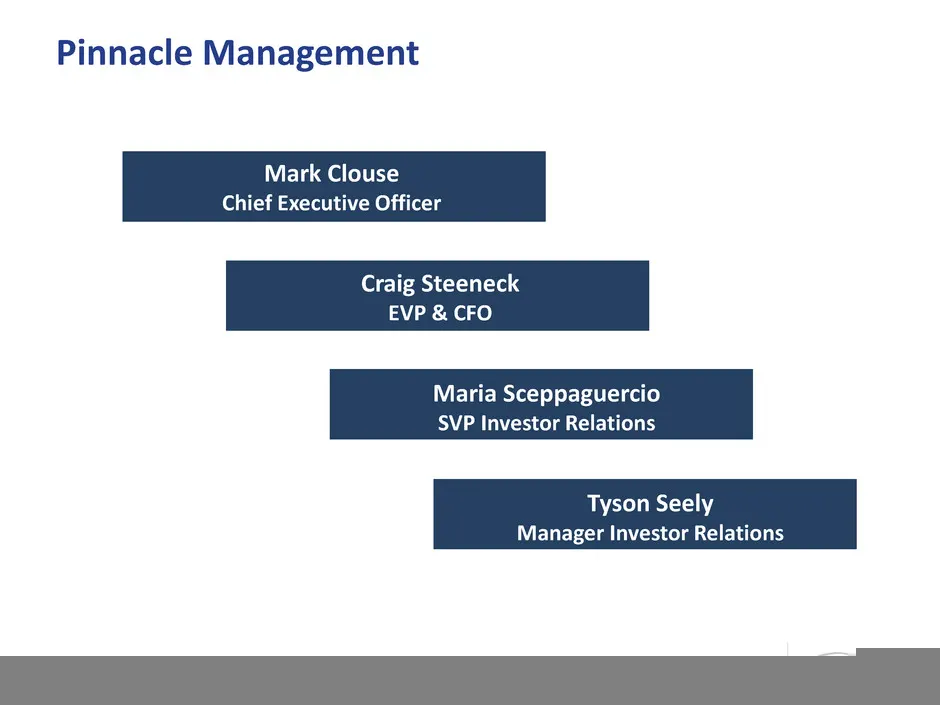
Slide 3: Pinnacle Management
Mark Clouse Chief Executive Officer Craig Steeneck EVP & CFO Maria Sceppaguercio SVP Investor Relations Pinnacle Management Tyson Seely Manager Investor Relations
Slide 4: Agenda: Who We Are
Who We Are • Overview • Pinnacle Playbook • Financial Performance Where We’re Going • Amplify the Playbook Agenda 4
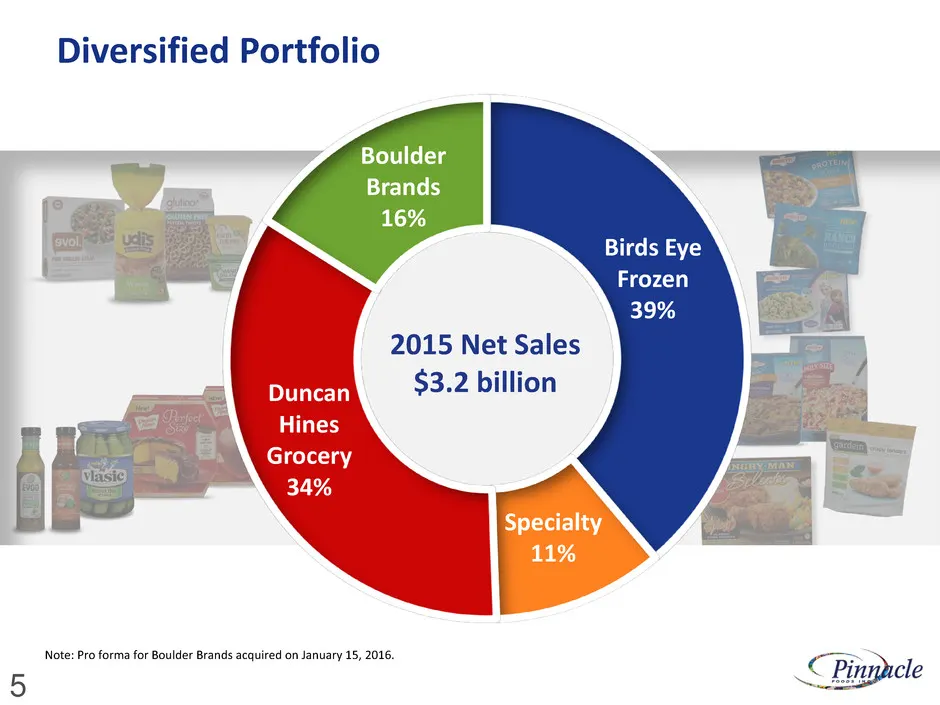
Slide 5: Diversified Portfolio
Note: Pro forma for Boulder Brands acquired on January 15, 2016. Birds Eye Frozen 39% Specialty 11% Duncan Hines Grocery 34% Boulder Brands 16% 2015 Net Sales $3.2 billion Diversified Portfolio 5
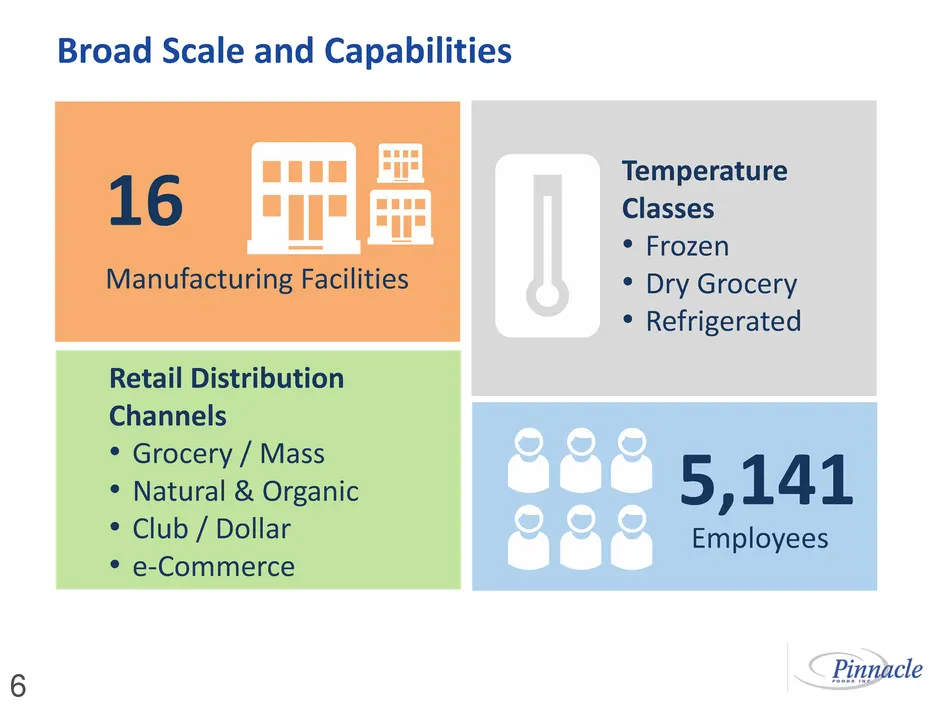
Slide 6: Broad Scale and Capabilities
Retail Distribution Channels • Grocery / Mass • Natural & Organic • Club / Dollar • e-Commerce Manufacturing Facilities 16 Employees 5,141 Broad Scale and Capabilities Temperature Classes • Frozen • Dry Grocery • Refrigerated 6
Slide 7: Agenda: Pinnacle Playbook
Who We Are • Overview • Pinnacle Playbook • Financial Performance Where We’re Going • Amplify the Playbook Agenda 7
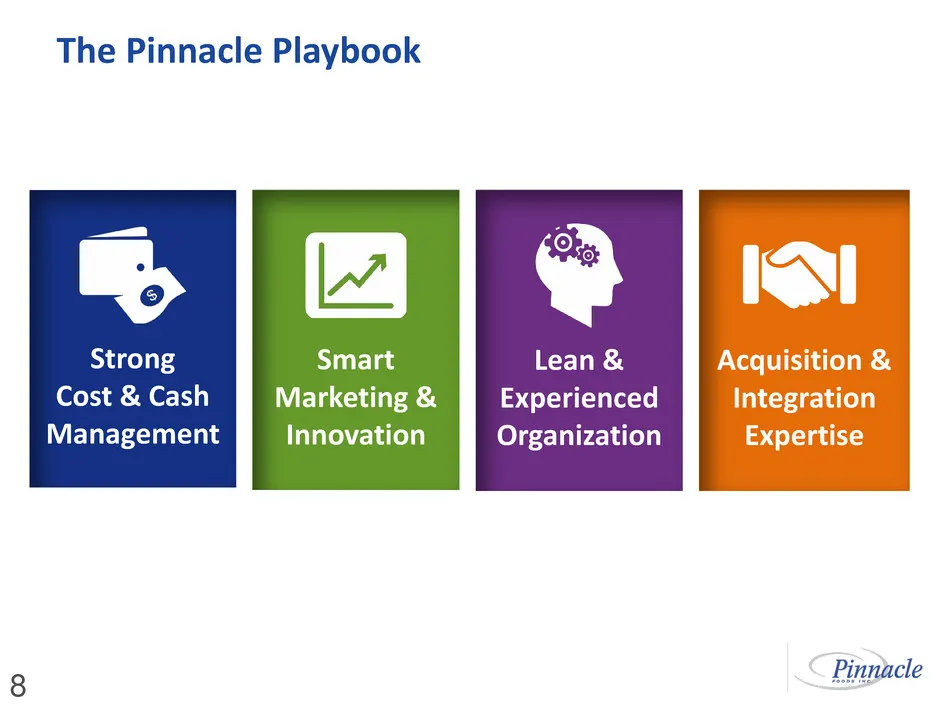
Slide 8: The Pinnacle Playbook
The Pinnacle Playbook 8 Acquisition & Integration Expertise Cost & Cash Management Smart Marketing & Innovation Lean & Capable Organization Strong Cost & Cash Management tio Experienced
Slide 9: Strong Cost Management
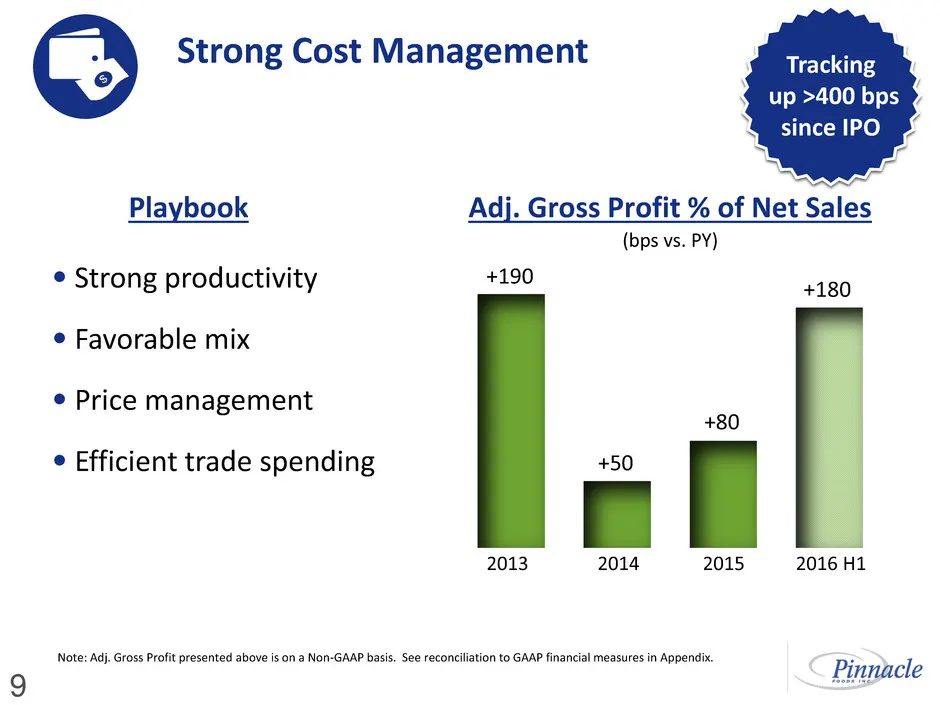
Strong Cost Management 9 Tracking up >400 bps since IPO • Strong productivity • Favorable mix • Price management • Efficient trade spending Playbook Note: Adj. Gross Profit presented above is on a Non-GAAP basis. See reconciliation to GAAP financial measures in Appendix. 2013 2014 2016 H1 2015 (bps
Slide 10: Strong Cash Management
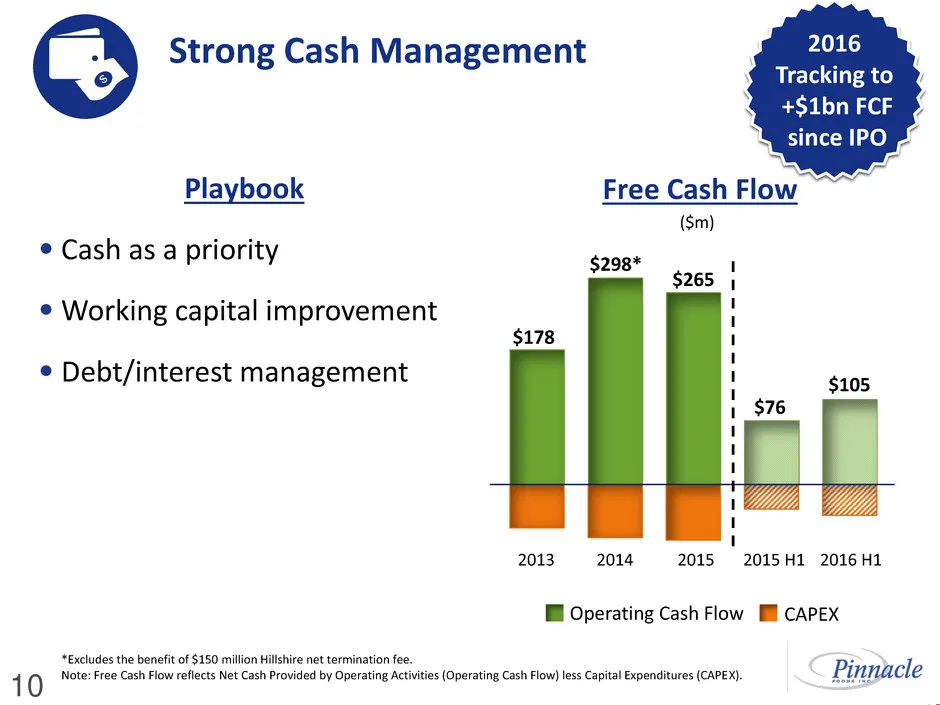
*Excludes the benefit of $150 million Hillshire net termination fee. Note: Free Cash Flow reflects Net Cash Provided by Operating Activities (Operating Cash Flow) less Capital Expenditures (CAPEX). Strong Cash Management 10 2016 Tracking to +$1bn FCF since IPO • Cash as a priority •Working capital i
Slide 11: The Pinnacle Playbook
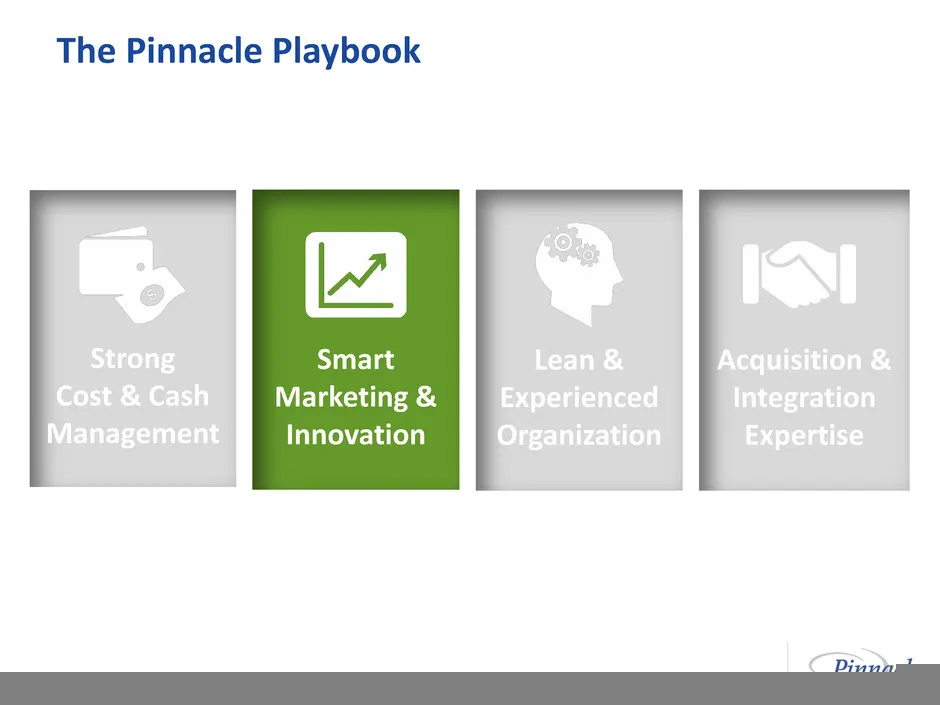
The Pinnacle Playbook 11 Acquisition & Integration Expertise Strong Cost & Cash Management Smart Marketing & Innovation Lean & Experienced Organization
Slide 12: Smart Marketing and Innovation
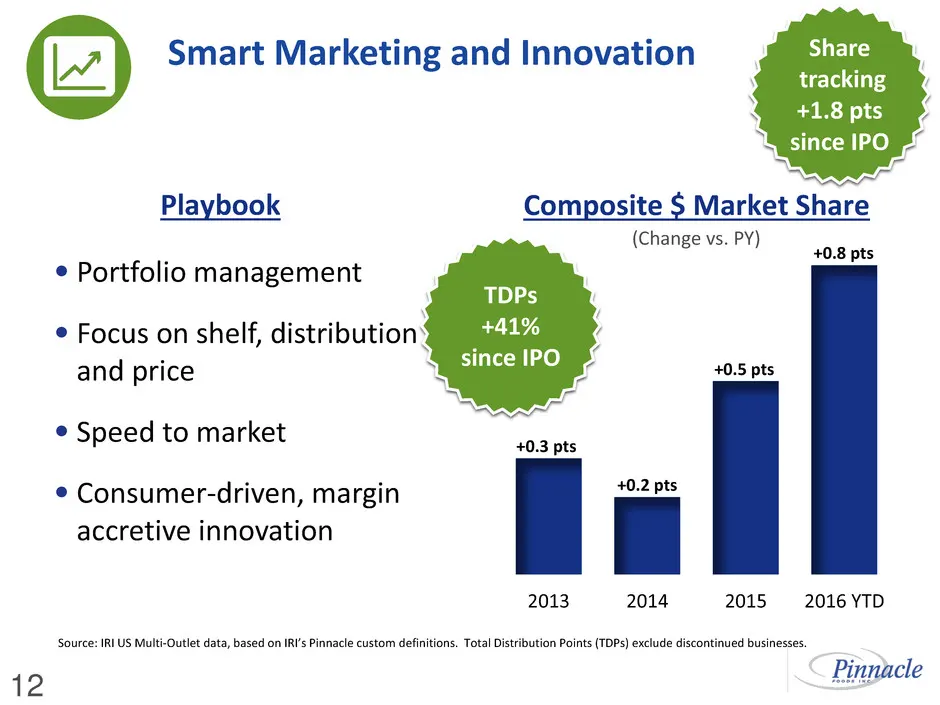
Smart Marketing and Innovation 12 2013 2014 2015 2016 YTD +0.8 pts +0.5 pts +0.2 pts +0.3 pts Composite $ Market Share (Change vs. PY) TDPs +41% since IPO Share tracking +1.8 pts since IPO • Portfolio management • Focus on shelf, distribution and price • Speed to market • Consumer-driven, margin acc
Slide 13: Birds Eye Innovation
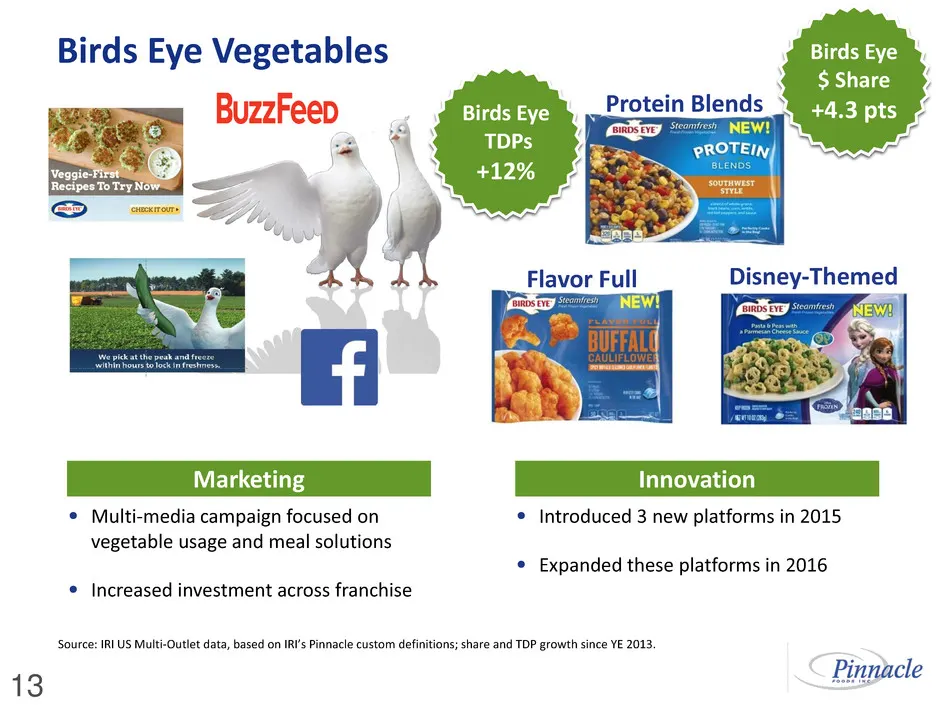
Flavor Full Protein Blends Birds Eye Vegetables Birds Eye TDPs +12% 13 • Introduced 3 new platforms in 2015 • Expanded these platforms in 2016 • Multi-media campaign focused on vegetable usage and meal solutions • Increased investment across franchise Birds Eye $ Share +4.3 pts Disney-Themed Marketi
Slide 14: Birds Eye Multi-Serve Meals and Voila!
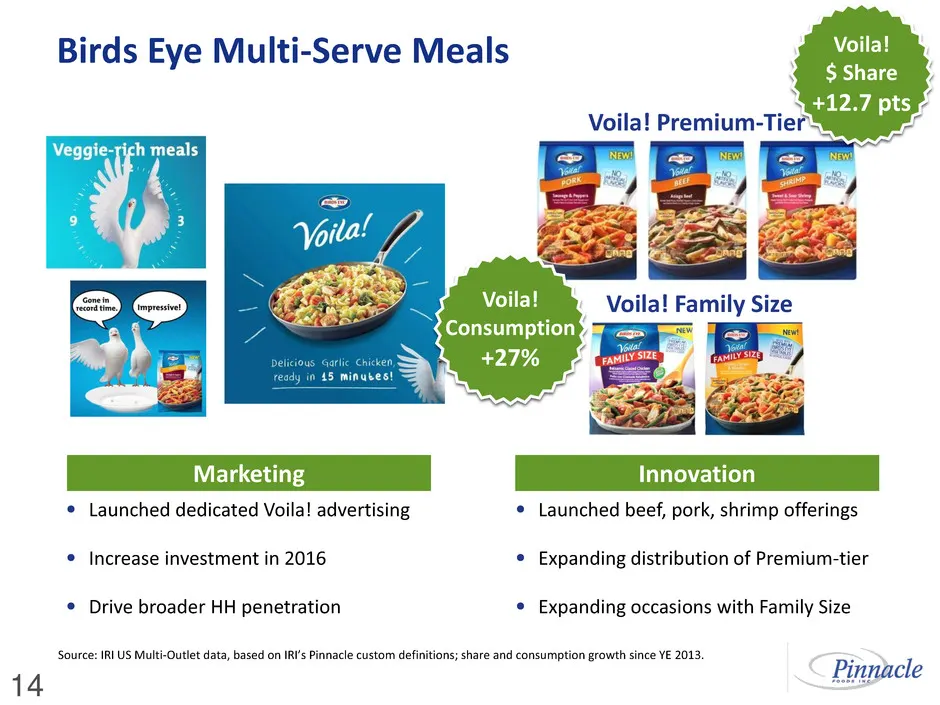
Birds Eye Multi-Serve Meals 14 Voila! Family Size Voila! Premium-Tier Voila! $ Share +12.7 pts • Launched beef, pork, shrimp offerings • Expanding distribution of Premium-tier • Expanding occasions with Family Size • Launched dedicated Voila! advertising • Increase investment in 2016 • Drive broader
Slide 15: Duncan Hines Innovation
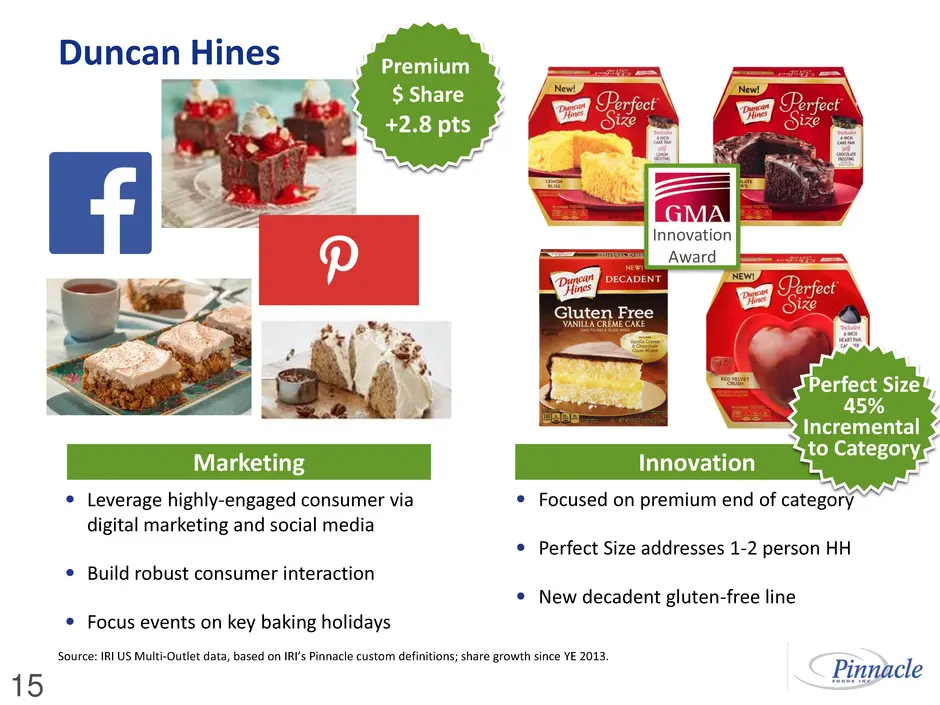
Duncan Hines 15 Innovation Award Source: IRI US Multi-Outlet data, based on IRI’s Pinnacle custom definitions; share growth since YE 2013. Premium $ Share +2.8 pts • Focused on premium end of category • Perfect Size addresses 1-2 person HH • New decadent gluten-free line • Leverage highly-engaged co
Slide 16: Wish-Bone Innovation
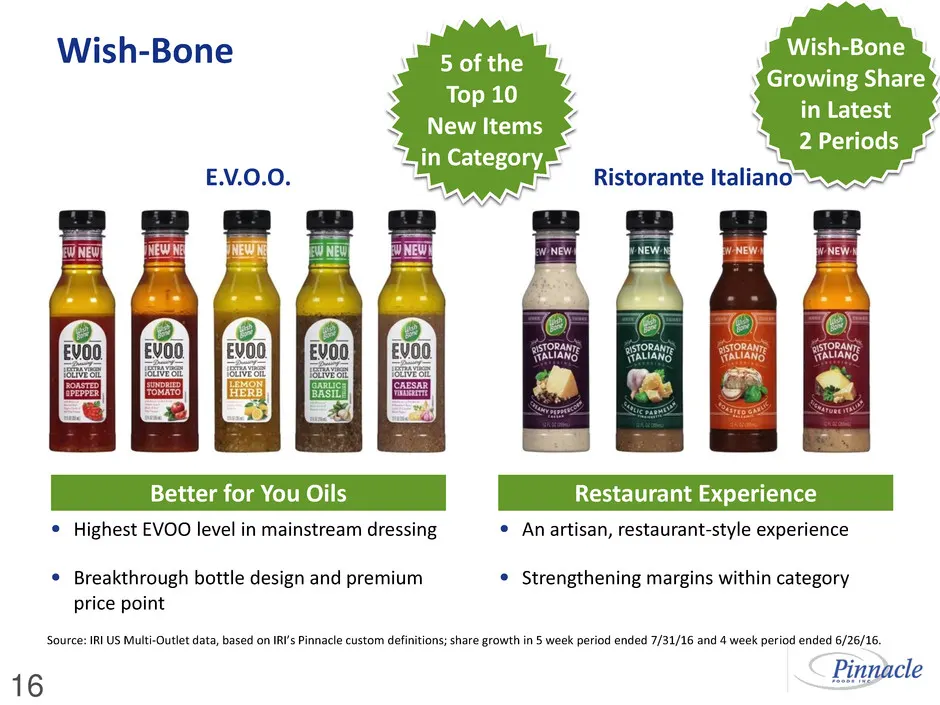
E.V.O.O. Wish-Bone ~75% ACV 5 of the Top 10 New Items in Category 16 Wish-Bone Growing Share in Latest 2 Periods Source: IRI US Multi-Outlet data, based on IRI’s Pinnacle custom definitions; share growth in 5 week period ended 7/31/16 and 4 week period ended 6/26/16. • Highest EVOO level in mainstre
Slide 17: The Pinnacle Playbook
The Pinnacle Playbook 17 Acquisition & Integration Expertise Strong Cost & Cash Management Smart Marketing & Innovation Lean & Experienced Organization
Slide 18: Lean and Experienced Organization
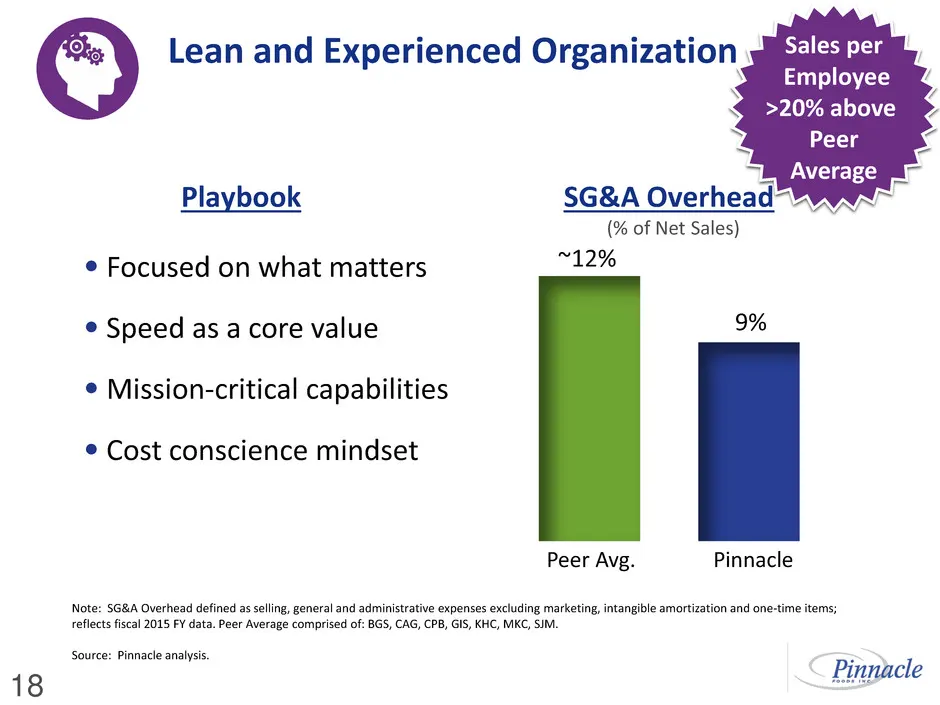
Lean and Experienced Organization 18 Sales per Employee >20% above Peer Average • Focused on what matters • Speed as a core value • Mission-critical capabilities • Cost conscience mindset Playbook Note: SG&A Overhead defined as selling, general and administrative expenses excluding marketing, intang
Slide 19: The Pinnacle Playbook
The Pinnacle Playbook 19 Acquisition & Integration Expertise Strong Cost & Cash Management Smart Marketing & Innovation Lean & Experienced Organization
Slide 20: Acquisition & Integration Expertise
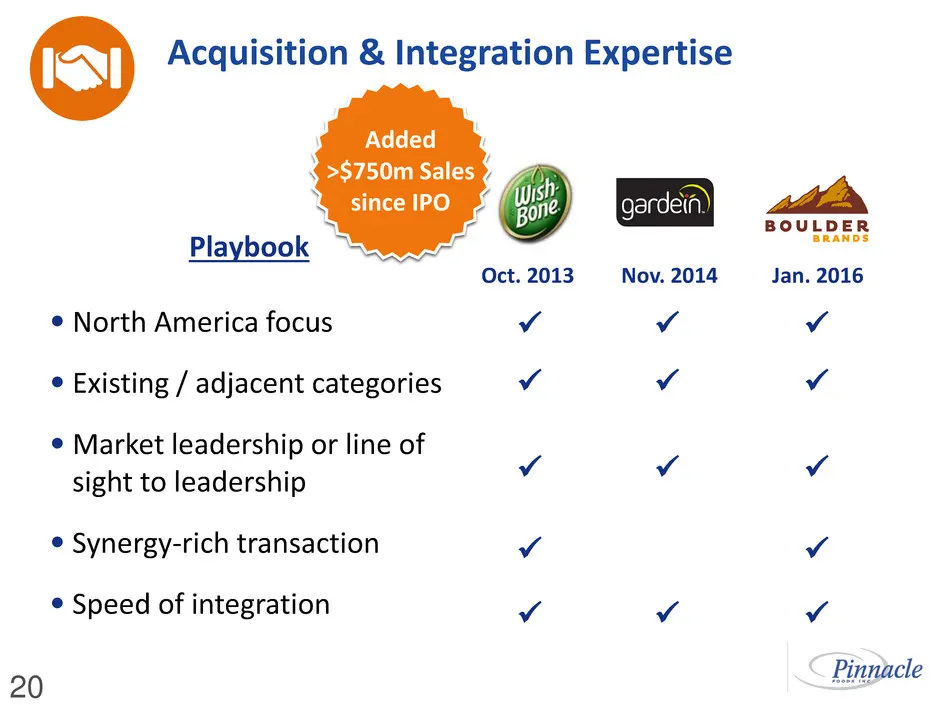
Oct. 2013 Acquisition & Integration Expertise 20 Added >$750m Sales since IPO • North America focus • Existing / adjacent categories • Market leadership or line of sight to leadership • Synergy-rich transaction • Speed of integration Playbook Nov. 2014 Jan. 2016
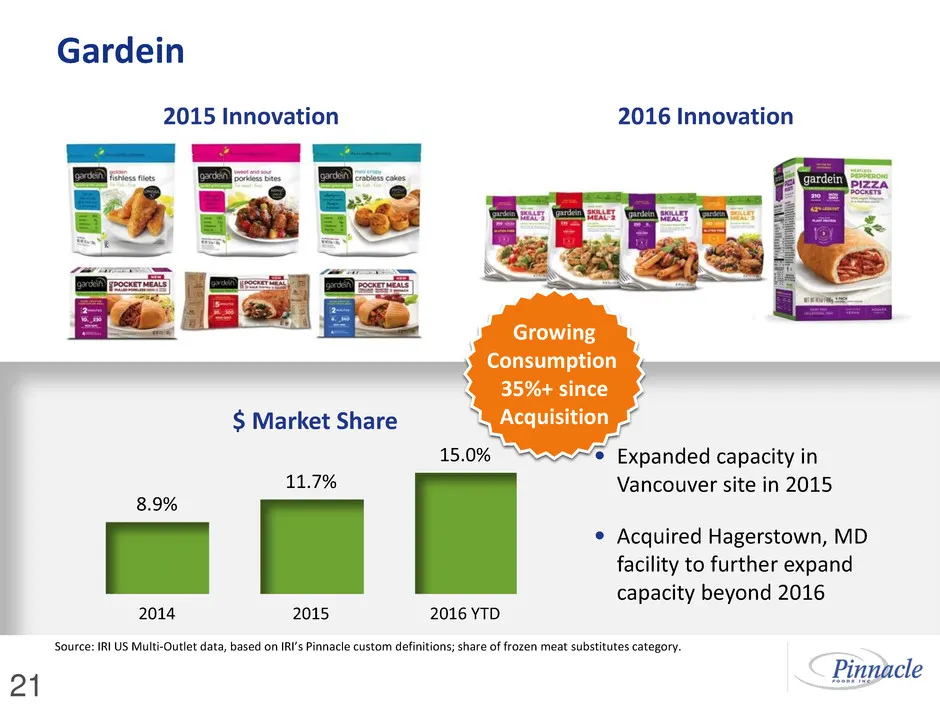
Slide 21: Gardein Growing Consumption
2015 Innovation 2016 Innovation $ Market Share • Expanded capacity in Vancouver site in 2015 • Acquired Hagerstown, MD facility to further expand capacity beyond 2016 8.9% 11.7% 15.0% 2014 2015 2016 YTD Source: IRI US Multi-Outlet data, based on IRI’s Pinnacle custom definitions; share of frozen mea
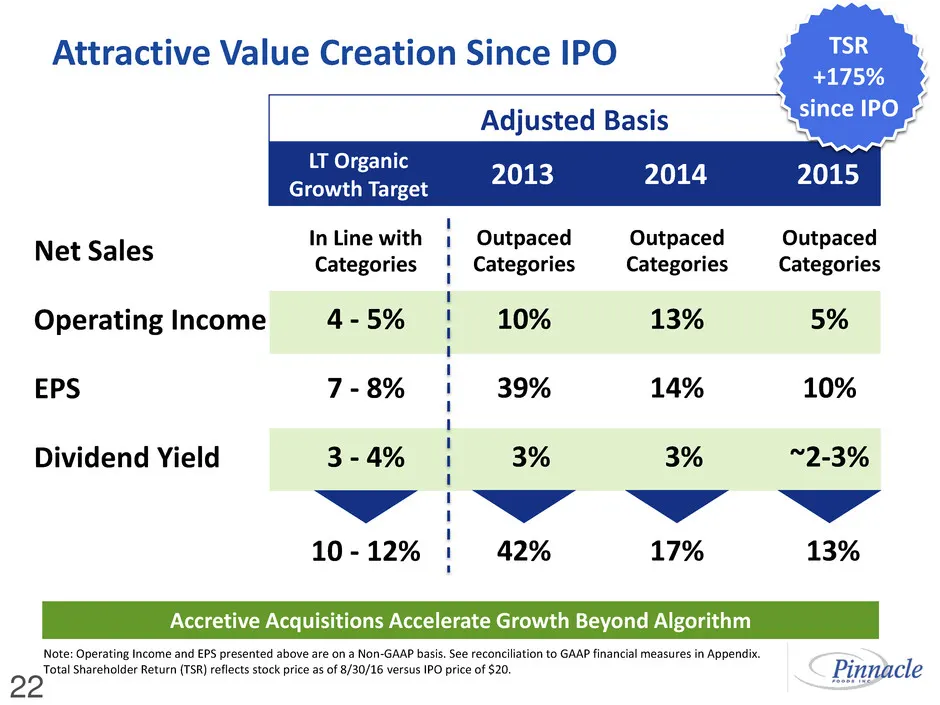
Slide 22: Attractive Value Creation Since IPO
Attractive Value Creation Since IPO 22 Accretive Acquisitions Accelerate Growth Beyond Algorithm Note: Operating Income and EPS presented above are on a Non-GAAP basis. See reconciliation to GAAP financial measures in Appendix. Total Shareholder Return (TSR) reflects stock price as of 8/30/16 versus
Slide 23: Agenda: Financial Performance
Who We Are • Overview • Pinnacle Playbook • Financial Performance Where We’re Going • Amplify the Playbook Agenda 23
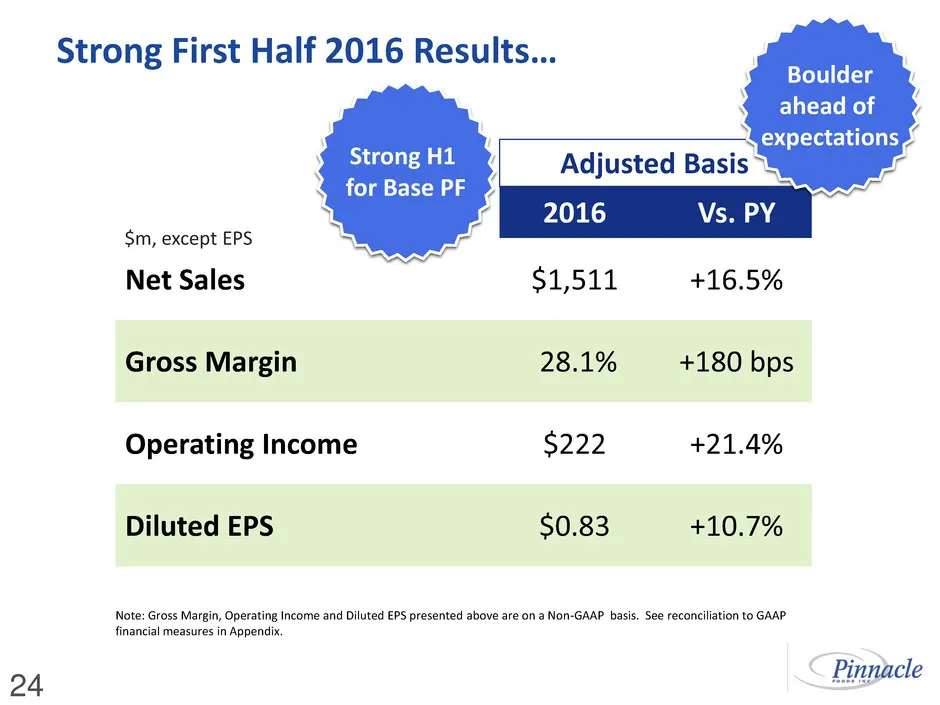
Slide 24: Strong First Half 2016 Results
2016 Vs. PY Net Sales $1,511 +16.5% Gross Margin 28.1% +180 bps Operating Income $222 +21.4% Diluted EPS $0.83 +10.7% Strong First Half 2016 Results… 24 Strong H1 for Base PF $m, except EPS Note: Gross Margin, Operating Income and Diluted EPS presented above are on a Non-GAAP basis. See reconciliati
Slide 25: Improved 2016 Outlook
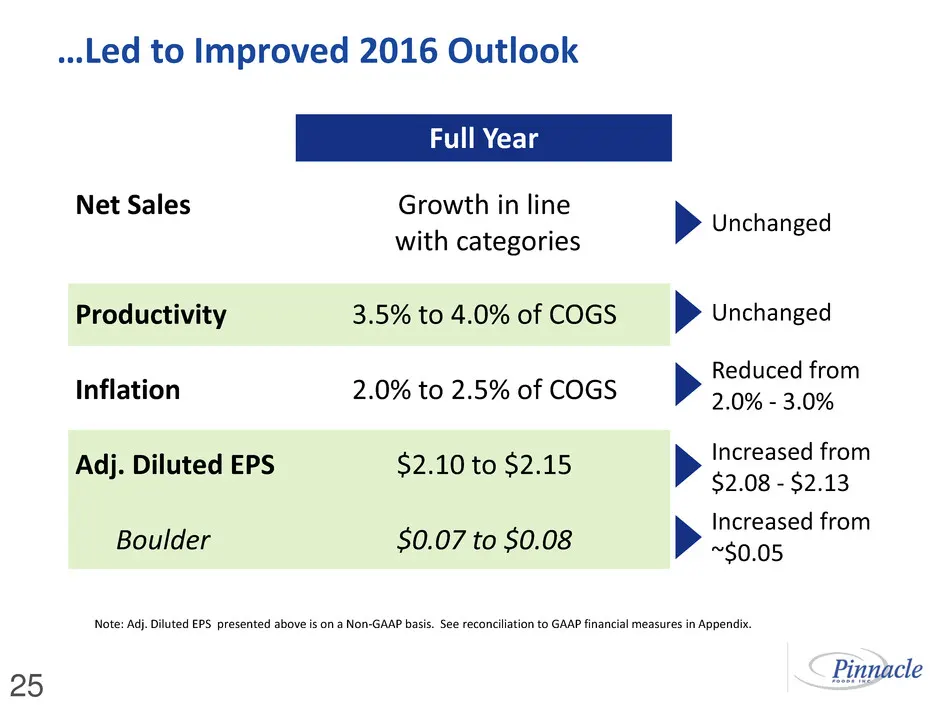
…Led to Improved 2016 Outlook Full Year 25 Reduced from 2.0% - 3.0% Increased from $2.08 - $2.13 Unchanged Unchanged Increased from ~$0.05 Net Sales Growth in line with categories Productivity 3.5% to 4.0% of COGS Inflation 2.0% to 2.5% of COGS Adj. Diluted EPS $2.10 to $2.15 Boulder $0.07 to $0.08
Slide 26: Strong Second Half Programming
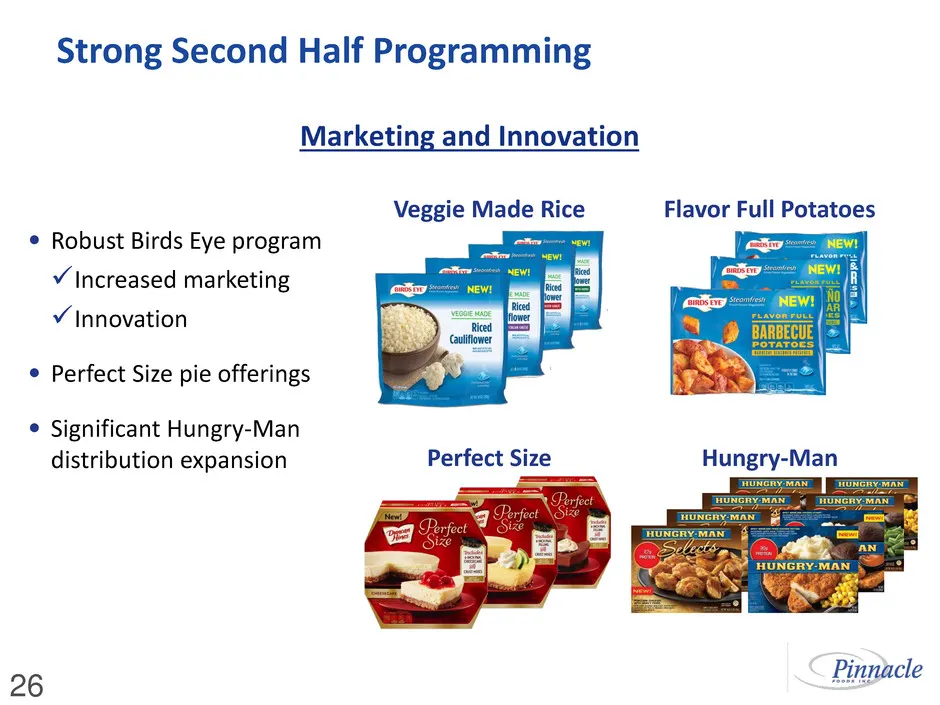
Strong Second Half Programming 26 • Robust Birds Eye program Increased marketing Innovation • Perfect Size pie offerings • Significant Hungry-Man distribution expansion Veggie Made Rice Flavor Full Potatoes Hungry-Man Perfect Size Marketing and Innovation
Slide 27: Sustained Productivity Outpacing Inflation
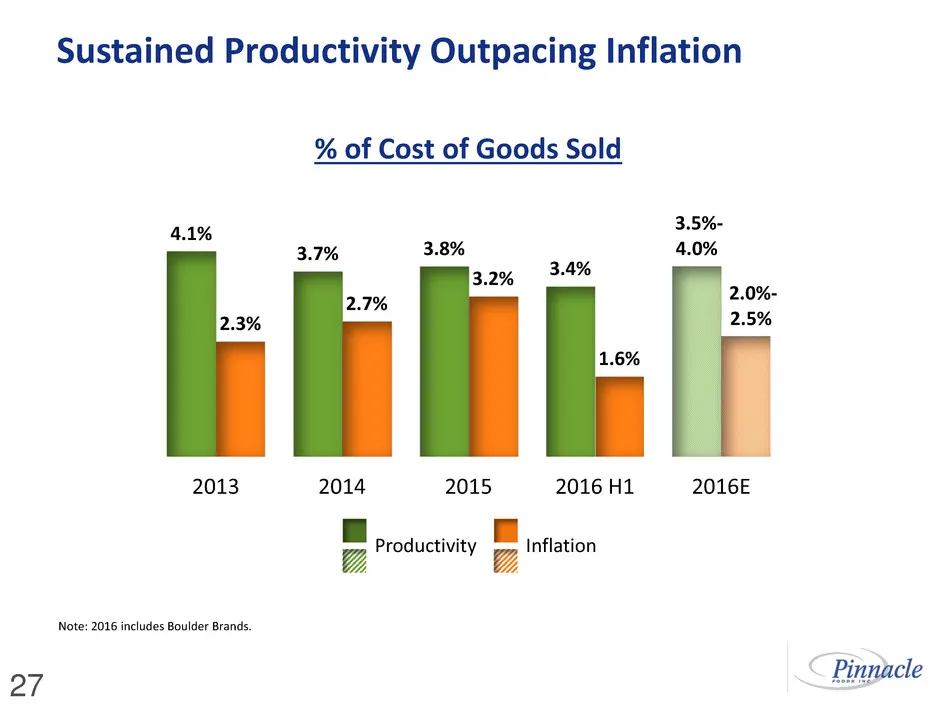
4.1% 3.7% 3.8% 3.4% 3.5%- 4.0% 2.3% 2.7% 3.2% 1.6% 2.0%- 2.5% 2013 2014 2015 2016 H1 2016E Note: 2016 includes Boulder Brands. Inflation Productivity Sustained Productivity Outpacing Inflation 27 % of Cost of Goods Sold
Slide 28: Diversified Input Basket Acts as a Commodity Hedge
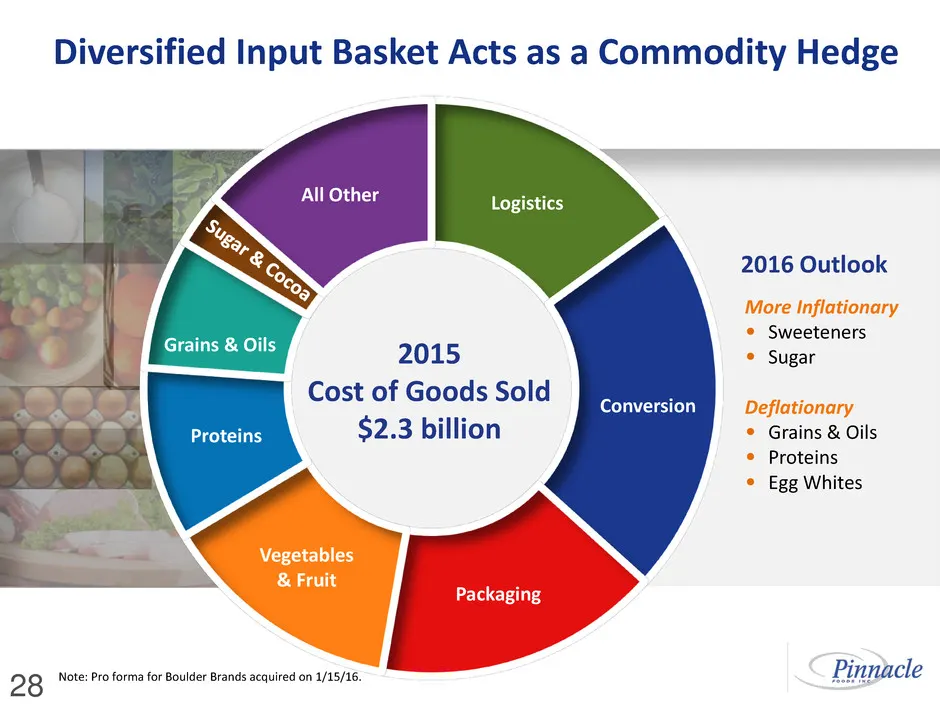
Conversion Logistics Proteins Grains & Oils Packaging Vegetables & Fruit All Other More Inflationary • Sweeteners • Sugar Deflationary • Grains & Oils • Proteins • Egg Whites 2016 Outlook Note: Pro forma for Boulder Brands acquired on 1/15/16. 2015 Cost of Goods Sold $2.3 billion Diversified Input B
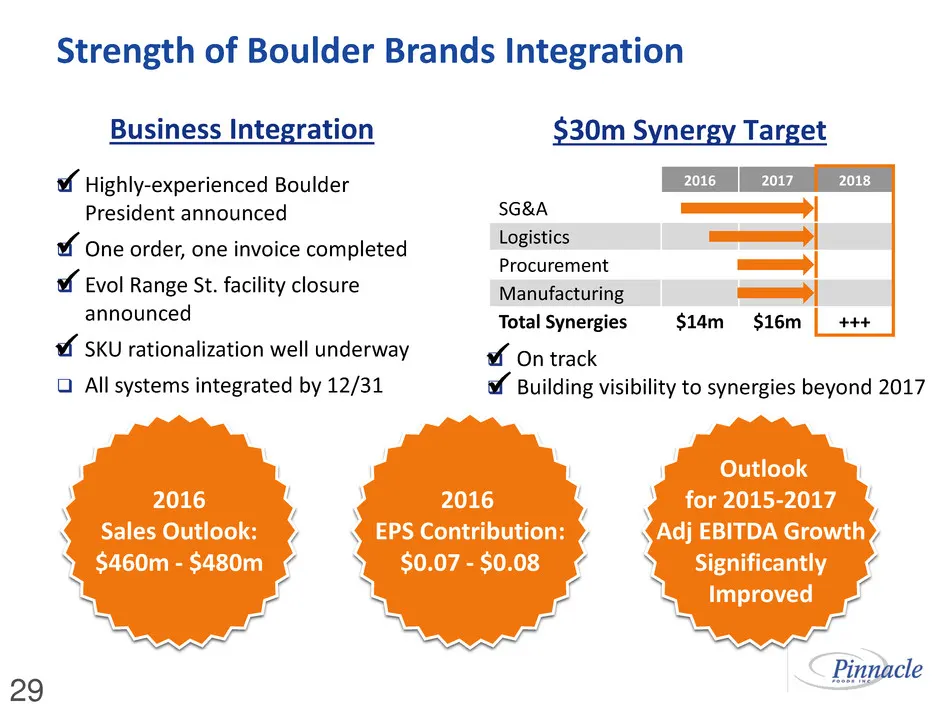
Slide 29: Strength of Boulder Brands Integration
Strength of Boulder Brands Integration 2016 2017 2018 SG&A Logistics Procurement Manufacturing Total Synergies $14m $16m +++ 29 On track Building visibility to synergies beyond 2017 $30m Synergy Target Highly-experienced Boulder President announced One order, one invoice completed Evol Ran
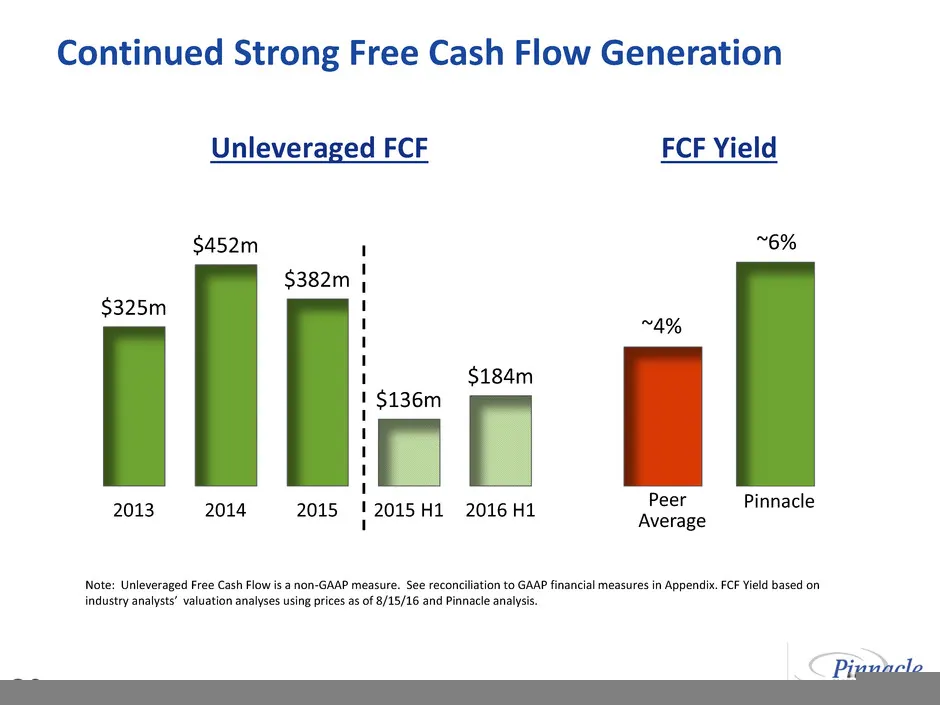
Slide 30: Continued Strong Free Cash Flow Generation
Continued Strong Free Cash Flow Generation 30 $325m $452m $382m $136m $184m 2013 2014 2015 2015 H1 2016 H1 Peer Average Pinnacle Unleveraged FCF FCF Yield Note: Unleveraged Free Cash Flow is a non-GAAP measure. See reconciliation to GAAP financial measures in Appendix. FCF Yield based on industry an
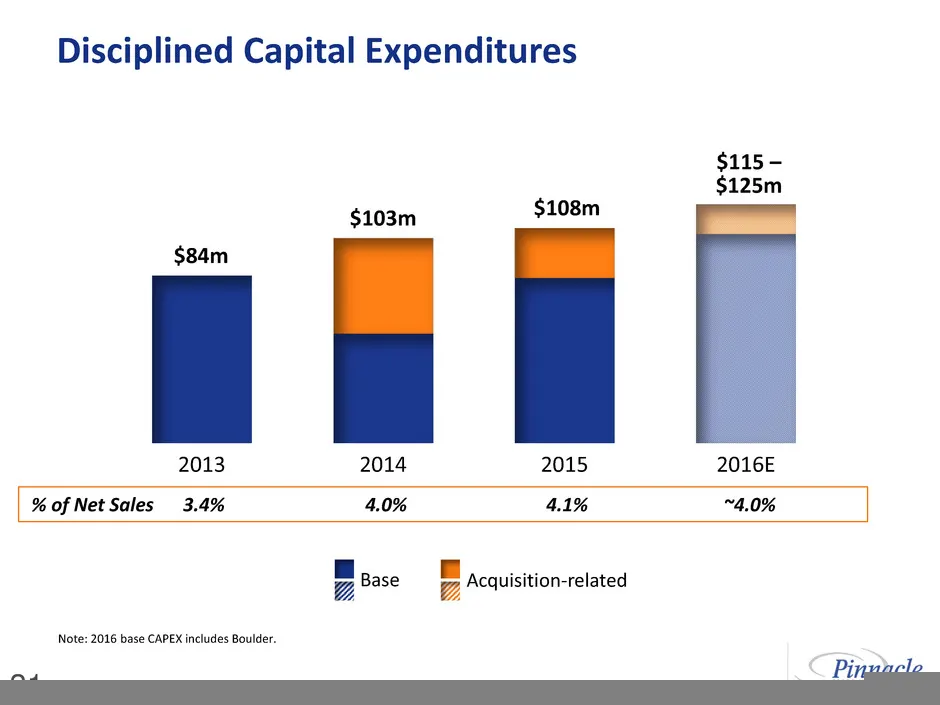
Slide 31: Disciplined Capital Expenditures
2013 2014 2015 2016E $84m $108m $115 – $125m $103m Disciplined Capital Expenditures 31 Base Acquisition-related % of Net Sales 3.4% 4.0% 4.1% ~4.0% Note: 2016 base CAPEX includes Boulder.
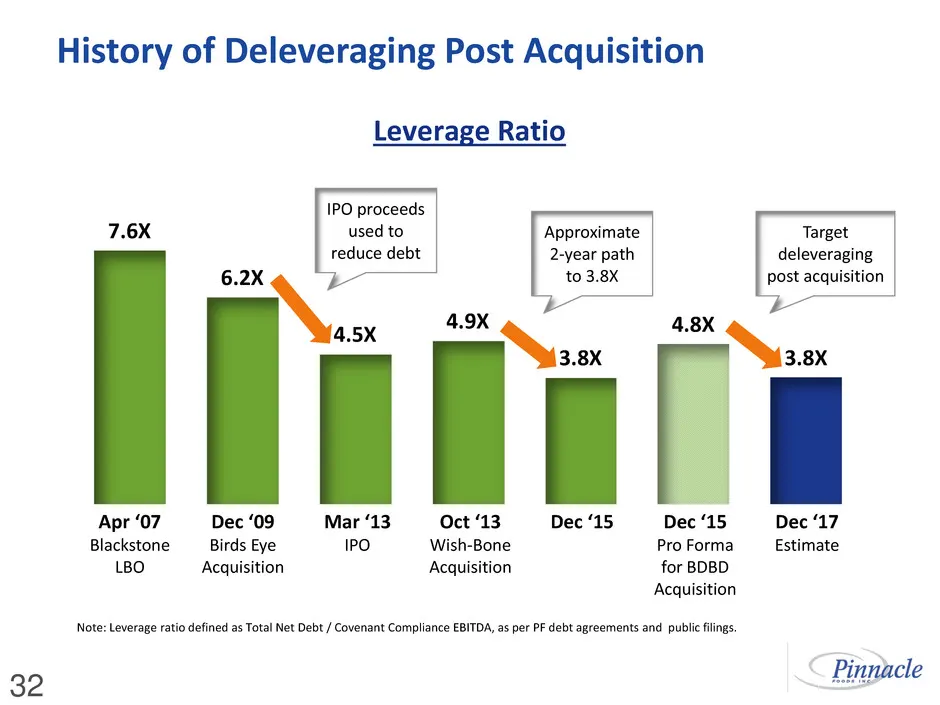
Slide 32: History of Deleveraging Post Acquisition
Note: Leverage ratio defined as Total Net Debt / Covenant Compliance EBITDA, as per PF debt agreements and public filings. 7.6X 6.2X 4.5X 4.9X 3.8X 4.8X 3.8X Apr ‘07 Blackstone LBO Dec ‘09 Birds Eye Acquisition Mar ‘13 IPO Oct ‘13 Wish-Bone Acquisition Dec ‘15 Dec ‘15 Pro Forma for BDBD Acquisition
Slide 33: Agenda: Where We're Going
Who We Are • Overview • Pinnacle Playbook • Financial Performance Where We’re Going • Amplify the Playbook Agenda 33
Slide 34: Amplify the Playbook: Expand Margins & Cash Flow
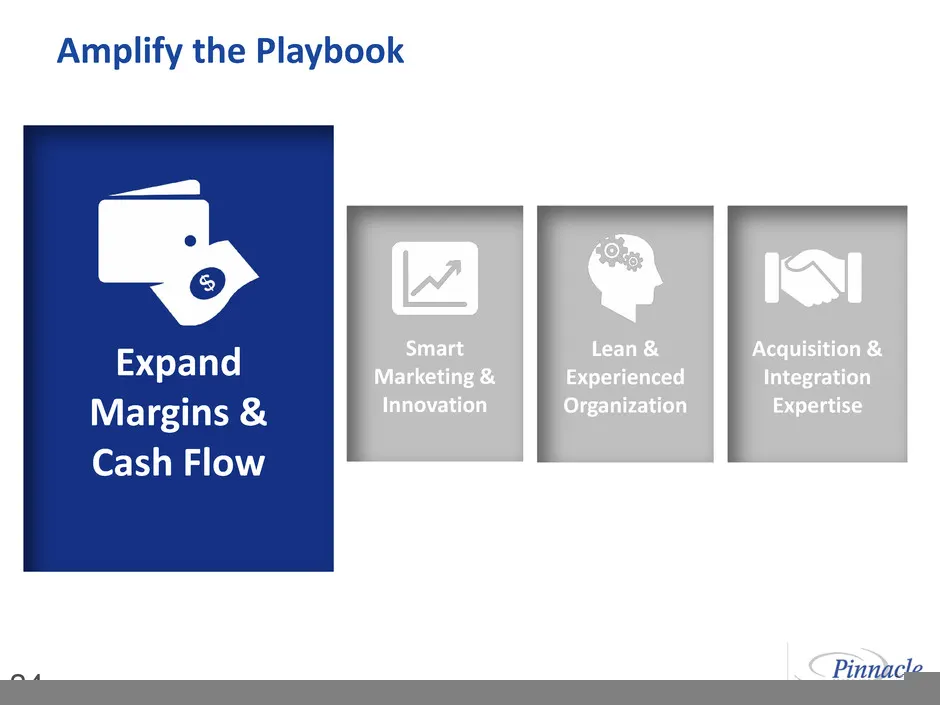
Amplify the Playbook 34 Acquisition & Integration Expertise Strong Cost & Cash Management Smart Marketing & Innovation Lean & Experienced Organization Expand Margins & Cash Flow
Slide 35: Expand Margins
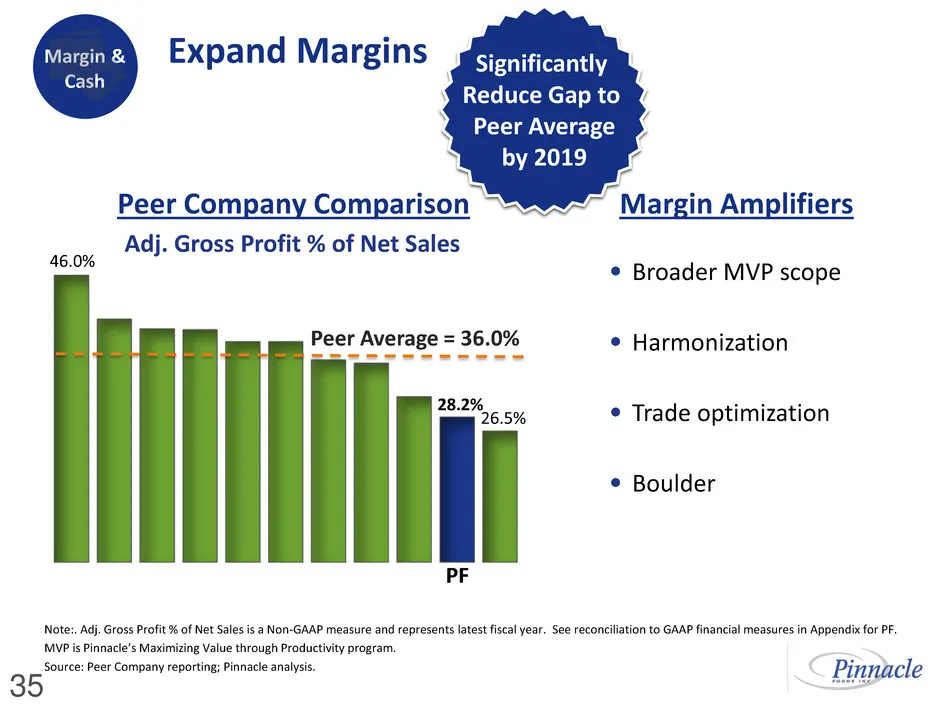
Expand Margins 35 28.2% PF 26.5% Peer Average = 36.0% 46.0% Adj. Gross Profit % of Net Sales Peer Company Comparison Margin & Cash Significantly Reduce Gap to Peer Average by 2019 • Broader MVP scope • Harmonization • Trade optimization • Boulder Margin Amplifiers Note:. Adj. Gross Profit % of Net S
Slide 36: Expand Cash Flow
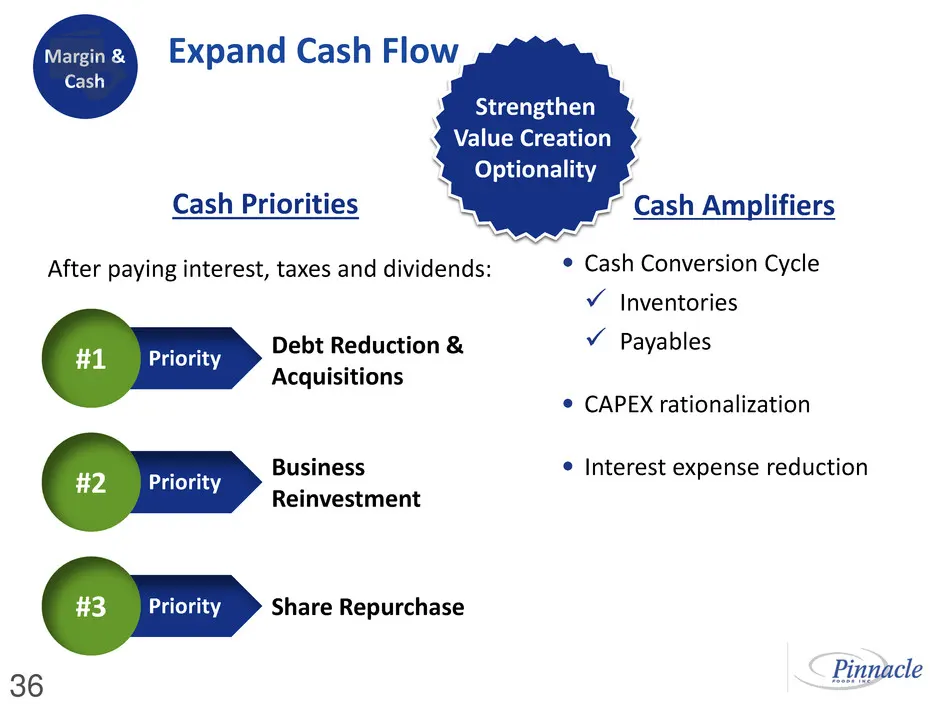
Expand Cash Flow 36 Margin & Cash Strengthen Value Creation Optionality Business Reinvestment #2 Priority Share Repurchase #3 Priority #1 Debt Reduction & Acquisitions Priority After paying interest, taxes and dividends: Cash Priorities Cash Amplifiers • Cash Conversion Cycle Inventories Payable
Slide 37: Amplify the Playbook: Accelerate Profitable Top-Line Growth
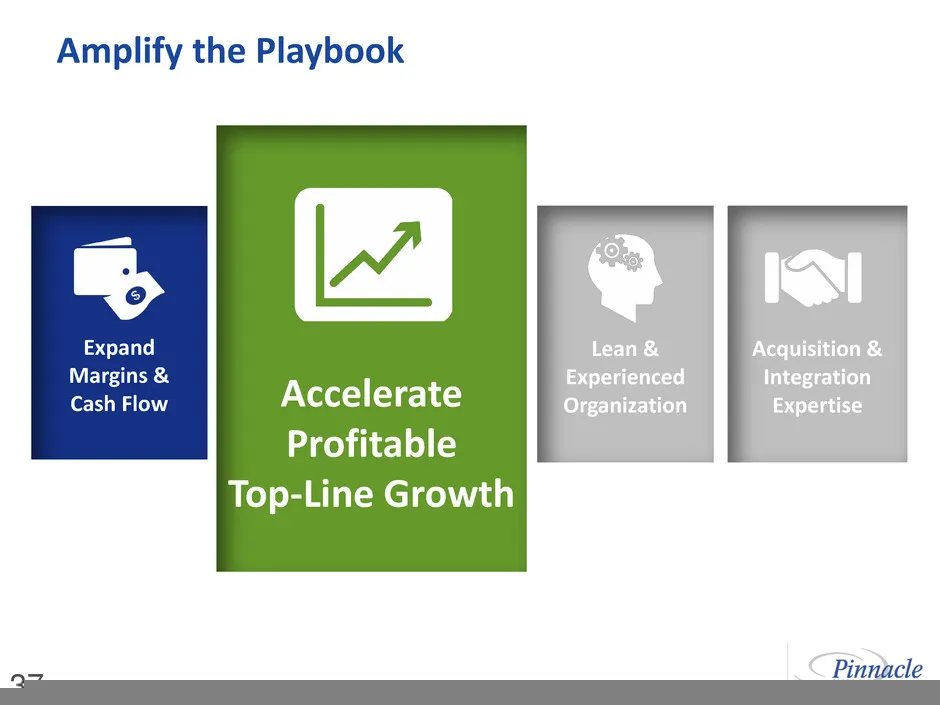
Amplify the Playbook 37 Acquisition & Integration Expertise Expand Margins & Cash Flow Smart Marketing & Innovation Lean & Experienced Organization Accelerate Profitable Top-Line Growth
Slide 38: Accelerate Profitable Top-Line Growth
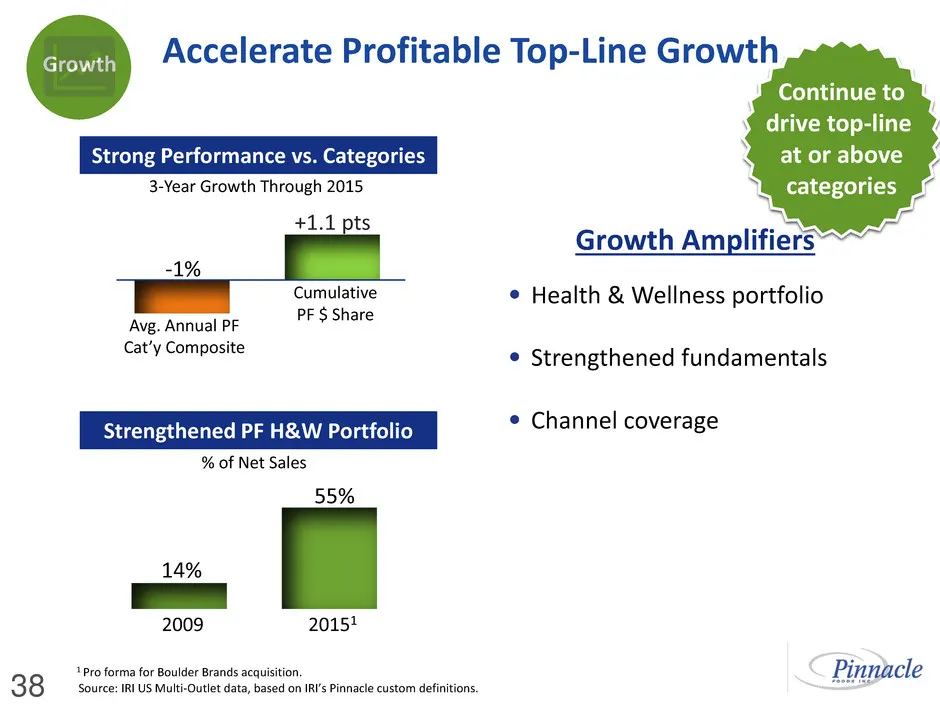
Accelerate Profitable Top-Line Growth 38 Growth -1% Avg. Annual PF Cat’y Composite Cumulative PF $ Share 3-Year Growth Through 2015 +1.1 pts Strong Performance vs. Categories 14% 55% 2009 20151 % of Net Sales Strengthened PF H&W Portfolio Continue to drive top-line at or above categories • Health &
Slide 39: Health & Wellness is the Biggest Growth Trend in Food
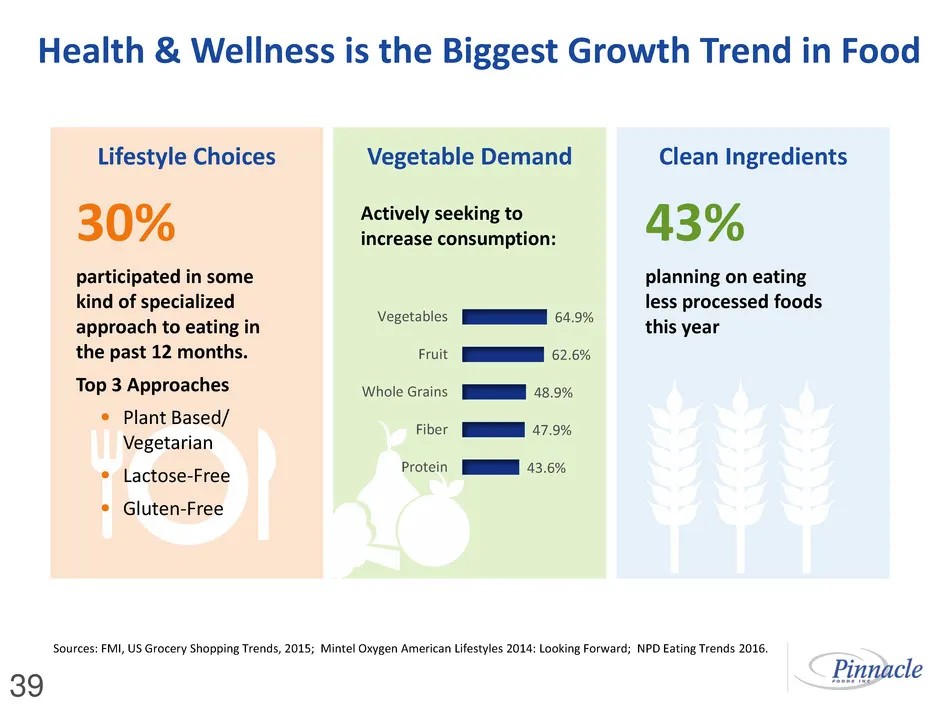
Health & Wellness is the Biggest Growth Trend in Food 39 Lifestyle Choices Clean Ingredients Vegetable Demand 43% planning on eating less processed foods this year Actively seeking to increase consumption: 30% participated in some kind of specialized approach to eating in the past 12 months. Top 3 A
Slide 40: Grow in H&W with Consumer-Driven Strategies
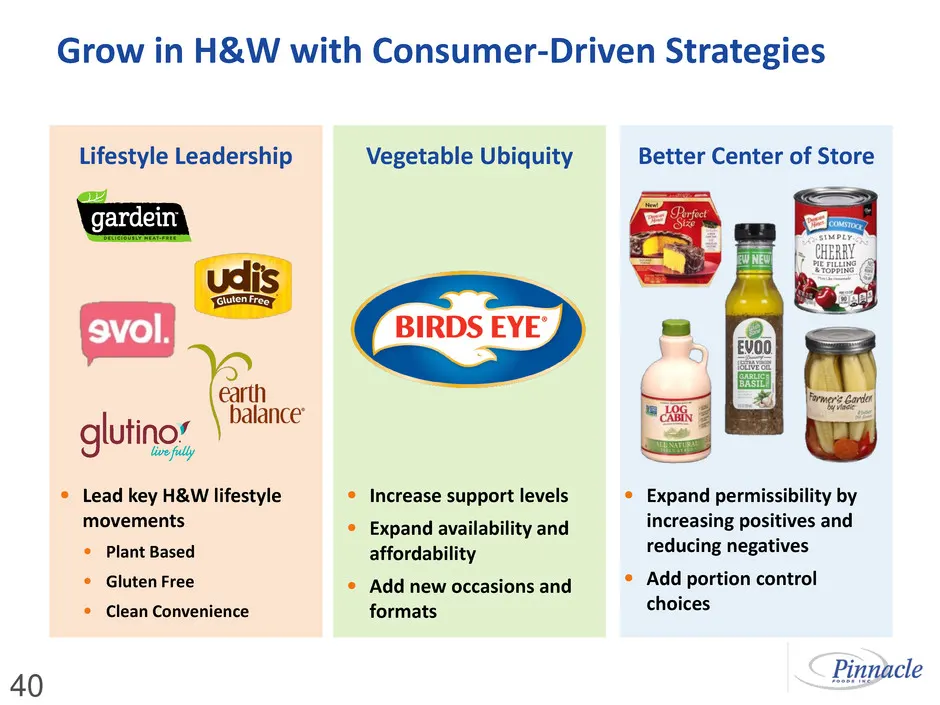
40 Grow in H&W with Consumer-Driven Strategies Lifestyle Leadership Vegetable Ubiquity • Lead key H&W lifestyle movements • Plant Based • Gluten Free • Clean Convenience • Increase support levels • Expand availability and affordability • Add new occasions and formats Better Center of Store • Expand
Slide 41: Amplify the Playbook: Strengthen Capabilities
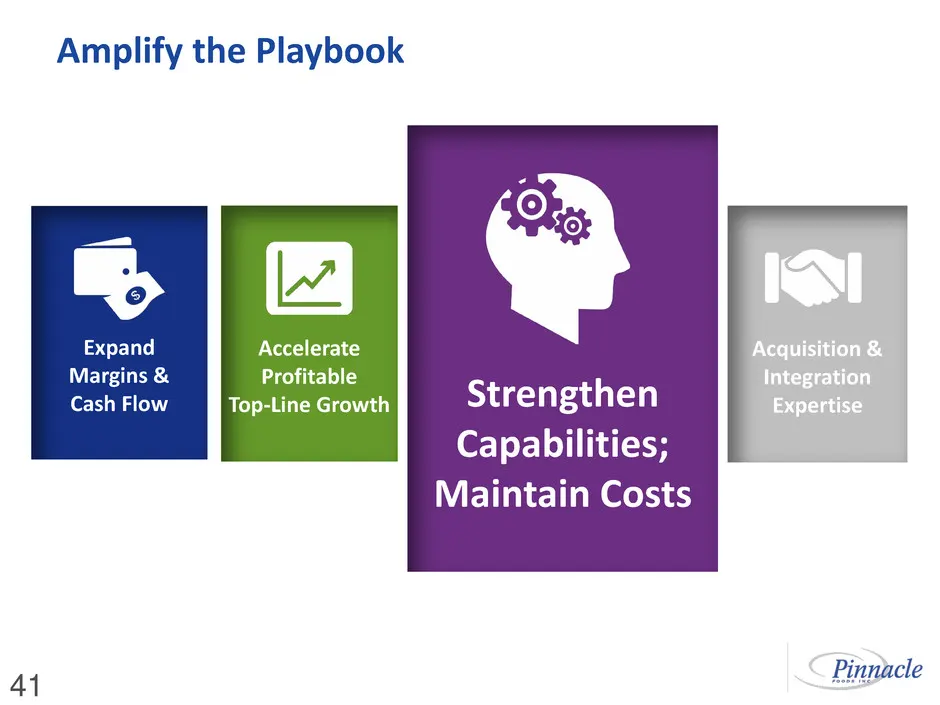
Amplify the Playbook 41 Acquisition & Integration Expertise Expand Margins & Cash Flow Accelerate Profitable Top-Line Growth Lean & Capable Organization Strengthen Capabilities; Maintain Costs
Slide 42: Strengthen Capabilities; Maintain Costs
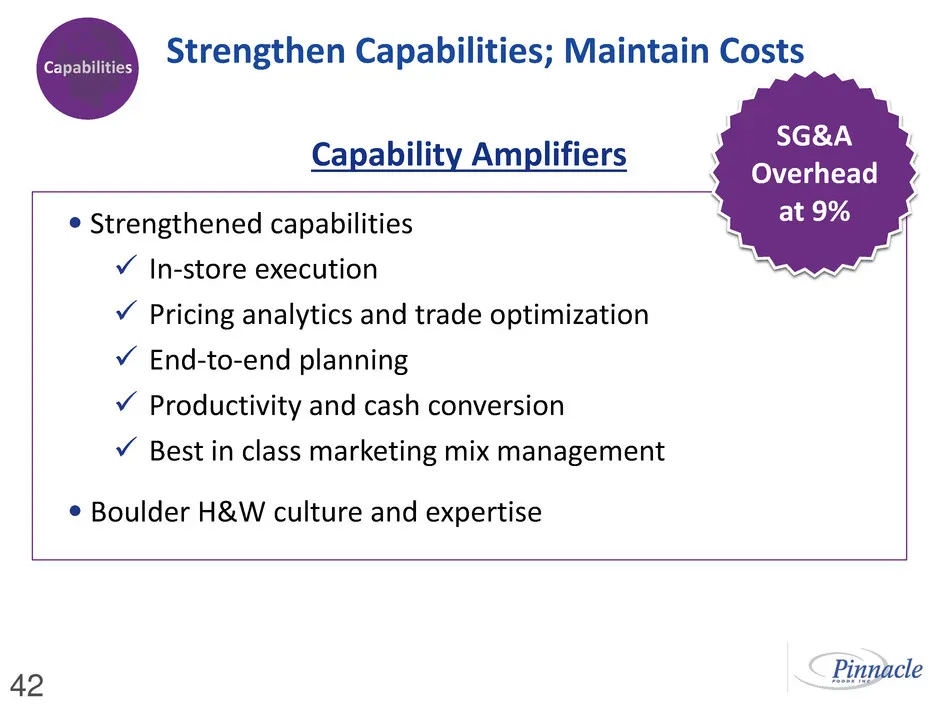
Strengthen Capabilities; Maintain Costs 42 • Strengthened capabilities In-store execution Pricing analytics and trade optimization End-to-end planning Productivity and cash conversion Best in class marketing mix management • Boulder H&W culture and expertise Capabilities Capability Amplifi
Slide 43: Amplify the Playbook: Increase M&A Potential
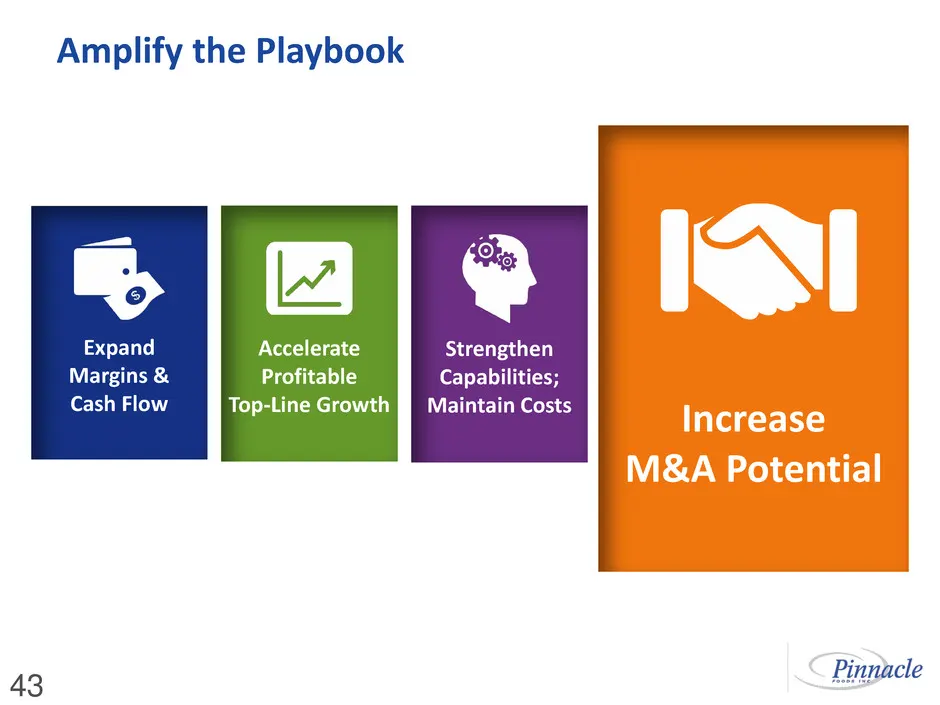
Amplify the Playbook 43 Acquisition & Integration Expertise Expand Margins & Cash Flow Accelerate Profitable Top-Line Growth Strengthen Capabilities; Maintain Costs Increase M&A Potential
Slide 44: Increase M&A Potential
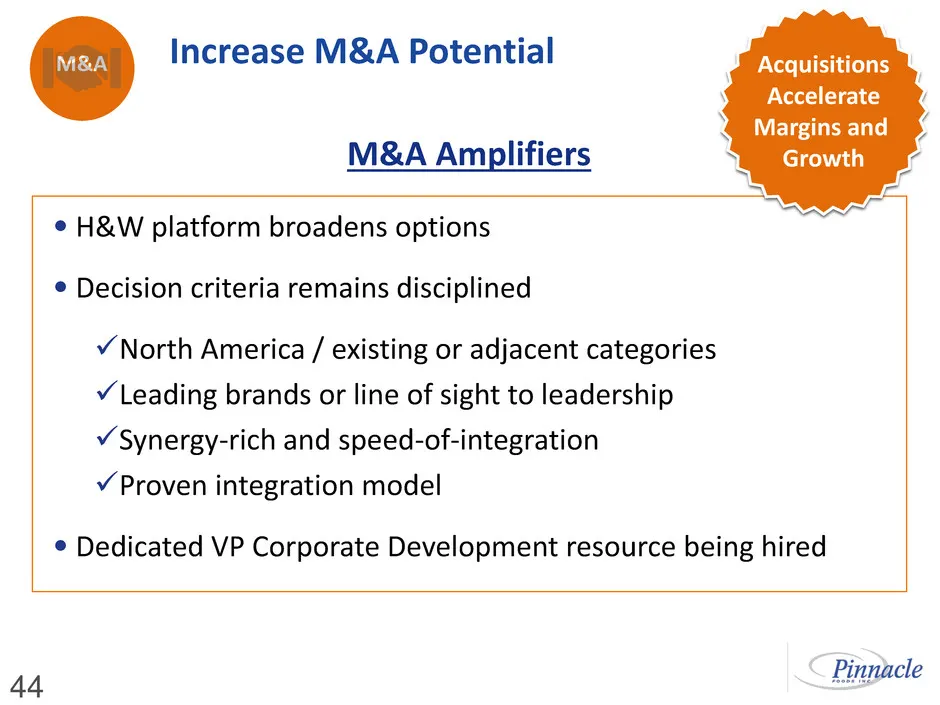
44 Increase M&A Potential M&A •H&W platform broadens options • Decision criteria remains disciplined North America / existing or adjacent categories Leading brands or line of sight to leadership Synergy-rich and speed-of-integration Proven integration model • Dedicated VP Corporate Development r
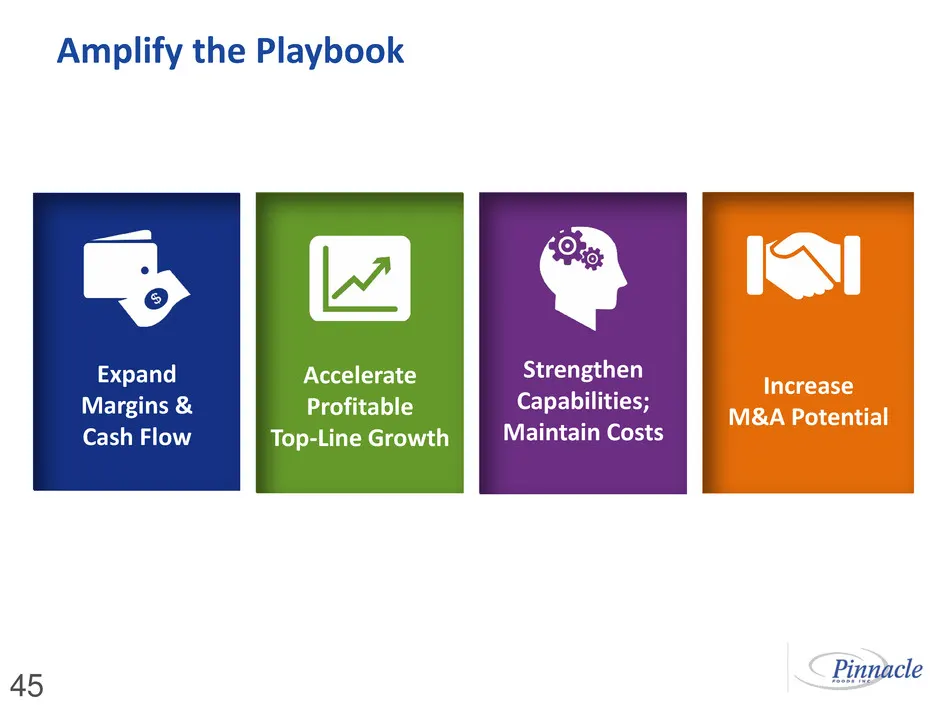
Slide 45: Amplify the Playbook
Acquisition & Integration Expertise Cost & Cash Management Smart Marketing & Innovation Lean & Capable Organization Increase M&A Potential Expand Margins & Cash Flow Accelerate Profitable Top-Line Growth Strengthen Capabilities; Maintain Costs Amplify the Playbook 45
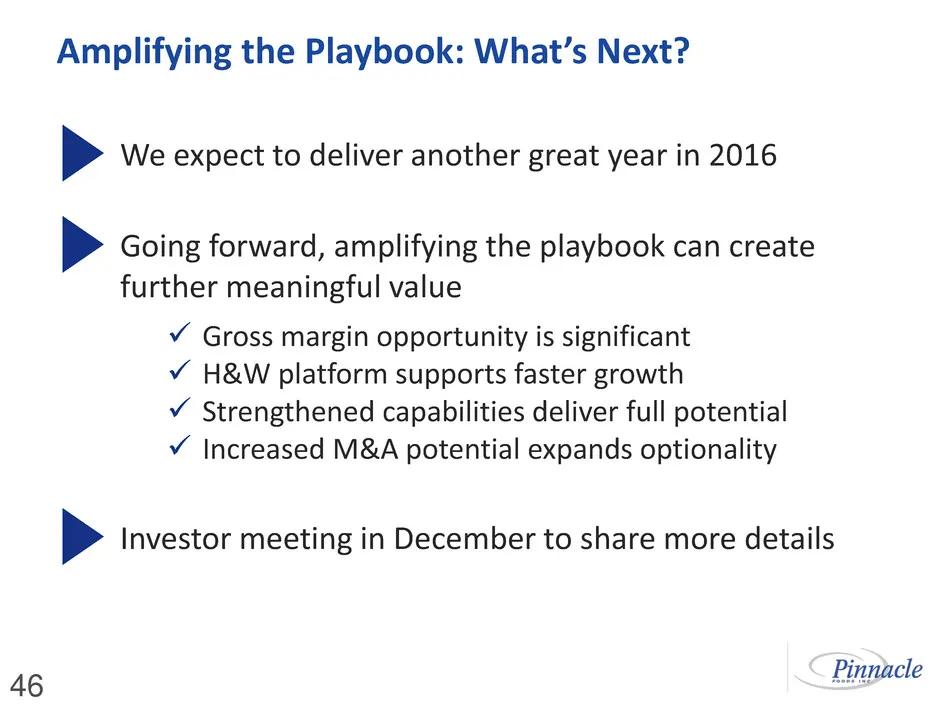
Slide 46: Amplifying the Playbook: What's Next?
46 Amplifying the Playbook: What’s Next? We expect to deliver another great year in 2016 Going forward, amplifying the playbook can create further meaningful value Gross margin opportunity is significant H&W platform supports faster growth Strengthened capabilities deliver full potential Inc
Slide 47: Appendix
Pinnacle Foods AMPLIFY THE PLAYBOOK Appendix
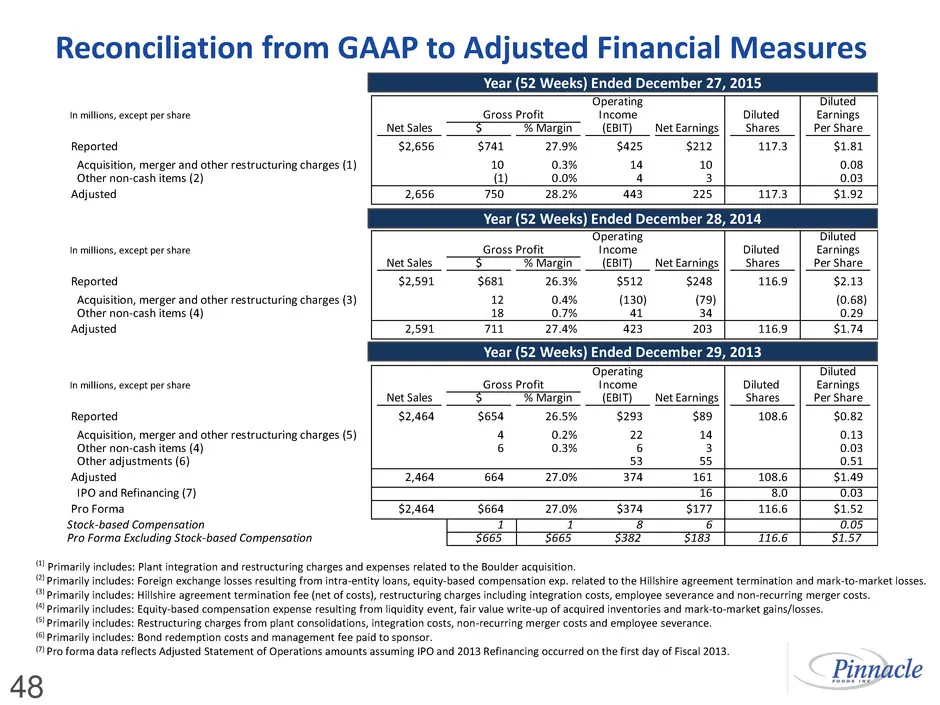
Slide 48: Reconciliation from GAAP to Adjusted Financial Measures
Operating Diluted In millions, except per share Income Diluted Earnings Net Sales $ % Margin (EBIT) Net Earnings Shares Per Share Reported $2,656 $741 27.9% $425 $212 117.3 $1.81 Acquisition, merger and other restructuring charges (1) 10 0.3% 14 10 0.08 Other non-cash items (2) (1) 0.0% 4 3 0.03 Adj
Slide 49: Reconciliation from GAAP to Adjusted Financial Measures
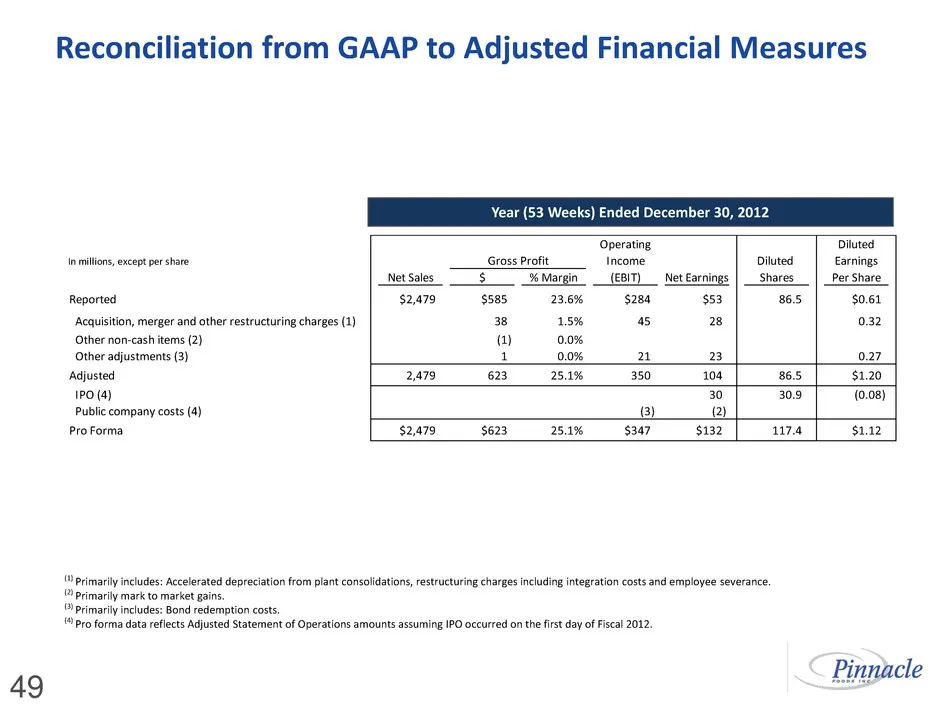
Operating Diluted In millions, except per share Income Diluted Earnings Net Sales $ % Margin (EBIT) Net Earnings Shares Per Share Reported $2,479 $585 23.6% $284 $53 86.5 $0.61 Acquisition, merger and other restructuring charges (1) 38 1.5% 45 28 0.32 Other non-cash items (2) (1) 0.0% Other adjustme
Slide 50: Reconciliation from GAAP to Adjusted: First Half
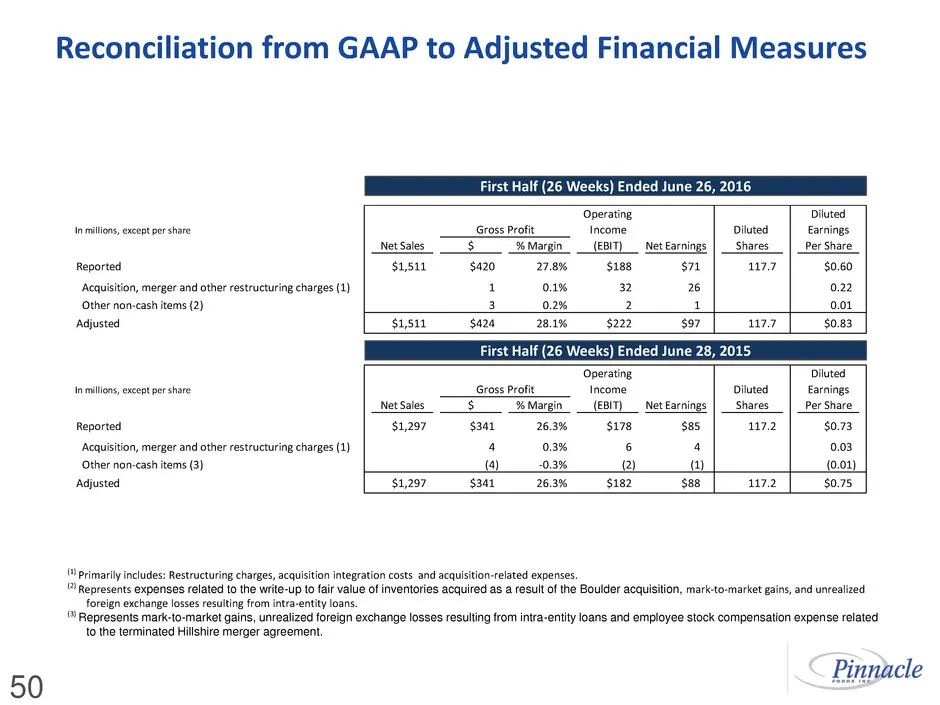
First Half (26 Weeks) Ended June 26, 2016 (1) Primarily includes: Restructuring charges, acquisition integration costs and acquisition-related expenses. (2) Represents expenses related to the write-up to fair value of inventories acquired as a result of the Boulder acquisition, mark-to-market gains,
Slide 51: Reconciliation of Unleveraged Free Cash Flow
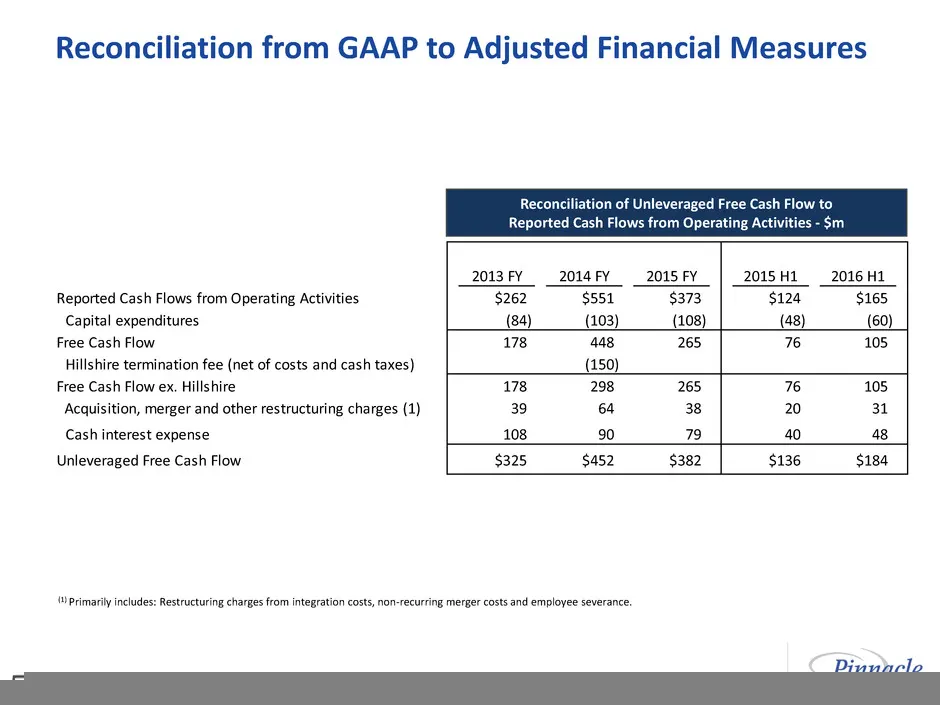
(1) Primarily includes: Restructuring charges from integration costs, non-recurring merger costs and employee severance. 2013 FY 2014 FY 2015 FY 2015 H1 2016 H1 Reported Cash Flows from Operating Activities $262 $551 $373 $124 $165 Capital expenditures (84) (103) (108) (48) (60) Free Cash Flow 178 4
Source: SEC EDGAR · 8-K filed Sep 6, 2016
More decks from Pinnacle Foods Inc
 Q1 FY2019 Earnings Presentation44 slides · Sep 27, 2018
 Q4 FY2018 Earnings Presentation59 slides · Jun 27, 2018
 Barclays Global Consumer Staples Conference 201767 slides · Sep 6, 2017
 Debt Investor Presentation (January 2017)55 slides · Jan 23, 2017
 Investor Day (December 2016)55 slides · Dec 15, 2016
 CAGNY 201655 slides · Mar 24, 2016