Capstar Financial Holdings Inc
Capstar Financial — Investor Presentation (November 2018)
49 slides from Capstar Financial's investor presentation, Nov 6, 2018
Slide 1: Investor Presentation November 6-8, 2018
Nasdaq: CSTR Investor Presentation November 6-8, 2018 Claire W. Tucker, President and Chief Executive Officer Rob Anderson, Chief Financial Officer and Chief Administrative Officer Christopher Tietz, Chief Credit Officer Exhibit 99.1
Slide 2: Terminology, Market Data and Non-GAAP Disclaimer
Terminology The terms “we,” “our,” “us,” “the Company,” “CSTR” and “CapStar” that appear in this presentation refer to CapStar Financial Holdings, Inc. and its wholly owned subsidiary, CapStar Bank. The terms “CapStar Bank,” “the Bank” and “our Bank” that appear in this presentation refer to CapStar
Slide 3: Forward-Looking Statements
Certain statements in this presentation are forward-looking statements that reflect our current views with respect to, among other things, future events and our financial and operational performance. These statements are often, but not always, made through the use of words or phrases such as “may,”
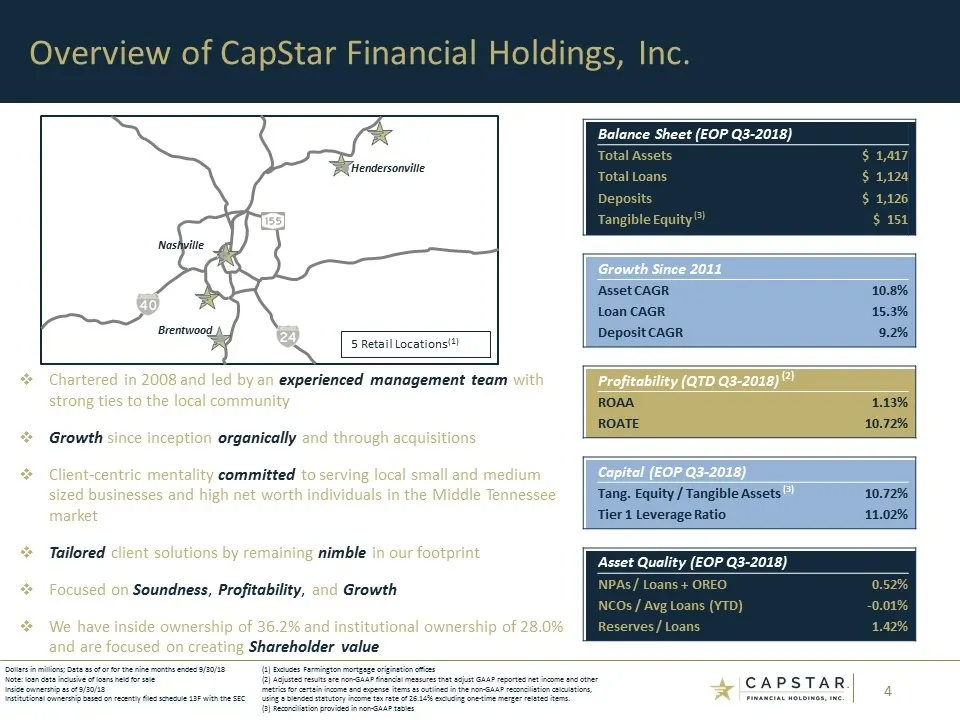
Slide 4: Overview of CapStar Financial Holdings, Inc.
Overview of CapStar Financial Holdings, Inc. Chartered in 2008 and led by an experienced management team with strong ties to the local community Growth since inception organically and through acquisitions Client-centric mentality committed to serving local small and medium sized businesses and high
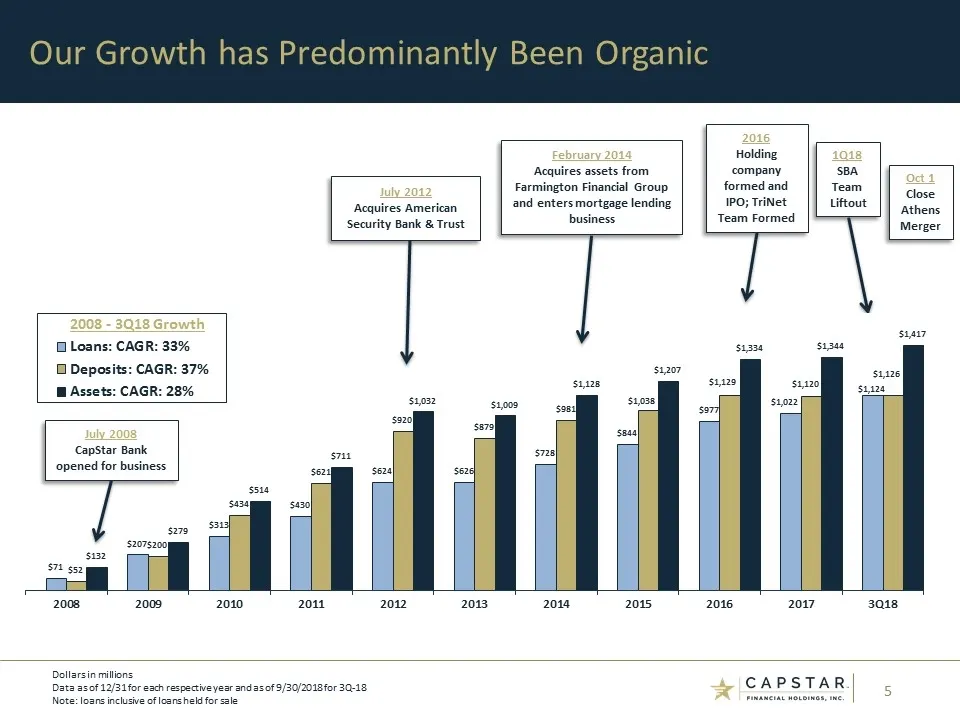
Slide 5: Our Growth has Predominantly Been Organic
Our Growth has Predominantly Been Organic Dollars in millions Data as of 12/31 for each respective year and as of 9/30/2018 for 3Q-18 Note: loans inclusive of loans held for sale February 2014 Acquires assets from Farmington Financial Group and enters mortgage lending business 2016 Holding company f
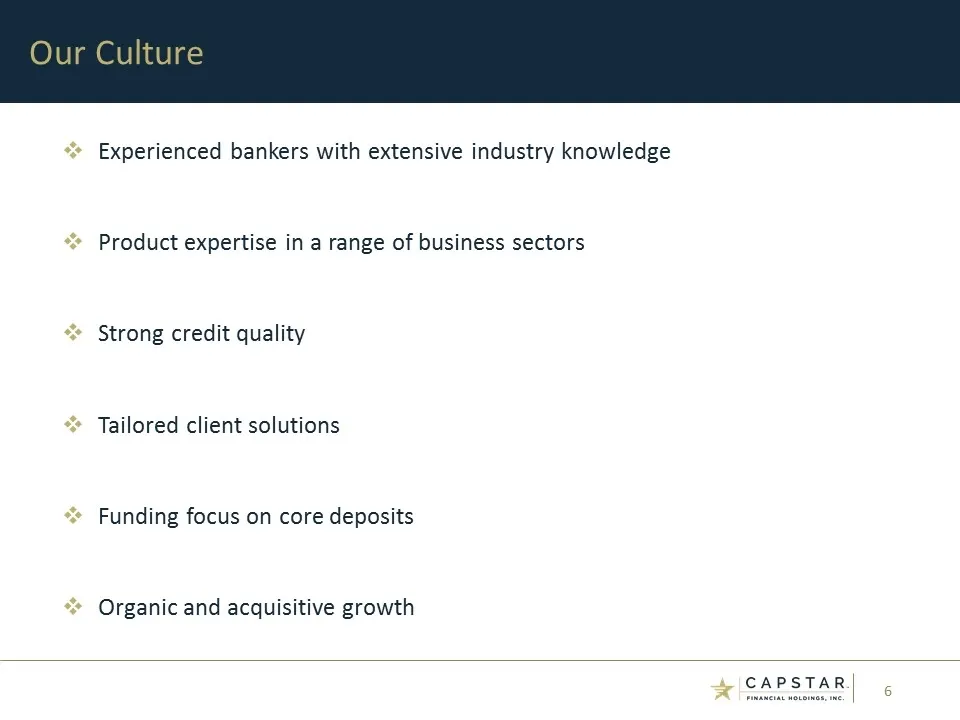
Slide 6: Our Culture
Experienced bankers with extensive industry knowledge Product expertise in a range of business sectors Strong credit quality Tailored client solutions Funding focus on core deposits Organic and acquisitive growth Our Culture
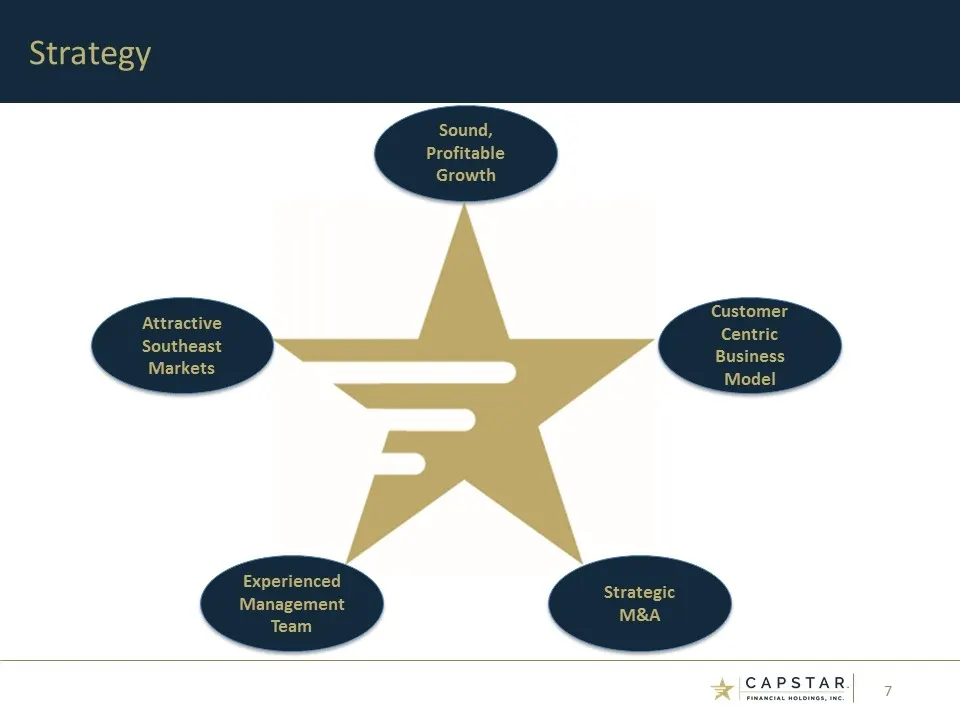
Slide 7: Strategy
Strategy Customer Centric Business Model Sound, Profitable Growth Attractive Southeast Markets Experienced Management Team Strategic M&A
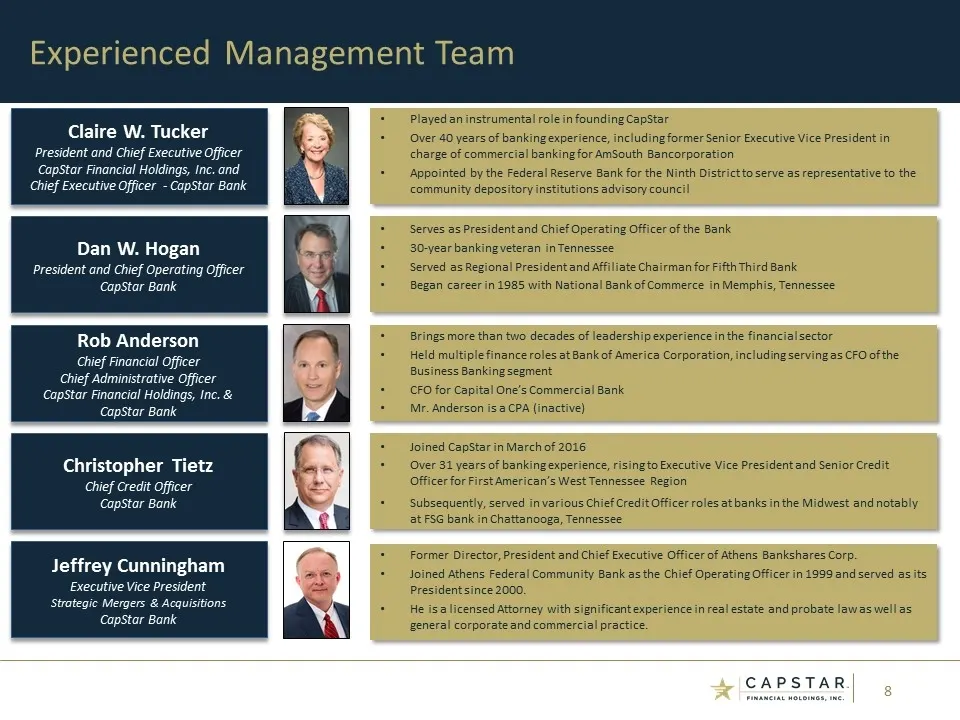
Slide 8: Experienced Management Team
Experienced Management Team Claire W. Tucker President and Chief Executive Officer CapStar Financial Holdings, Inc. and Chief Executive Officer - CapStar Bank Played an instrumental role in founding CapStar Over 40 years of banking experience, including former Senior Executive Vice President in char
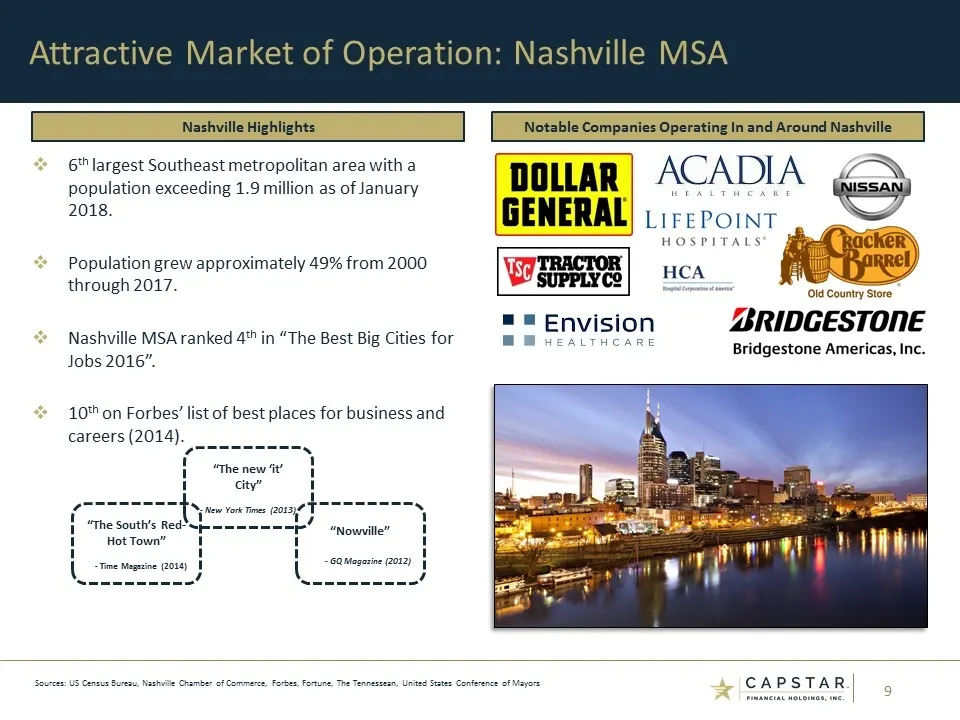
Slide 9: Attractive Market of Operation: Nashville MSA
6th largest Southeast metropolitan area with a population exceeding 1.9 million as of January 2018. Population grew approximately 49% from 2000 through 2017. Nashville MSA ranked 4th in “The Best Big Cities for Jobs 2016”. 10th on Forbes’ list of best places for business and careers (2014). Attracti
Slide 10: CapStar recognized by Greenwich Associates
CapStar is a 2018 Greenwich CX Leader in U.S. Commercial Small Business Banking recognizing leadership in the increasingly important field of customer experience. CapStar recognized by Greenwich Associates Source: Greenwich Associates
Slide 11: Nashville: Regional, National, and Global Business Hub
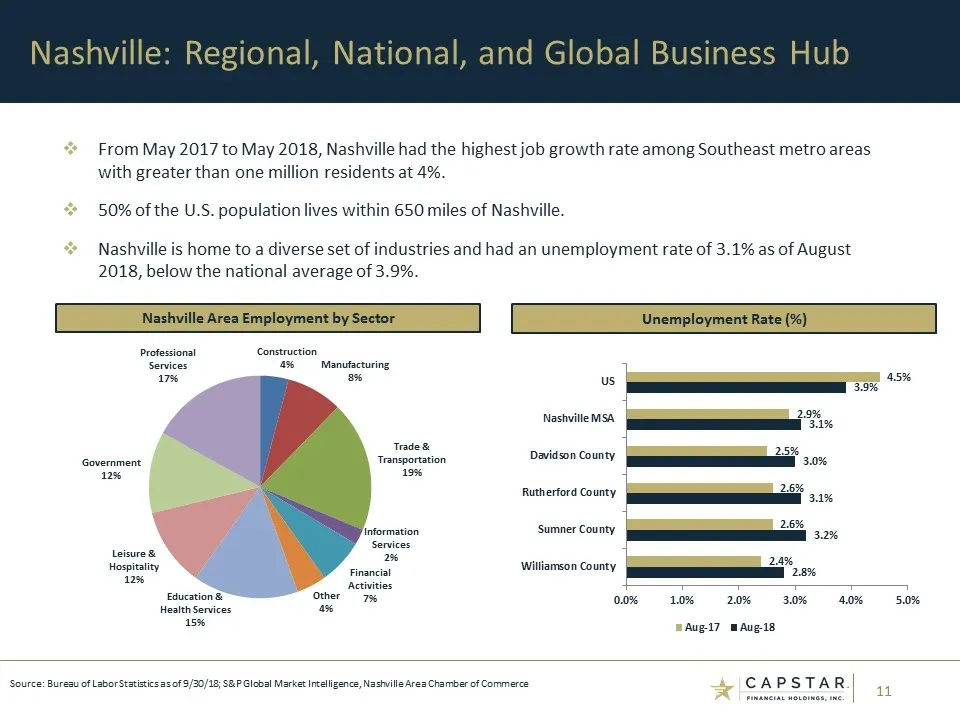
From May 2017 to May 2018, Nashville had the highest job growth rate among Southeast metro areas with greater than one million residents at 4%. 50% of the U.S. population lives within 650 miles of Nashville. Nashville is home to a diverse set of industries and had an unemployment rate of 3.1% as of
Slide 12: Athens Merger Update
Athens Merger Update * CAPSTAR
Slide 13: Overview of Athens Bancshares Corporation
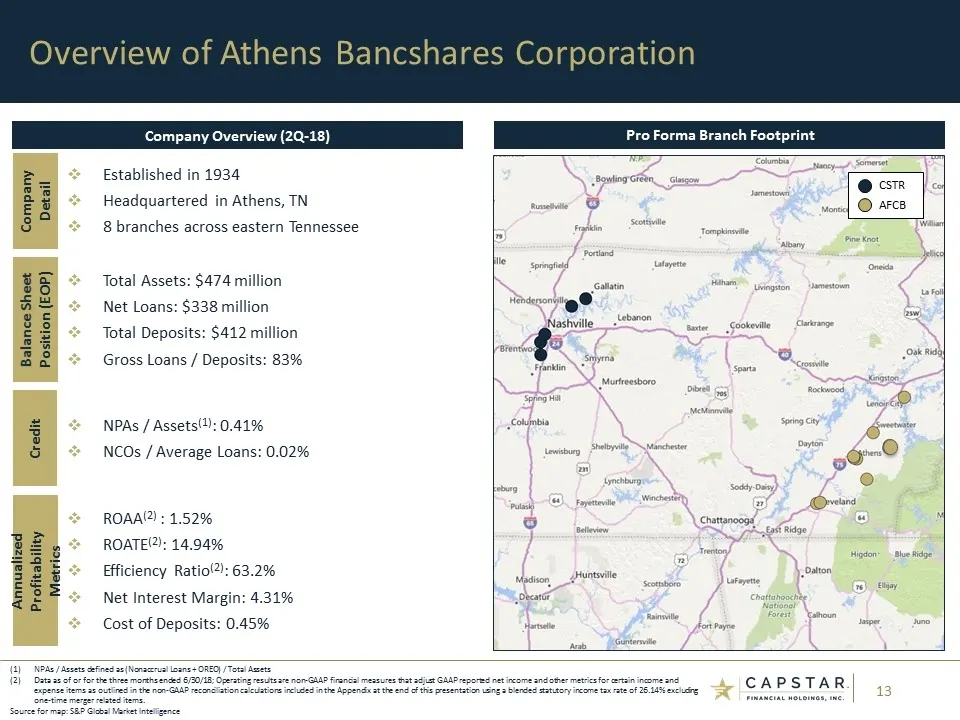
Overview of Athens Bancshares Corporation Company Overview (2Q-18) Pro Forma Branch Footprint NPAs / Assets defined as (Nonaccrual Loans + OREO) / Total Assets Data as of or for the three months ended 6/30/18; Operating results are non-GAAP financial measures that adjust GAAP reported net income and
Slide 14: Delivering on Stated M&A Objectives
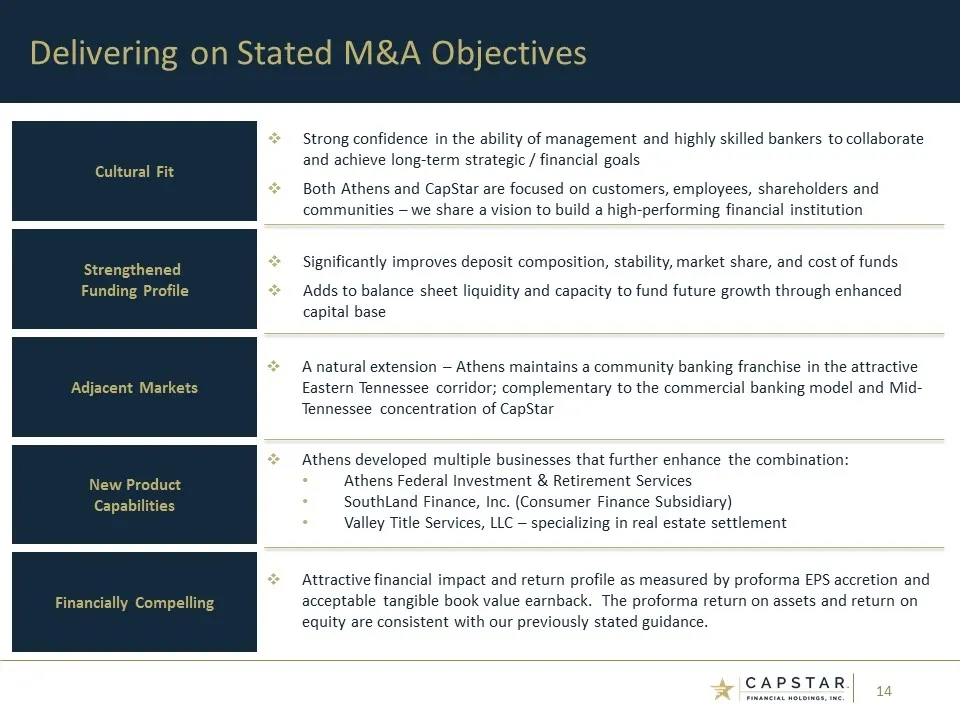
Delivering on Stated M&A Objectives Cultural Fit Strengthened Funding Profile Adjacent Markets New Product Capabilities Financially Compelling Strong confidence in the ability of management and highly skilled bankers to collaborate and achieve long-term strategic / financial goals Both Athens and Ca
Slide 15: Pro Forma $2.0 Billion Asset Franchise
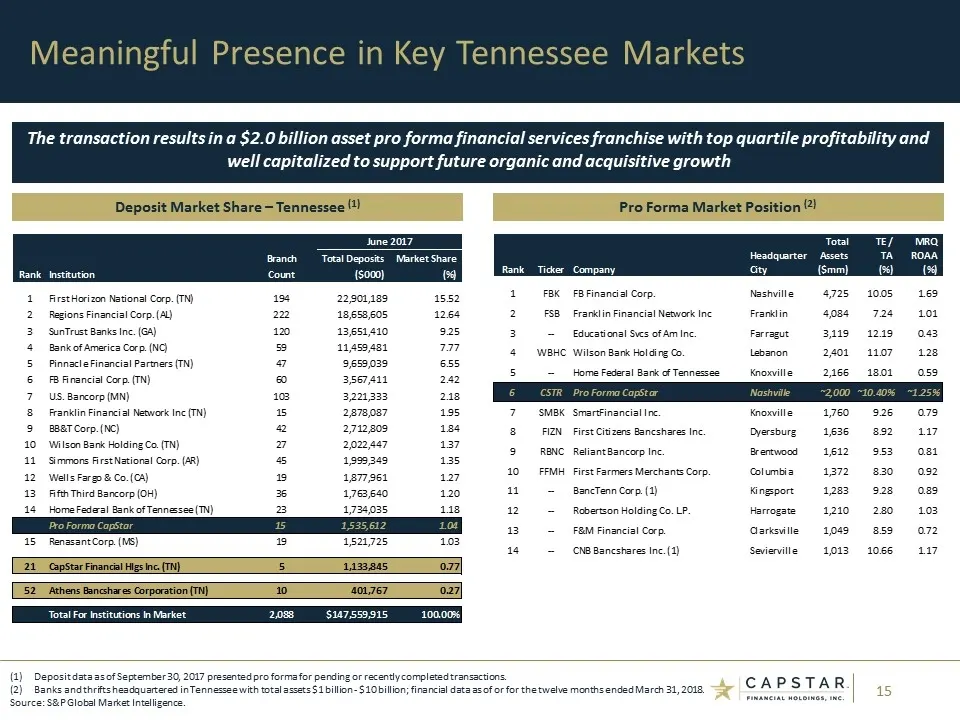
The transaction results in a $2.0 billion asset pro forma financial services franchise with top quartile profitability and well capitalized to support future organic and acquisitive growth Meaningful Presence in Key Tennessee Markets Deposit Market Share – Tennessee (1) Pro Forma Market Position (2)
Slide 16: Snapshot Profile Metrics
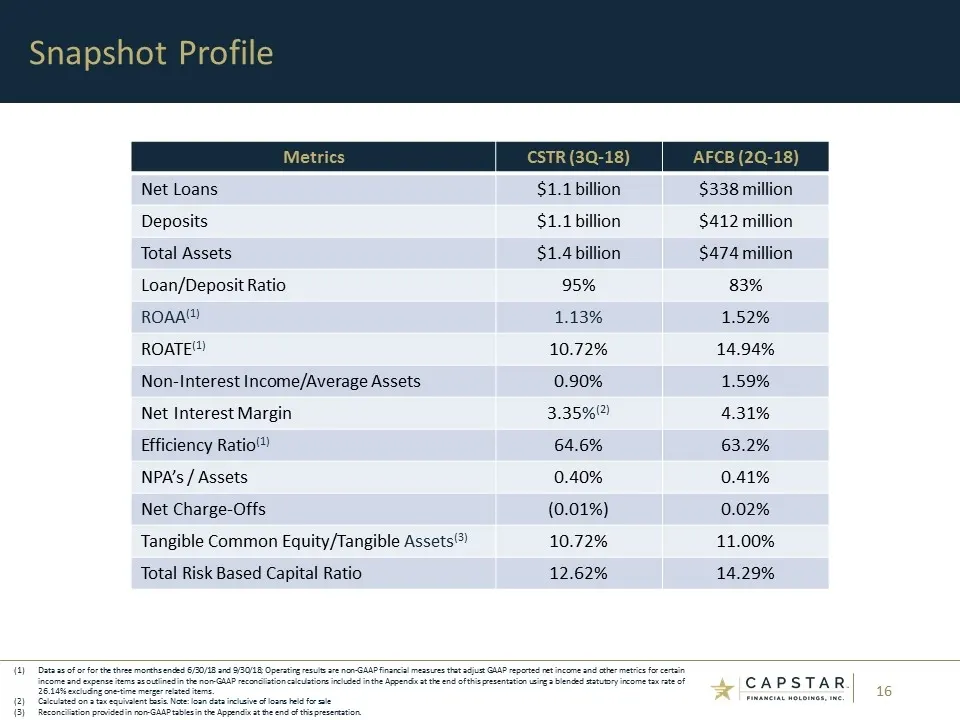
Snapshot Profile Metrics CSTR (3Q-18) AFCB (2Q-18) Net Loans $1.1 billion $338 million Deposits $1.1 billion $412 million Total Assets $1.4 billion $474 million Loan/Deposit Ratio 95% 83% ROAA(1) 1.13% 1.52% ROATE(1) 10.72% 14.94% Non-Interest Income/Average Assets 0.90% 1.59% Net Interest Margin 3.
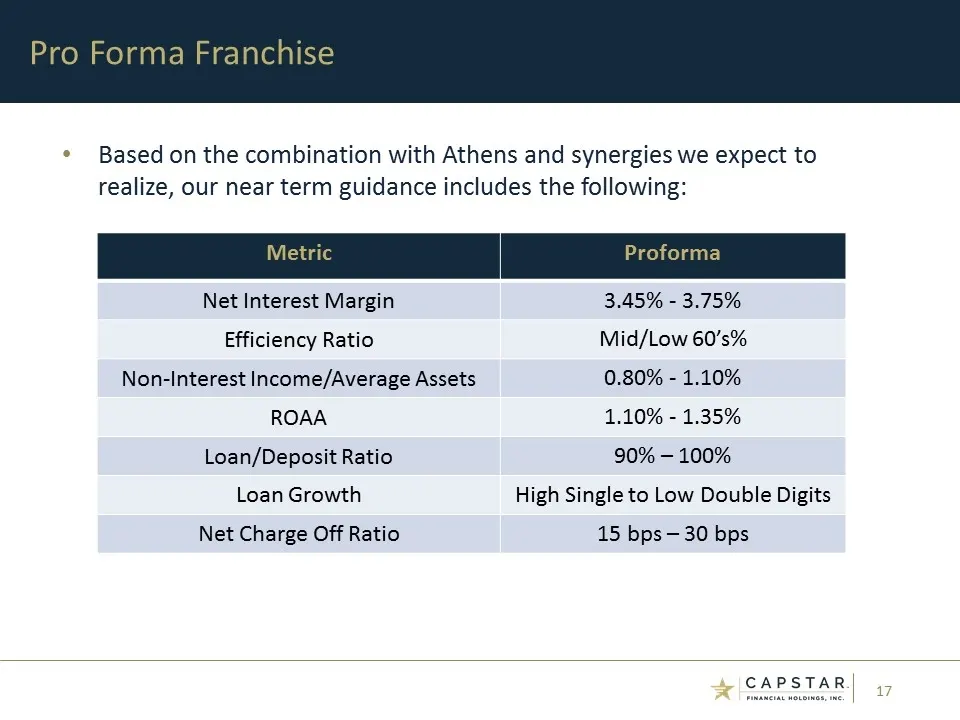
Slide 17: Near Term Pro Forma Guidance
Based on the combination with Athens and synergies we expect to realize, our near term guidance includes the following: Pro Forma Franchise Metric Proforma Net Interest Margin 3.45% - 3.75% Efficiency Ratio Mid/Low 60’s% Non-Interest Income/Average Assets 0.80% - 1.10% ROAA 1.10% - 1.35% Loan/Deposi
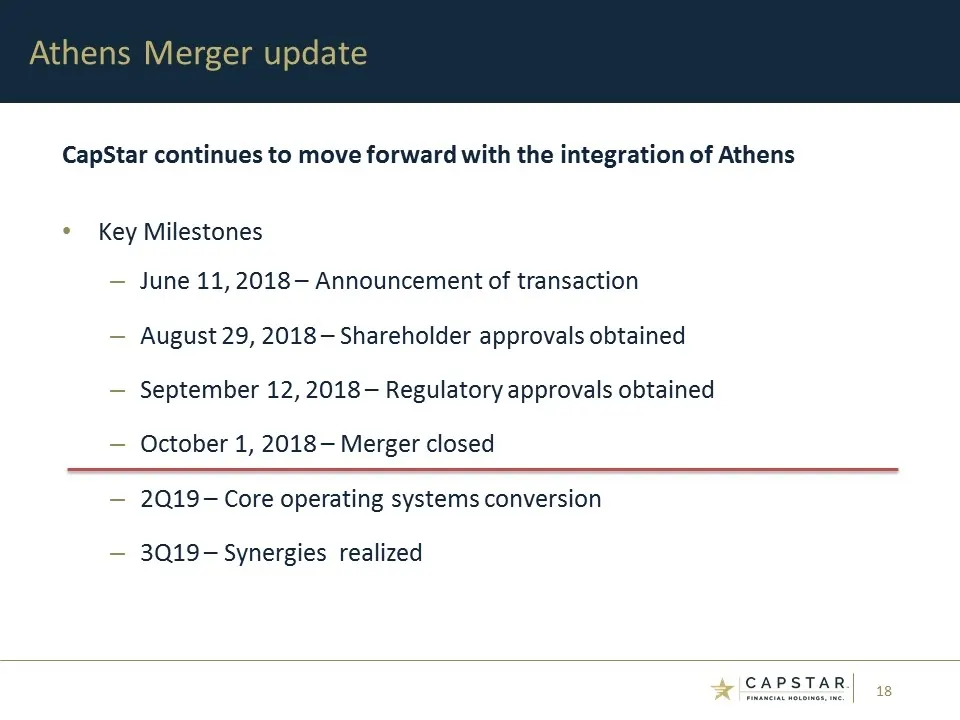
Slide 18: Athens Merger Update: Key Milestones
CapStar continues to move forward with the integration of Athens Key Milestones June 11, 2018 – Announcement of transaction August 29, 2018 – Shareholder approvals obtained September 12, 2018 – Regulatory approvals obtained October 1, 2018 – Merger closed 2Q19 – Core operating systems conversion 3Q1
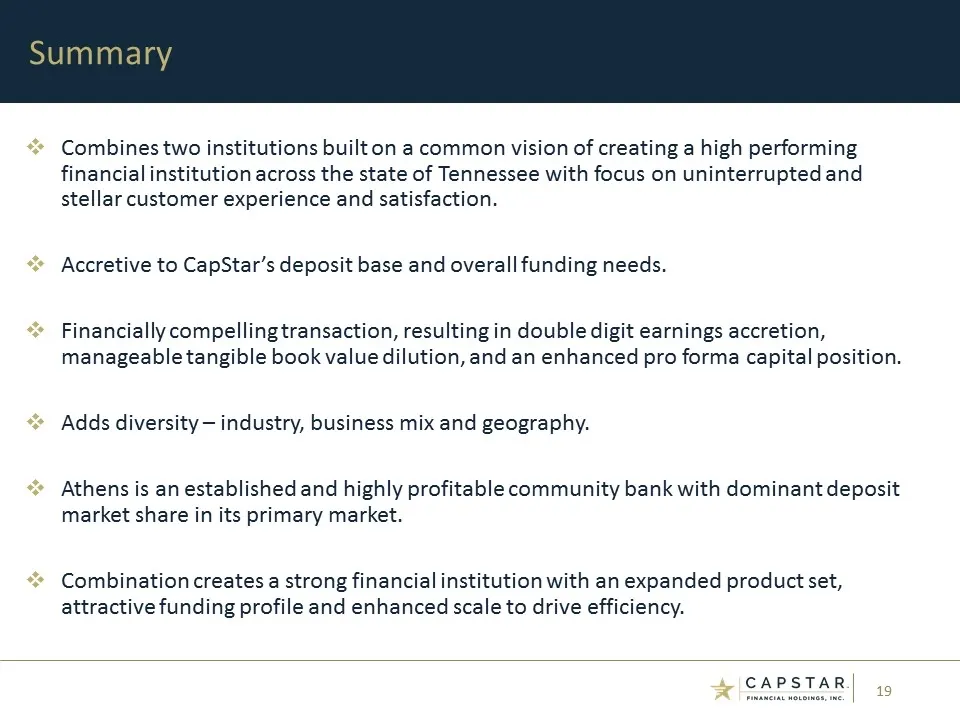
Slide 19: Summary
Summary Combines two institutions built on a common vision of creating a high performing financial institution across the state of Tennessee with focus on uninterrupted and stellar customer experience and satisfaction. Accretive to CapStar’s deposit base and overall funding needs. Financially compel
Slide 20: CapStar 3Q18 Financial Results
CapStar 3Q18 Financial Results
Slide 21: 3Q18 Highlights
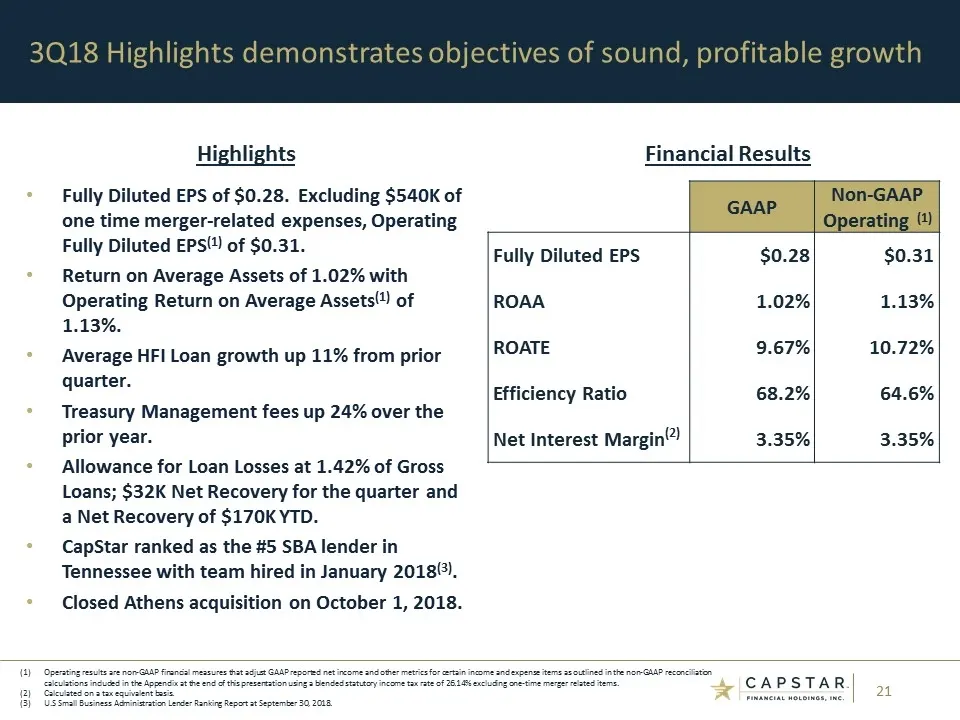
Fully Diluted EPS of $0.28. Excluding $540K of one time merger-related expenses, Operating Fully Diluted EPS(1) of $0.31. Return on Average Assets of 1.02% with Operating Return on Average Assets(1) of 1.13%. Average HFI Loan growth up 11% from prior quarter. Treasury Management fees up 24% over the
Slide 22: Loan Growth
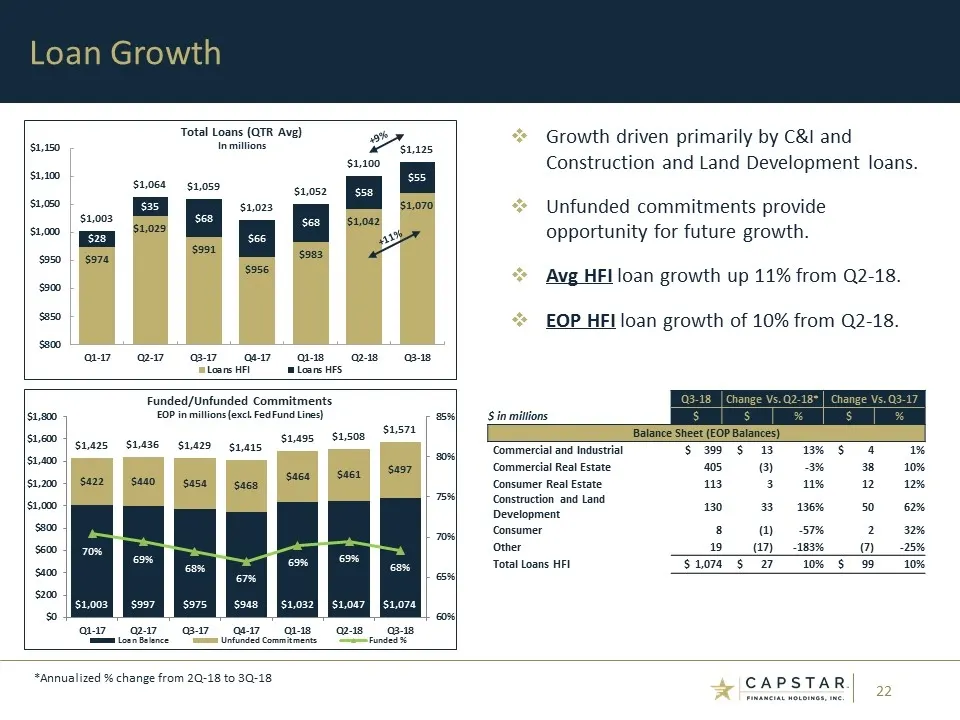
Loan Growth *Annualized % change from 2Q-18 to 3Q-18 Growth driven primarily by C&I and Construction and Land Development loans. Unfunded commitments provide opportunity for future growth. Avg HFI loan growth up 11% from Q2-18. EOP HFI loan growth of 10% from Q2-18. +9% +11% Q3-18 Change Vs. Q2-18*
Slide 23: Loan Yields
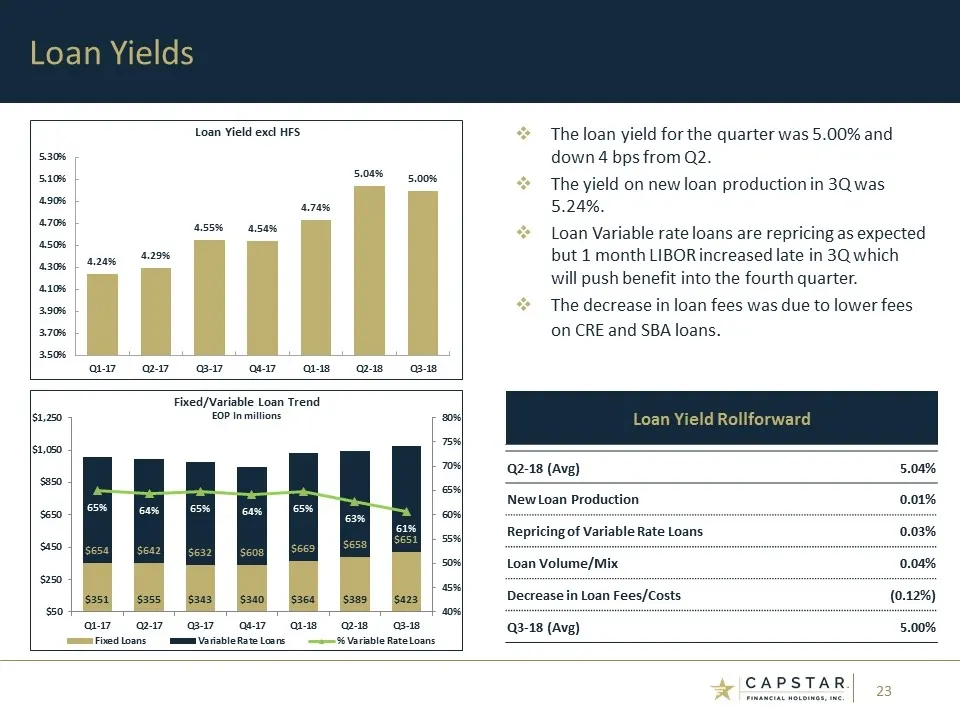
Loan Yields The loan yield for the quarter was 5.00% and down 4 bps from Q2. The yield on new loan production in 3Q was 5.24%. Loan Variable rate loans are repricing as expected but 1 month LIBOR increased late in 3Q which will push benefit into the fourth quarter. The decrease in loan fees was due
Slide 24: Deposit Growth and Costs
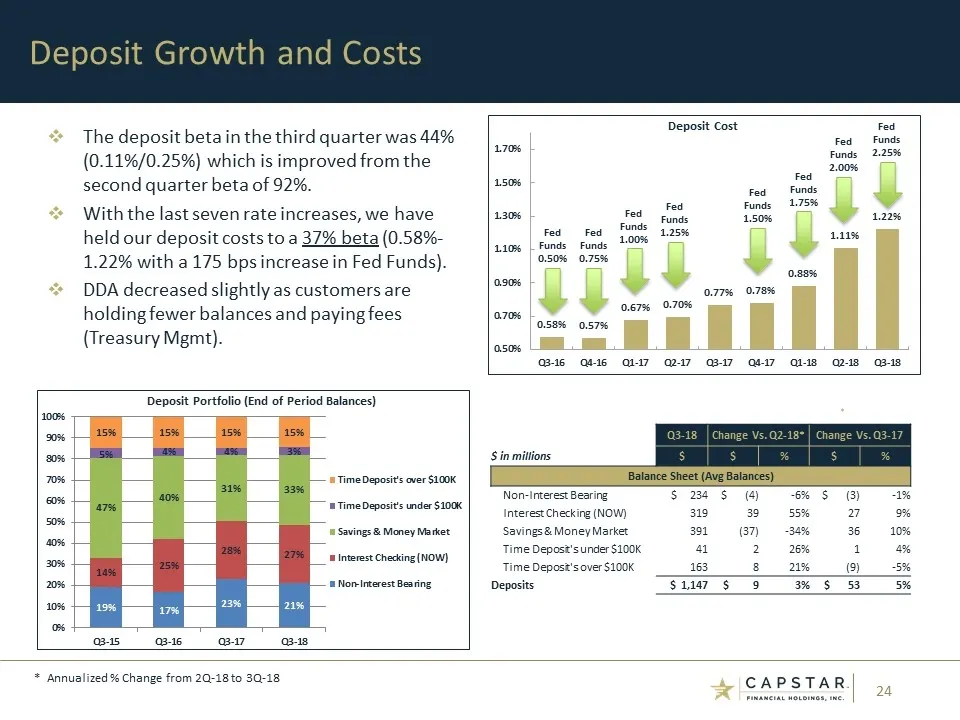
Fed Funds 0.75% Fed Funds 1.00% Fed Funds 1.25% Fed Funds 1.50% Fed Funds 1.75% Fed Funds 2.00% Deposit Growth and Costs * * Annualized % Change from 2Q-18 to 3Q-18 Q3-18 Change Vs. Q2-18* Change Vs. Q3-17 $ in millions $ $ % $ % Balance Sheet (Avg Balances) Non-Interest Bearing $ 234 $ (4) -6% $ (3
Slide 25: Deposit Composition
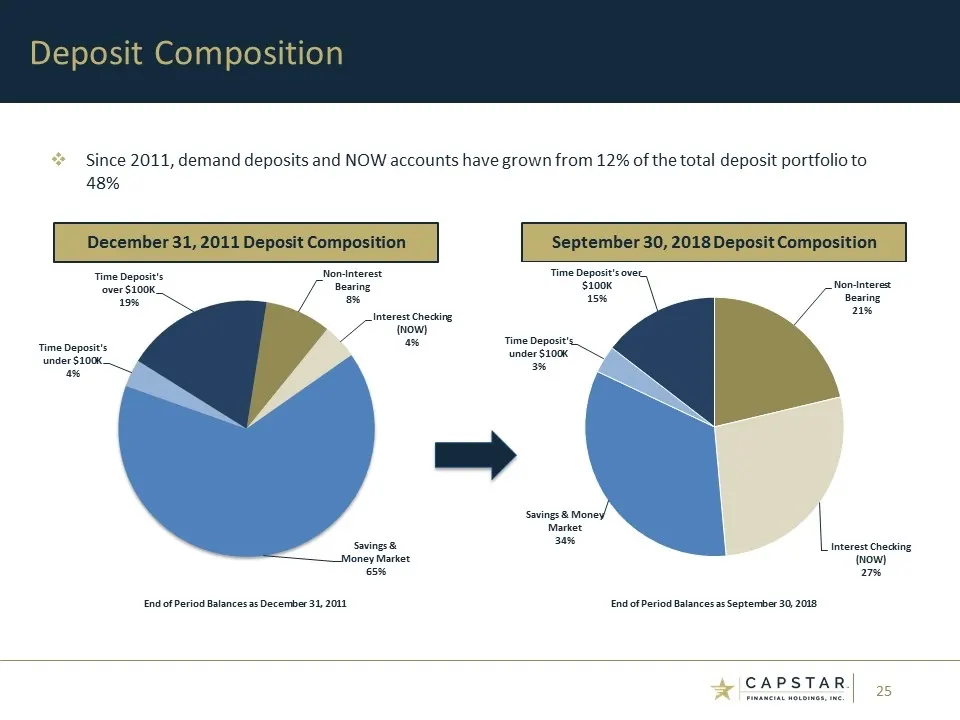
December 31, 2011 Deposit Composition Deposit Composition September 30, 2018 Deposit Composition Since 2011, demand deposits and NOW accounts have grown from 12% of the total deposit portfolio to 48% End of Period Balances as December 31, 2011 End of Period Balances as September 30, 2018
Slide 26: Net Interest Margin
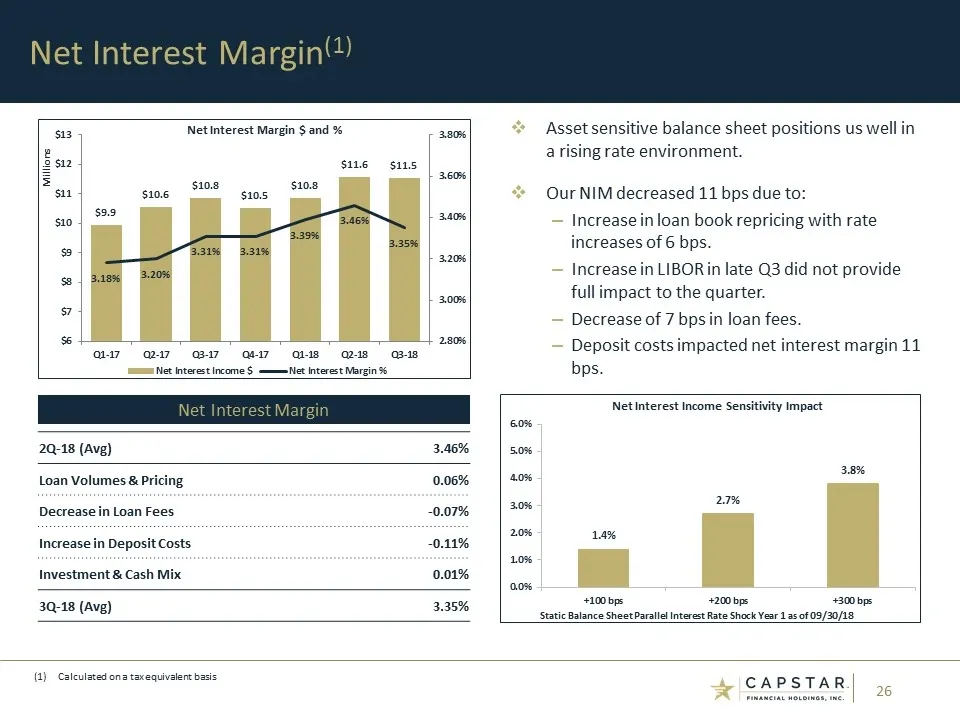
Net Interest Margin(1) Asset sensitive balance sheet positions us well in a rising rate environment. Our NIM decreased 11 bps due to: Increase in loan book repricing with rate increases of 6 bps. Increase in LIBOR in late Q3 did not provide full impact to the quarter. Decrease of 7 bps in loan fees.
Slide 27: Non-Interest Income
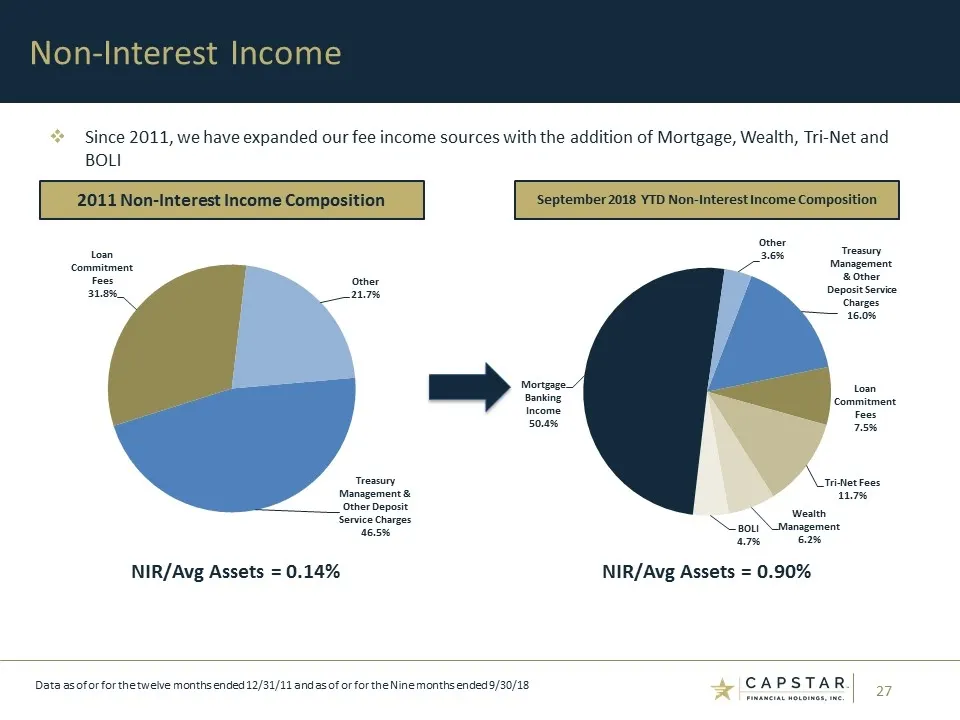
Non-Interest Income 2011 Non-Interest Income Composition September 2018 YTD Non-Interest Income Composition Since 2011, we have expanded our fee income sources with the addition of Mortgage, Wealth, Tri-Net and BOLI Data as of or for the twelve months ended 12/31/11 and as of or for the Nine months
Slide 28: Credit Quality
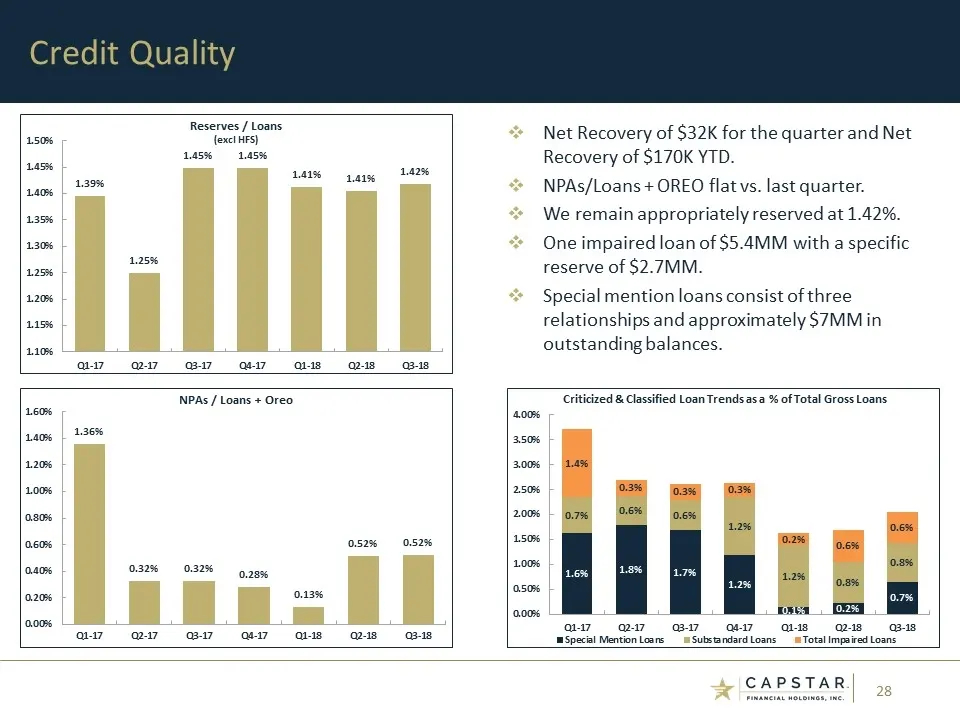
Credit Quality Net Recovery of $32K for the quarter and Net Recovery of $170K YTD. NPAs/Loans + OREO flat vs. last quarter. We remain appropriately reserved at 1.42%. One impaired loan of $5.4MM with a specific reserve of $2.7MM. Special mention loans consist of three relationships and approximately
Slide 29: Capital
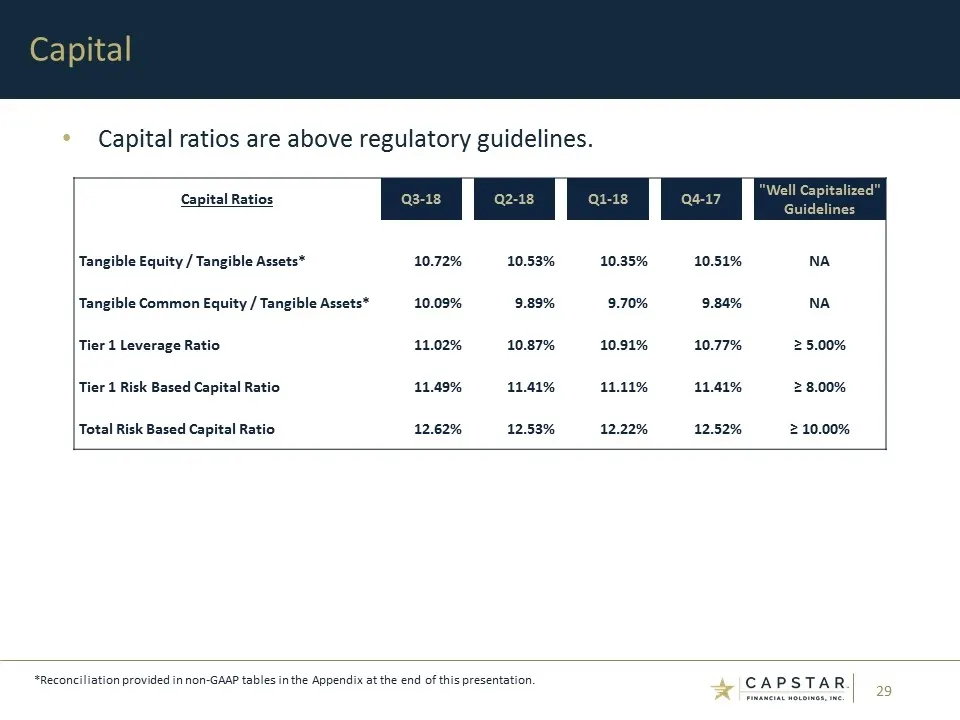
Capital ratios are above regulatory guidelines. Capital *Reconciliation provided in non-GAAP tables in the Appendix at the end of this presentation. Capital Ratios Q3-18 Q2-18 Q1-18 Q4-17 "Well Capitalized" Guidelines Tangible Equity / Tangible Assets* 10.72% 10.53% 10.35% 10.51% NA Tangible Common
Slide 30: Key Takeaways
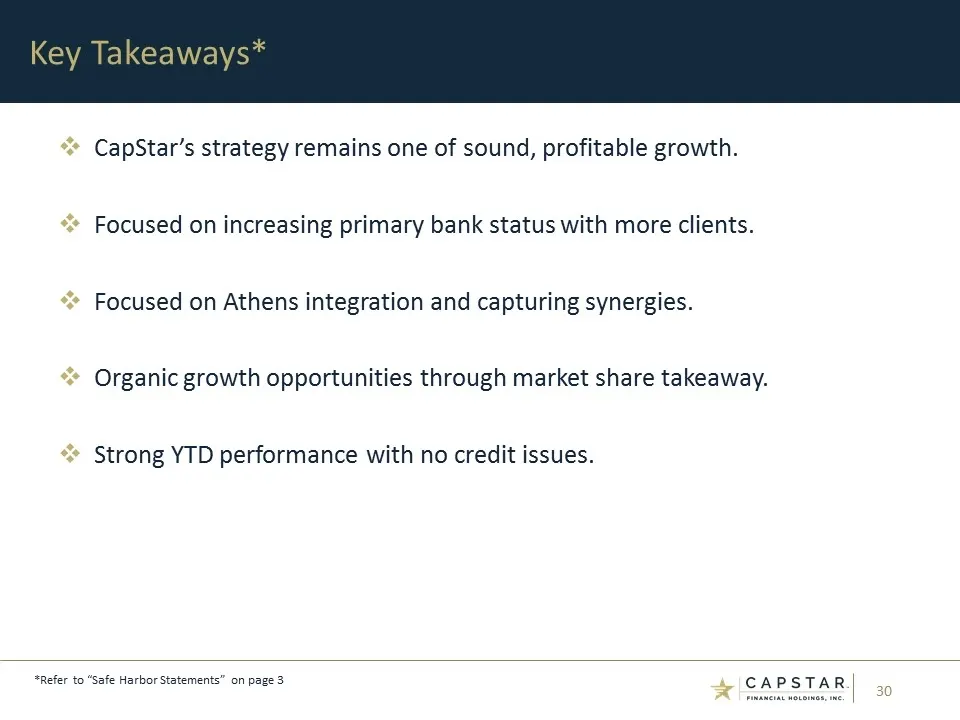
CapStar’s strategy remains one of sound, profitable growth. Focused on increasing primary bank status with more clients. Focused on Athens integration and capturing synergies. Organic growth opportunities through market share takeaway. Strong YTD performance with no credit issues. Key Takeaways* *Re
Slide 31: Contact Information
CapStar Financial Holdings, Inc. 1201 Demonbreun Street, Suite 700 Nashville, TN 37203 Mail: P.O. Box 305065 Nashville, TN 37230-5065 (615) 732-6400 Telephone www.capstarbank.com (615) 732-6455 Email: [email protected] Contact Information Investor Relations Executive Leadership Claire W. Tucker Pre
Slide 32: Appendix: Non-GAAP Tables
Appendix: Non-GAAP Tables * CAPSTAR
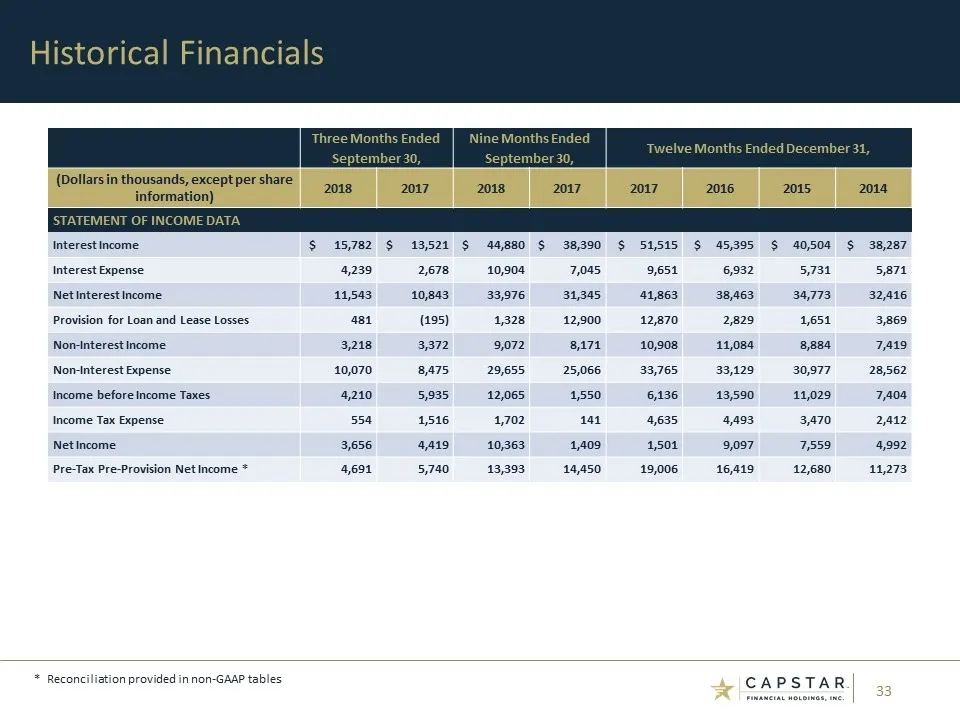
Slide 33: Historical Financials: Statement of Income
Historical Financials * Reconciliation provided in non-GAAP tables Three Months Ended Nine Months Ended Twelve Months Ended December 31, September 30, September 30, (Dollars in thousands, except per share information) 2018 2017 2018 2017 2017 2016 2015 2014 STATEMENT OF INCOME DATA Interest Income $
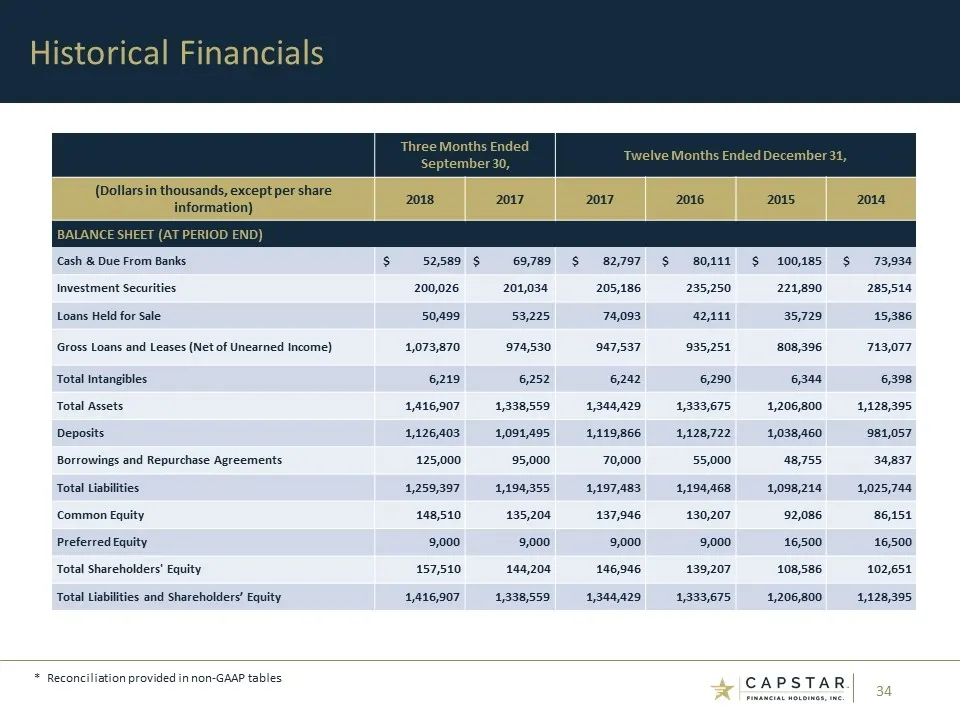
Slide 34: Historical Financials: Balance Sheet
Historical Financials * Reconciliation provided in non-GAAP tables Three Months Ended September 30, Twelve Months Ended December 31, (Dollars in thousands, except per share information) 2018 2017 2017 2016 2015 2014 BALANCE SHEET (AT PERIOD END) Cash & Due From Banks $ 52,589 $ 69,789 $ 82,797 $ 80,
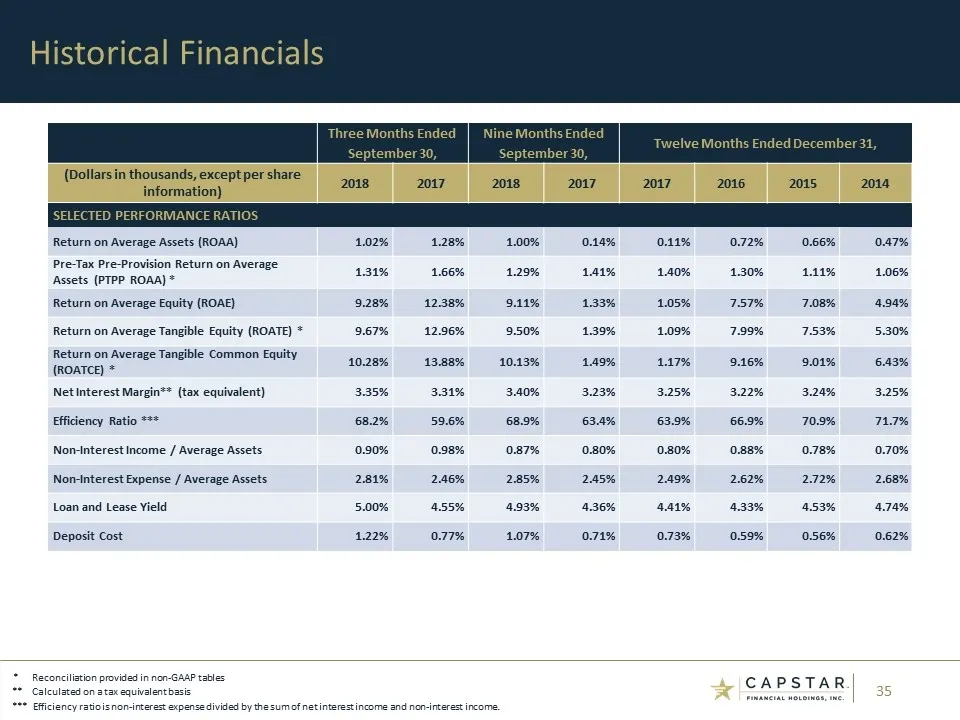
Slide 35: Historical Financials: Performance Ratios
Historical Financials * Reconciliation provided in non-GAAP tables ** Calculated on a tax equivalent basis *** Efficiency ratio is non-interest expense divided by the sum of net interest income and non-interest income. Three Months Ended Nine Months Ended Twelve Months Ended December 31, September 3
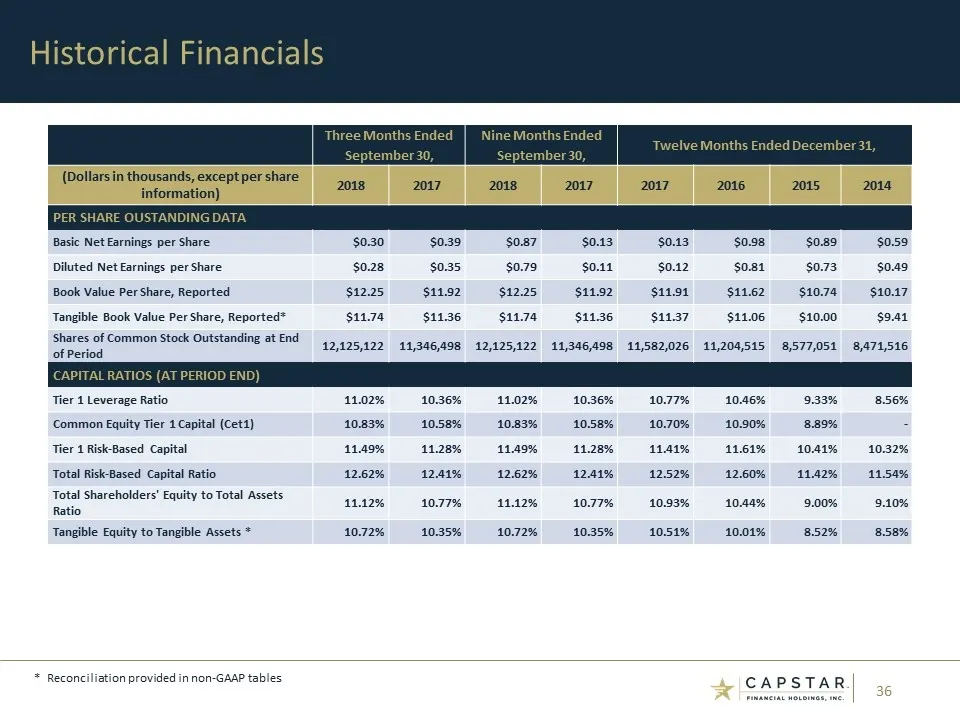
Slide 36: Historical Financials: Per Share Data
Historical Financials * Reconciliation provided in non-GAAP tables Three Months Ended Nine Months Ended Twelve Months Ended December 31, September 30, September 30, (Dollars in thousands, except per share information) 2018 2017 2018 2017 2017 2016 2015 2014 PER SHARE OUSTANDING DATA Basic Net Earnin
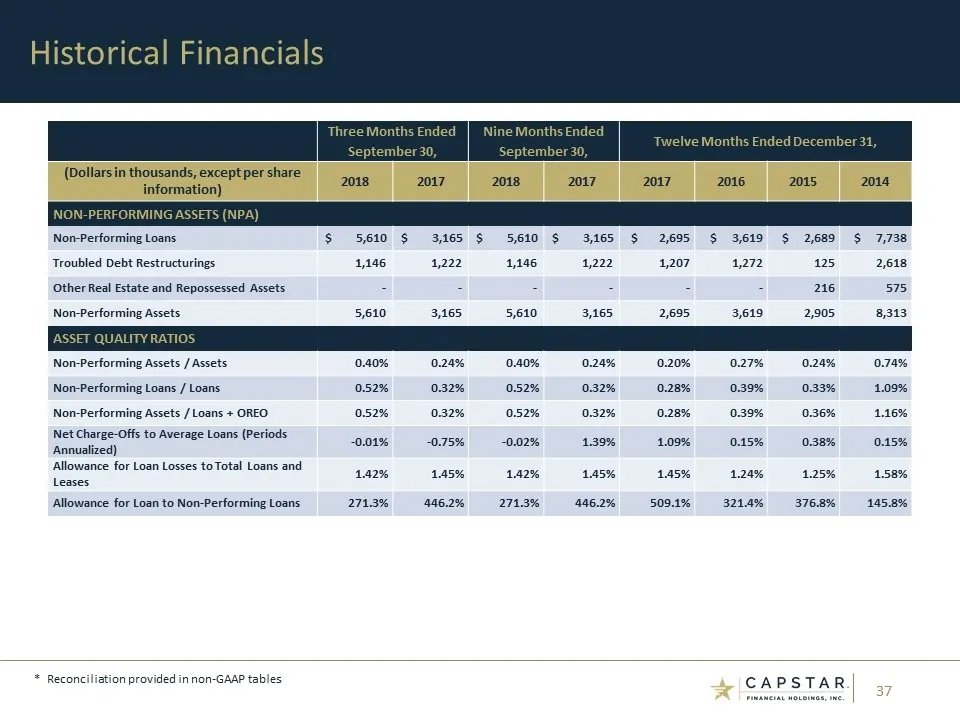
Slide 37: Historical Financials: Non-Performing Assets
Historical Financials * Reconciliation provided in non-GAAP tables Three Months Ended Nine Months Ended Twelve Months Ended December 31, September 30, September 30, (Dollars in thousands, except per share information) 2018 2017 2018 2017 2017 2016 2015 2014 NON-PERFORMING ASSETS (NPA) Non-Performing
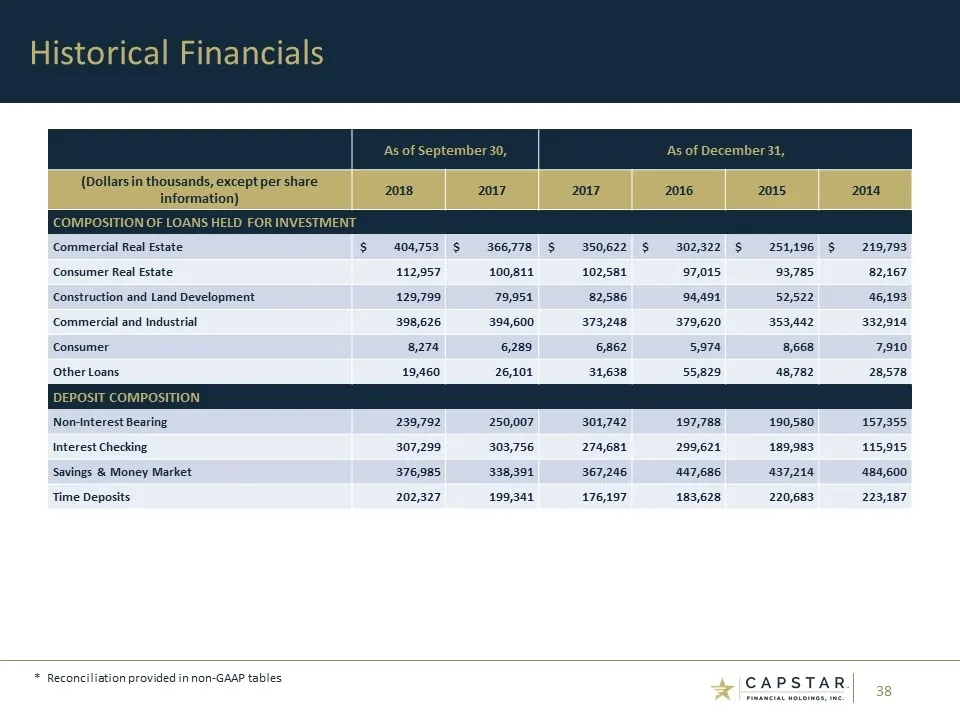
Slide 38: Historical Financials: Loan and Deposit Composition
Historical Financials * Reconciliation provided in non-GAAP tables As of September 30, As of December 31, (Dollars in thousands, except per share information) 2018 2017 2017 2016 2015 2014 COMPOSITION OF LOANS HELD FOR INVESTMENT Commercial Real Estate $ 404,753 $ 366,778 $ 350,622 $ 302,322 $ 251,1
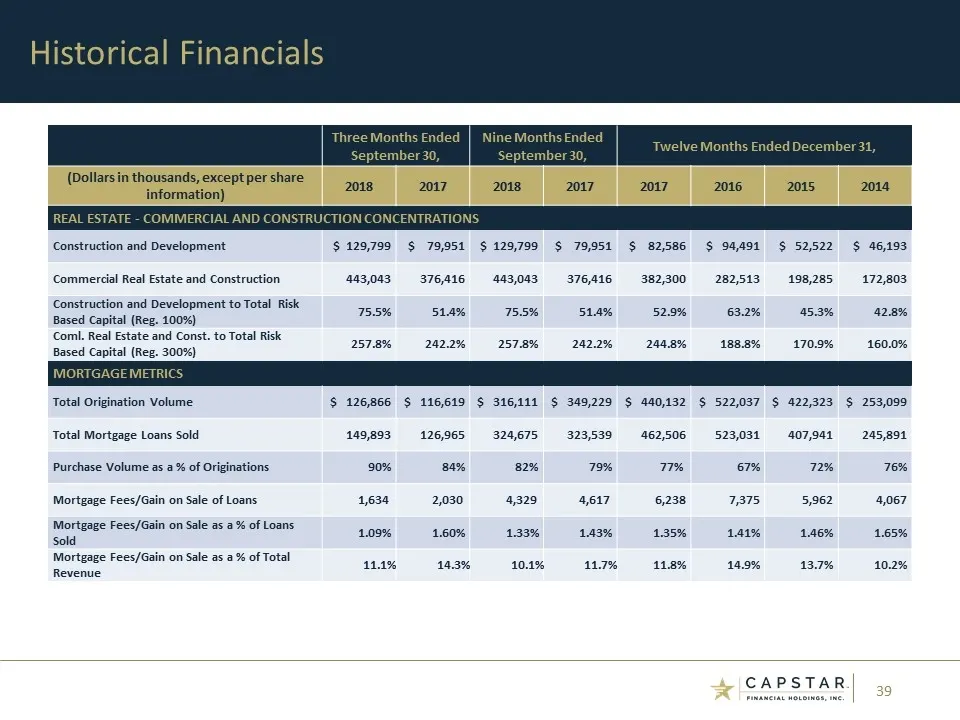
Slide 39: Historical Financials: Concentrations and Mortgage Metrics
Historical Financials Three Months Ended Nine Months Ended Twelve Months Ended December 31, September 30, September 30, (Dollars in thousands, except per share information) 2018 2017 2018 2017 2017 2016 2015 2014 REAL ESTATE - COMMERCIAL AND CONSTRUCTION CONCENTRATIONS Construction and Development $
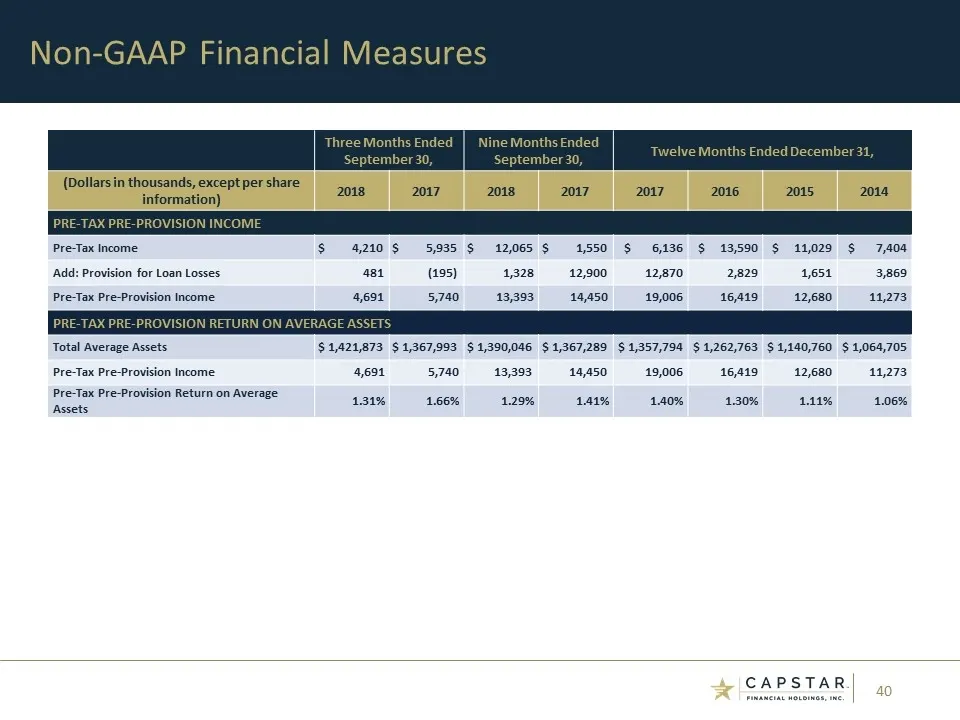
Slide 40: Pre-Tax Pre-Provision Income
Three Months Ended September 30, Nine Months Ended September 30, Twelve Months Ended December 31, (Dollars in thousands, except per share information) 2018 2017 2018 2017 2017 2016 2015 2014 PRE-TAX PRE-PROVISION INCOME Pre-Tax Income $ 4,210 $ 5,935 $ 12,065 $ 1,550 $ 6,136 $ 13,590 $ 11,029 $ 7,40
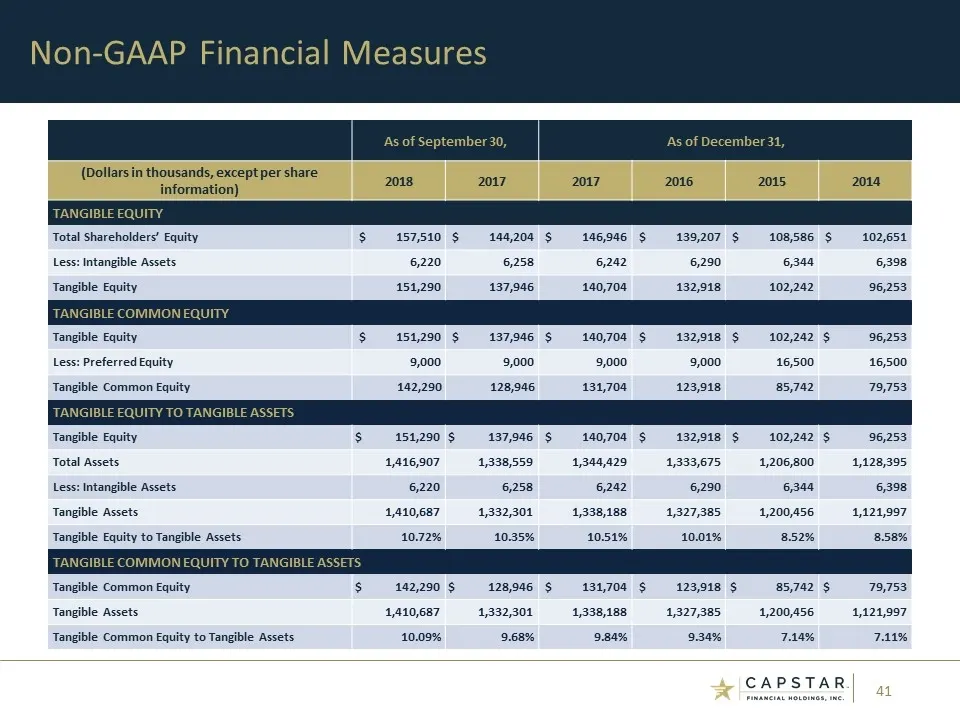
Slide 41: Tangible Equity Reconciliation
As of September 30, As of December 31, (Dollars in thousands, except per share information) 2018 2017 2017 2016 2015 2014 TANGIBLE EQUITY Total Shareholders’ Equity $ 157,510 $ 144,204 $ 146,946 $ 139,207 $ 108,586 $ 102,651 Less: Intangible Assets 6,220 6,258 6,242 6,290 6,344 6,398 Tangible Equity
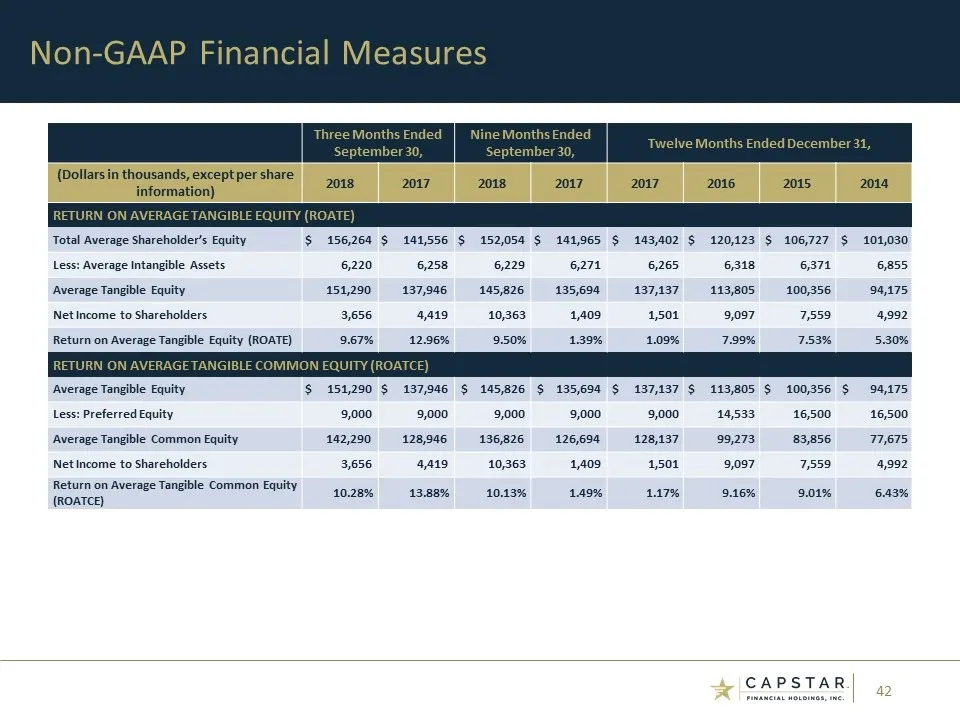
Slide 42: Return on Average Tangible Equity
Three Months Ended September 30, Nine Months Ended September 30, Twelve Months Ended December 31, (Dollars in thousands, except per share information) 2018 2017 2018 2017 2017 2016 2015 2014 RETURN ON AVERAGE TANGIBLE EQUITY (ROATE) Total Average Shareholder’s Equity $ 156,264 $ 141,556 $ 152,054 $
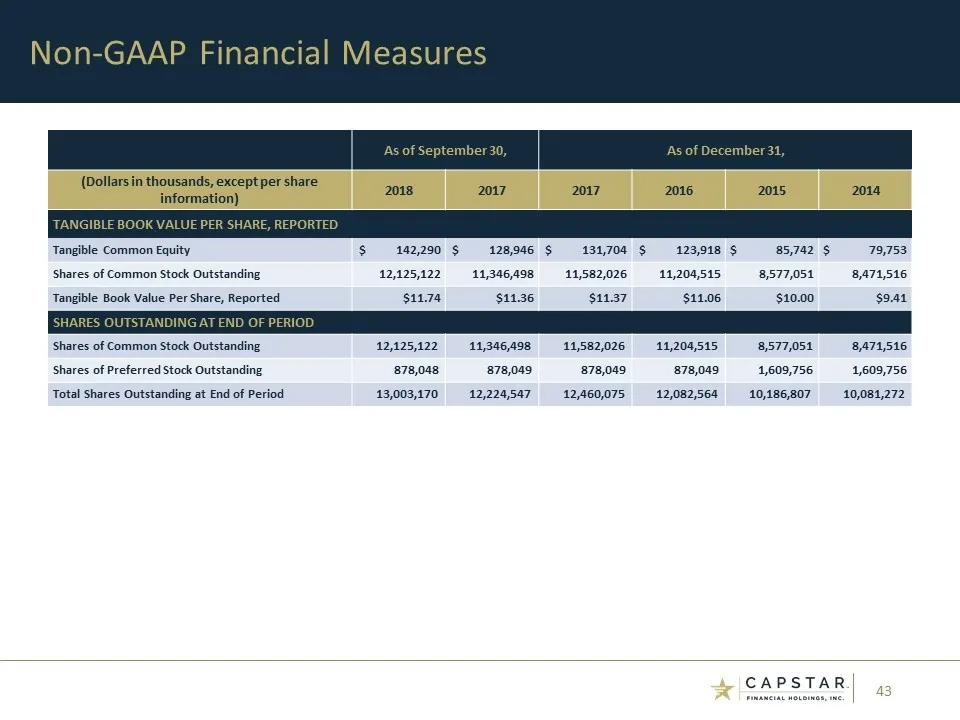
Slide 43: Tangible Book Value Per Share
As of September 30, As of December 31, (Dollars in thousands, except per share information) 2018 2017 2017 2016 2015 2014 TANGIBLE BOOK VALUE PER SHARE, REPORTED Tangible Common Equity $ 142,290 $ 128,946 $ 131,704 $ 123,918 $ 85,742 $ 79,753 Shares of Common Stock Outstanding 12,125,122 11,346,498
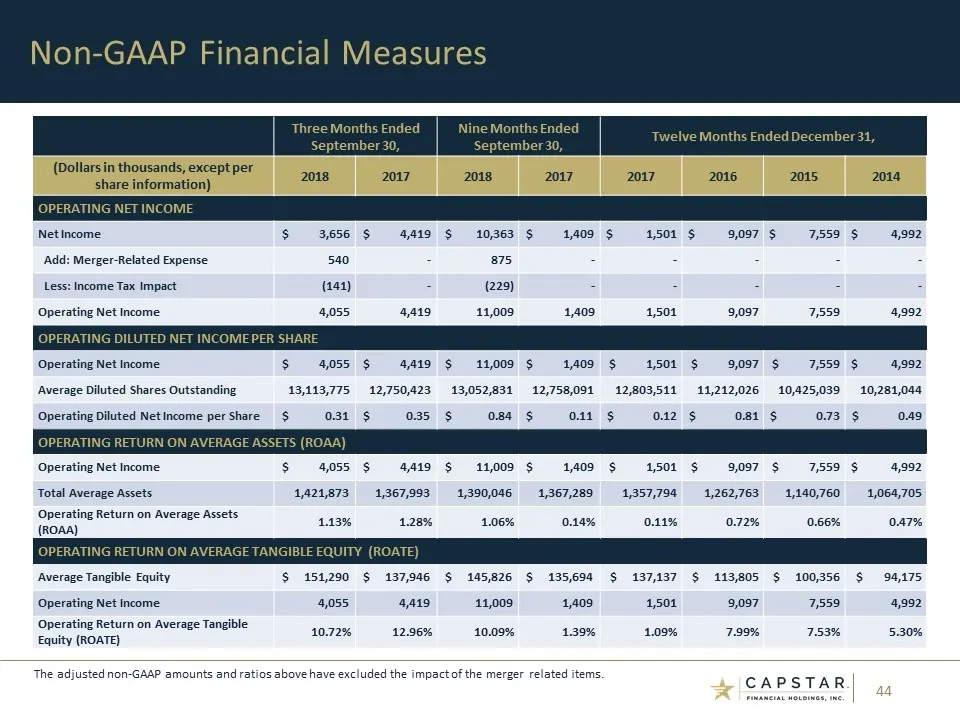
Slide 44: Operating Net Income
Three Months Ended September 30, Nine Months Ended September 30, Twelve Months Ended December 31, (Dollars in thousands, except per share information) 2018 2017 2018 2017 2017 2016 2015 2014 OPERATING NET INCOME Net Income $ 3,656 $ 4,419 $ 10,363 $ 1,409 $ 1,501 $ 9,097 $ 7,559 $ 4,992 Add: Merger-
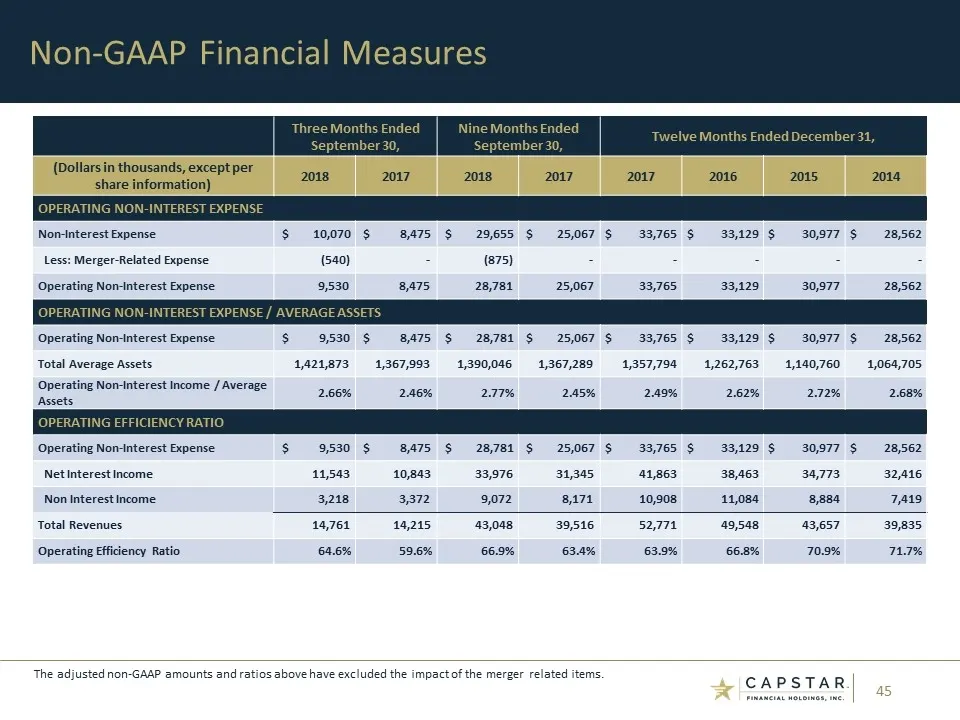
Slide 45: Operating Non-Interest Expense
Three Months Ended September 30, Nine Months Ended September 30, Twelve Months Ended December 31, (Dollars in thousands, except per share information) 2018 2017 2018 2017 2017 2016 2015 2014 OPERATING NON-INTEREST EXPENSE Non-Interest Expense $ 10,070 $ 8,475 $ 29,655 $ 25,067 $ 33,765 $ 33,129 $ 30
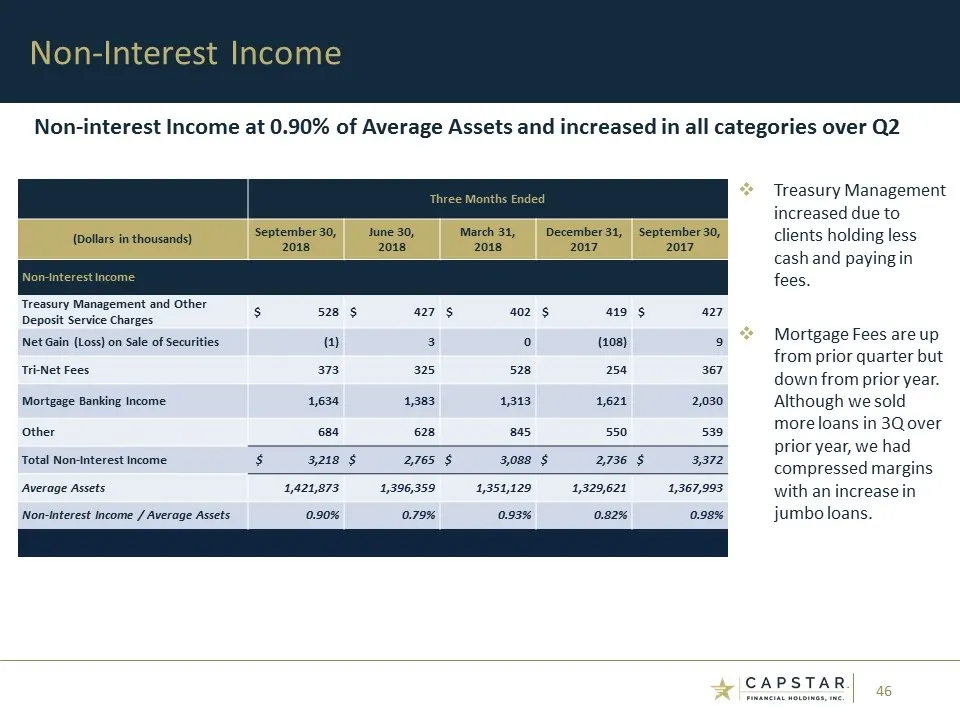
Slide 46: Non-Interest Income
Non-Interest Income Treasury Management increased due to clients holding less cash and paying in fees. Mortgage Fees are up from prior quarter but down from prior year. Although we sold more loans in 3Q over prior year, we had compressed margins with an increase in jumbo loans. Three Months Ended (D
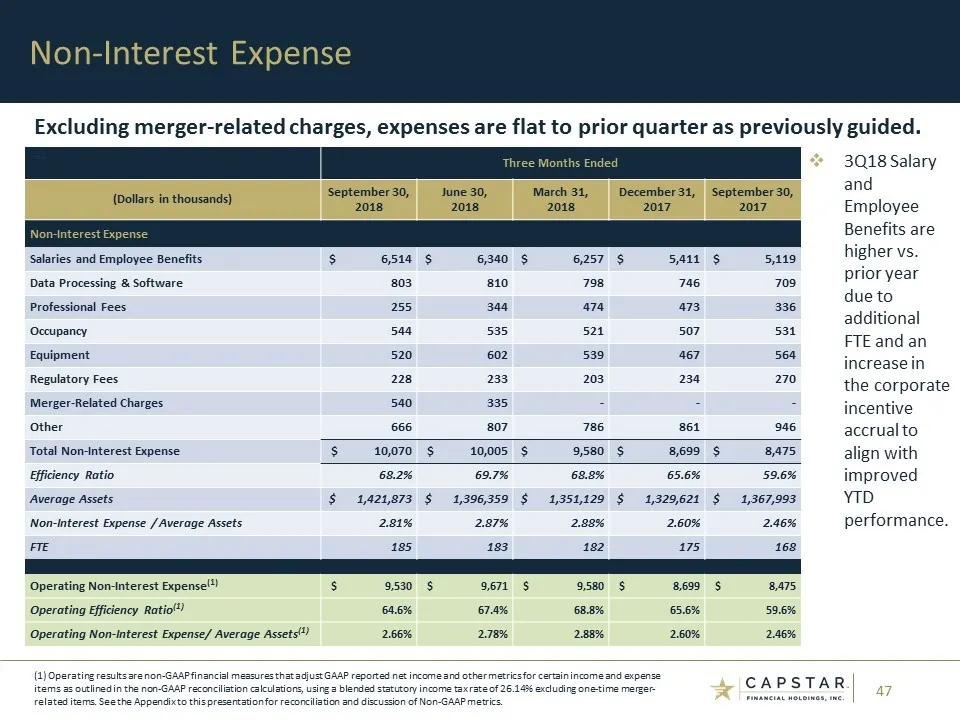
Slide 47: Non-Interest Expense
Non-Interest Expense .42 Three Months Ended (Dollars in thousands) September 30, June 30, March 31, December 31, September 30, 2018 2018 2018 2017 2017 Non-Interest Expense Salaries and Employee Benefits $ 6,514 $ 6,340 $ 6,257 $ 5,411 $ 5,119 Data Processing & Software 803 810 798 746 709 Professio
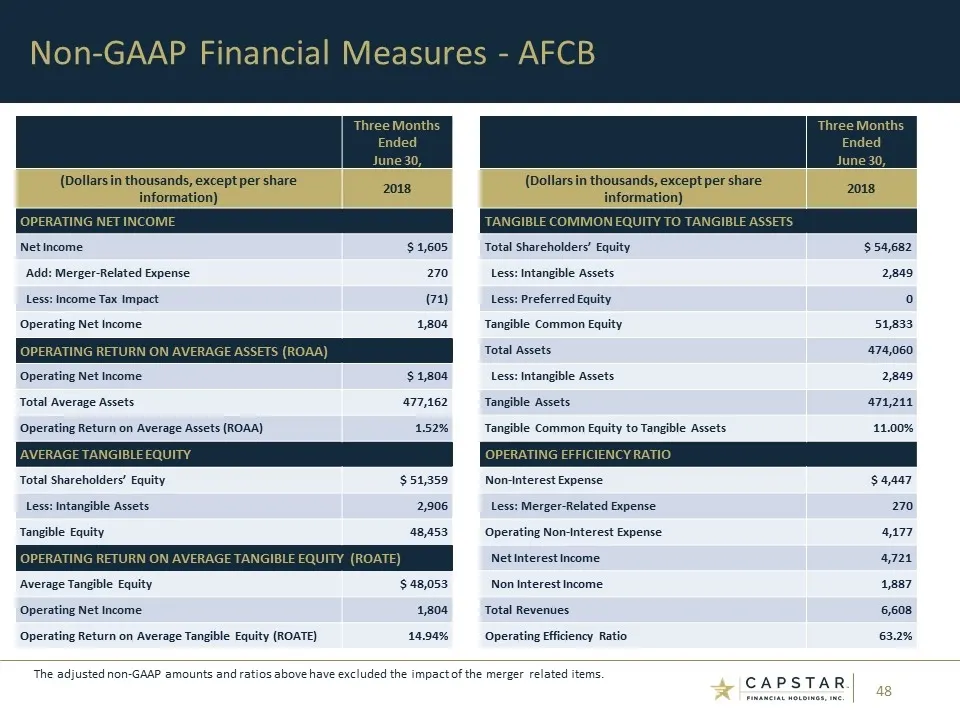
Slide 48: Non-GAAP Financial Measures - AFCB
Three Months Ended June 30, (Dollars in thousands, except per share information) 2018 OPERATING NET INCOME Net Income $ 1,605 Add: Merger-Related Expense 270 Less: Income Tax Impact (71) Operating Net Income 1,804 OPERATING RETURN ON AVERAGE ASSETS (ROAA) Operating Net Income $ 1,804 Total Average A

Slide 49: CapStar Financial Holdings, Inc.
+ CAPSTAR. | FINANCIAL HOLDINGS, INC.
Source: SEC EDGAR · 8-K filed Nov 6, 2018
More decks from Capstar Financial Holdings Inc
 Q4 2023 Earnings Presentation6 slides · Jan 23, 2024
 Merger or Acquisition (October 2023)16 slides · Oct 26, 2023
 Q2 2023 Earnings Presentation22 slides · Jul 21, 2023
 Q1 2023 Earnings Presentation32 slides · Apr 21, 2023
 Q4 2022 Earnings Presentation27 slides · Jan 20, 2023
 Investor Presentation (December 2022)31 slides · Dec 13, 2022