Pioneer Energy Services — Scotia Howard Weil 2016 Energy Conference
23 slides from Pioneer Energy Services's conference presentation, Mar 22, 2016

Slide 1: Scotia Howard Weil 2016 Energy Conference
SCOTIA HOWARD WEIL 2016 ENERGY CONFERENCE March 2016
Slide 2: Forward-looking Statements
Forward-looking Statements This presentation contains various forward-looking statements and information that are based on management’s current expectations and assumptions about future events. Forward-looking statements are generally accompanied by words such as “estimate,” “project,” “predict,” “e
Slide 3: Pioneer Energy Services
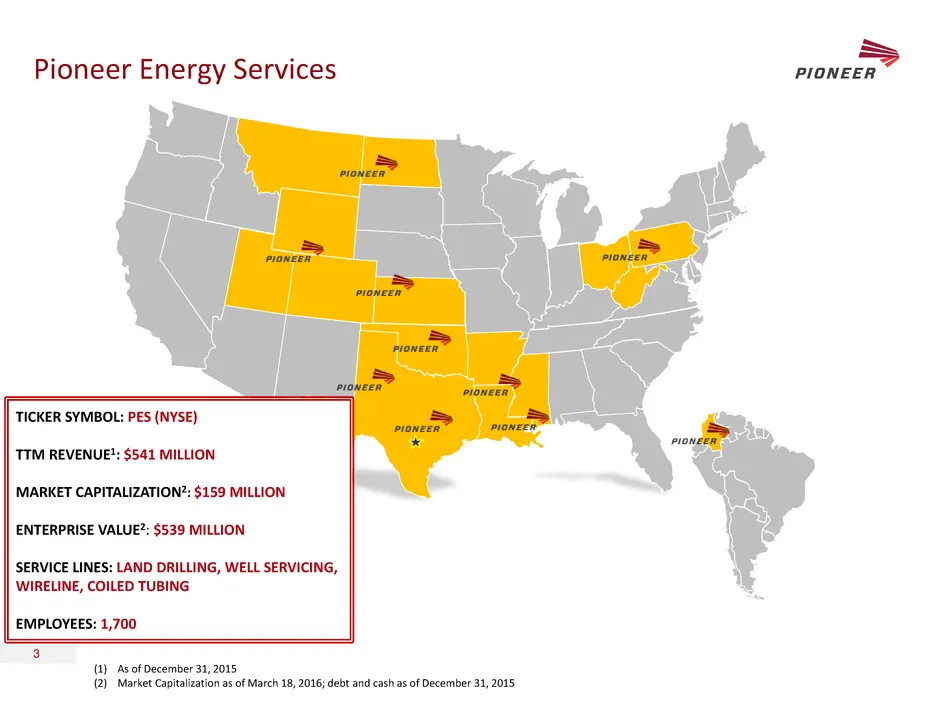
Pioneer Energy Services (1) As of December 31, 2015 (2) Market Capitalization as of March 18, 2016; debt and cash as of December 31, 2015 TICKER SYMBOL: PES (NYSE) TTM REVENUE1: $541 MILLION MARKET CAPITALIZATION2: $159 MILLION ENTERPRISE VALUE2: $539 MILLION SERVICE LINES: LAND DRILLING, WELL SERVI
Slide 4: Diversified Services
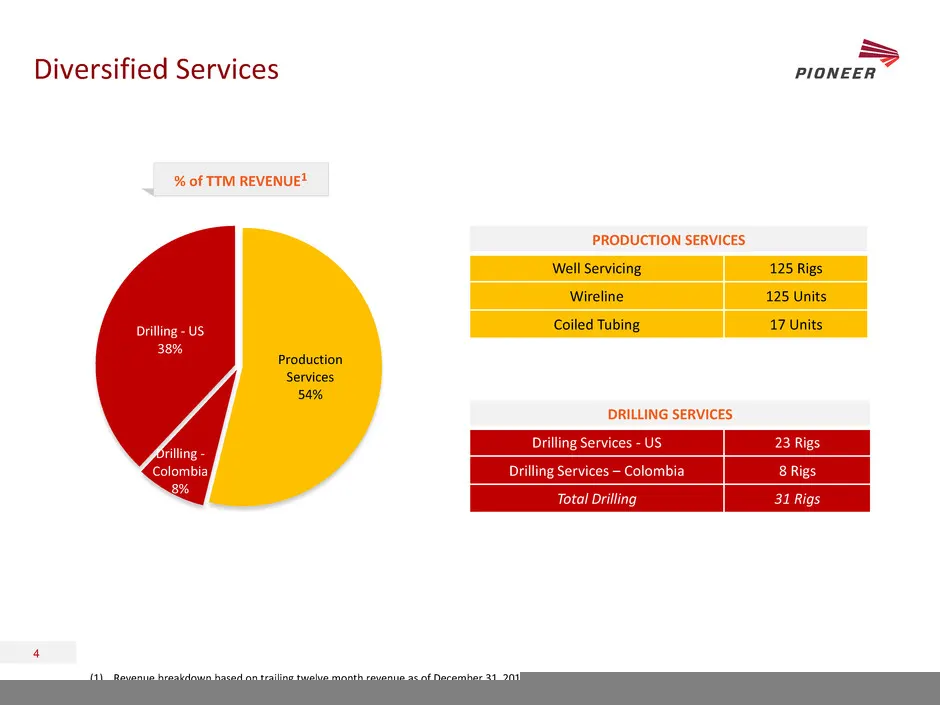
Diversified Services % of TTM REVENUE1 (1) Revenue breakdown based on trailing twelve month revenue as of December 31, 2015 of $541 million DRILLING SERVICES Drilling Services - US 23 Rigs Drilling Services – Colombia 8 Rigs Total Drilling 31 Rigs PRODUCTION SERVICES Well Servicing 125 Rigs Wireline
Slide 5: Fleet Composition
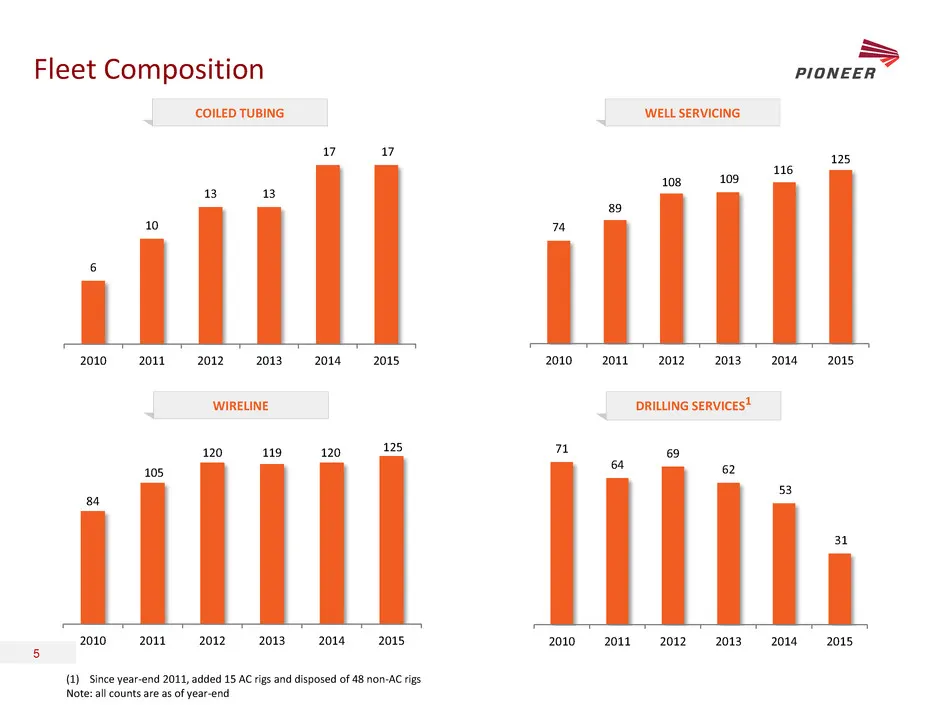
Fleet Composition DRILLING SERVICES1 WELL SERVICING WIRELINE COILED TUBING 5 (1) Since year-end 2011, added 15 AC rigs and disposed of 48 non-AC rigs Note: all counts are as of year-end 71 64 69 62 53 31 2010 2011 2012 2013 2014 2015 6 10 13 13 17 17 2010 2011 2012 2013 2014 2015 74 89 108 109 116 1
Slide 6: Recent Updates
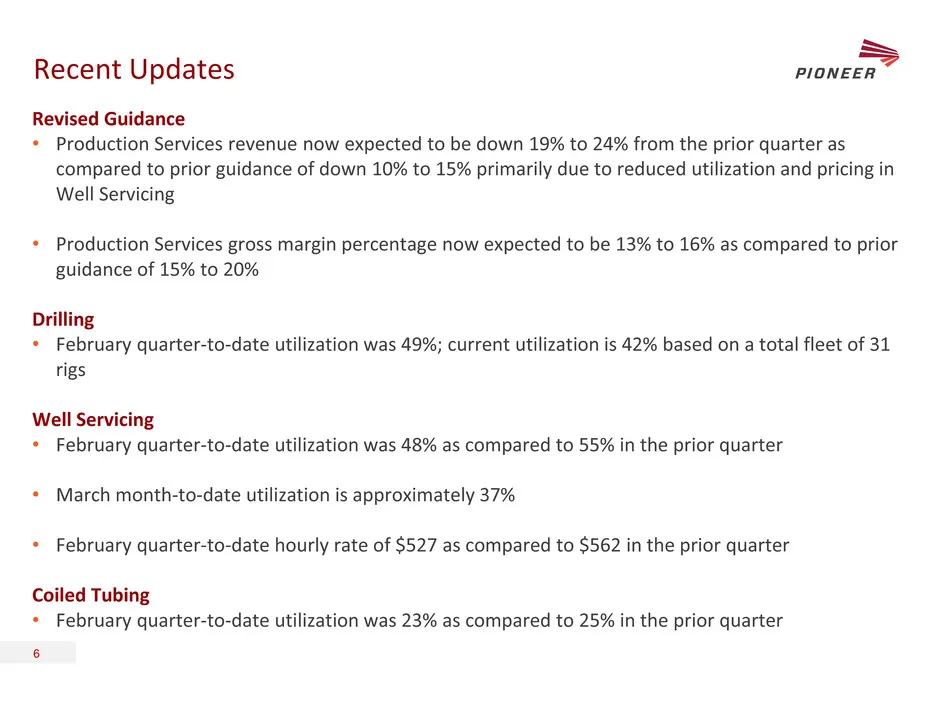
Recent Updates Revised Guidance • Production Services revenue now expected to be down 19% to 24% from the prior quarter as compared to prior guidance of down 10% to 15% primarily due to reduced utilization and pricing in Well Servicing • Production Services gross margin percentage now expected to be
Slide 7: Company Highlights
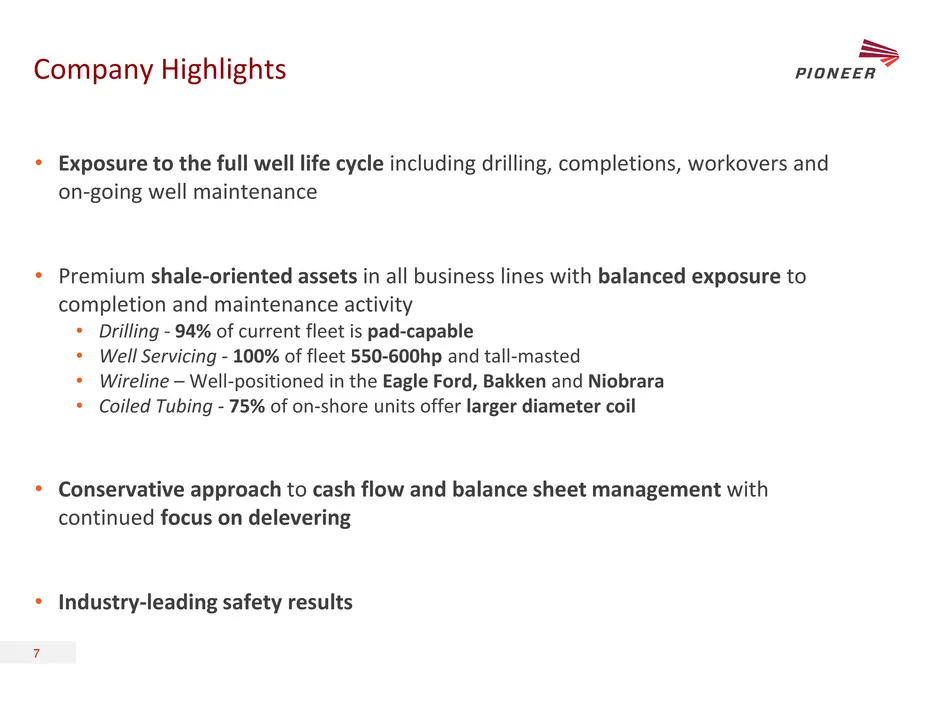
Company Highlights • Exposure to the full well life cycle including drilling, completions, workovers and on-going well maintenance • Premium shale-oriented assets in all business lines with balanced exposure to completion and maintenance activity • Drilling - 94% of current fleet is pad-capable • We
Slide 8: Exposure to the Full Well Life Cycle
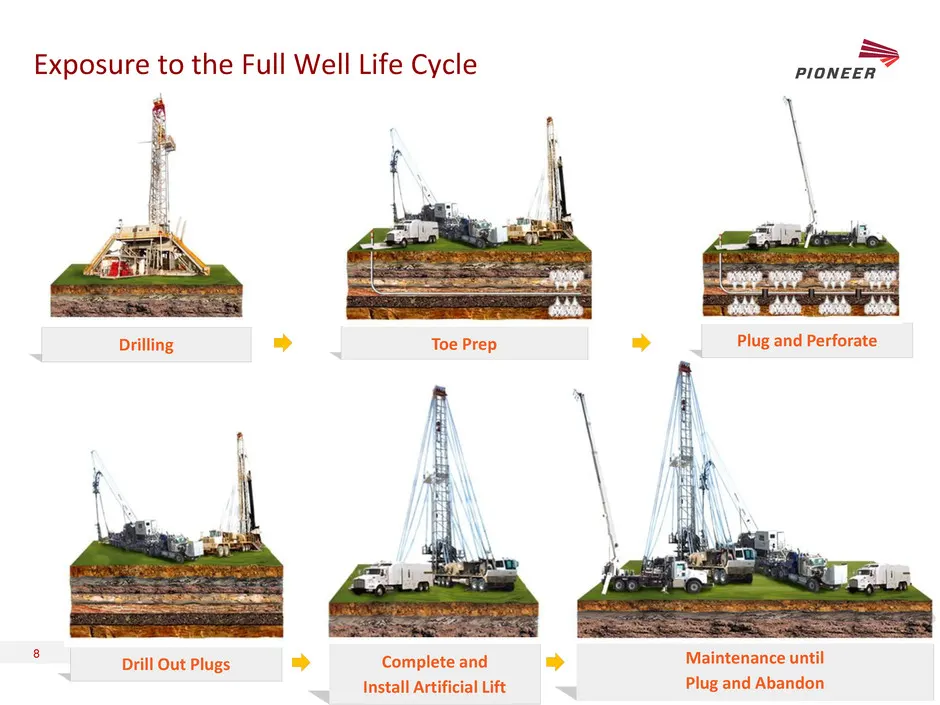
Exposure to the Full Well Life Cycle Plug and Perforate Toe Prep Drilling Maintenance until Plug and Abandon Drill Out Plugs Complete and Install Artificial Lift 8
Slide 9: Premium Shale-Oriented Assets
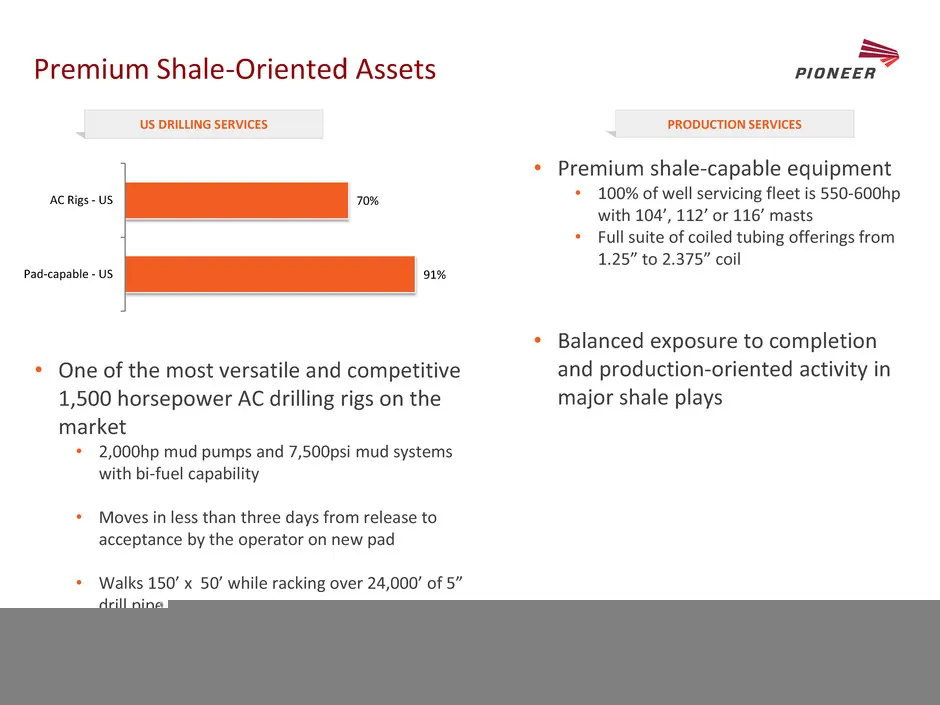
Premium Shale-Oriented Assets 9 US DRILLING SERVICES PRODUCTION SERVICES • One of the most versatile and competitive 1,500 horsepower AC drilling rigs on the market • 2,000hp mud pumps and 7,500psi mud systems with bi-fuel capability • Moves in less than three days from release to acceptance by the
Slide 10: Balance Sheet and Cash Flow Management
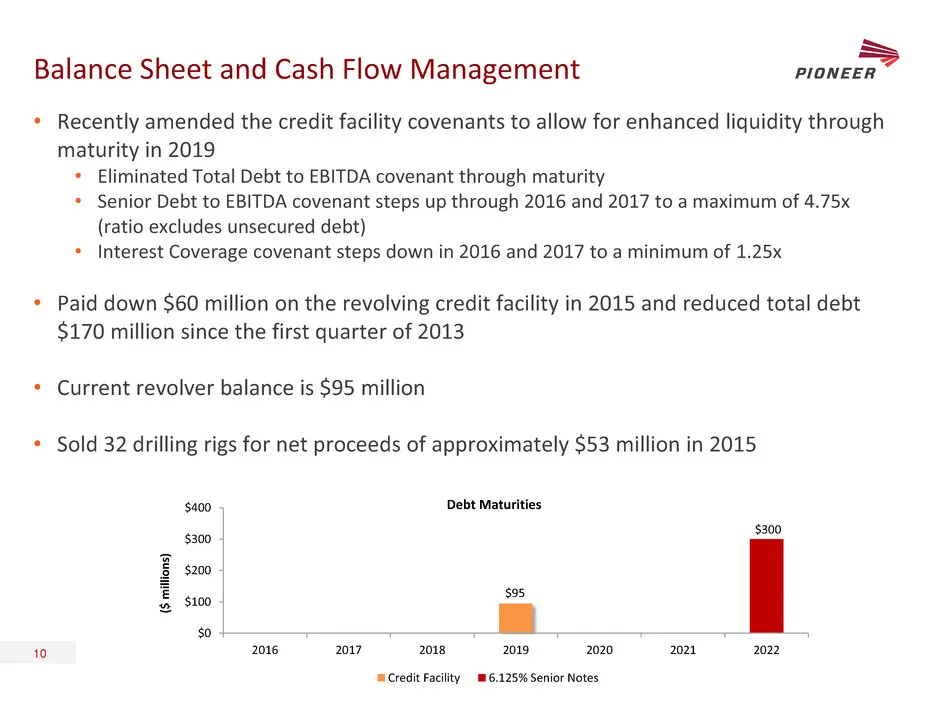
Balance Sheet and Cash Flow Management • Recently amended the credit facility covenants to allow for enhanced liquidity through maturity in 2019 • Eliminated Total Debt to EBITDA covenant through maturity • Senior Debt to EBITDA covenant steps up through 2016 and 2017 to a maximum of 4.75x (ratio ex
Slide 11: Industry-Leading Safety
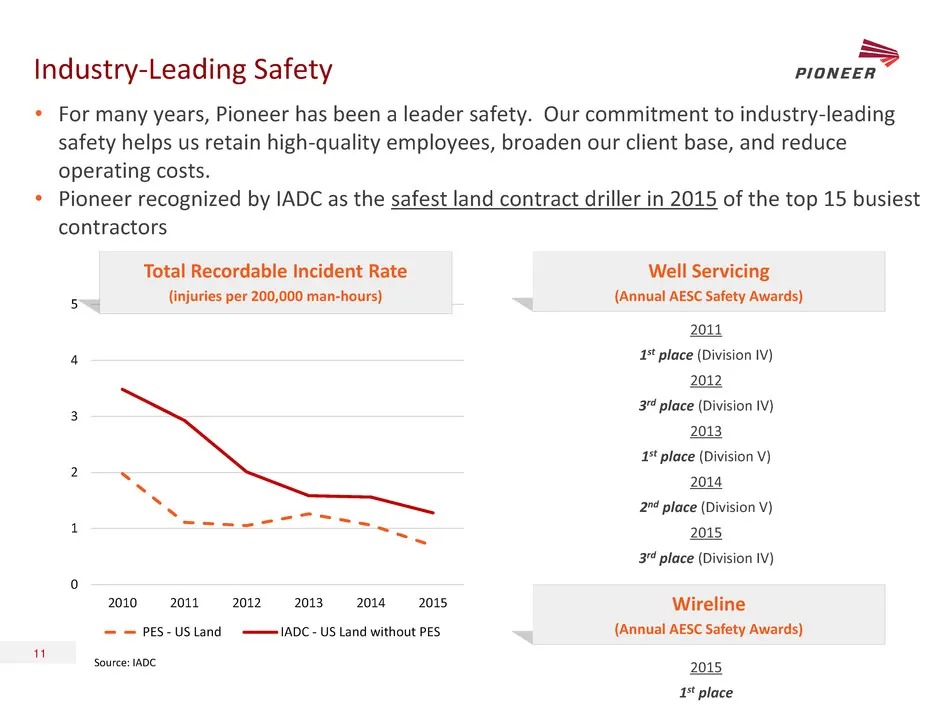
Industry-Leading Safety • For many years, Pioneer has been a leader safety. Our commitment to industry-leading safety helps us retain high-quality employees, broaden our client base, and reduce operating costs. • Pioneer recognized by IADC as the safest land contract driller in 2015 of the top 15 bu
Slide 12: Production Services
PRODUCTION SERVICES 12
Slide 13: Well Servicing
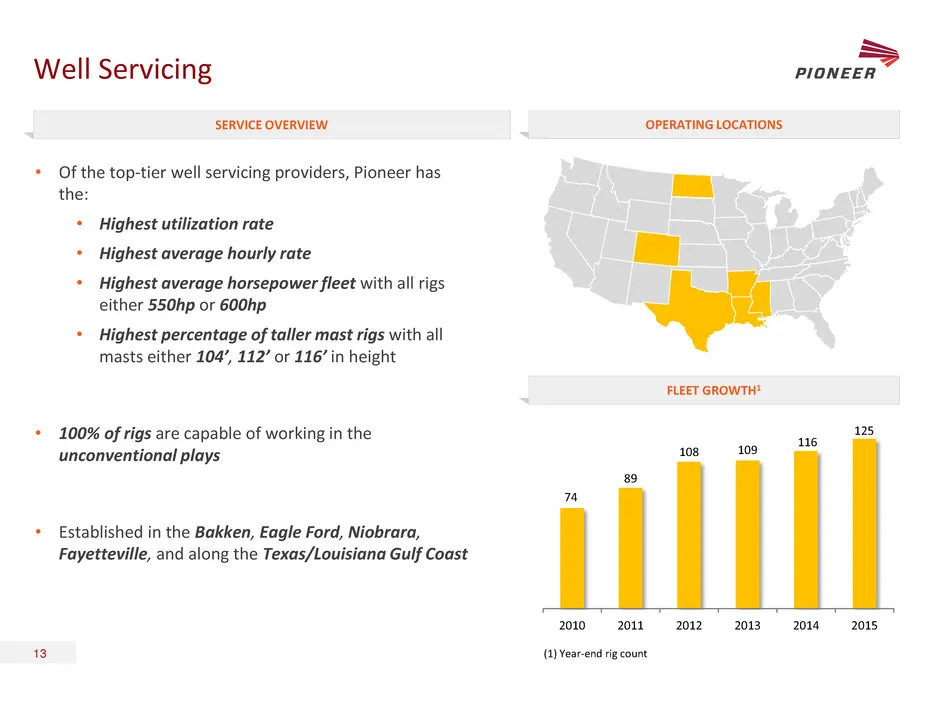
Well Servicing • Of the top-tier well servicing providers, Pioneer has the: • Highest utilization rate • Highest average hourly rate • Highest average horsepower fleet with all rigs either 550hp or 600hp • Highest percentage of taller mast rigs with all masts either 104’, 112’ or 116’ in height • 10
Slide 14: Wireline
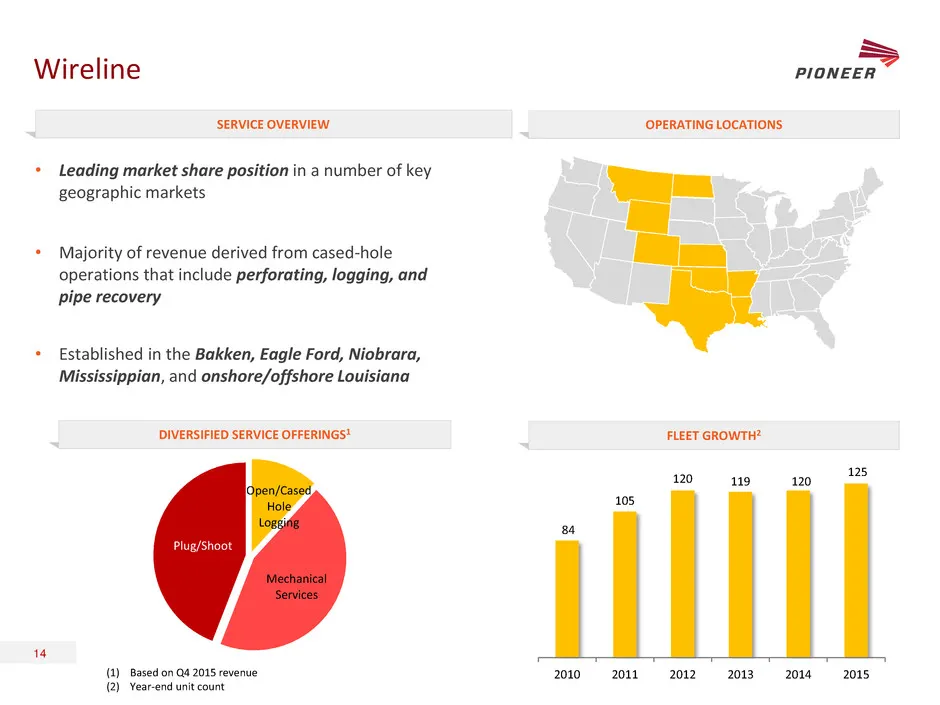
Wireline • Leading market share position in a number of key geographic markets • Majority of revenue derived from cased-hole operations that include perforating, logging, and pipe recovery • Established in the Bakken, Eagle Ford, Niobrara, Mississippian, and onshore/offshore Louisiana (1) Based on Q
Slide 15: Coiled Tubing
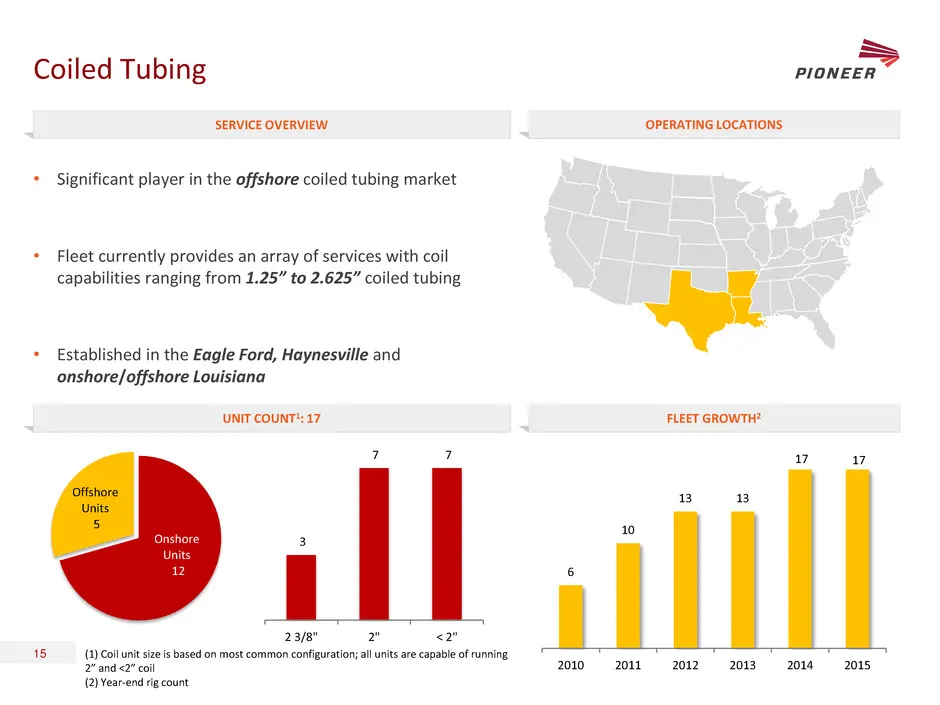
Coiled Tubing • Significant player in the offshore coiled tubing market • Fleet currently provides an array of services with coil capabilities ranging from 1.25” to 2.625” coiled tubing • Established in the Eagle Ford, Haynesville and onshore/offshore Louisiana SERVICE OVERVIEW OPERATING LOCATIONS U

Slide 16: Pioneer Drilling Services
S PIONEER DRILLING SERVICES
Slide 17: Drilling Services
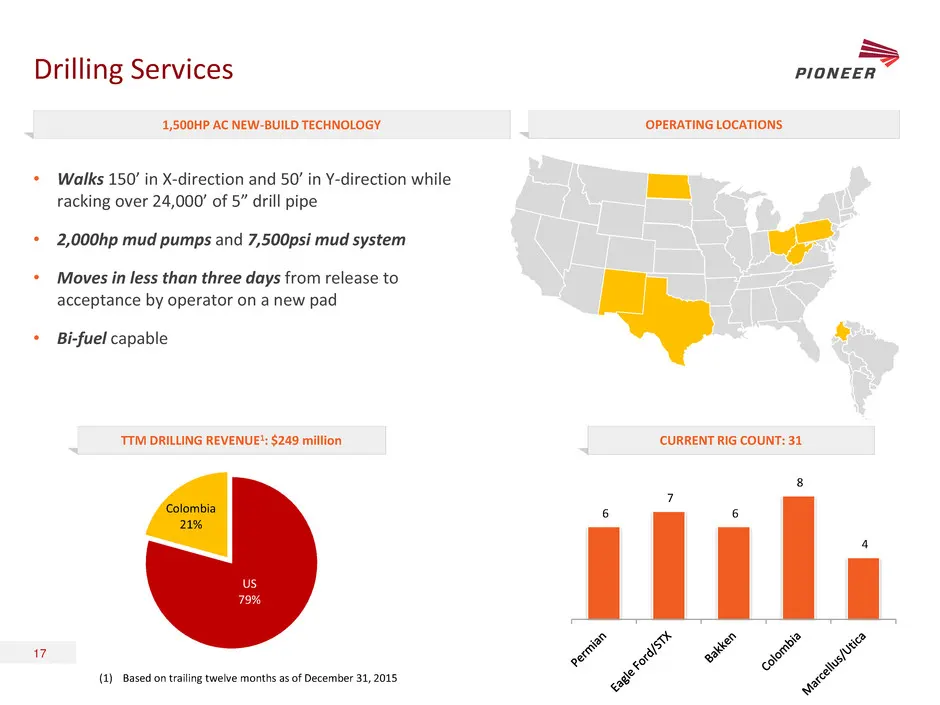
Drilling Services (1) Based on trailing twelve months as of December 31, 2015 1,500HP AC NEW-BUILD TECHNOLOGY OPERATING LOCATIONS TTM DRILLING REVENUE1: $249 million CURRENT RIG COUNT: 31 17 • Walks 150’ in X-direction and 50’ in Y-direction while racking over 24,000’ of 5” drill pipe • 2,000hp mud
Slide 18: Pioneer Drilling Rig Class Comparison
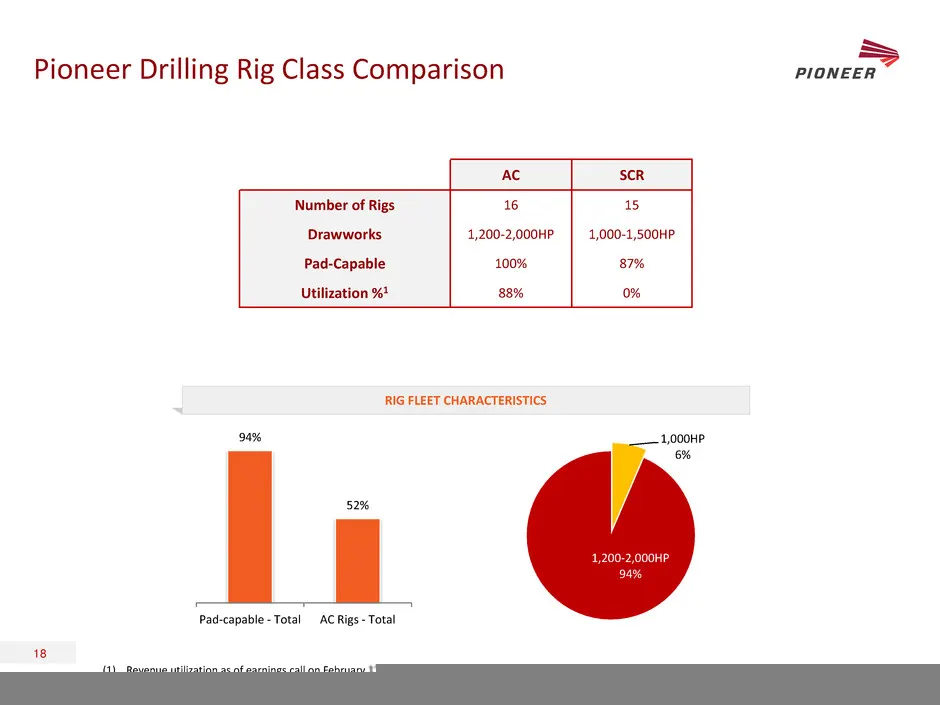
Pioneer Drilling Rig Class Comparison RIG FLEET CHARACTERISTICS AC SCR Number of Rigs 16 15 Drawworks 1,200-2,000HP 1,000-1,500HP Pad-Capable 100% 87% Utilization %1 88% 0% (1) Revenue utilization as of earnings call on February 17, 2016 18 94% 52% Pad-capable - Total AC Rigs - Total 1,000HP 6% 1,20

Slide 19: Financial Performance
FINANCIAL PERFORMANCE
Slide 20: Historical Financial Results
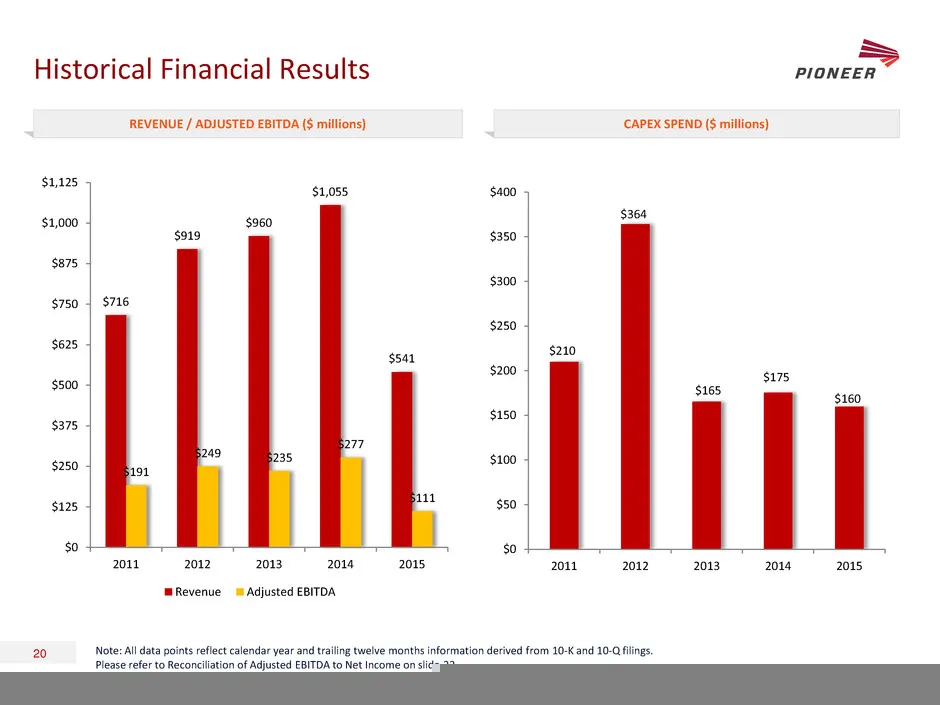
Historical Financial Results REVENUE / ADJUSTED EBITDA ($ millions) CAPEX SPEND ($ millions) Note: All data points reflect calendar year and trailing twelve months information derived from 10-K and 10-Q filings. Please refer to Reconciliation of Adjusted EBITDA to Net Income on slide 22 20 $716 $919
Slide 21: Liquidity and Capital Structure
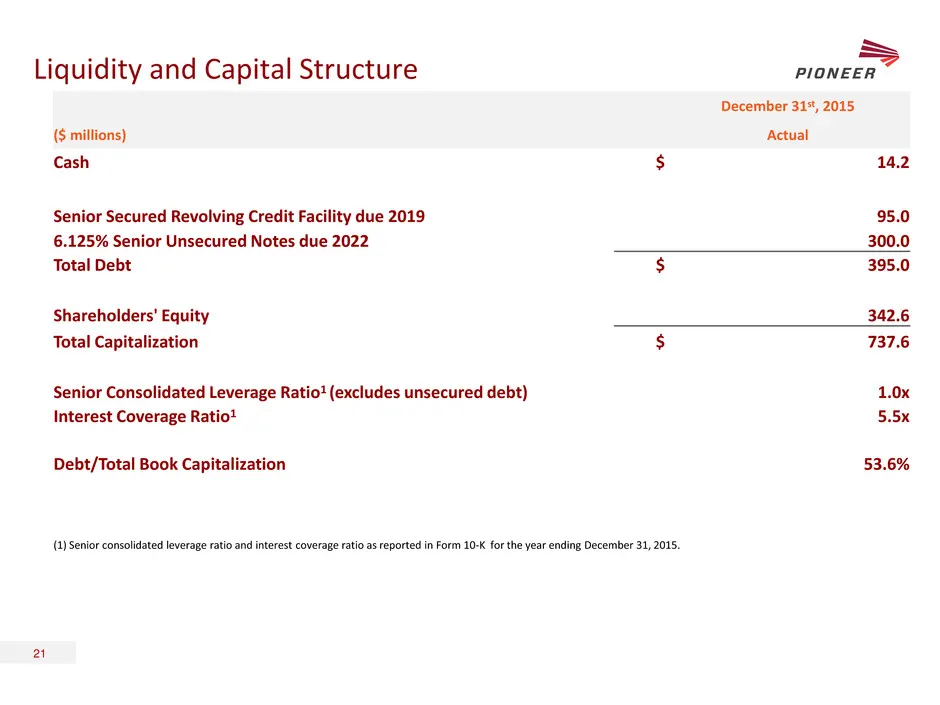
Liquidity and Capital Structure December 31st, 2015 ($ millions) Actual Cash $ 14.2 Senior Secured Revolving Credit Facility due 2019 95.0 6.125% Senior Unsecured Notes due 2022 300.0 Total Debt $ 395.0 Shareholders' Equity 342.6 Total Capitalization $ 737.6 Senior Consolidated Leverage Ratio1 (excl
Slide 22: Reconciliation of Adjusted EBITDA to Net Income
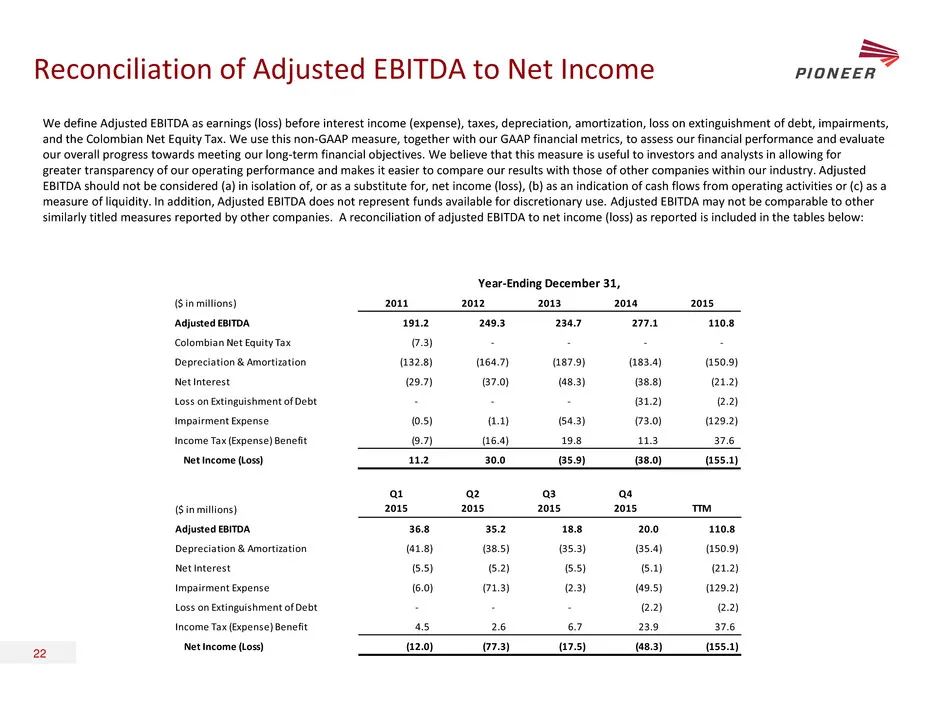
Reconciliation of Adjusted EBITDA to Net Income We define Adjusted EBITDA as earnings (loss) before interest income (expense), taxes, depreciation, amortization, loss on extinguishment of debt, impairments, and the Colombian Net Equity Tax. We use this non-GAAP measure, together with our GAAP financ
Slide 23: Pioneer
= PIONEER
Source: SEC EDGAR · 8-K filed Mar 22, 2016
More decks from Pioneer Energy Services Corp
 Merger or Acquisition (July 2021)17 slides · Jul 8, 2021
 2019 Simmons Energy Conference22 slides · Feb 27, 2019
 Goldman Sachs Global Energy Conference 201922 slides · Jan 9, 2019
 Jefferies Energy Conference 201822 slides · Nov 27, 2018
 Johnson Rice 2018 Energy Conference22 slides · Sep 26, 2018
 SGS Energy & Industrials Conference 201822 slides · Aug 28, 2018