HD Supply — Robert W. Baird & Co. 2013 Industrial Conference
23 slides from HD Supply's conference presentation, Nov 5, 2013

Slide 1: Robert W. Baird & Co. 2013 Industrial Conference
Robert W. Baird & Co. 2013 Industrial Conference November 6, 2013
Slide 2: Disclaimers
Disclaimers Forward-Looking Statements This presentation includes “forward-looking statements” within the meaning of Section 27A of the Securities Act and Section 21E of the Exchange Act. Forward-looking statements are subject to known and unknown risks and uncertainties, many of which may be beyond
Slide 3: Company Overview
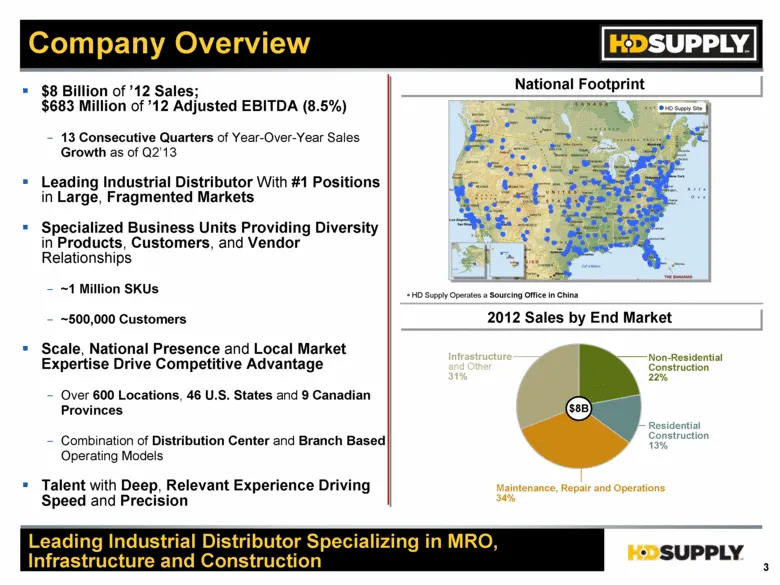
Company Overview $8 Billion of ’12 Sales; $683 Million of ’12 Adjusted EBITDA (8.5%) 13 Consecutive Quarters of Year-Over-Year Sales Growth as of Q2’13 Leading Industrial Distributor With #1 Positions in Large, Fragmented Markets Specialized Business Units Providing Diversity in Products, Customers,
Slide 4: Investment Themes
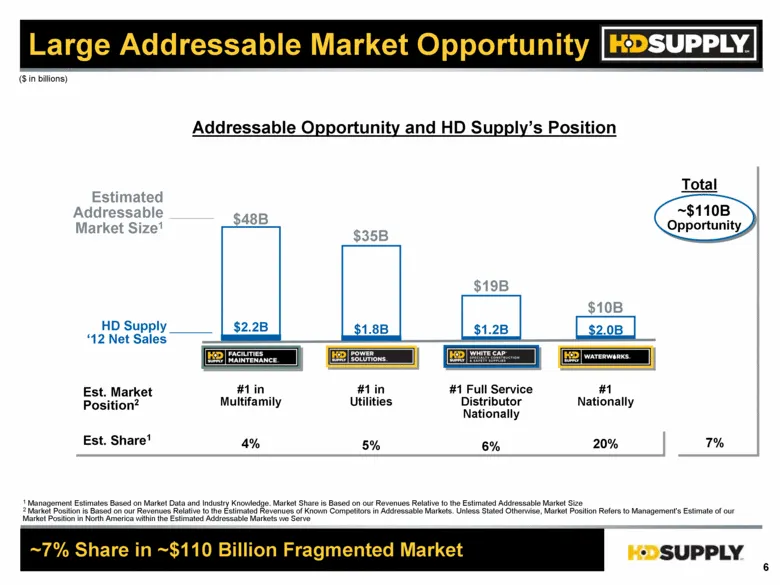
Investment Themes Trusted Local Execution, Market and Product Knowledge, Customer Relationships Based on Reliability of Service, and Supplier Alignment Based on Performance #1 Positions with ~7% Share in Estimated ~$110 Billion Fragmented Market MRO, Infrastructure and Construction End Market Exposu
Slide 5: Business Overview
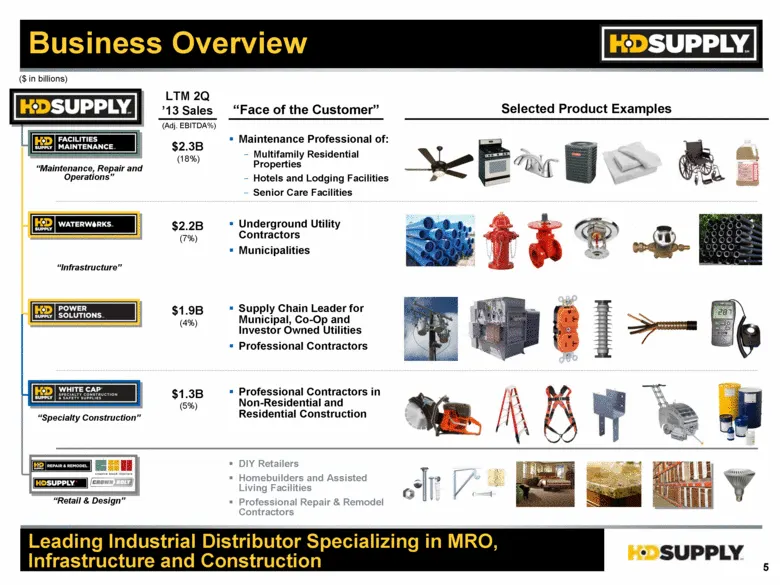
Business Overview “Maintenance, Repair and Operations” “Infrastructure” “Specialty Construction” “Retail & Design” Leading Industrial Distributor Specializing in MRO, Infrastructure and Construction Selected Product Examples Maintenance Professional of: Multifamily Residential Properties Hotels and
Slide 6: Large Addressable Market Opportunity
Large Addressable Market Opportunity Addressable Opportunity and HD Supply’s Position $48B Estimated Addressable Market Size1 HD Supply ‘12 Net Sales Est. Share1 Est. Market Position2 $2.0B $10B 20% $1.2B $19B 6% ($ in billions) $2.2B 4% #1 in Multifamily $35B 5% $1.8B #1 in Utilities #1 Full Servic
Slide 7: Key Growth Strategies
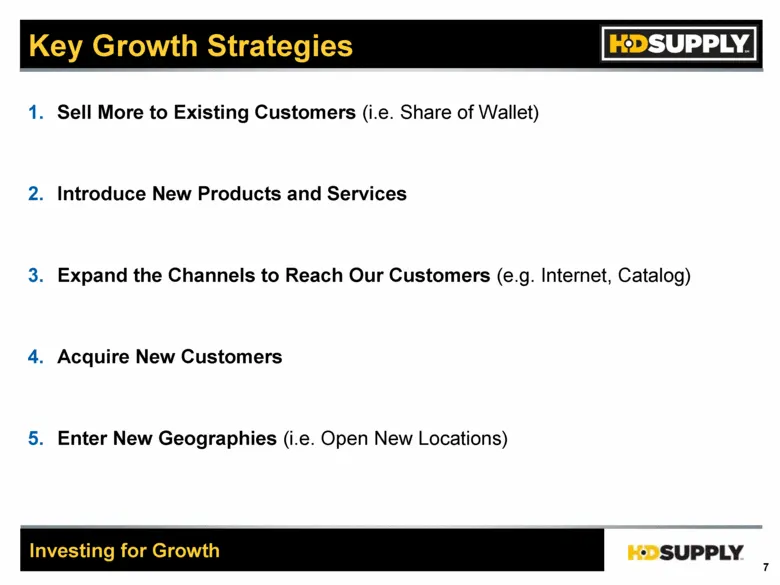
Key Growth Strategies Sell More to Existing Customers (i.e. Share of Wallet) Introduce New Products and Services Expand the Channels to Reach Our Customers (e.g. Internet, Catalog) Acquire New Customers Enter New Geographies (i.e. Open New Locations) Investing for Growth
Slide 8: Financial Summary
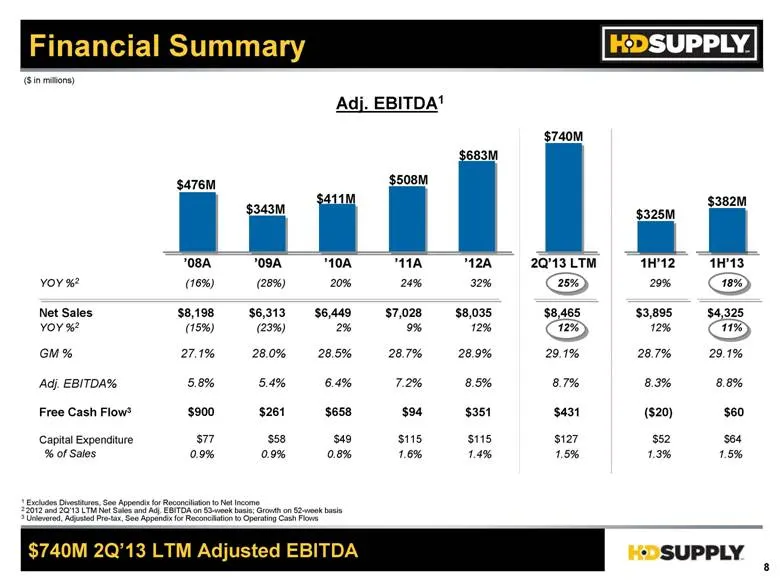
1 Excludes Divestitures, See Appendix for Reconciliation to Net Income 2 2012 and 2Q’13 LTM Net Sales and Adj. EBITDA on 53-week basis; Growth on 52-week basis 3 Unlevered, Adjusted Pre-tax, See Appendix for Reconciliation to Operating Cash Flows Adj. EBITDA1 ’08A ’09A ’10A ’12A ’11A $476M $343M $41
Slide 9: End Market Commentary
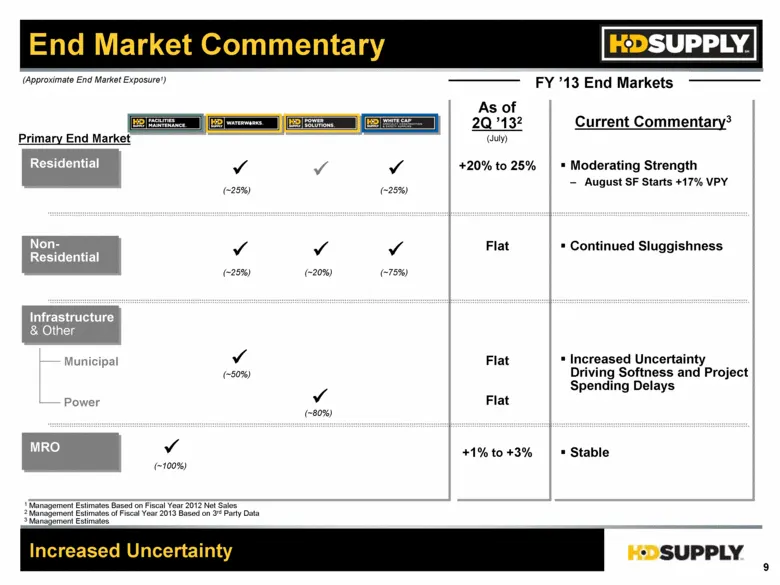
End Market Commentary Increased Uncertainty Current Commentary3 Residential Non- Residential Infrastructure & Other MRO Municipal Power 1 Management Estimates Based on Fiscal Year 2012 Net Sales 2 Management Estimates of Fiscal Year 2013 Based on 3rd Party Data 3 Management Estimates (~20%) (~80%) (
Slide 10: Q3'13 Monthly Sales (%)
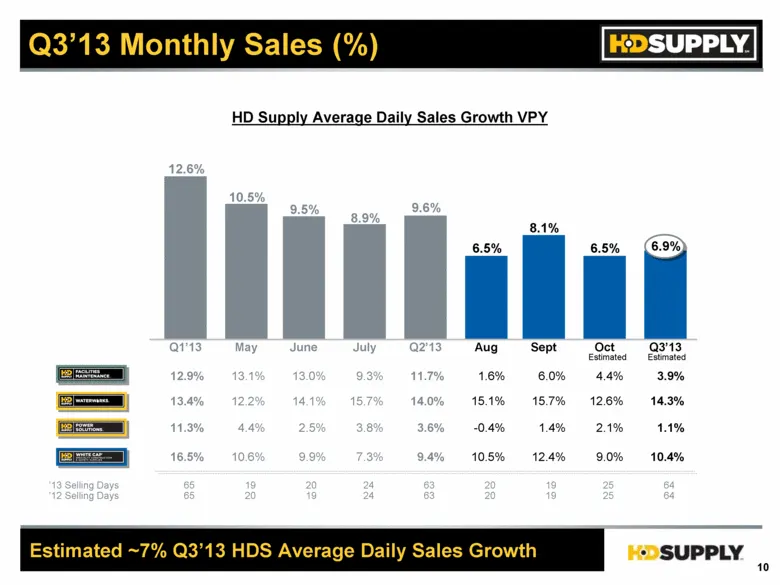
Q3’13 Monthly Sales (%) HD Supply Average Daily Sales Growth VPY Estimated ~7% Q3’13 HDS Average Daily Sales Growth ’13 Selling Days ’12 Selling Days 12.9% 13.4% 11.3% 16.5% 65 65 13.1% 12.2% 4.4% 10.6% 19 20 13.0% 14.1% 2.5% 9.9% 20 19 9.3% 15.7% 3.8% 7.3% 24 24 11.7% 14.0% 3.6% 9.4% 63 63 1.6% 15.
Slide 11: Execution Focus
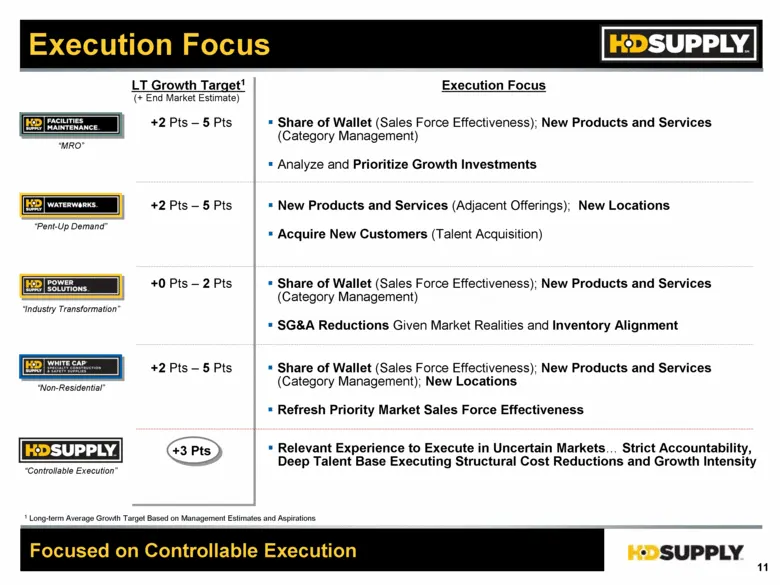
Execution Focus Focused on Controllable Execution Execution Focus LT Growth Target1 Share of Wallet (Sales Force Effectiveness); New Products and Services (Category Management) Analyze and Prioritize Growth Investments (+ End Market Estimate) +2 Pts – 5 Pts +2 Pts – 5 Pts +2 Pts – 5 Pts +0 Pts – 2 P
Slide 12: Concluding Remarks
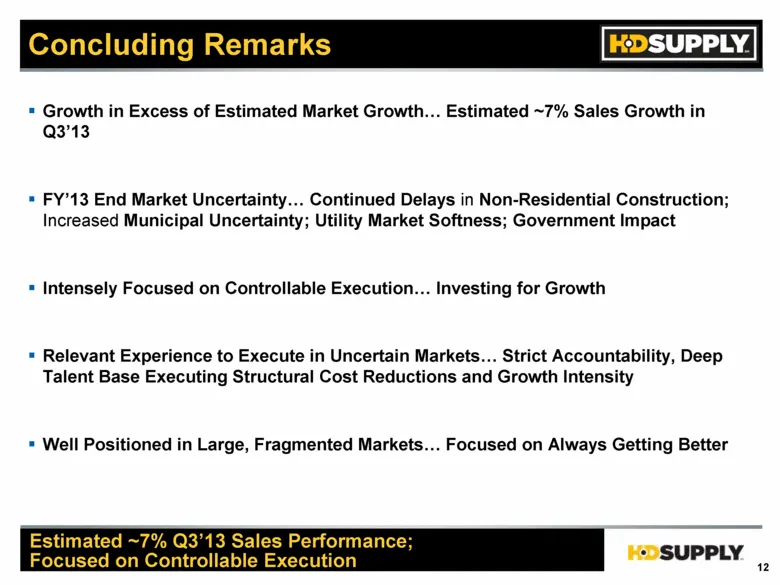
Concluding Remarks Growth in Excess of Estimated Market Growth Estimated ~7% Sales Growth in Q3’13 FY’13 End Market Uncertainty Continued Delays in Non-Residential Construction; Increased Municipal Uncertainty; Utility Market Softness; Government Impact Intensely Focused on Controllable Execution In

Slide 13: Appendix
-*DSUPPLY. Appendix
Slide 14: Q3'13 Monthly Net Sales ($)
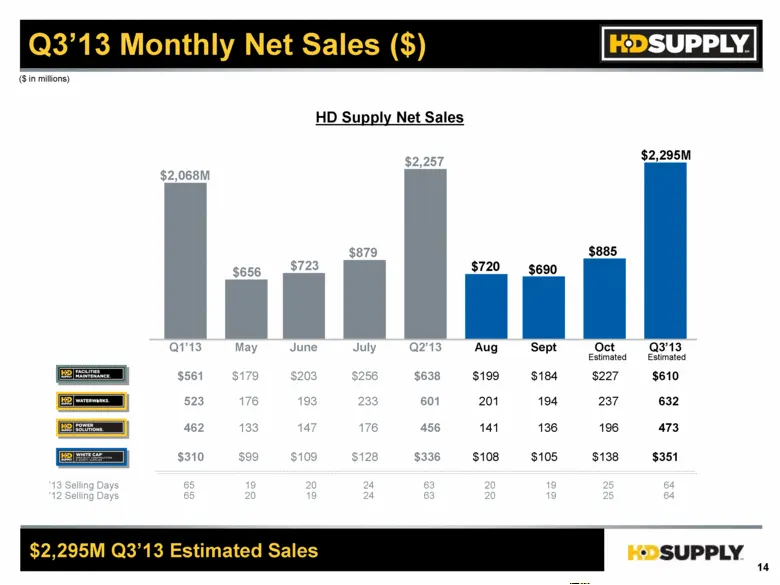
Q3’13 Monthly Net Sales ($) HD Supply Net Sales $2,295M Q3’13 Estimated Sales ’13 Selling Days ’12 Selling Days $561 523 462 $310 65 65 19 20 20 19 24 24 63 63 20 20 19 19 25 25 64 64 Q1’13 $2,068M May $656 June $723 July $879 Q2’13 $2,257 Aug $720 Sept $690 Oct $885 Q3’13 $2,295M ($ in millions) $1
Slide 15: Q3'13 Monthly Sales – Organic (%)
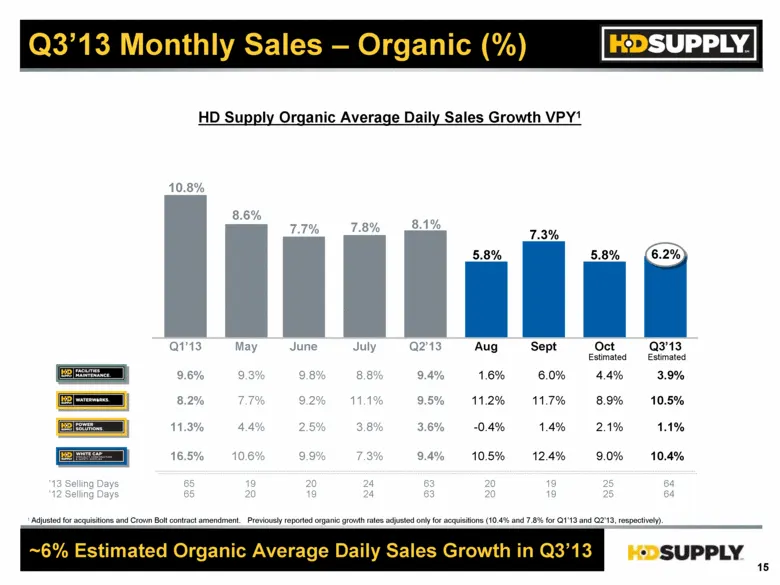
Q3’13 Monthly Sales – Organic (%) HD Supply Organic Average Daily Sales Growth VPY1 ~6% Estimated Organic Average Daily Sales Growth in Q3’13 ’13 Selling Days ’12 Selling Days Q1’13 10.8% 9.6% 8.2% 11.3% 16.5% 65 65 May 8.6% 9.3% 7.7% 4.4% 10.6% 19 20 June 7.7% 9.8% 9.2% 2.5% 9.9% 20 19 July 7.8% 8.
Slide 16: Organic Average Daily Sales Growth VPY
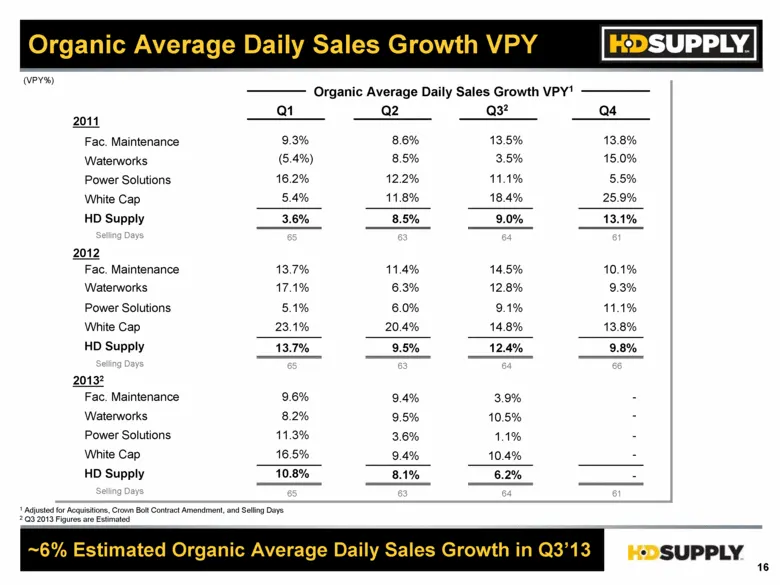
Organic Average Daily Sales Growth VPY ~6% Estimated Organic Average Daily Sales Growth in Q3’13 Q1 9.6% 9.4% 8.2% 9.5% 11.3% 3.6% 16.5% 9.4% 10.8% 8.1% 2011 2012 20132 Q2 Q32 Q4 Fac. Maintenance Waterworks Power Solutions White Cap HD Supply Fac. Maintenance Waterworks Power Solutions White Cap HD
Slide 17: Illustrative Adjusted EPS Calculation (Q3'13)
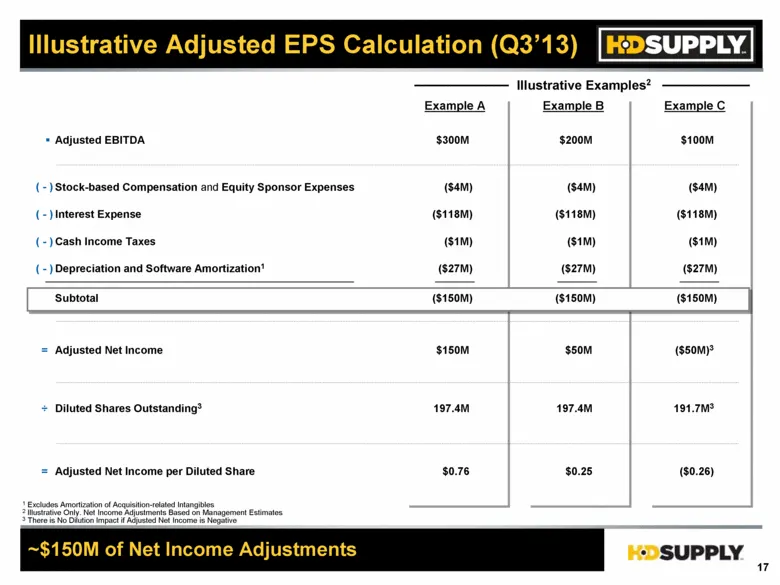
Illustrative Adjusted EPS Calculation (Q3’13) Adjusted EBITDA Stock-based Compensation and Equity Sponsor Expenses Interest Expense Cash Income Taxes Depreciation and Software Amortization1 1 Excludes Amortization of Acquisition-related Intangibles 2 Illustrative Only. Net Income Adjustments Based o
Slide 18: Historical Reported Net Sales
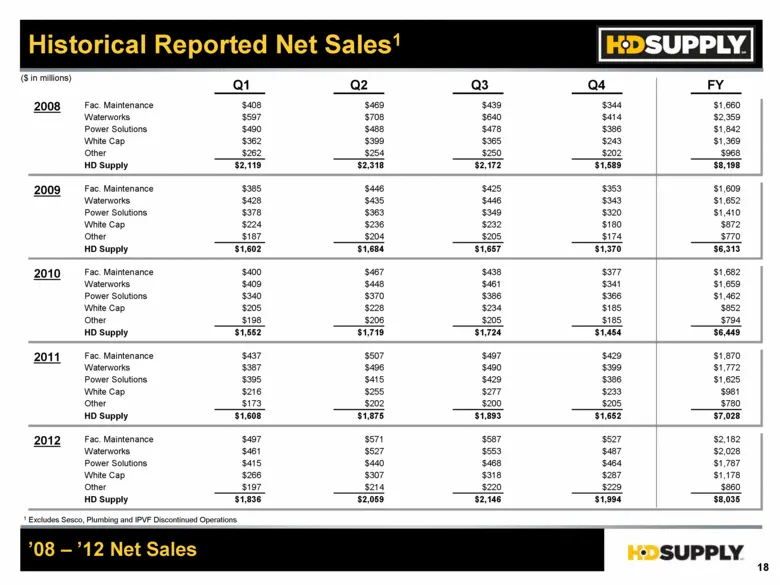
Historical Reported Net Sales1 Q1 Q2 Q3 Q4 FY 2008 Fac. Maintenance Waterworks Power Solutions White Cap HD Supply Other $408 $597 $490 $362 $2,119 $262 $469 $708 $488 $399 $2,318 $254 $439 $640 $478 $365 $2,172 $250 $344 $414 $386 $243 $1,589 $202 $1,660 $2,359 $1,842 $1,369 $8,198 $968 2009 Fac. M
Slide 19: Historical Adjusted EBITDA
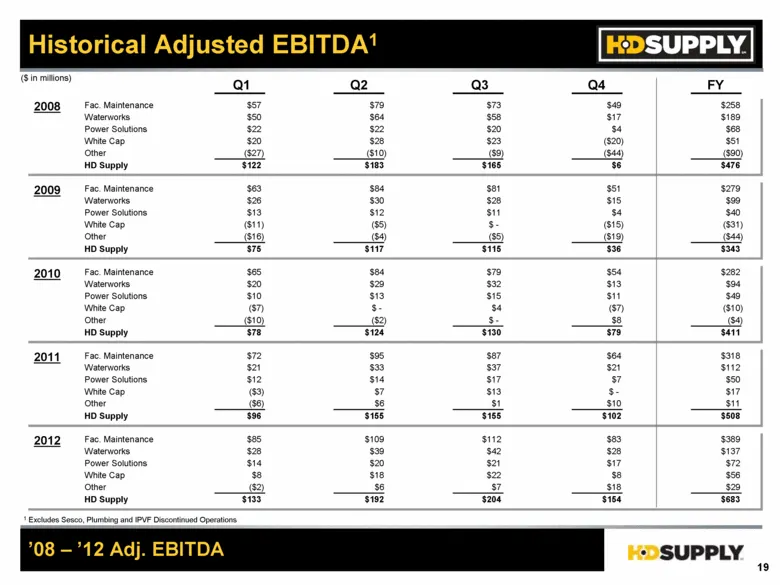
Historical Adjusted EBITDA1 ($ in millions) Q1 Q2 Q3 Q4 FY 2008 Fac. Maintenance Waterworks Power Solutions White Cap HD Supply Other $57 $50 $22 $20 $122 ($27) $79 $64 $22 $28 $183 ($10) $73 $58 $20 $23 $165 ($9) $49 $17 $4 ($20) $6 ($44) $258 $189 $68 $51 $476 ($90) 2009 Fac. Maintenance Waterwork
Slide 20: Reconciliation of Non-GAAP Measures: Net Income to Adj EBITDA
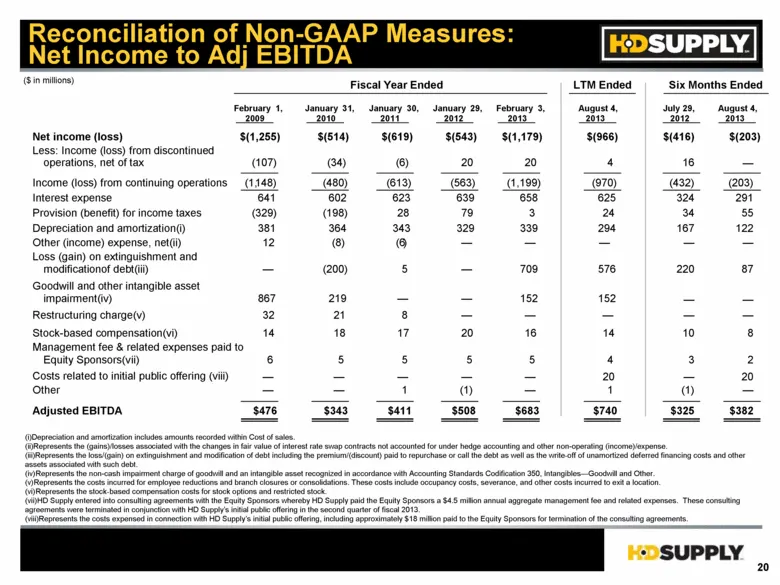
Reconciliation of Non-GAAP Measures: Net Income to Adj EBITDA (i) Depreciation and amortization includes amounts recorded within Cost of sales. (ii) Represents the (gains)/losses associated with the changes in fair value of interest rate swap contracts not accounted for under hedge accounting and ot
Slide 21: Reconciliation of Non-GAAP Measures: Net Income to Adj EBITDA (continued)
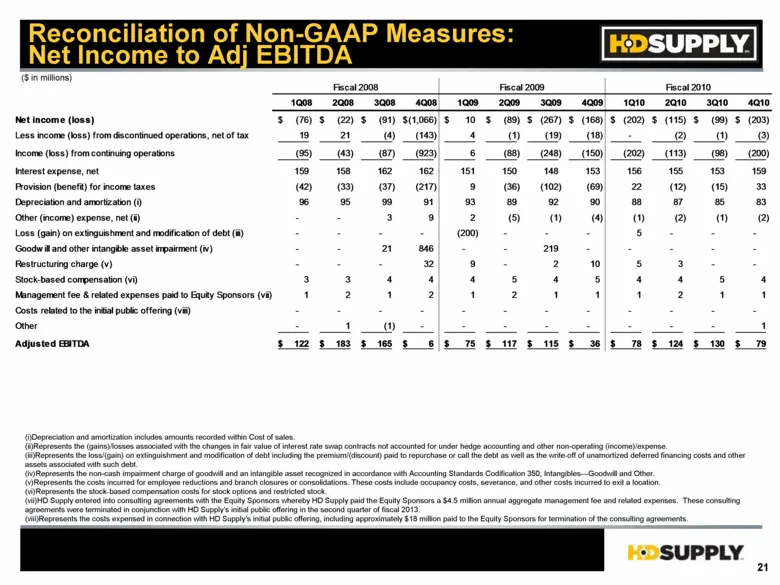
($ in millions) (i) Depreciation and amortization includes amounts recorded within Cost of sales. (ii) Represents the (gains)/losses associated with the changes in fair value of interest rate swap contracts not accounted for under hedge accounting and other non-operating (income)/expense. (iii) Repr
Slide 22: Reconciliation of Non-GAAP Measures (continued)
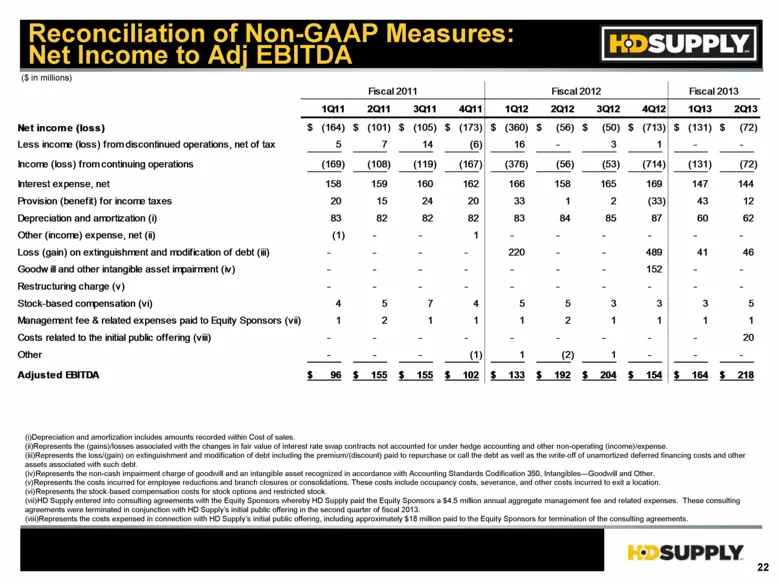
($ in millions) (i) Depreciation and amortization includes amounts recorded within Cost of sales. (ii) Represents the (gains)/losses associated with the changes in fair value of interest rate swap contracts not accounted for under hedge accounting and other non-operating (income)/expense. (iii) Repr
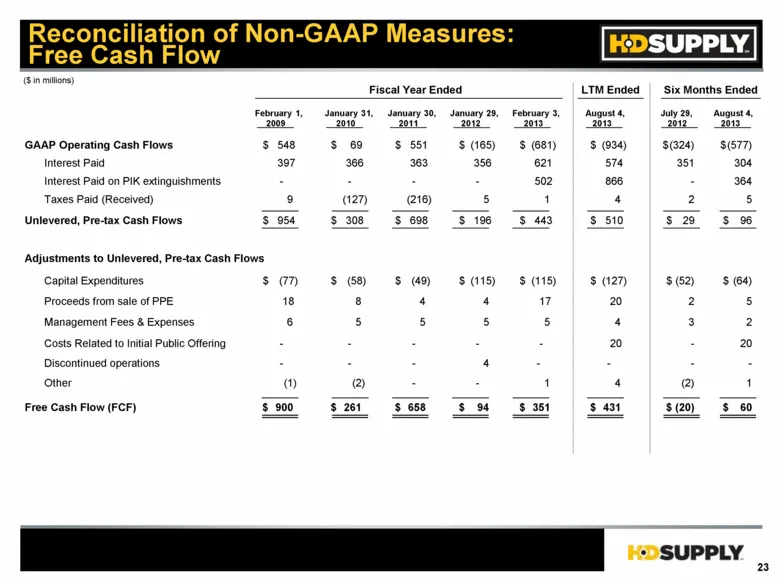
Slide 23: Reconciliation of Non-GAAP Measures: Free Cash Flow
GAAP Operating Cash Flows Interest Paid Interest Paid on PIK extinguishments Taxes Paid (Received) Unlevered, Pre-tax Cash Flows Adjustments to Unlevered, Pre-tax Cash Flows Free Cash Flow (FCF) 548 $ 69 $ 551 $ (165) $ (681) $ (934) $ 397 366 363 356 621 574 - - - - 502 866 9 (127) (216) 5 1 4 954
Source: SEC EDGAR · 8-K filed Nov 5, 2013
More decks from HD Supply Holdings Inc
 Q2 2020 Earnings Presentation18 slides · Sep 9, 2020
 Q1 2020 Earnings Presentation21 slides · Jun 9, 2020
 Q4 2019 Earnings Presentation20 slides · Mar 17, 2020
 Q3 2019 Earnings Presentation21 slides · Dec 10, 2019
 Robert W. Baird & Co. 2019 Industrial Conference9 slides · Nov 6, 2019
 Merger or Acquisition (September 2019)21 slides · Sep 25, 2019