HD Supply — Robert W. Baird & Co. 2019 Industrial Conference
9 slides from HD Supply's conference presentation, Nov 6, 2019

Slide 1: Robert W. Baird & Co. 2019 Industrial Conference
Robert W. Baird & Co. 2019 Industrial Conference HD Supply November 6 th , 2019
Slide 2: Disclaimer: Forward-Looking Statements and Preliminary Results
2 Disclaimer Forward - Looking Statements and Preliminary Results This presentation includes “forward - looking statements” within the meaning of Section 27A of the Securities Act of 1933 and Sect ion 21E of the Securities Exchange Act of 1934. Forward - looking statements are based on management’s
Slide 3: Facilities Maintenance: At a Glance
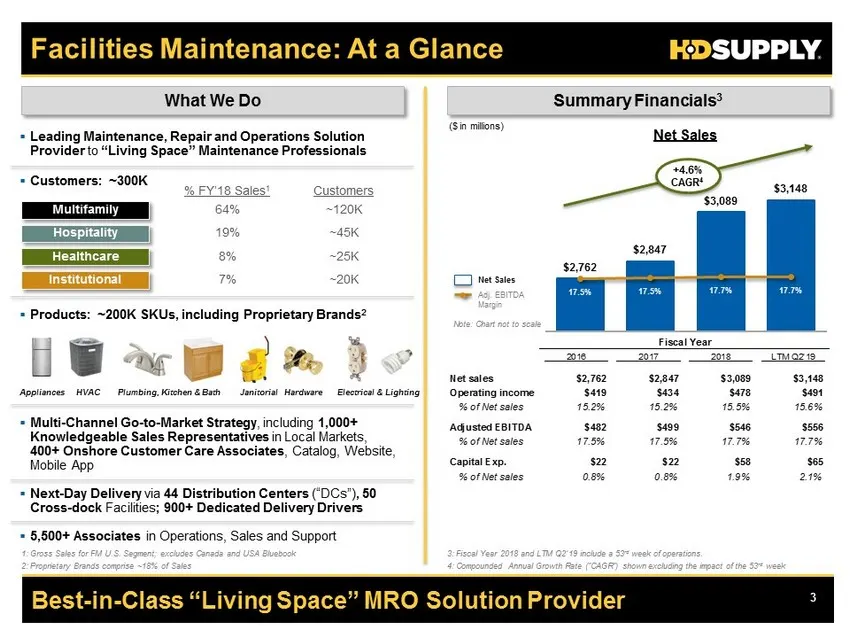
3 $2,762 $2,847 $3,089 $3,148 17.5% 17.5% 17.7% 17.7% ($ in millions) Best - in - Class “Living Space” MRO Solution Provider Facilities Maintenance: At a Glance What We Do Summary Financials 3 ▪ Leading Maintenance, Repair and Operations Solution Provider to “Living Space” Maintenance Professionals
Slide 4: Construction & Industrial: At a Glance
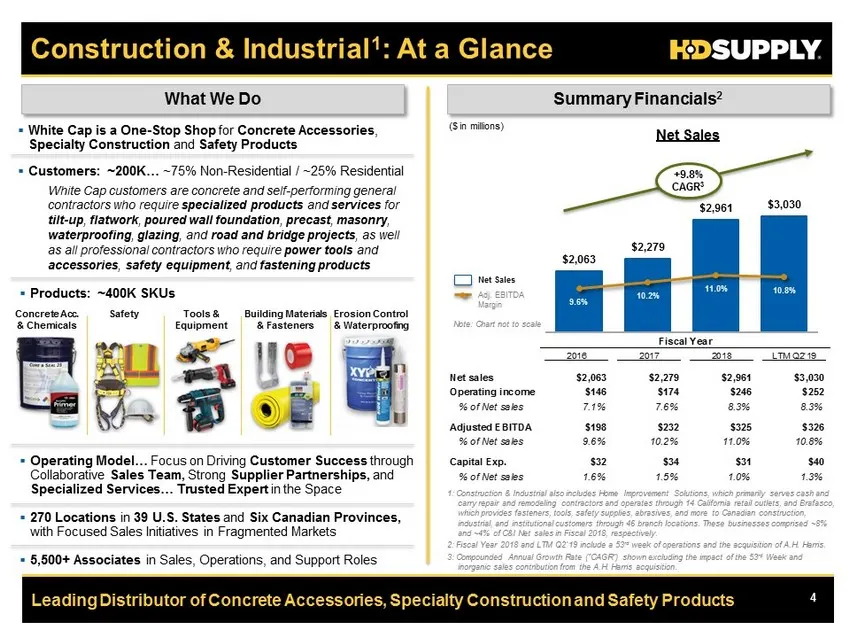
4 $2,063 $2,279 $2,961 $3,030 9.6% 10.2% 11.0% 10.8% Leading Distributor of Concrete Accessories, Specialty Construction and Safety Products Construction & Industrial 1 : At a Glance What We Do Summary Financials 2 ▪ White Cap is a One - Stop Shop for Concrete Accessories , Specialty Construction an
Slide 5: Transaction On Track for Completion by Middle of Fiscal 2020
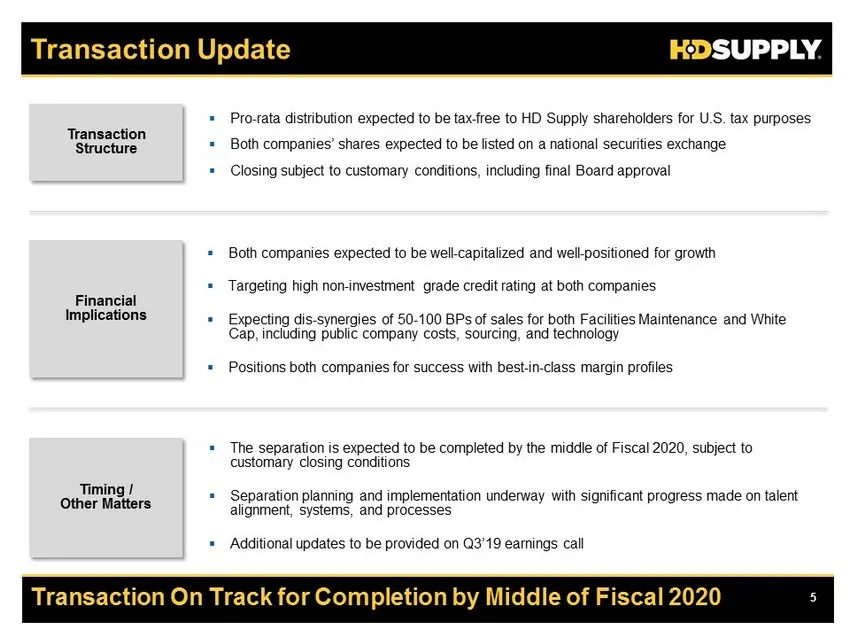
5 Transaction On Track for Completion by Middle of Fiscal 2020 Transaction Update Transaction Structure Timing / Other Matters Financial Implications ▪ Pro - rata distribution expected to be tax - free to HD Supply shareholders for U.S. tax purposes ▪ Both companies’ shares expected to be listed on
Slide 6: Revising Q3'19 Guidance Range
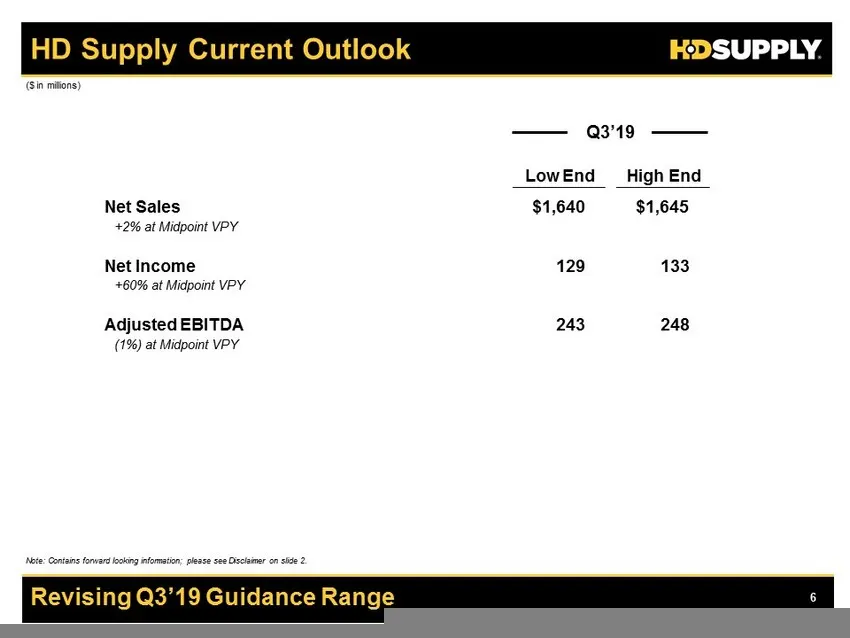
6 Revising Q3’19 Guidance Range HD Supply Current Outlook ($ in millions) Note: Contains forward looking information; please see Disclaimer on slide 2. Low End High End Net Sales $1,640 $1,645 +2% at Midpoint VPY Net Income 129 133 +60% at Midpoint VPY Adjusted EBITDA 243 248 (1%) at Midpoint VPY Q3
Slide 7: Reconciliation of Non-GAAP Measures
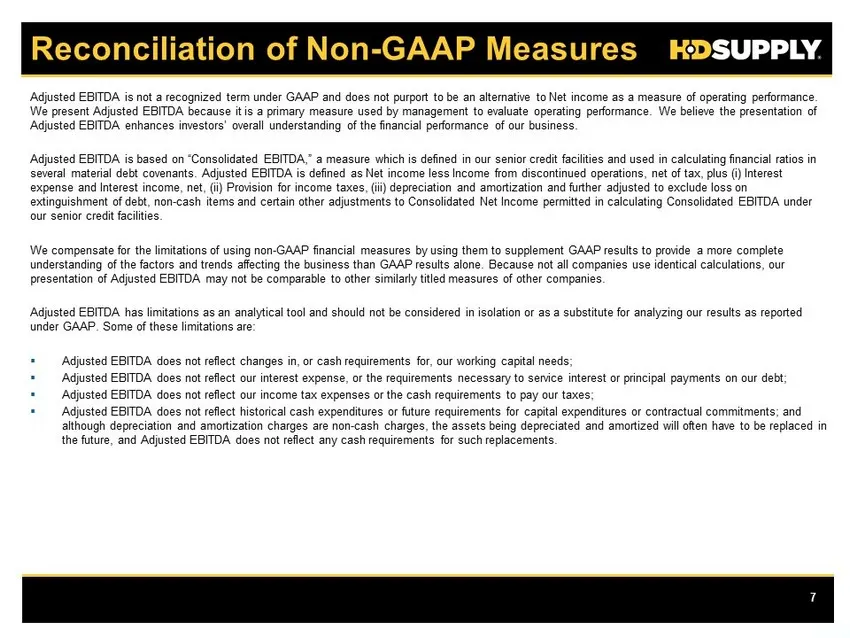
7 Reconciliation of Non - GAAP Measures Adjusted EBITDA is not a recognized term under GAAP and does not purport to be an alternative to Net income as a measure of o per ating performance. We present Adjusted EBITDA because it is a primary measure used by management to evaluate operating performance
Slide 8: Reconciliation of Non-GAAP Measures: Operating Income to Adjusted EBITDA
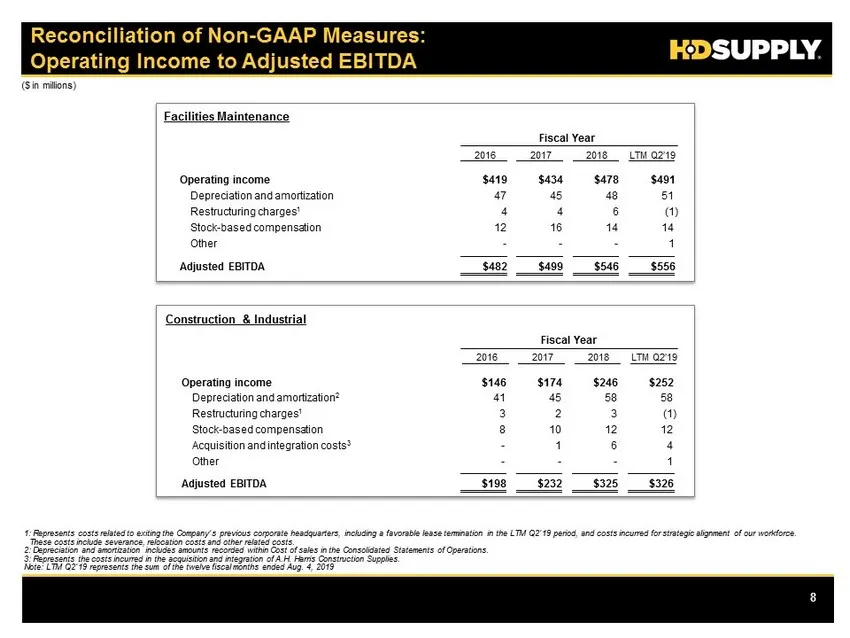
8 1: Represents costs related to exiting the Company’s previous corporate headquarters, including a favorable lease termination in the LTM Q2’19 period, and costs incurred for strategic alignment of our workforce. These costs include severance, relocation costs and other related costs. 2: Depreciati
Slide 9: Reconciliation of Forecasted Range
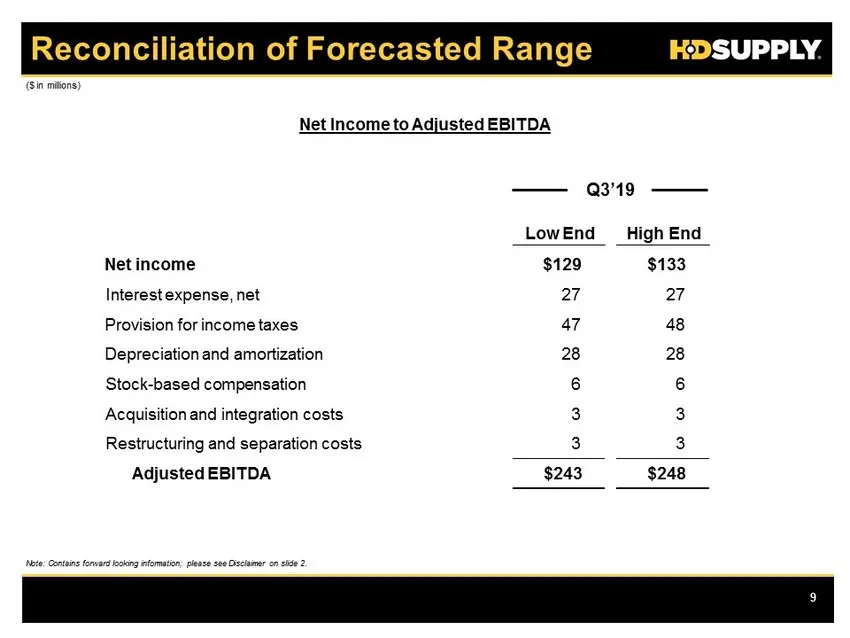
9 Reconciliation of Forecasted Range ($ in millions) Note: Contains forward looking information; please see Disclaimer on slide 2. Low End High End Net income Provision for income taxes 47 48 Q3’19 $129 $133 Interest expense, net 27 27 Depreciation and amortization 28 28 Stock - based compensation 6
Source: SEC EDGAR · 8-K filed Nov 6, 2019
More decks from HD Supply Holdings Inc
 Q2 2020 Earnings Presentation18 slides · Sep 9, 2020
 Q1 2020 Earnings Presentation21 slides · Jun 9, 2020
 Q4 2019 Earnings Presentation20 slides · Mar 17, 2020
 Q3 2019 Earnings Presentation21 slides · Dec 10, 2019
 Merger or Acquisition (September 2019)21 slides · Sep 25, 2019
 Q2 2019 Earnings Presentation20 slides · Sep 10, 2019