Philadelphia Consolidated Holding Corp
Philadelphia Consolidated — Q4 2004 Earnings Presentation
24 slides from Philadelphia Consolidated's earnings presentation, Feb 15, 2005
Slide 1: Philadelphia Consolidated Holding Corp. Founded 1962
Philadelphia Consolidated Holding Corp. Founded 1962

Slide 2: Forward-looking statements
Certain information included in this presentation and other statements or materials published or to be published by the Company are not historical facts but are forward-looking statements relating to such matters as anticipated financial performance, business prospects, technological developments, n
Slide 3: Agenda
AGENDA Fourth Quarter and Year Ended December 31, 2004 Financial Highlights Financial Results Segment Information Investment Portfolio Selected Operating Statistics Drivers of Future Growth 2005 Expectations Q&A
Slide 4: Fourth Quarter Events
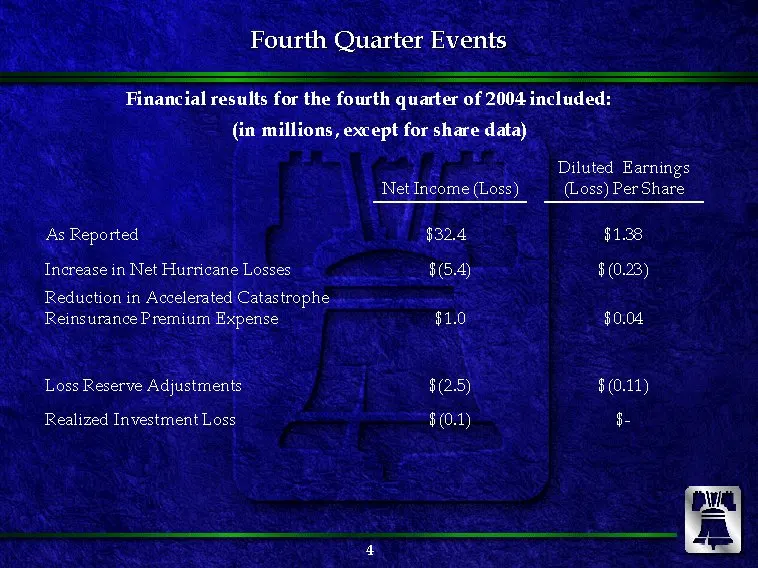
Fourth Quarter Events Fourth Quarter Events Financial results for the fourth quarter of 2004 included: (in millions, except for share data) Net Income (Loss) Diluted Earnings (Loss) Per Share As Reported $32.4 $1.38 Increase in Net Hurricane Losses $(5.4) $(0.23) Reduction in Accelerated Catastrophe
Slide 5: 2004 Events
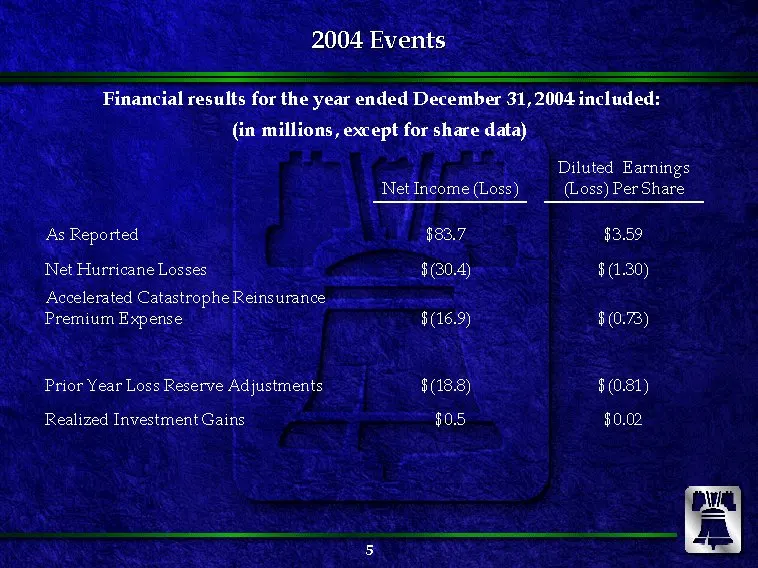
2004 Events 2004 Events Financial results for the year ended December 31, 2004 included: (in millions, except for share data) Net Income (Loss) Diluted Earnings (Loss) Per Share As Reported $83.7 $3.59 Net Hurricane Losses $(30.4) $(1.30) Accelerated Catastrophe Reinsurance Premium Expense $(16.9) $
Slide 6: Fourth Quarter Highlights
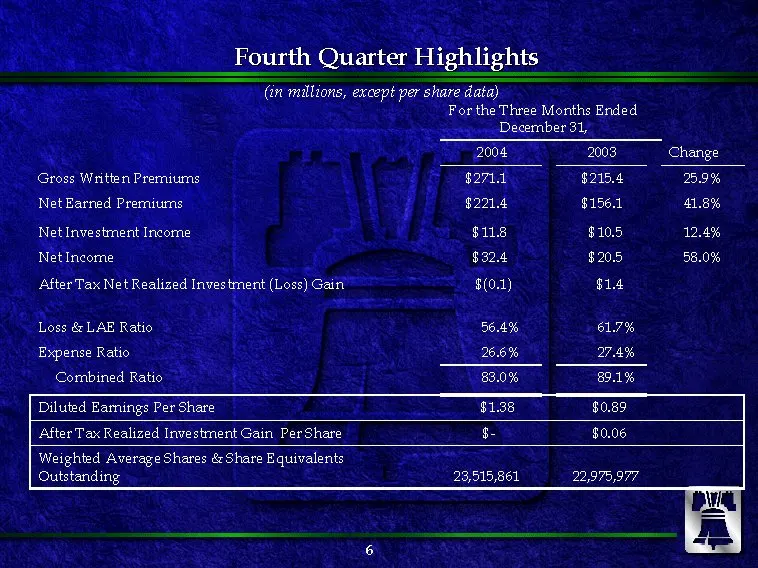
Fourth Quarter Highlights Fourth Quarter Highlights (in millions, except per share data) For the Three Months Ended December 31, 2004 2003 Change Gross Written Premiums $271.1 $215.4 25.9% Net Earned Premiums $221.4 $156.1 41.8% Net Investment Income $11.8 $10.5 12.4% Net Income $32.4 $20.5 58.0% Af
Slide 7: Fourth Quarter Highlights
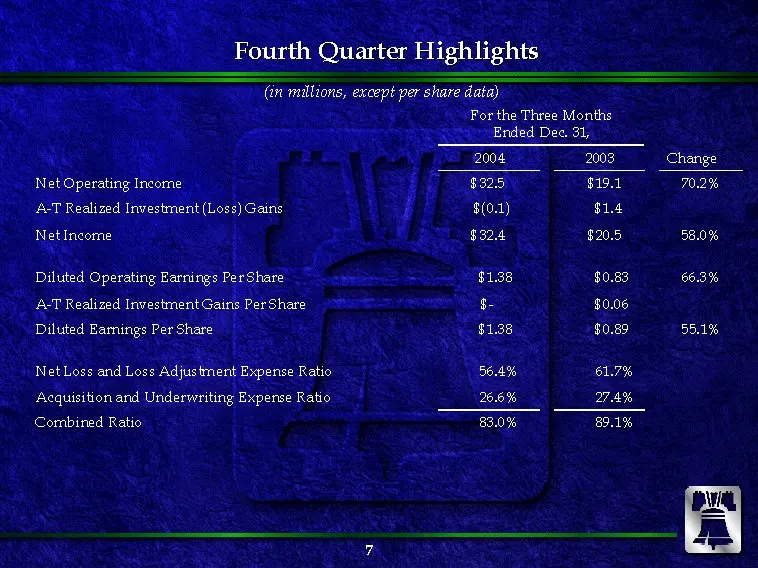
Fourth Quarter Highlights Fourth Quarter Highlights (in millions, except per share data) For the Three Months Ended Dec. 31, A-T Realized Investment Gains Per Share $- $0.06 2004 2003 Change Net Operating Income $32.5 $19.1 70.2% A-T Realized Investment (Loss) Gains $(0.1) $1.4 Net Income $32.4 $20.
Slide 8: Fourth Quarter Highlights
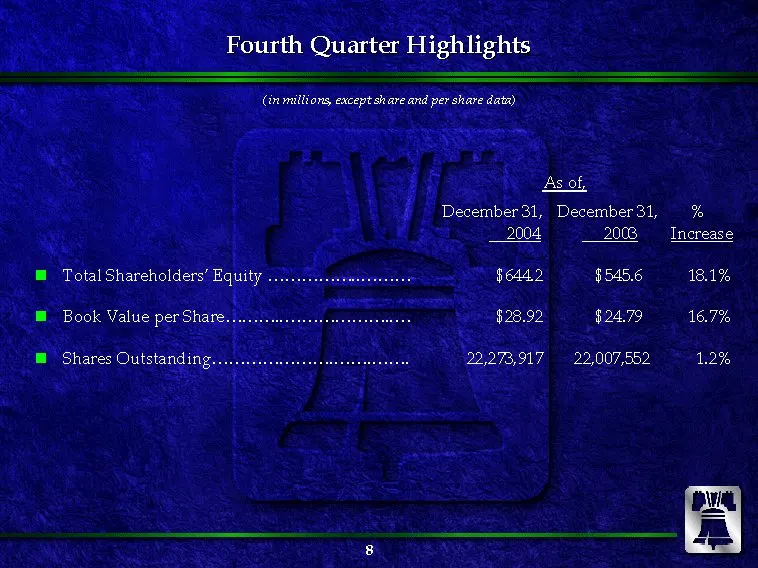
Fourth Quarter Highlights Fourth Quarter Highlights (in millions, except share and per share data) As of, December 31, December 31, % 2004 2003 Increase Total Shareholders’ Equity $644.2 $545.6 18.1% Book Value per Share $28.92 $24.79 16.7% Shares Outstanding 22,273,917 22,007,552 1.2%
Slide 9: Years Ended Highlights
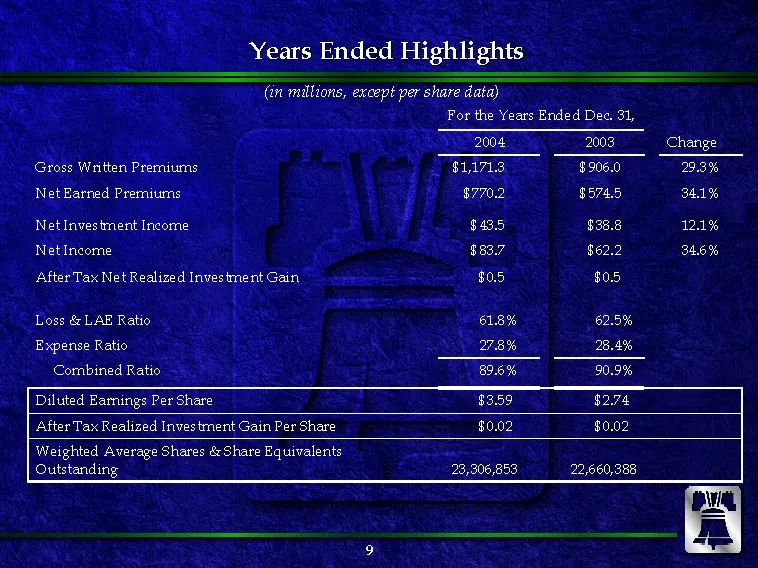
Years Ended Highlights Years Ended Highlights (in millions, except per share data) For the Years Ended Dec. 31, 2004 2003 Change Gross Written Premiums $1,171.3 $906.0 29.3% Net Earned Premiums $770.2 $574.5 34.1% Net Investment Income $43.5 $38.8 12.1% Net Income $83.7 $62.2 34.6% After Tax Net Rea
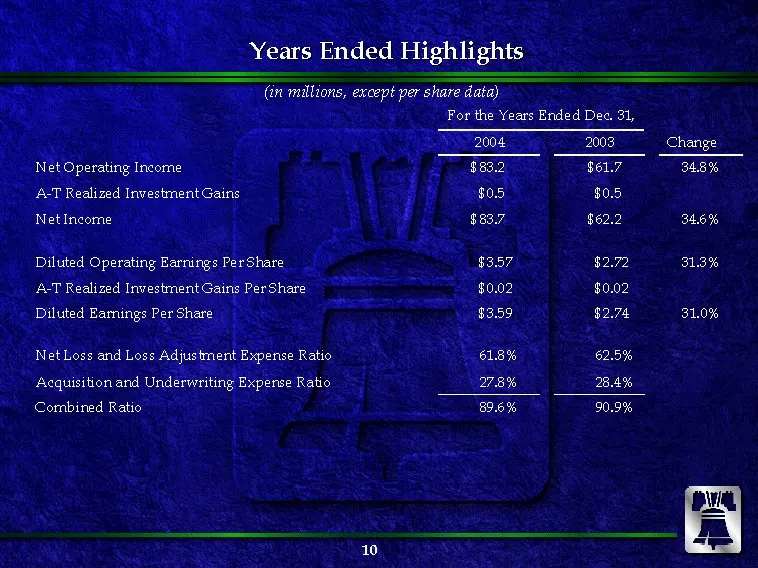
Slide 10: Years Ended Highlights
Years Ended Highlights Years Ended Highlights (in millions, except per share data) For the Years Ended Dec. 31, A-T Realized Investment Gains Per Share $0.02 $0.02 2004 2003 Change Net Operating Income $83.2 $61.7 34.8% A-T Realized Investment Gains $0.5 $0.5 Net Income $83.7 $62.2 34.6% Diluted Ope
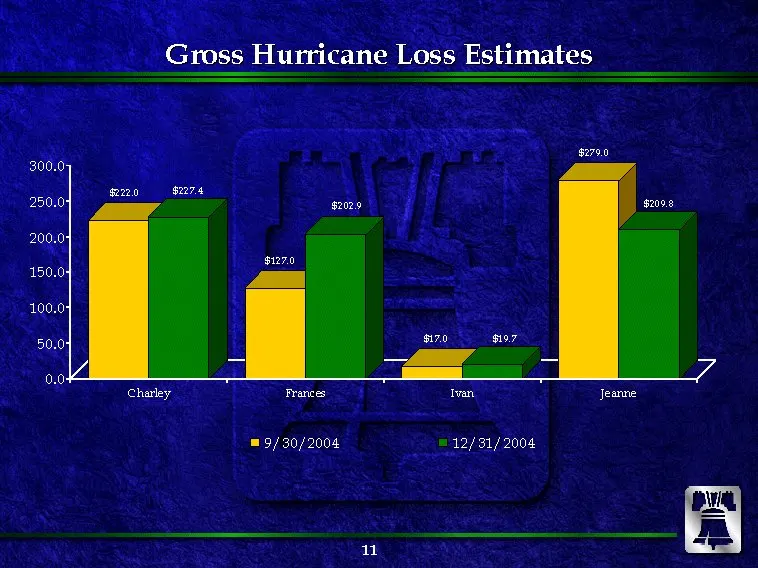
Slide 11: Gross Hurricane Loss Estimates
Gross Hurricane Loss Estimates $222.0 $227.4 $127.0 $202.9 $17.0 $19.7 $279.0 $209.8 0.0 50.0 100.0 150.0 200.0 250.0 300.0 Charley Frances Ivan Jeanne 9/30/2004 12/31/2004
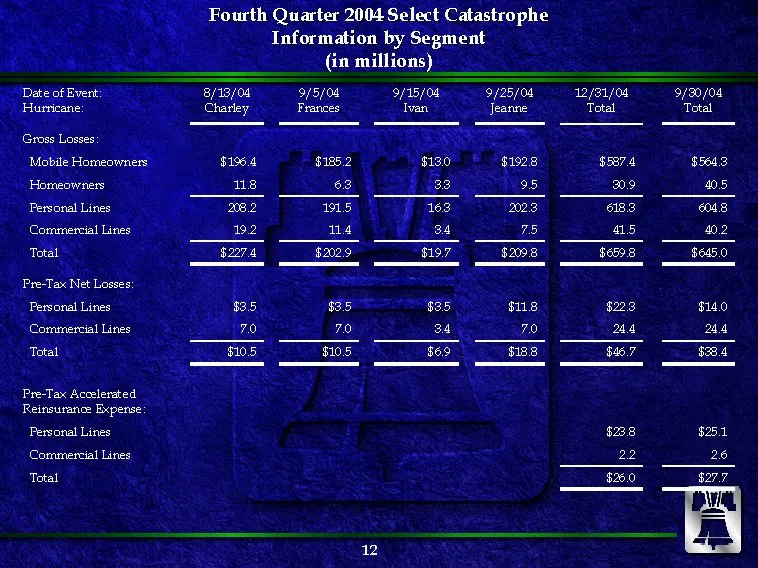
Slide 12: Fourth Quarter 2004 Select Catastrophe Information by Segment
Fourth Quarter 2004 Select Catastrophe Fourth Quarter 2004 Select Catastrophe Information by Segment Information by Segment (in millions) Date of Event:Hurricane: 8/13/04 Charley 9/5/04 Frances 9/15/04 Ivan 9/25/04 Jeanne 12/31/04 Total $587.4 30.9 618.3 41.5 $659.8 $22.3 24.4 $46.7 $23.8 2.2 $26.0
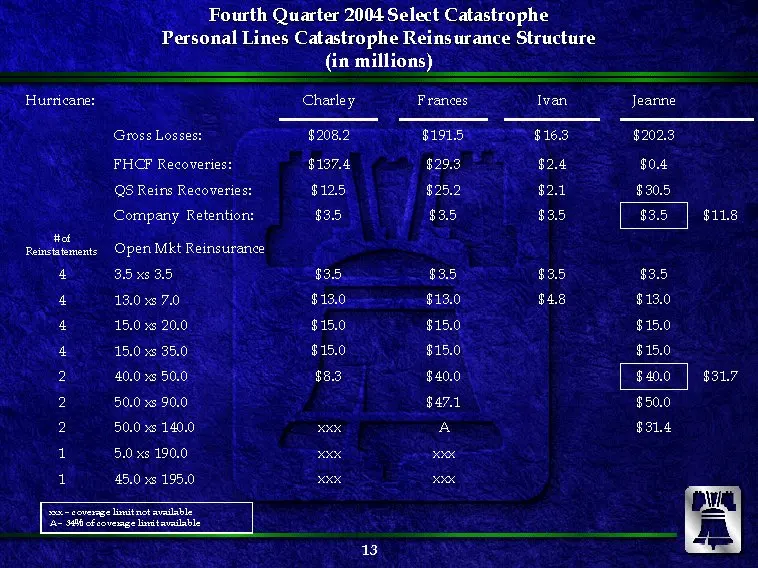
Slide 13: Personal Lines Catastrophe Reinsurance Structure
Fourth Quarter 2004 Select Catastrophe Fourth Quarter 2004 Select Catastrophe Personal Lines Catastrophe Reinsurance Structure (in millions) Hurricane: Charley Frances Ivan Jeanne $11.8 $31.7 Company Retention: $3.5 $3.5 $3.5 $3.5 # of Reinstatements Open Mkt Reinsurance 4 3.5 xs 3.5 $3.5 $3.5 $3.5
Slide 14: Gross Written Premiums by Segment
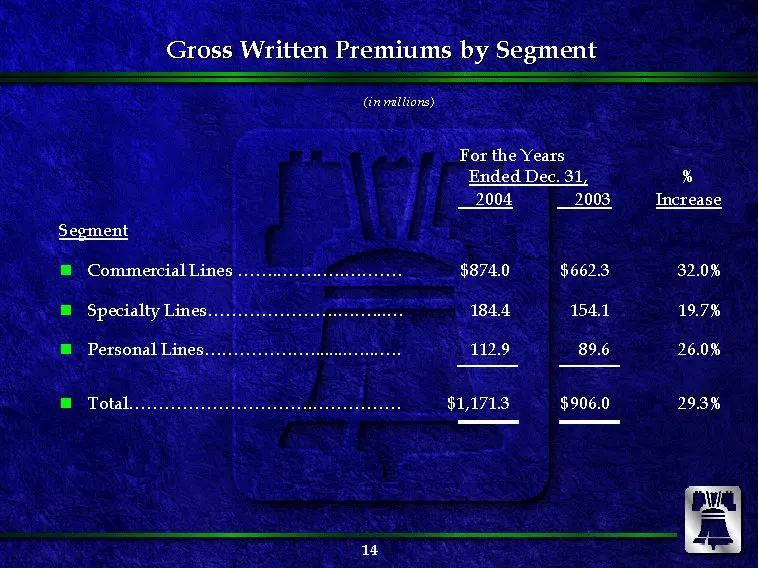
Gross Written Premiums by Segment (in millions) For the Years Ended Dec. 31, % 2004 2003 Increase Segment Commercial Lines $874.0 $662.3 32.0% Specialty Lines 184.4 154.1 19.7% Personal Lines 112.9 89.6 26.0% Total $1,171.3 $906.0 29.3%
Slide 15: Commercial Lines Segment
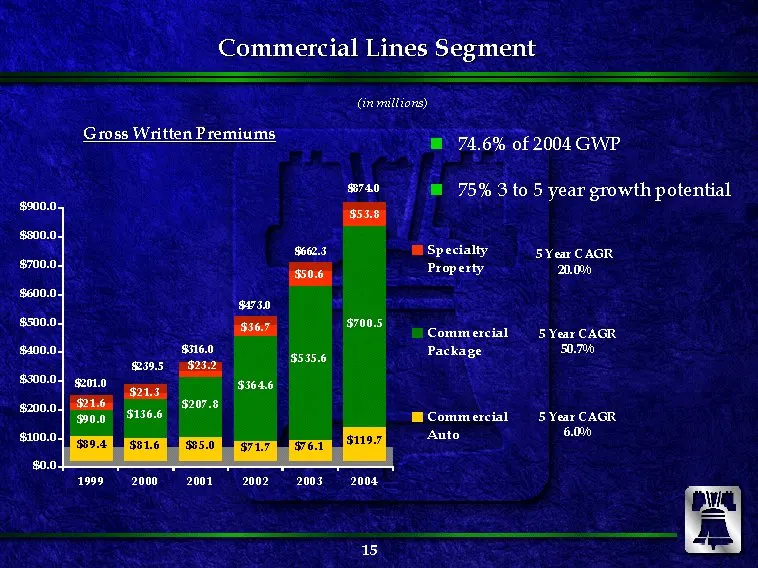
Commercial Lines Segment Commercial Lines Segment (in millions) 74.6% of 2004 GWP 75% 3 to 5 year growth potential Gross Written Premiums Gross Written Premiums 1999 2000 2001 2002 2003 2004 $89.4 $90.0 $21.6 $81.6 $136.6 $21.3 $85.0 $207.8 $23.2 $71.7 $364.6 $36.7 $76.1 $535.6 $50.6 $119.7 $700.5 $
Slide 16: Specialty Lines Segment
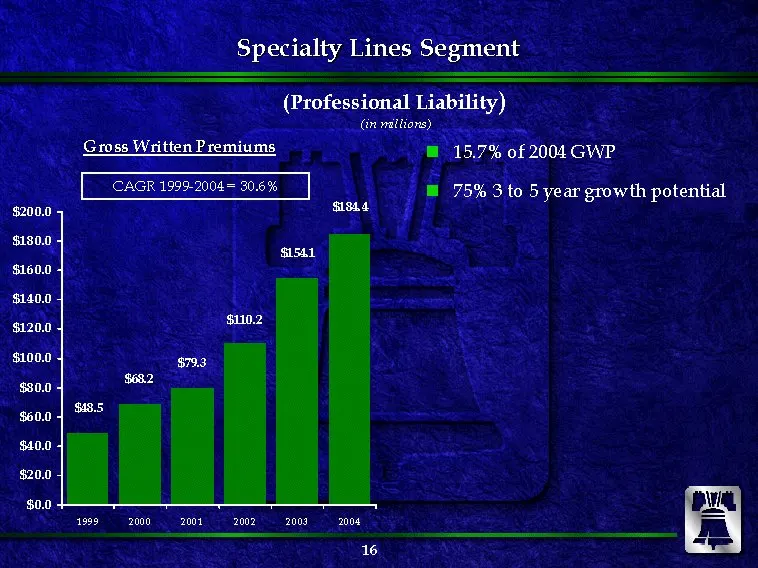
Specialty Lines Segment Specialty Lines Segment $48.5 $68.2 $79.3 $110.2 $154.1 $184.4 $0.0 $20.0 $40.0 $60.0 $80.0 $100.0 $120.0 $140.0 $160.0 $180.0$200.0 1999 2000 2001 2002 2003 2004 15.7% of 2004 GWP 75% 3 to 5 year growth potential CAGR 1999-2004 = 30.6% Gross Written Premiums Gross Written Pr
Slide 17: Personal Lines Gross Written Premiums
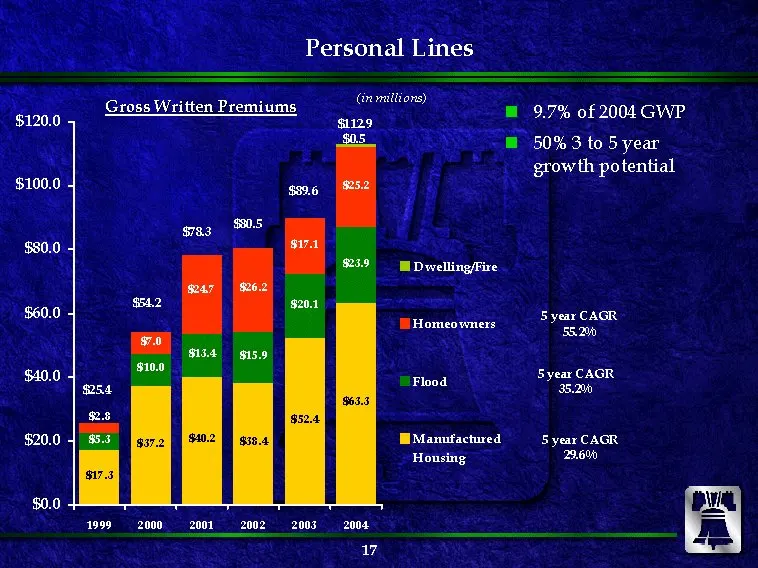
Gross Written Premiums Gross Written Premiums $37.2 $40.2 $38.4 $52.4 $63.3 $5.3 $10.0 $13.4 $20.1 $23.9 $7.0 $26.2 $17.1 $25.2 $17.3 $15.9 $24.7 $2.8 $0.0 $20.0 $40.0 $60.0 $80.0 $100.0 $120.0 1999 2000 2001 2002 2003 2004 Dwelling/Fire Homeowners Flood Manufactured Housing $54.2 $78.3 9.7% of 2004
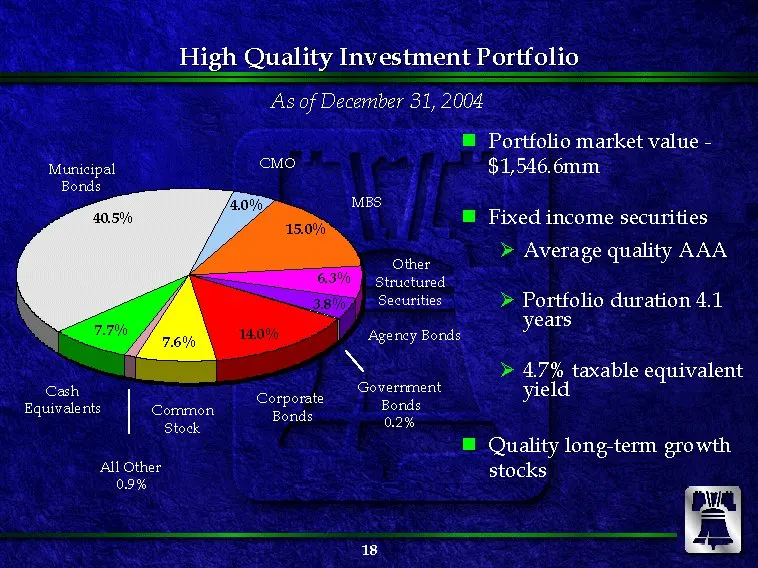
Slide 18: High Quality Investment Portfolio
High Quality Investment Portfolio High Quality Investment Portfolio As of December 31, 2004 Corporate Bonds Common Stock Cash Equivalents Municipal Bonds Portfolio market value — $1,546.6mm Fixed income securities Average quality AAA Portfolio duration 4.1 years 4.7% taxable equivalent yield Quality
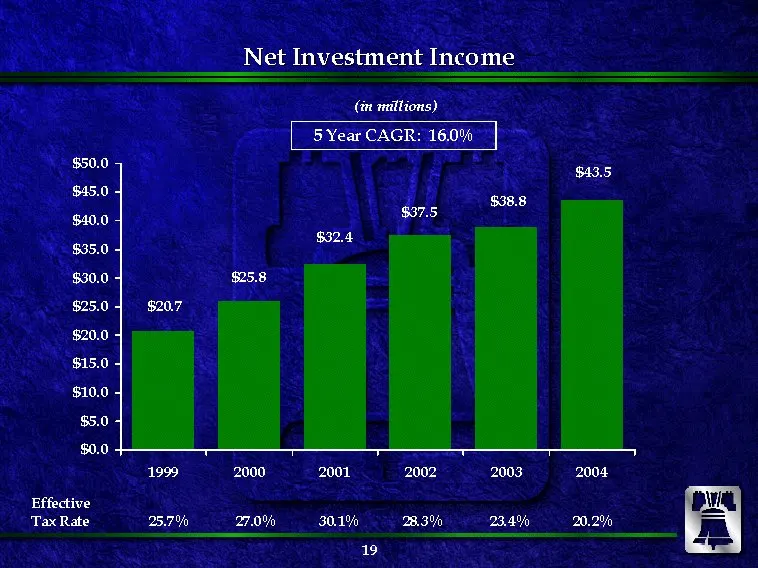
Slide 19: Net Investment Income
Net Investment Income Net Investment Income (in millions) $20.7 $25.8 $32.4 $37.5 $38.8 $43.5 $0.0 $5.0 $10.0 $15.0 $20.0 $25.0 $30.0 $35.0 $40.0 $45.0 $50.0 1999 2000 2001 2002 2003 2004 5 Year CAGR: 16.0% Effective Tax Rate 25.7% 27.0% 30.1% 28.3% 23.4% 20.2%
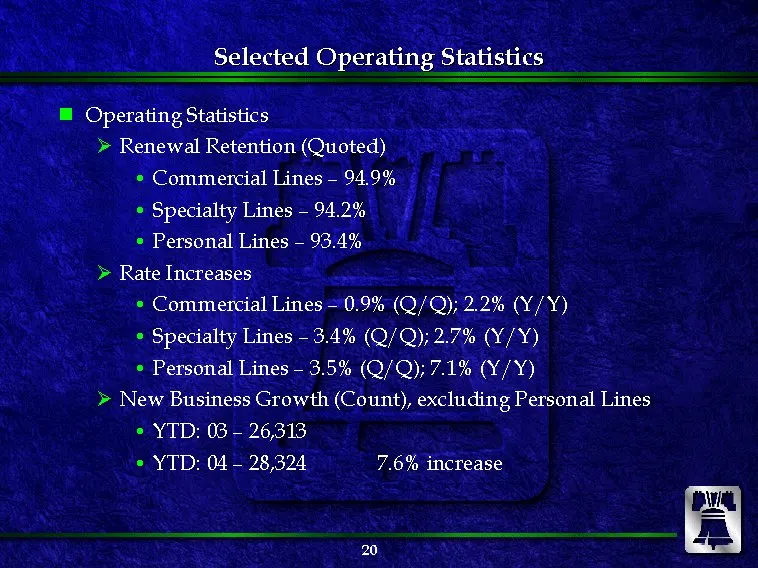
Slide 20: Selected Operating Statistics
Selected Operating Statistics Selected Operating Statistics Operating Statistics Renewal Retention (Quoted) Commercial Lines – 94.9% Specialty Lines – 94.2% Personal Lines – 93.4% Rate Increases Commercial Lines – 0.9% (Q/Q); 2.2% (Y/Y) Specialty Lines – 3.4% (Q/Q); 2.7% (Y/Y) Personal Lines – 3.5%
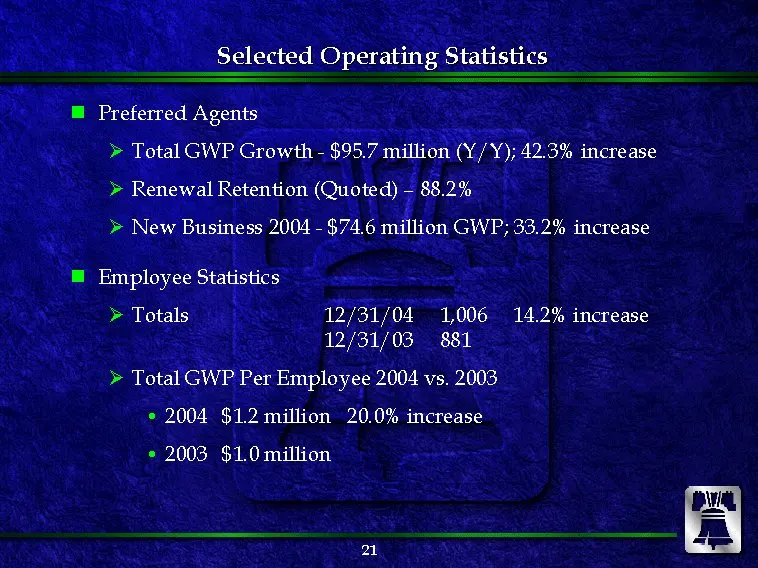
Slide 21: Selected Operating Statistics
Selected Operating Statistics Selected Operating Statistics Preferred Agents Total GWP Growth — $95.7 million (Y/Y); 42.3% increase Renewal Retention (Quoted) – 88.2% New Business 2004 — $ 74.6 million GWP; 33.2% increase Employee Statistics Totals 12/31/04 1,006 14.2% increase 12/31/03 881 Total GW
Slide 22: Drivers of Future Growth
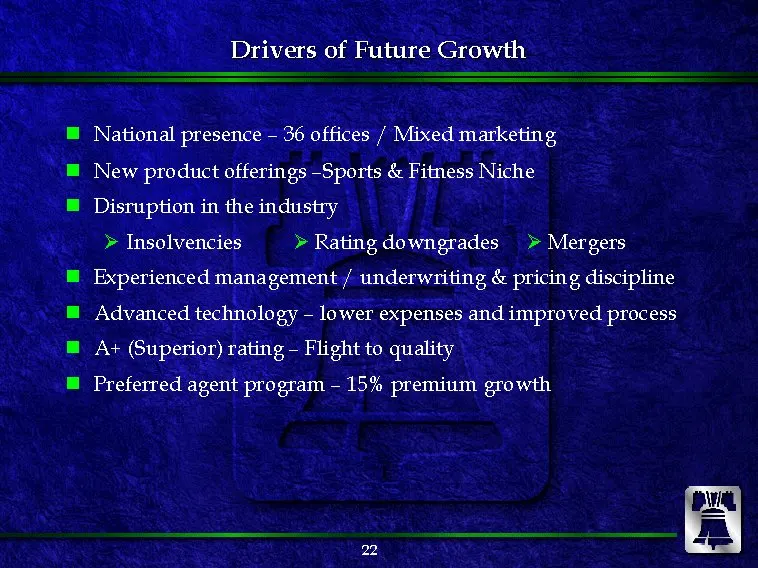
Drivers of Future Growth Drivers of Future Growth National presence – 36 offices / Mixed marketing New product offerings – Sports & Fitness Niche Disruption in the industry Insolvencies Rating downgrades Mergers Experienced management / underwriting & pricing discipline Advanced technology – lower e
Slide 23: 2005 Expectations
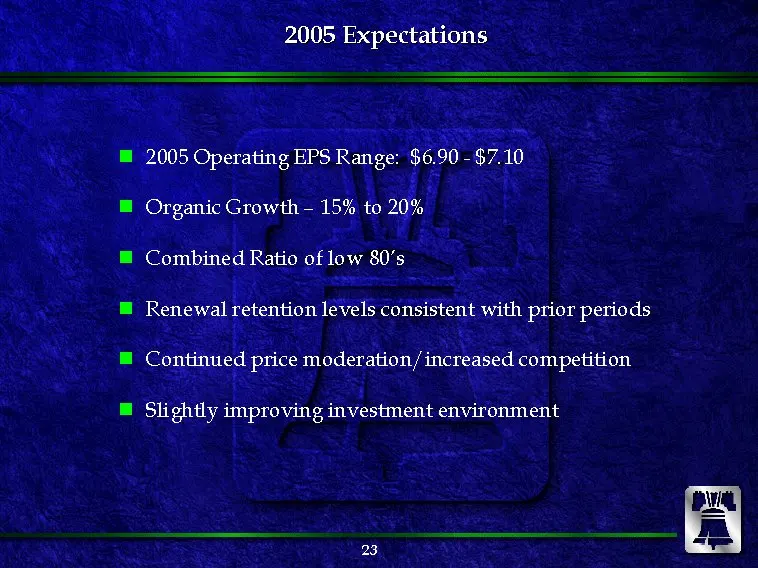
2005 Expectations 2005 Expectations 2005 Operating EPS Range: $6.90 — $7.10 Organic Growth – 15% to 20% Combined Ratio of low 80’s Renewal retention levels consistent with prior periods Continued price moderation/increased competition Slightly improving investment environment
Slide 24: Philadelphia Consolidated Holding Corp. Founded 1962
Philadelphia Consolidated Holding Corp. Founded 1962
Source: SEC EDGAR · 8-K filed Feb 15, 2005
More decks from Philadelphia Consolidated Holding Corp
 Merger or Acquisition (July 2008)28 slides · Jul 23, 2008
 Merger or Acquisition (July 2008)21 slides · Jul 23, 2008
 Q1 2008 Earnings Presentation19 slides · Apr 25, 2008
 Q4 2007 Earnings Presentation25 slides · Feb 25, 2008
 Q3 2007 Earnings Presentation25 slides · Oct 26, 2007
 Q1 2007 Earnings Presentation19 slides · Apr 27, 2007