Philadelphia Consolidated Holding Corp
Philadelphia Consolidated — Q1 2007 Earnings Presentation
19 slides from Philadelphia Consolidated's earnings presentation, Apr 27, 2007
Slide 1: Philadelphia Consolidated Holding Corp. Founded 1962
Philadelphia Consolidated Holding Corp. Founded 1962
Slide 2: Forward-looking statements
Certain information included in this presentation and other statements or materials published or to be published by the Company are not historical facts but are forward- looking statements relating to such matters as anticipated financial performance, business prospects, technological developments,
Slide 3: Agenda
AGENDA First Quarter 2007 Financial Highlights Financial Results Segment Information Investment Portfolio Selected Operating Statistics Drivers of Future Growth 2007 Expectations Q&A
Slide 4: First Quarter Highlights
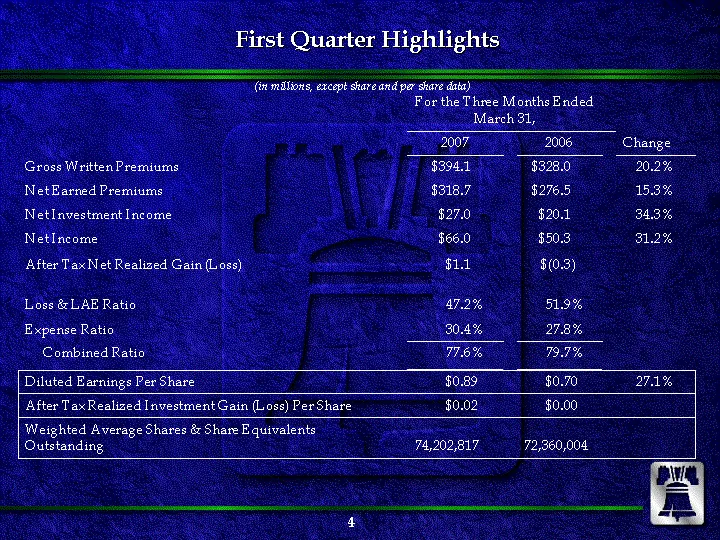
First Quarter Highlights (in millions, except share and per share data) For the Three Months Ended March 31, For the Three Months Ended March 31, For the Three Months Ended March 31, 2007 2006 Change Gross Written Premiums $394.1 $328.0 20.2% Net Earned Premiums $318.7 $276.5 15.3% Net Investment In
Slide 5: First Quarter Highlights (operating income)
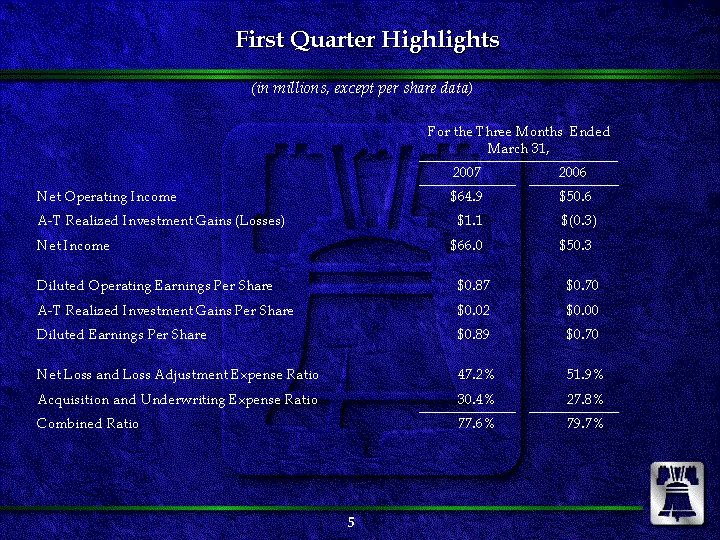
First Quarter Highlights (in millions, except per share data) For the Three Months Ended March 31, For the Three Months Ended March 31, For the Three Months Ended March 31, 2007 2006 Net Operating Income $64.9 $50.6 A-T Realized Investment Gains (Losses) $1.1 $(0.3) Net Income $66.0 $50.3 Diluted Op
Slide 6: First Quarter Highlights (equity and book value)
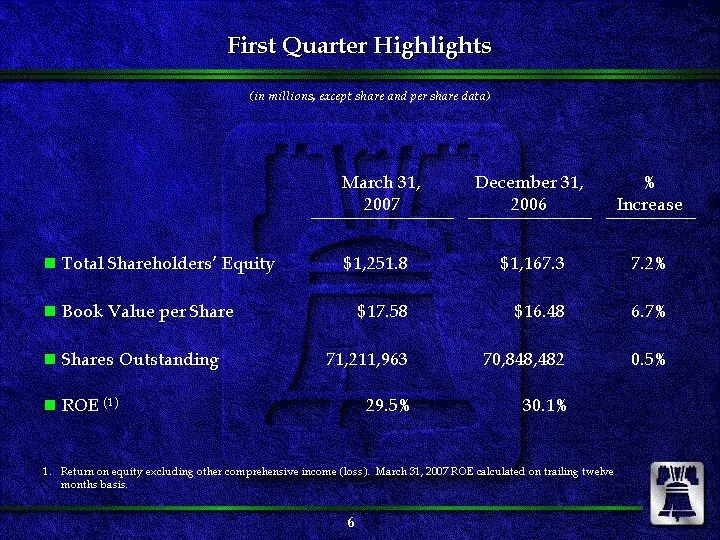
First Quarter Highlights (in millions, except share and per share data) March 31, 2007 December 31, 2006 % Increase Total Shareholders' Equity $1,251.8 $1,167.3 7.2% Book Value per Share $17.58 $16.48 6.7% Shares Outstanding 71,211,963 70,848,482 0.5% ROE (1) 29.5% 30.1% Return on equity excluding o
Slide 7: First Quarter 2007 Events
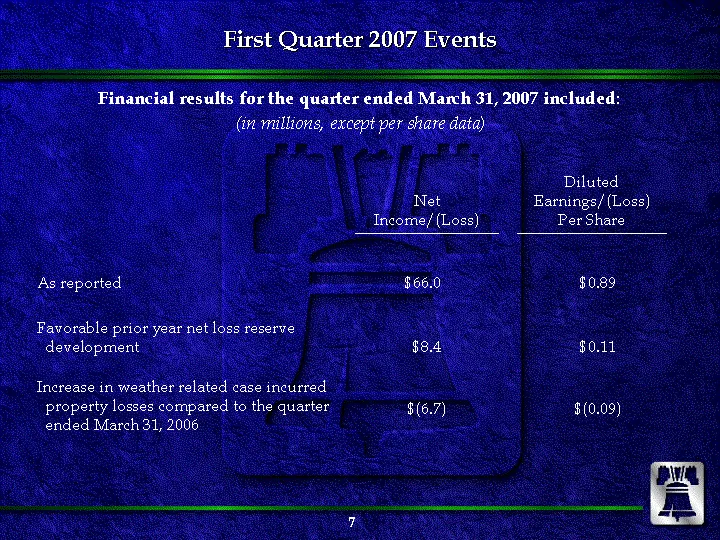
First Quarter 2007 Events Financial results for the quarter ended March 31, 2007 included: Net Income/(Loss) Diluted Earnings/(Loss) Per Share As reported $66.0 $0.89 Favorable prior year net loss reserve development $8.4 $0.11 Increase in weather related case incurred property losses compared to th
Slide 8: First Quarter 2007 Development on Prior Years - Net Basis
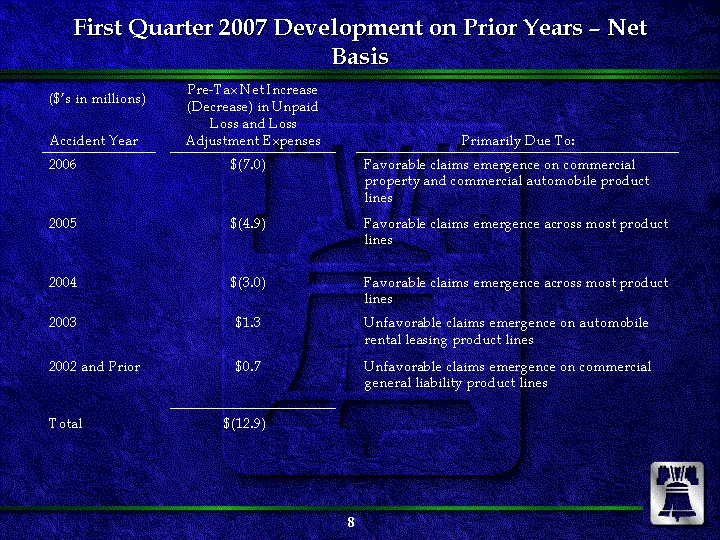
First Quarter 2007 Development on Prior Years - Net Basis ($'s in millions) Accident Year Pre-Tax Net Increase (Decrease) in Unpaid Loss and Loss Adjustment Expenses Primarily Due To: 2006 $(7.0) Favorable claims emergence on commercial property and commercial automobile product lines 2005 $(4.9) Fa
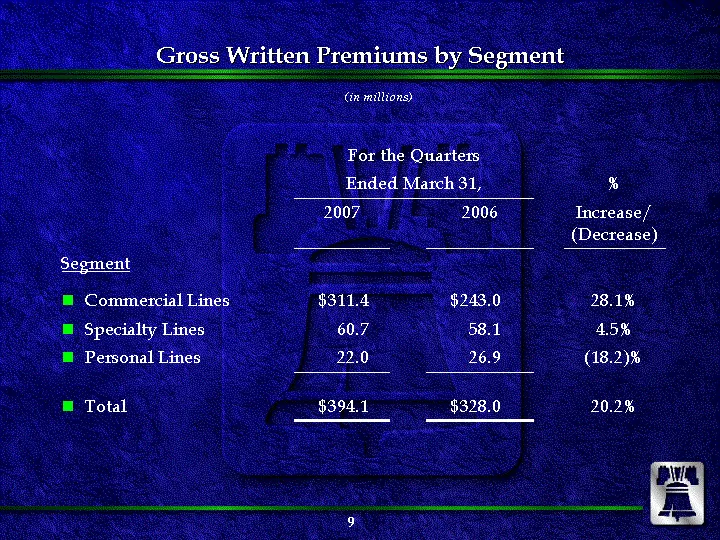
Slide 9: Gross Written Premiums by Segment
Gross Written Premiums by Segment (in millions) For the Quarters For the Quarters For the Quarters Ended March 31, Ended March 31, Ended March 31, % 2007 2006 Increase/ (Decrease) Segment Commercial Lines $311.4 $243.0 28.1% Specialty Lines 60.7 58.1 4.5% Personal Lines 22.0 26.9 (18.2)% Total $394.
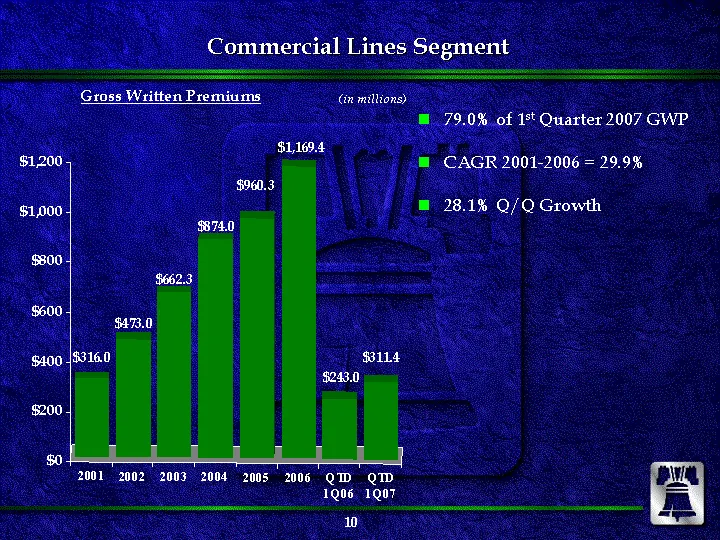
Slide 10: Commercial Lines Segment
Commercial Lines Segment 79.0% of 1st Quarter 2007 GWP CAGR 2001-2006 = 29.9% 28.1% Q/Q Growth Gross Written Premiums 2001 2002 2003 2004 2005 2006 QTD 1Q06 QTD 1Q07 316 473 662.3 874 960.3 1169.4 243 311.4 (in millions)
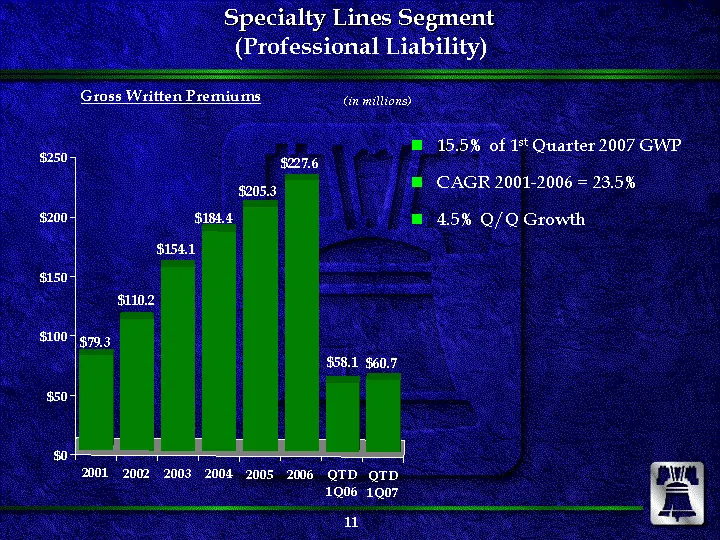
Slide 11: Specialty Lines Segment (Professional Liability)
Specialty Lines Segment (Professional Liability) 2001 2002 2003 2004 2005 2006 QTD 1Q06 QTD 1Q07 79.3 110.2 154.1 184.4 205.3 227.6 58.1 60.7 15.5% of 1st Quarter 2007 GWP CAGR 2001-2006 = 23.5% 4.5% Q/Q Growth Gross Written Premiums (in millions)
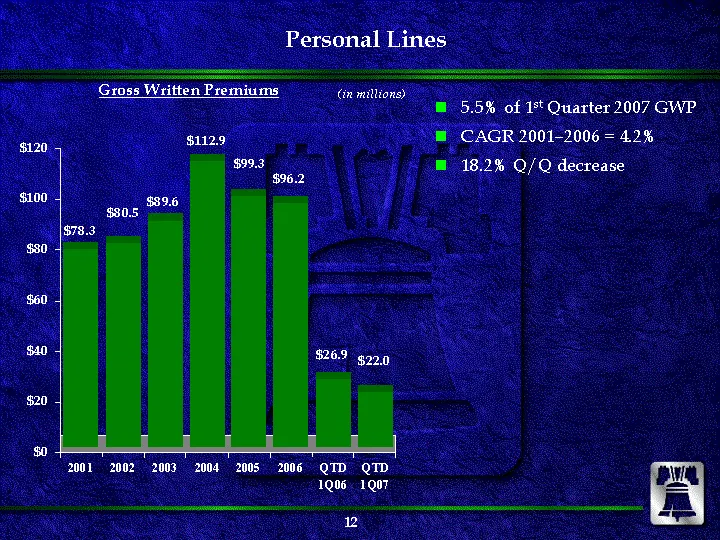
Slide 12: Personal Lines
Gross Written Premiums 2001 2002 2003 2004 2005 2006 QTD 1Q06 QTD 1Q07 Dwelling/Fire 78.3 80.5 89.6 112.9 99.3 96.2 26.9 22 5.5% of 1st Quarter 2007 GWP CAGR 2001-2006 = 4.2% 18.2% Q/Q decrease Personal Lines (in millions)
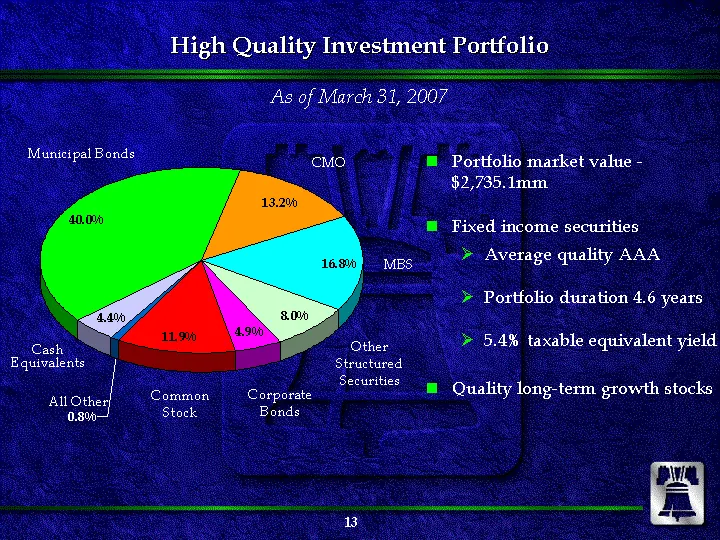
Slide 13: High Quality Investment Portfolio
High Quality Investment Portfolio Portfolio market value - $2,735.1mm Fixed income securities Average quality AAA Portfolio duration 4.6 years 5.4% taxable equivalent yield Quality long-term growth stocks As of March 31, 2007 Municipal Bonds 0.4 CMO 0.132 MBS 0.168 Other Structured Securities 0.08 C
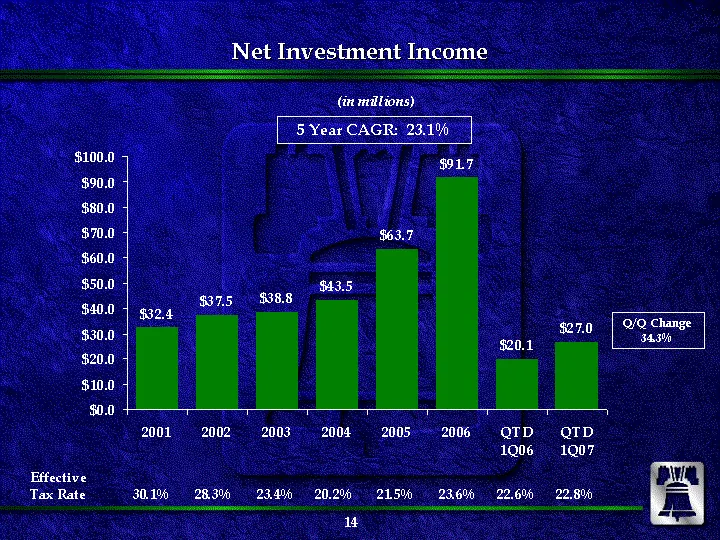
Slide 14: Net Investment Income
Net Investment Income 2001 2002 2003 2004 2005 2006 QTD 1Q06 QTD 1Q07 32.4 37.5 38.8 43.5 63.7 91.7 20.1 27 (in millions) 5 Year CAGR: 23.1% Effective Tax Rate 30.1% 28.3% 23.4% 20.2% 21.5% 23.6% 22.6% 22.8% Q/Q Change 34.3%
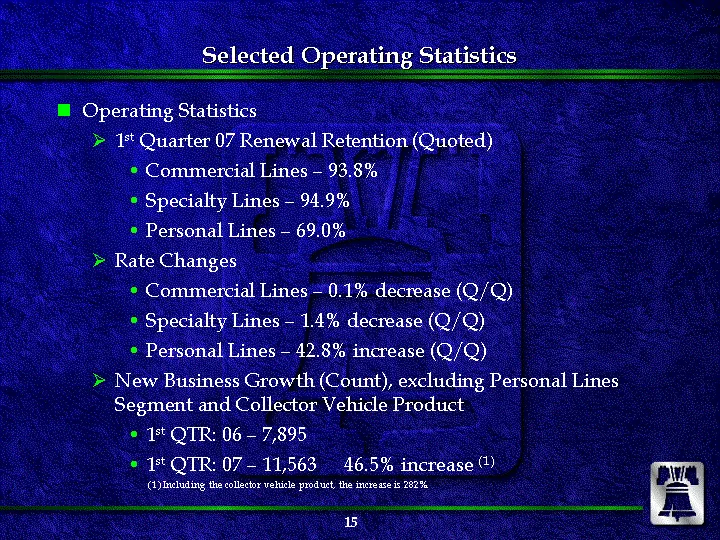
Slide 15: Selected Operating Statistics
Selected Operating Statistics Operating Statistics 1st Quarter 07 Renewal Retention (Quoted) Commercial Lines - 93.8% Specialty Lines - 94.9% Personal Lines - 69.0% Rate Changes Commercial Lines - 0.1% decrease (Q/Q) Specialty Lines - 1.4% decrease (Q/Q) Personal Lines - 42.8% increase (Q/Q) New Bus
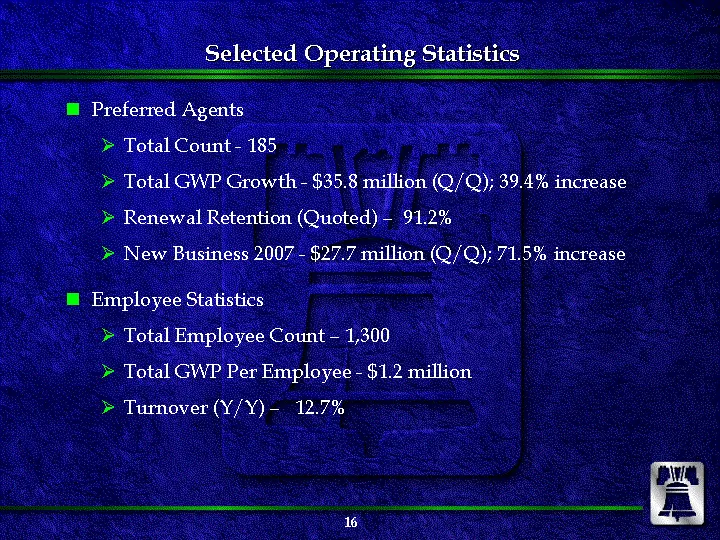
Slide 16: Selected Operating Statistics
Selected Operating Statistics Preferred Agents Total Count - 185 Total GWP Growth - $35.8 million (Q/Q); 39.4% increase Renewal Retention (Quoted) - 91.2% New Business 2007 - $27.7 million (Q/Q); 71.5% increase Employee Statistics Total Employee Count - 1,300 Total GWP Per Employee - $1.2 million Tu
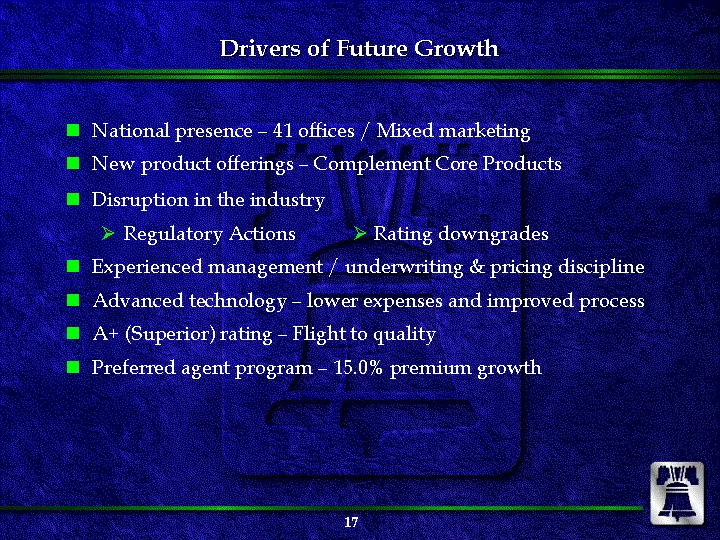
Slide 17: Drivers of Future Growth
Drivers of Future Growth National presence - 41 offices / Mixed marketing New product offerings - Complement Core Products Disruption in the industry Regulatory Actions ? Rating downgrades Experienced management / underwriting & pricing discipline Advanced technology - lower expenses and improved pr
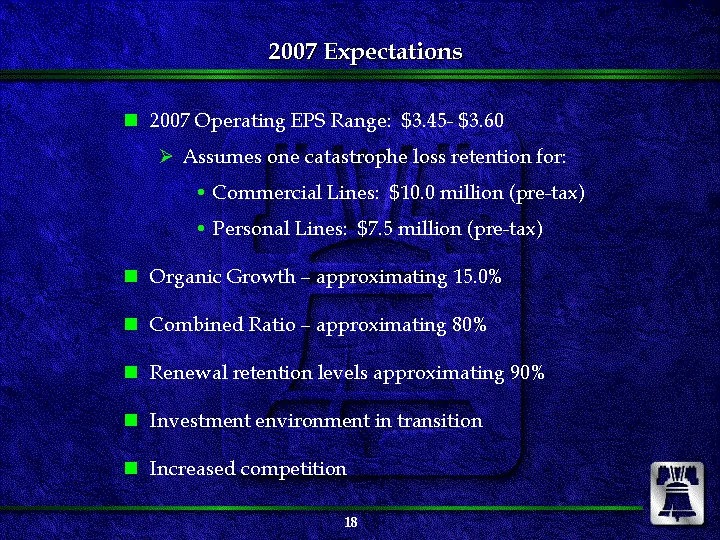
Slide 18: 2007 Expectations
2007 Expectations 2007 Operating EPS Range: $3.45- $3.60 Assumes one catastrophe loss retention for: Commercial Lines: $10.0 million (pre-tax) Personal Lines: $7.5 million (pre-tax) Organic Growth - approximating 15.0% Combined Ratio - approximating 80% Renewal retention levels approximating 90% Inv
Slide 19: Philadelphia Consolidated Holding Corp. Founded 1962
Philadelphia Consolidated Holding Corp. Founded 1962
Source: SEC EDGAR · 8-K filed Apr 27, 2007
More decks from Philadelphia Consolidated Holding Corp
 Merger or Acquisition (July 2008)28 slides · Jul 23, 2008
 Merger or Acquisition (July 2008)21 slides · Jul 23, 2008
 Q1 2008 Earnings Presentation19 slides · Apr 25, 2008
 Q4 2007 Earnings Presentation25 slides · Feb 25, 2008
 Q3 2007 Earnings Presentation25 slides · Oct 26, 2007
 Q3 2006 Earnings Presentation23 slides · Oct 30, 2006