SunTrust Banks — Credit Suisse Financial Services Forum 2014
20 slides from SunTrust Banks's conference presentation, Feb 12, 2014
Slide 1: Credit Suisse Financial Services Forum
Credit Suisse Financial Services Forum Aleem Gillani, Chief Financial Officer, SunTrust Banks, Inc. February 12, 2014
Slide 2: Important Cautionary Statement About Forward-Looking Statements
2 Important Cautionary Statement About Forward-Looking Statements The following should be read in conjunction with the financial statements, notes and other information contained in the Company’s 2012 Annual Report on Form 10-K, Quarterly Reports on Form 10-Q, and Current Reports on Form 8-K. This p
Slide 3: Franchise Overview: Who is SunTrust?
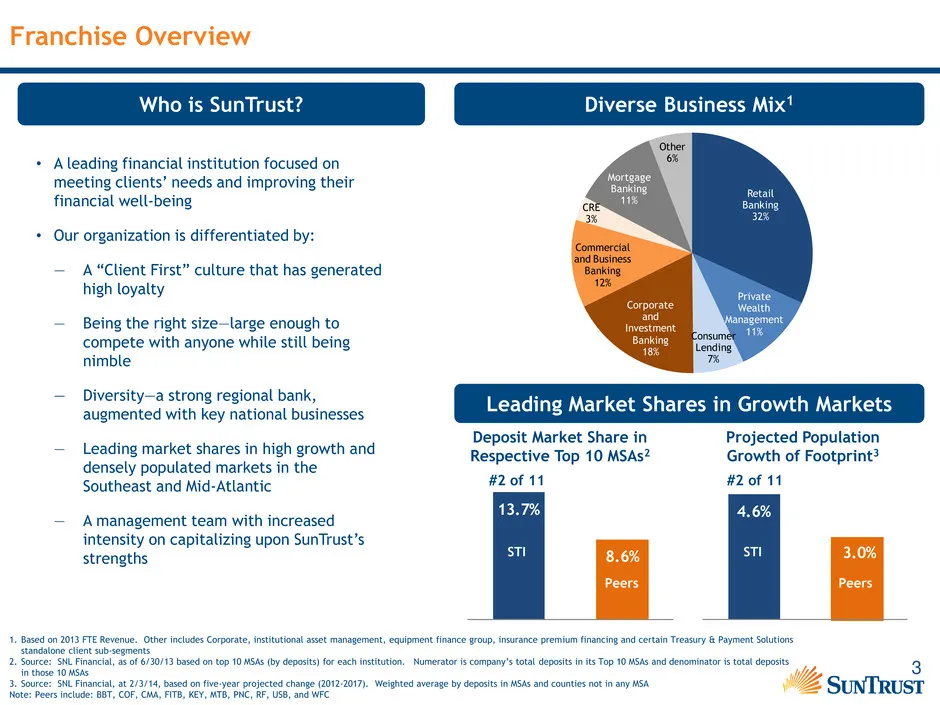
3 4.6% 3.0% 13.7% 8.6% Franchise Overview Who is SunTrust? Diverse Business Mix1 • A leading financial institution focused on meeting clients’ needs and improving their financial well-being • Our organization is differentiated by: — A “Client First” culture that has generated high loyalty — Being th
Slide 4: Solid Momentum Generated in 2013
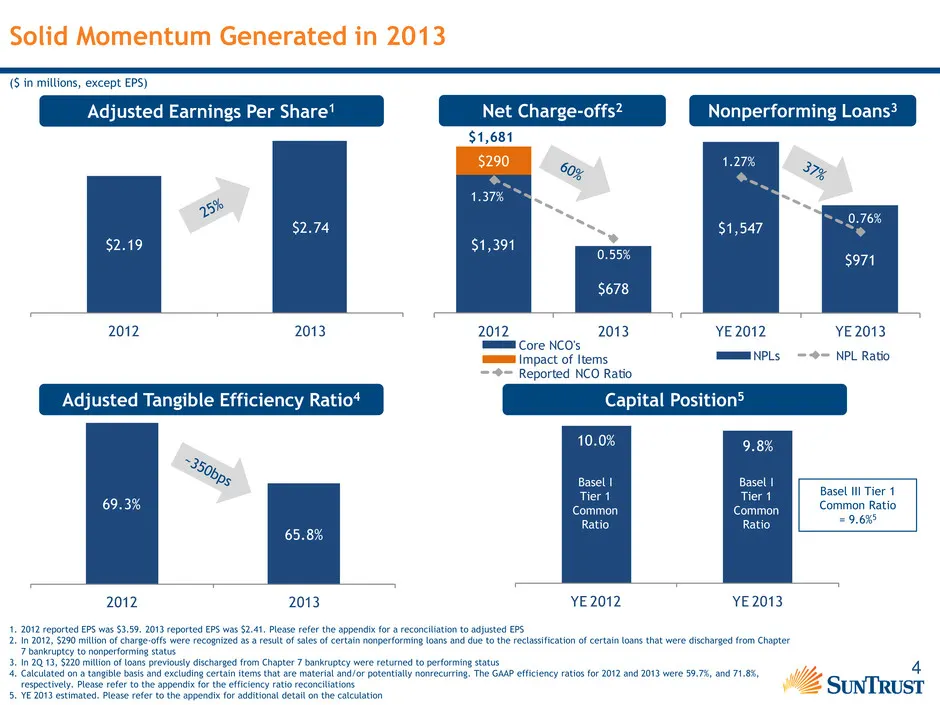
4 10.0% 9.8% YE 2012 YE 2013 69.3% 65.8% 2012 2013 $1,547 $971 1.27% 0.76% YE 2012 YE 2013 NPLs NPL Ratio $2.19 $2.74 2012 2013 Solid Momentum Generated in 2013 Adjusted Earnings Per Share1 1. 2012 reported EPS was $3.59. 2013 reported EPS was $2.41. Please refer the appendix for a reconciliation to
Slide 5: 2014 Focus Areas by Segment
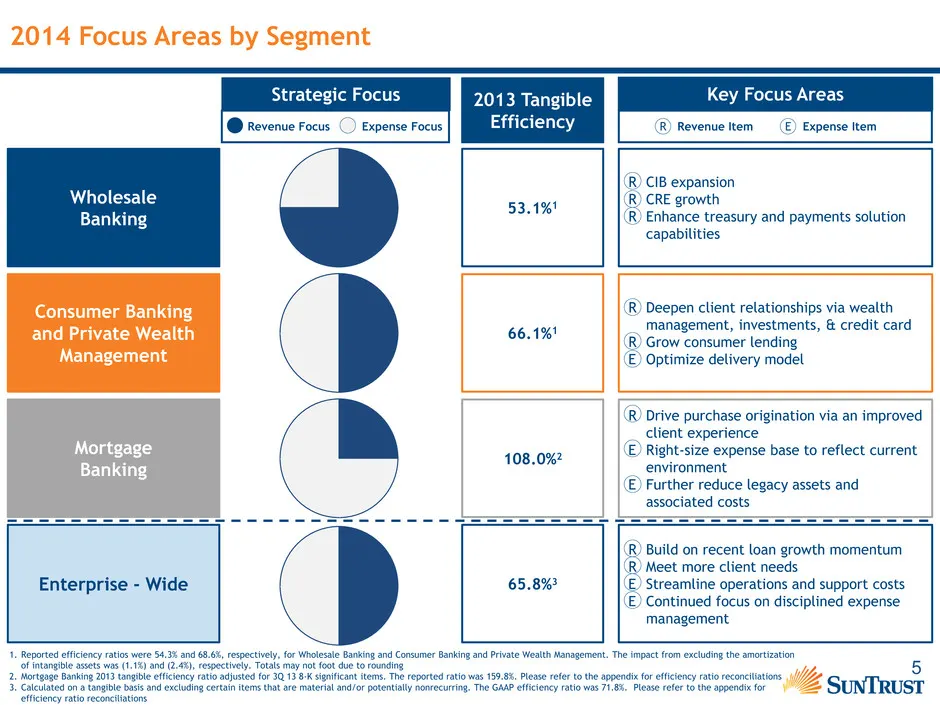
5 2014 Focus Areas by Segment Wholesale Banking Consumer Banking and Private Wealth Management Mortgage Banking Enterprise - Wide Strategic Focus 2013 Tangible Efficiency Key Focus Areas 53.1%1 R CIB expansion R CRE growth R Enhance treasury and payments solution capabilities 66.1%1 R Deepen client
Slide 6: Wholesale Banking Strategic Priorities
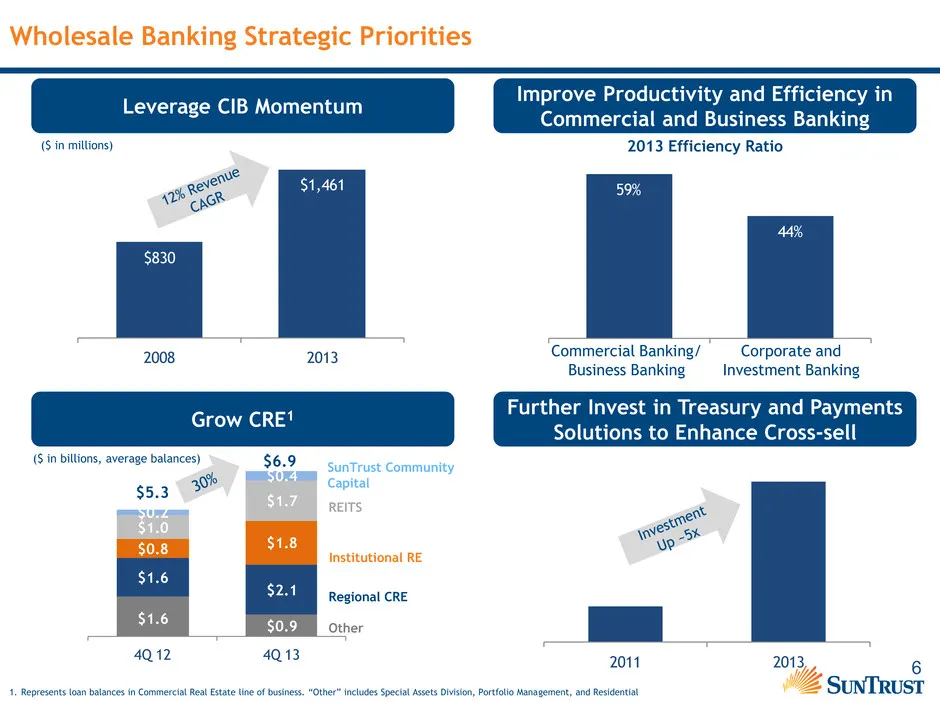
6 59% 44%$830 $1,461 2008 2013 Commercial Banking/ Business Banking $1.6 $0.9 $1.6 $2.1 $0.8 $1.8 $1.0 $1.7 $0.2 $0.4 4Q 12 4Q 13 Wholesale Banking Strategic Priorities Leverage CIB Momentum 1. Represents loan balances in Commercial Real Estate line of business. “Other” includes Special Assets Divis
Slide 7: Investment Banking Spotlight
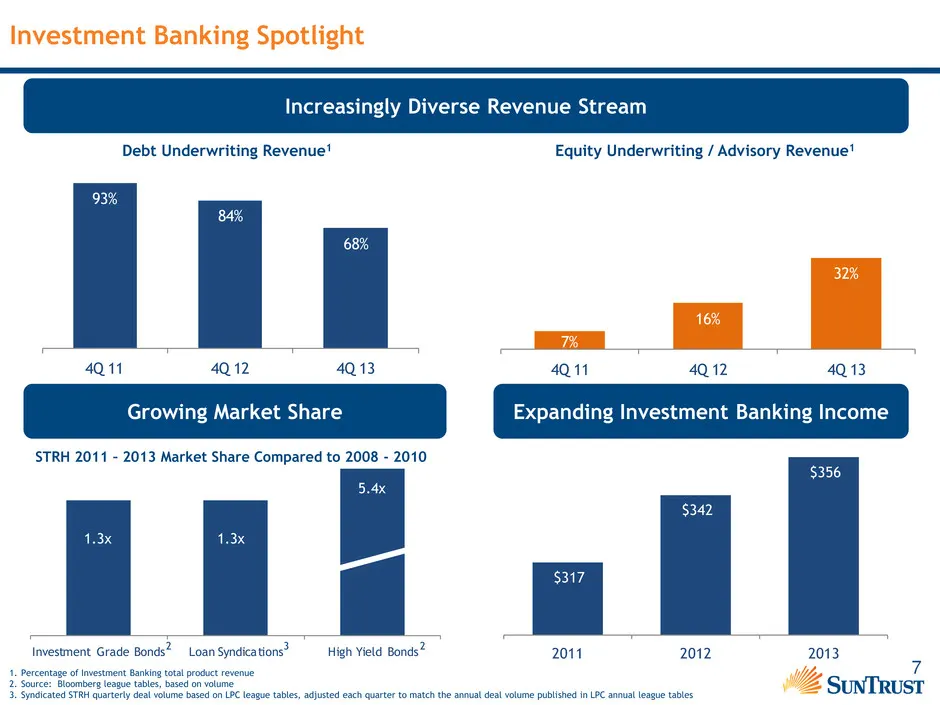
7 7% 16% 32% 4Q 11 4Q 12 4Q 13 Investment Grade Bonds Loan Syndications High Yield Bonds Investment Banking Spotlight Increasingly Diverse Revenue Stream Debt Underwriting Revenue1 Equity Underwriting / Advisory Revenue1 Expanding Investment Banking Income 2 3 2 1. Percentage of Investment Banking t
Slide 8: Consumer Banking & Private Wealth Management Strategic Priorities
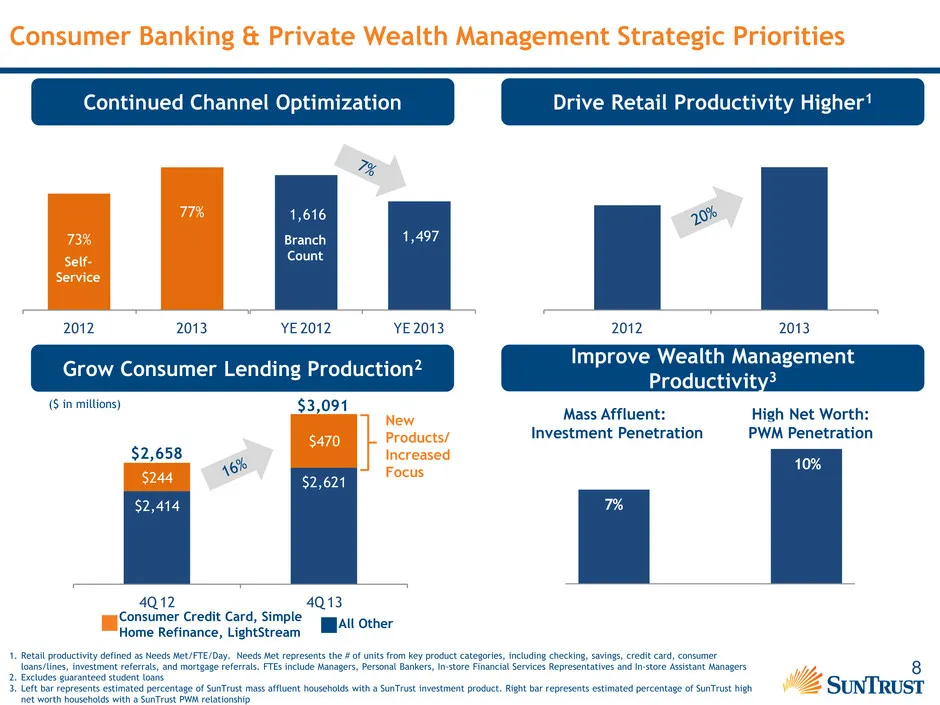
8 1,616 1,497 YE 2012 YE 2013 73% 77% 2012 2013 1. Retail productivity defined as Needs Met/FTE/Day. Needs Met represents the # of units from key product categories, including checking, savings, credit card, consumer loans/lines, investment referrals, and mortgage referrals. FTEs include Managers, P
Slide 9: Wealth Management Spotlight
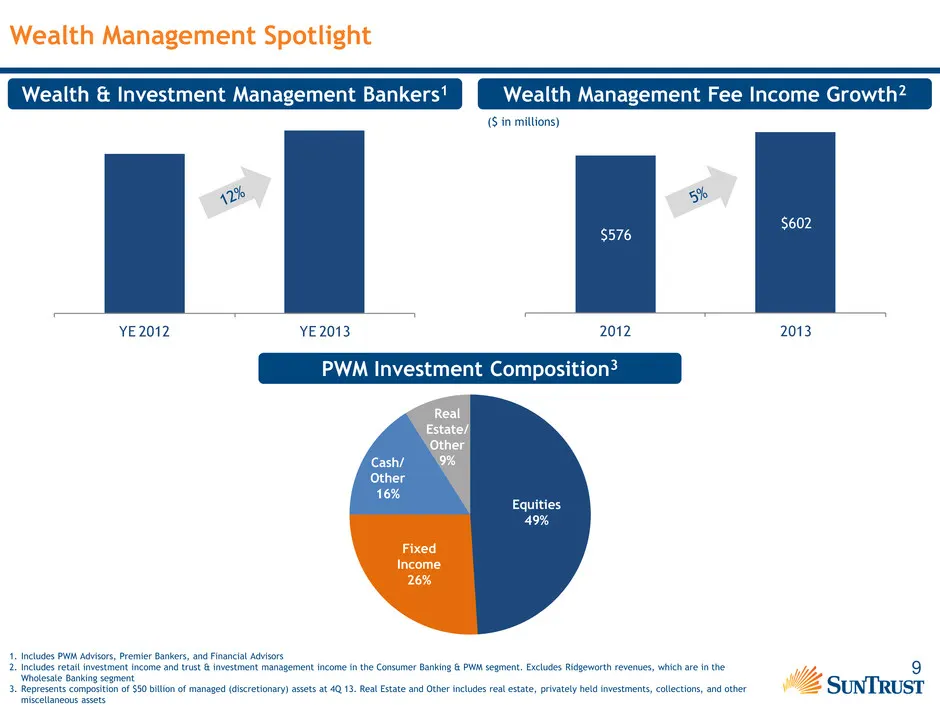
9 $576 $602 2012 2013YE 2012 YE 2013 Wealth Management Spotlight 1. Includes PWM Advisors, Premier Bankers, and Financial Advisors 2. Includes retail investment income and trust & investment management income in the Consumer Banking & PWM segment. Excludes Ridgeworth revenues, which are in the Whole
Slide 10: Mortgage Banking Strategic Priorities
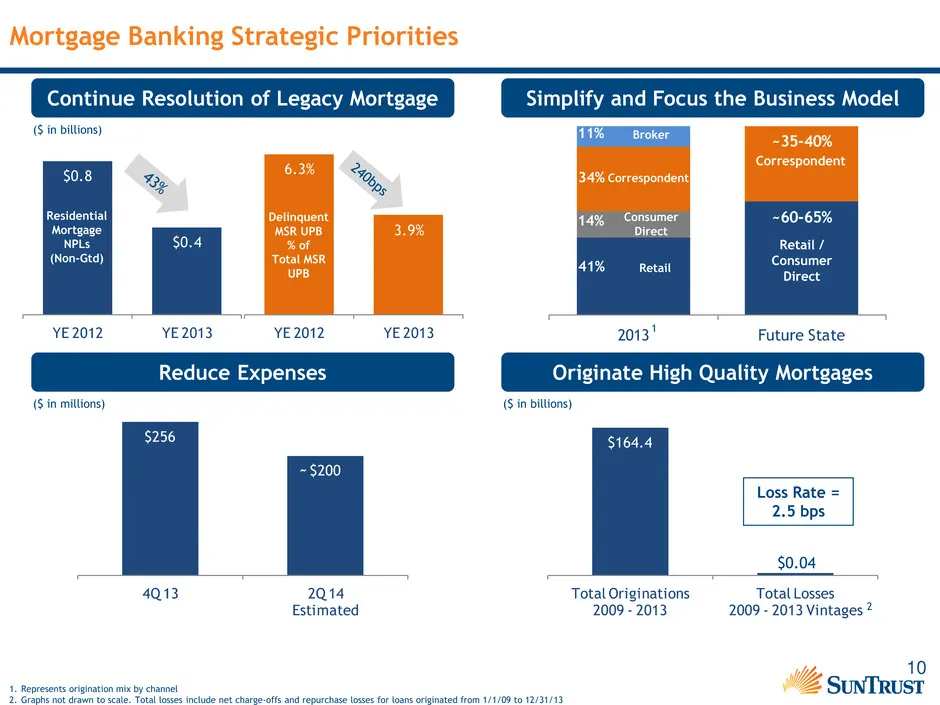
10 $164.4 Total Originations 2009 - 2013 Total Losses 2009 - 2013 Vintages ~60-65% ~35-40% 2013 Future State 6.3% 3.9% YE 2012 YE 2013 $0.8 $0.4 YE 2012 YE 2013 Mortgage Banking Strategic Priorities ($ in millions) Simplify and Focus the Business Model Continue Resolution of Legacy Mortgage Reduce E
Slide 11: Loan Portfolio Diversification
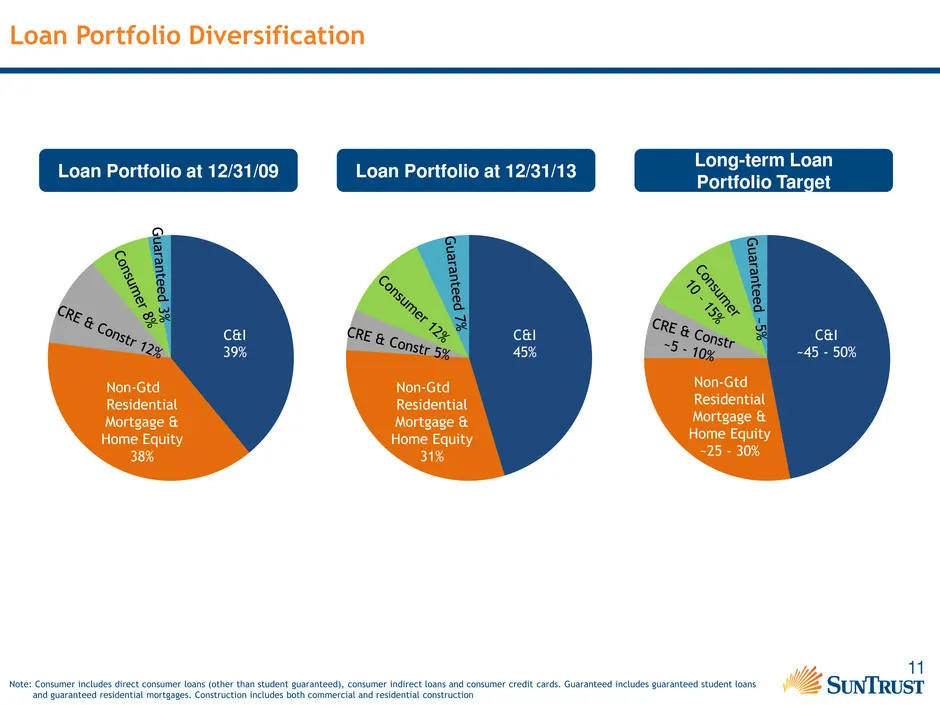
11 Loan Portfolio Diversification Note: Consumer includes direct consumer loans (other than student guaranteed), consumer indirect loans and consumer credit cards. Guaranteed includes guaranteed student loans and guaranteed residential mortgages. Construction includes both commercial and residential
Slide 12: Loan Growth Momentum Building
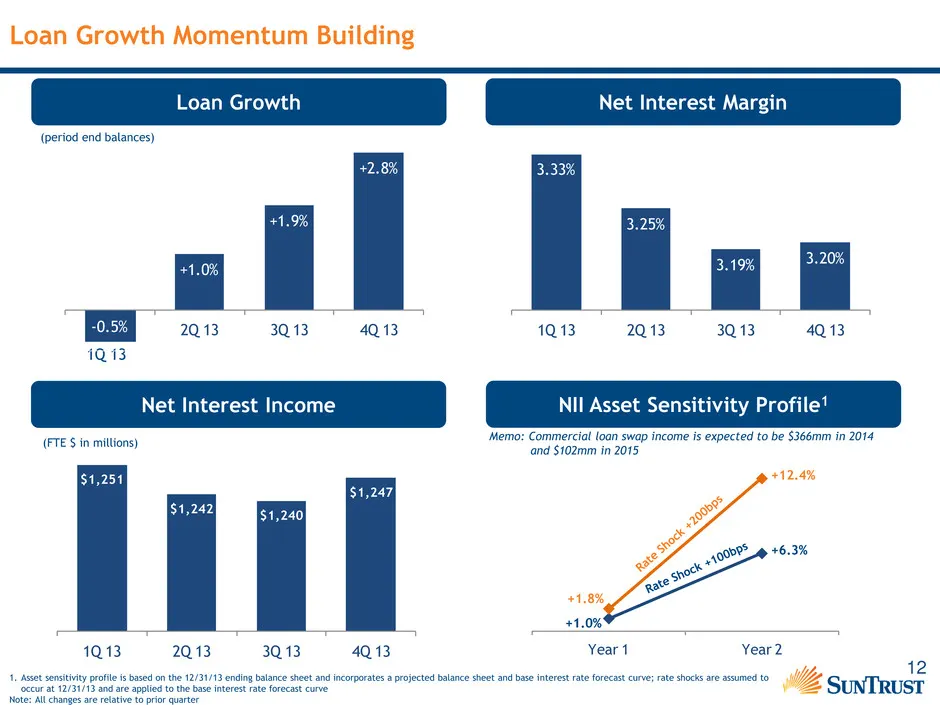
12 Year 1 Year 2 $1,251 $1,242 $1,240 $1,247 1Q 13 2Q 13 3Q 13 4Q 13 Loan Growth Momentum Building Net Interest Income Loan Growth (period end balances) (FTE $ in millions) 1Q 13 1. Asset sensitivity profile is based on the 12/31/13 ending balance sheet and incorporates a projected balance sheet and
Slide 13: 2014 Adjusted Tangible Efficiency Ratio
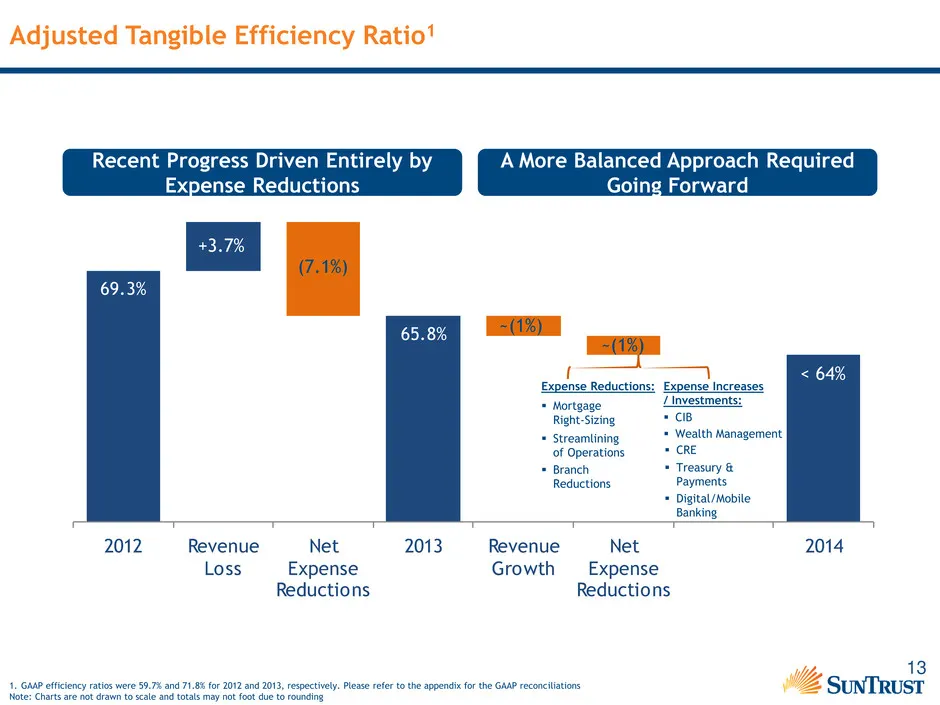
13 69.3% 65.8% 2012 Revenue Loss Net Expense Reductions 2013 Revenue Growth Net Expense Reductions 2014 Adjusted Tangible Efficiency Ratio1 +3.7% (7.1%) ~(1%) < 64% 1. GAAP efficiency ratios were 59.7% and 71.8% for 2012 and 2013, respectively. Please refer to the appendix for the GAAP reconciliatio
Slide 14: Investment Thesis: Why SunTrust?
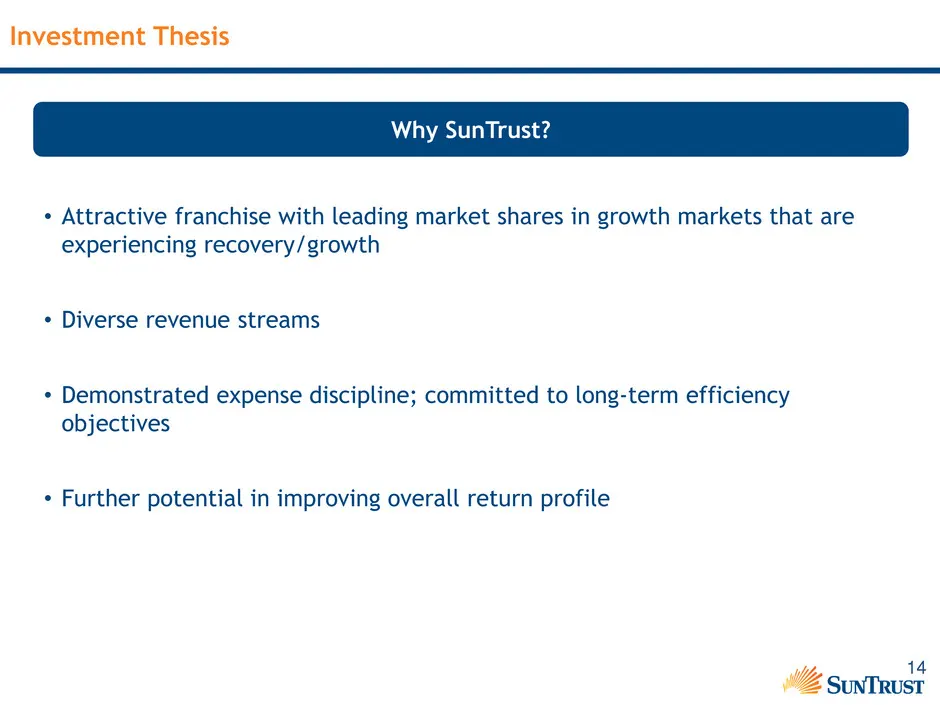
14 Investment Thesis Why SunTrust? • Attractive franchise with leading market shares in growth markets that are experiencing recovery/growth • Diverse revenue streams • Demonstrated expense discipline; committed to long-term efficiency objectives • Further potential in improving overall return profi
Slide 15: Appendix
Appendix WZ SunTrust
Slide 16: Income Statement 2012
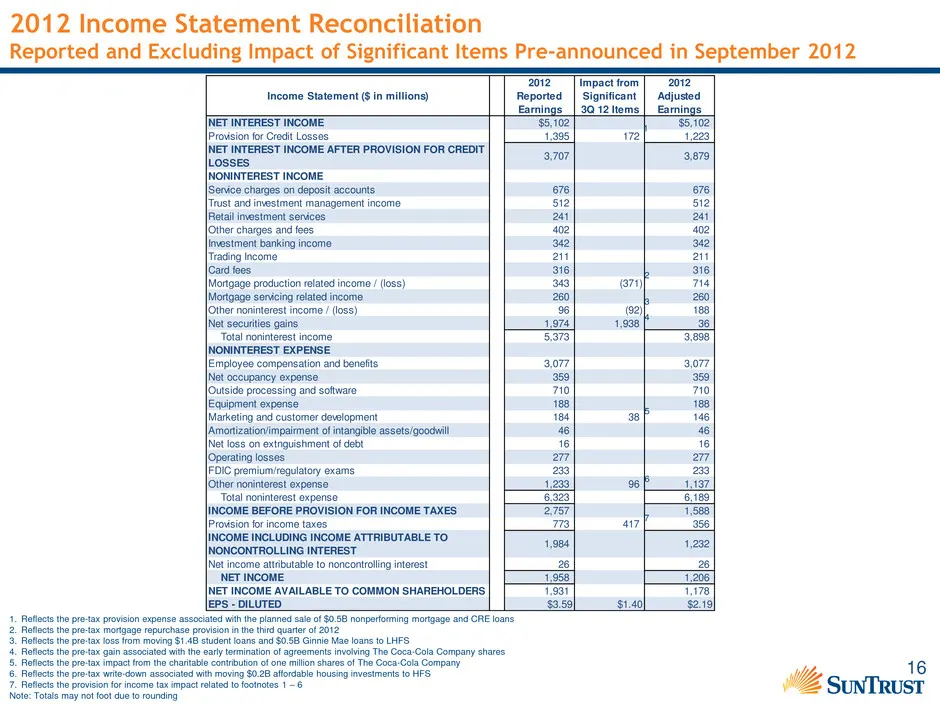
16 Income Statement ($ in millions) 2012 Reported Earnings Impact from Significant 3Q 12 Items 2012 Adjusted Earnings NET INTEREST INCOME $5,102 $5,102 Provision for Credit Losses 1,395 172 1,223 NET INTEREST INCOME AFTER PROVISION FOR CREDIT LOSSES 3,707 3,879 NONINTEREST INCOME Service charges on
Slide 17: Income Statement 2013
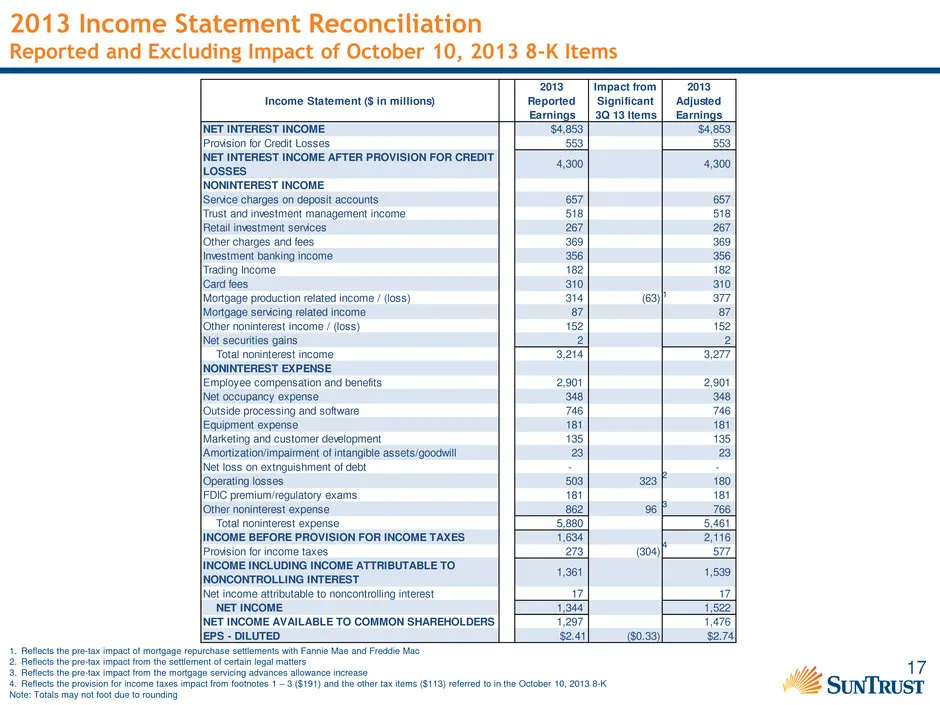
17 Income Statement ($ in millions) 2013 Reported Earnings Impact from Significant 3Q 13 Items 2013 Adjusted Earnings NET INTEREST INCOME $4,853 $4,853 Provision for Credit Losses 553 553 NET INTEREST INCOME AFTER PROVISION FOR CREDIT LOSSES 4,300 4,300 NONINTEREST INCOME Service charges on deposit
Slide 18: Reconciliation of Efficiency Ratio
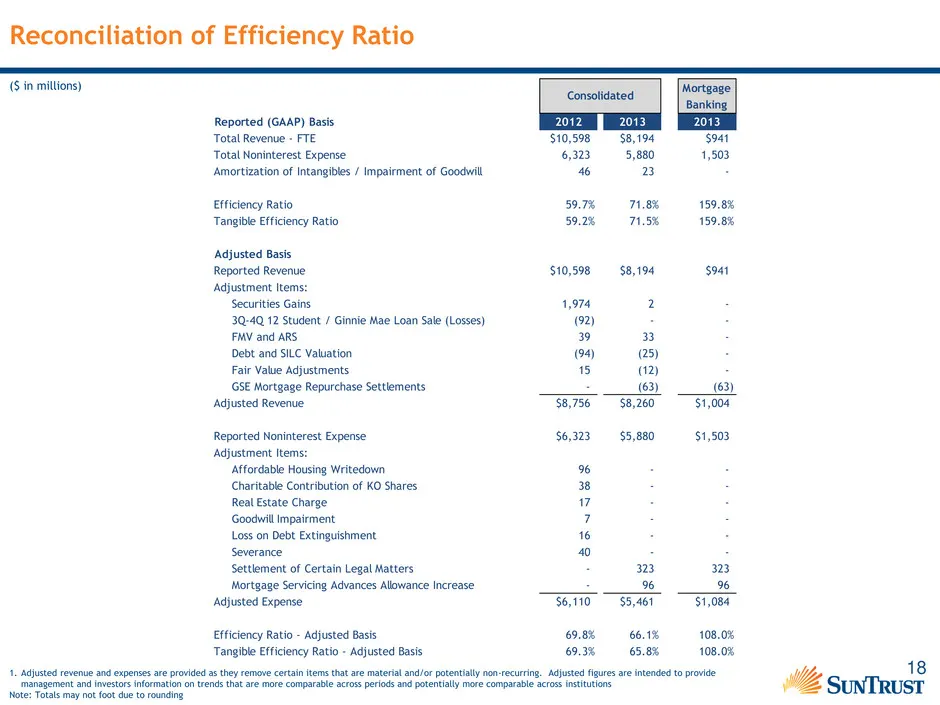
18 1. Adjusted revenue and expenses are provided as they remove certain items that are material and/or potentially non-recurring. Adjusted figures are intended to provide management and investors information on trends that are more comparable across periods and potentially more comparable across ins
Slide 19: Reconciliation of Tier 1 Common Equity Ratio
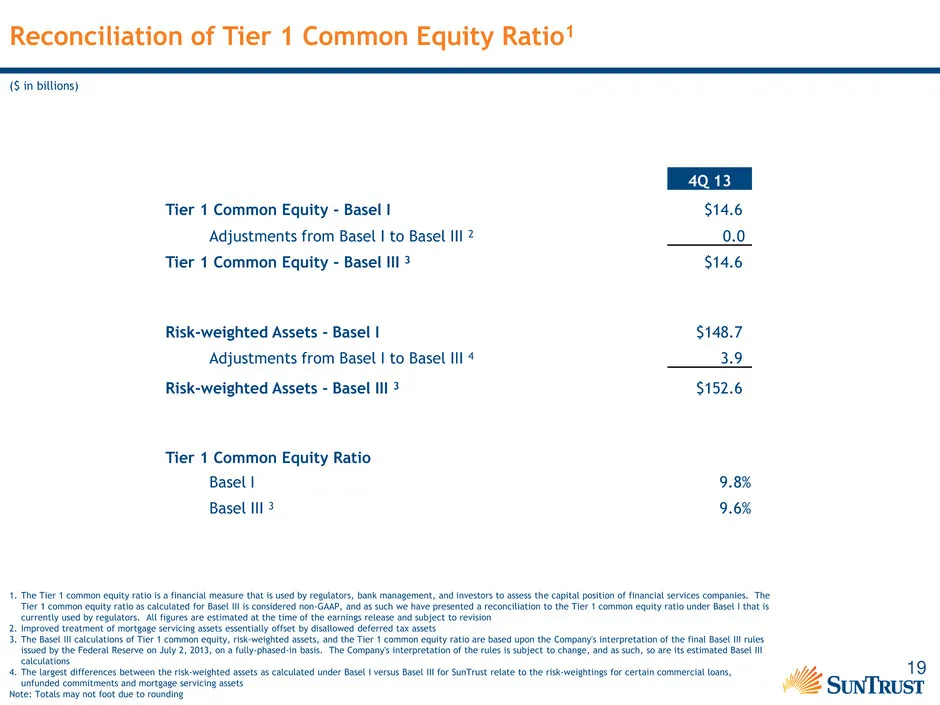
19 Reconciliation of Tier 1 Common Equity Ratio1 ($ in billions) 4Q 13 Tier 1 Common Equity - Basel I $14.6 Adjustments from Basel I to Basel III 2 0.0 Tier 1 Common Equity - Basel III 3 $14.6 Risk-weighted Assets - Basel I $148.7 Adjustments from Basel I to Basel III 4 3.9 Risk-weighted Assets - Ba
Slide 20: Credit Suisse Financial Services Forum
Credit Suisse Financial Services Forum Aleem Gillani, Chief Financial Officer, SunTrust Banks, Inc. February 12, 2014
Source: SEC EDGAR · 8-K filed Feb 12, 2014
More decks from SunTrust Banks Inc
 Q3 2019 Earnings Presentation21 slides · Oct 17, 2019
 Q2 2019 Earnings Presentation22 slides · Jul 18, 2019
 Q1 2019 Earnings Presentation22 slides · Apr 18, 2019
 Merger or Acquisition (February 2019)38 slides · Feb 7, 2019
 Q4 2018 Earnings Presentation23 slides · Jan 18, 2019
 2018 Goldman Sachs US Financial Services Conference30 slides · Dec 4, 2018