Cloud Peak Energy — CEO Energy-Power Conference 2013
40 slides from Cloud Peak Energy's conference presentation, Sep 11, 2013
Slide 1: CEO Energy-Power Conference September 12, 2013
CEO Energy-Power Conference SEPTEMBER 12, 2013
Slide 2: Cautionary Note Regarding Forward-Looking Statements
1 Cloud Peak Energy Inc. Financial Data Cloud Peak Energy Inc. is the sole owner of Cloud Peak Energy Resources LLC. Unless expressly stated otherwise in this presentation, all financial data included herein is consolidated financial data of Cloud Peak Energy Inc. Cautionary Note Regarding Forward-L
Slide 3: Cloud Peak Energy Profile
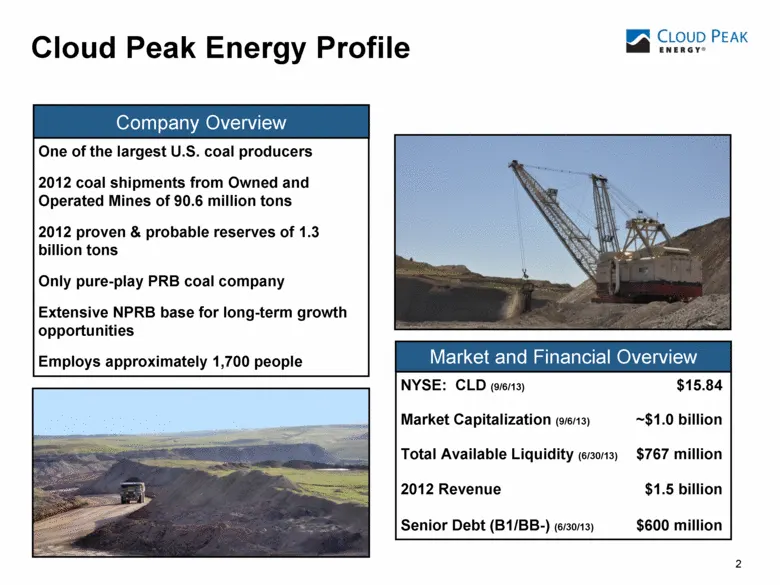
2 2 2 Cloud Peak Energy Profile One of the largest U.S. coal producers 2012 coal shipments from Owned and Operated Mines of 90.6 million tons 2012 proven & probable reserves of 1.3 billion tons Only pure-play PRB coal company Extensive NPRB base for long-term growth opportunities Employs approximate
Slide 4: Low-Risk Surface Operations
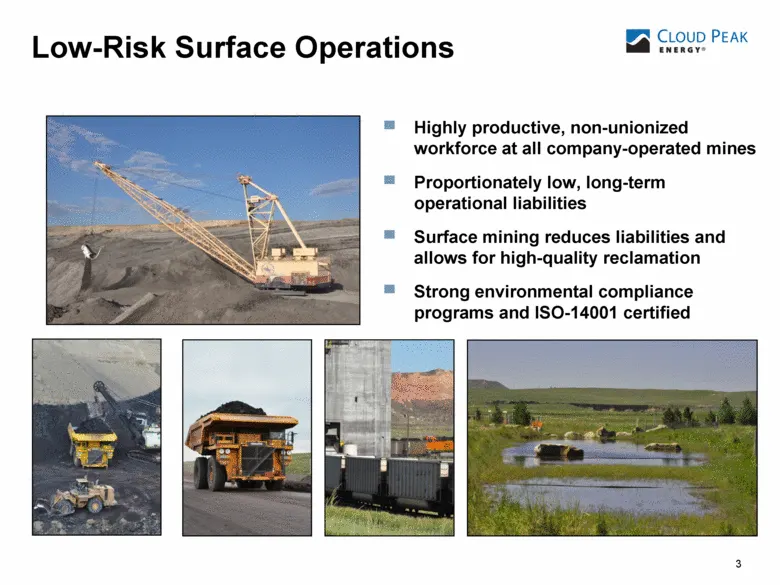
3 Low-Risk Surface Operations Highly productive, non-unionized workforce at all company-operated mines Proportionately low, long-term operational liabilities Surface mining reduces liabilities and allows for high-quality reclamation Strong environmental compliance programs and ISO-14001 certified
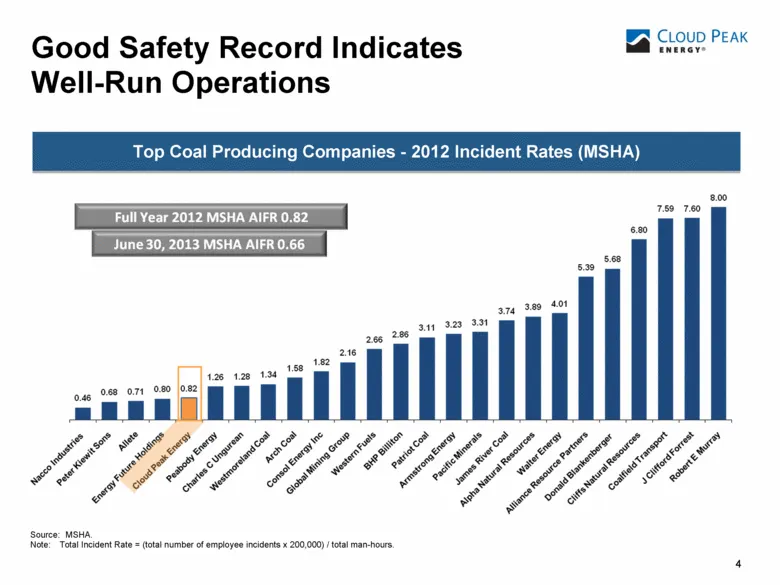
Slide 5: Top Coal Producing Companies - 2012 Incident Rates (MSHA)
4 4 4 4 Top Coal Producing Companies - 2012 Incident Rates (MSHA) Source: MSHA. Note: Total Incident Rate = (total number of employee incidents x 200,000) / total man-hours. Good Safety Record Indicates Well-Run Operations
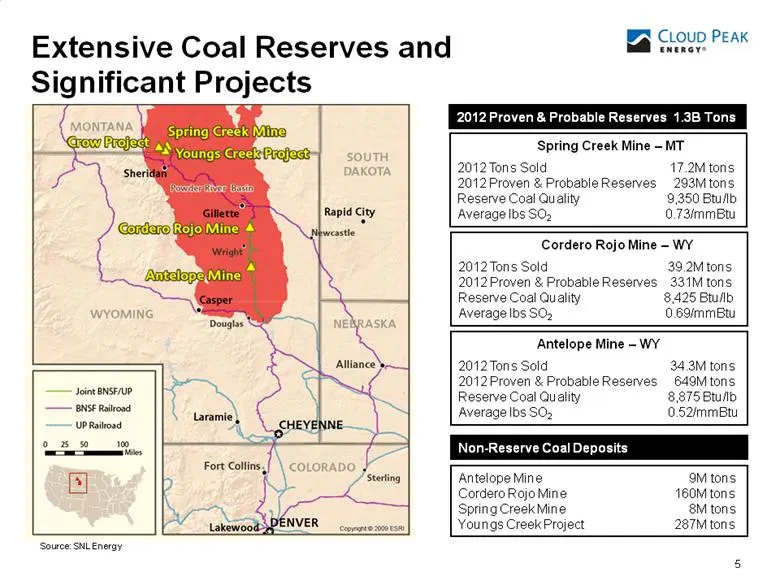
Slide 6: Extensive Coal Reserves and Significant Projects
Extensive Coal Reserves and Significant Projects 5 Spring Creek Mine – MT 2012 Tons Sold 17.2M tons 2012 Proven & Probable Reserves 293M tons Reserve Coal Quality 9,350 Btu/lb Average lbs SO2 0.73/mmBtu Antelope Mine – WY 2012 Tons Sold 34.3M tons 2012 Proven & Probable Reserves 649M tons Reserve Co
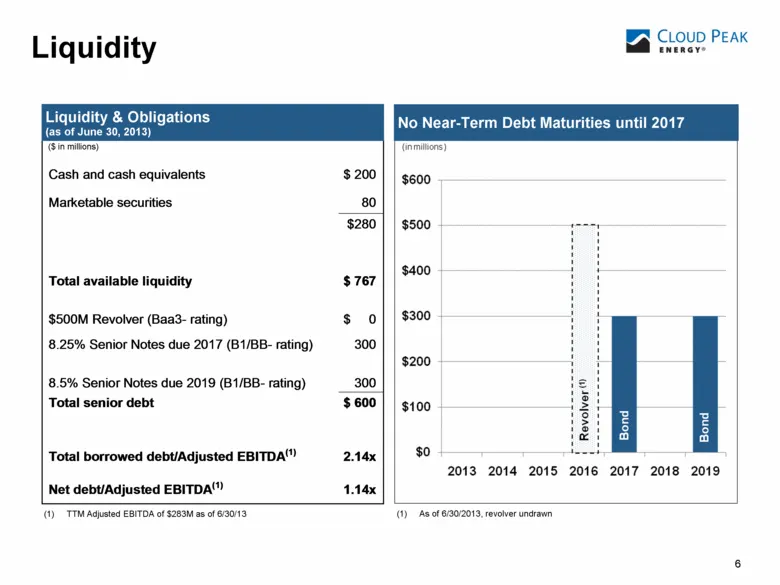
Slide 7: Liquidity & Obligations
(1) TTM Adjusted EBITDA of $283M as of 6/30/13 Liquidity & Obligations (as of June 30, 2013) Liquidity ($ in millions) 6 No Near-Term Debt Maturities until 2017(1) As of 6/30/2013, revolver undrawn Cash and cash equivalents $ 200 Marketable securities 80 $280 Total available liquidity $ 767 $500 M R
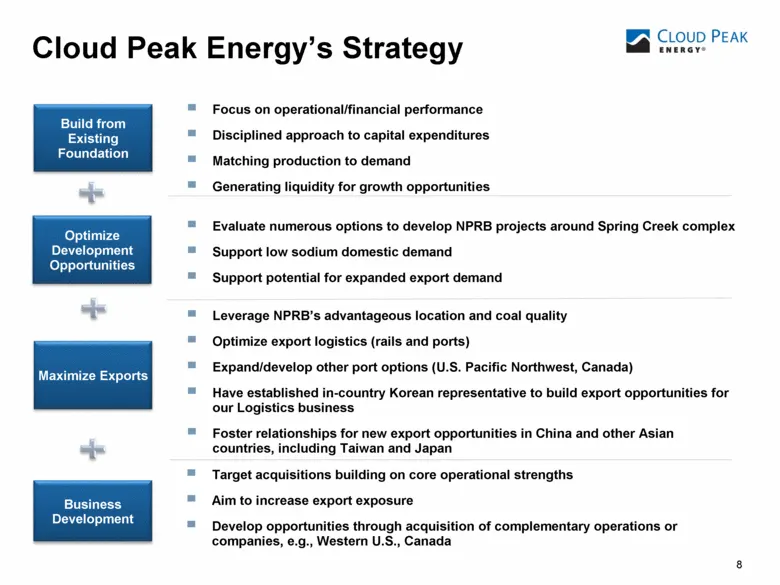
Slide 8: Cloud Peak Energy's Strategy
8 Cloud Peak Energy’s Strategy Focus on operational/financial performance Disciplined approach to capital expenditures Matching production to demand Generating liquidity for growth opportunities Build from Existing Foundation Optimize Development Opportunities Business Development Evaluate numerous
Slide 9: Domestic Strategy
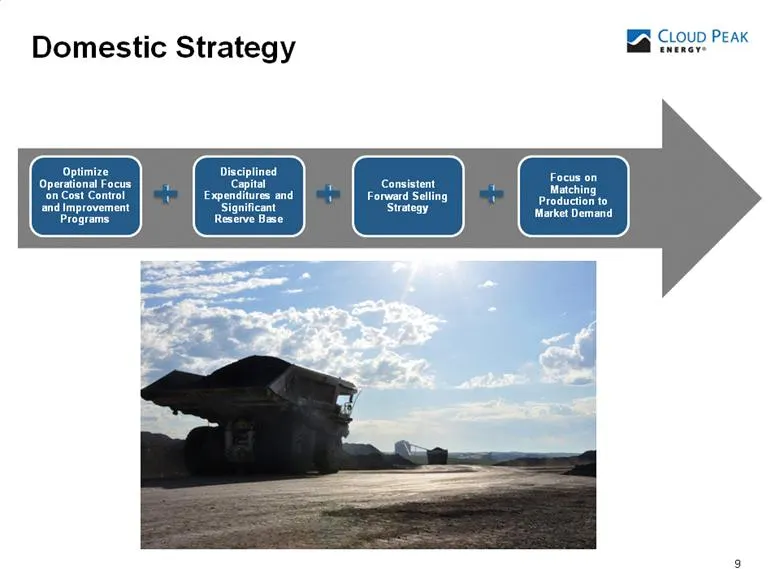
9 Domestic Strategy Consistent Forward Selling Strategy Focus on Matching Production to Market Demand Optimize Operational Focus on Cost Control and Improvement Programs Disciplined Capital Expenditures and Significant Reserve Base
Slide 10: Domestic External Environment
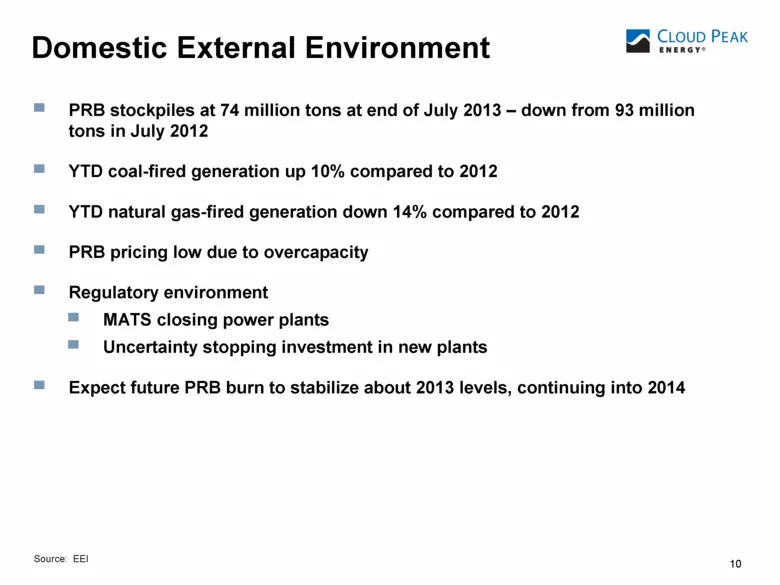
Domestic External Environment 10 PRB stockpiles at 74 million tons at end of July 2013 – down from 93 million tons in July 2012 YTD coal-fired generation up 10% compared to 2012 YTD natural gas-fired generation down 14% compared to 2012 PRB pricing low due to overcapacity Regulatory environment MATS
Slide 11: Response to Current Market Conditions
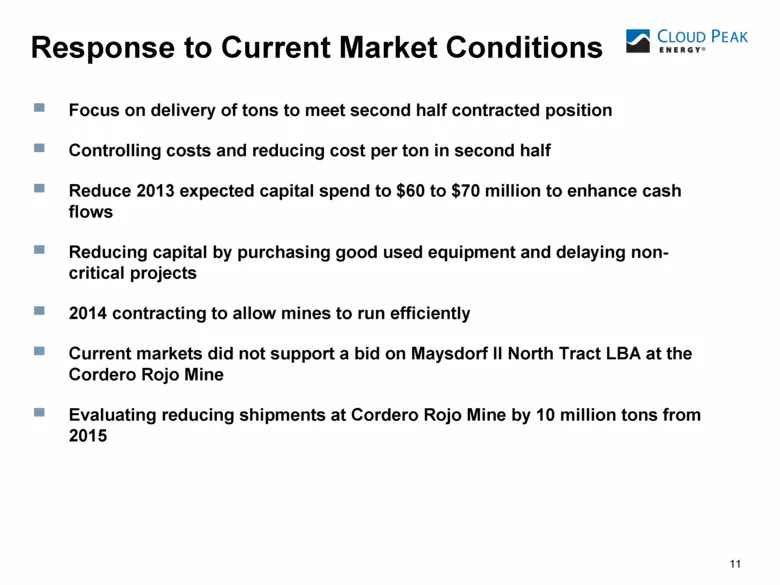
11 11 11 (1) Focus on delivery of tons to meet second half contracted position Controlling costs and reducing cost per ton in second half Reduce 2013 expected capital spend to $60 to $70 million to enhance cash flows Reducing capital by purchasing good used equipment and delaying non-critical projec
Slide 12: Strong Forward Sales Position
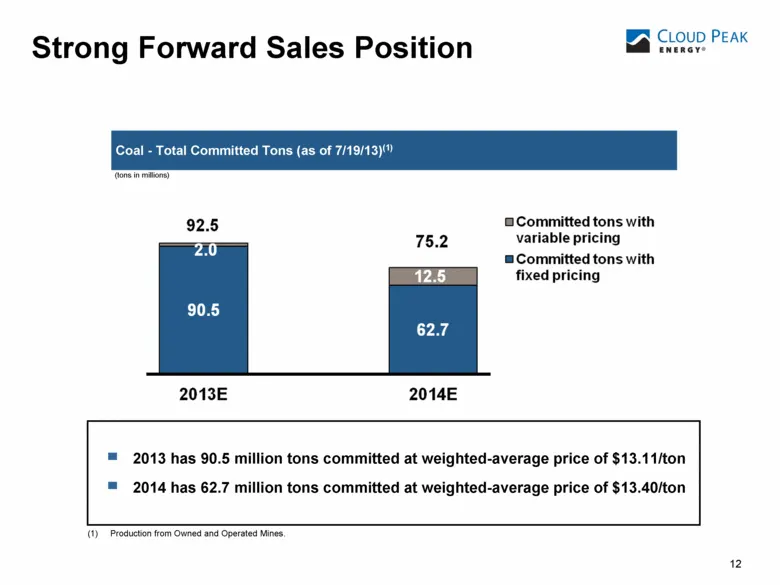
12 Strong Forward Sales Position (tons in millions) (1) Production from Owned and Operated Mines. 2013 has 90.5 million tons committed at weighted-average price of $13.11/ton 2014 has 62.7 million tons committed at weighted-average price of $13.40/ton Coal - Total Committed Tons (as of 7/19/13)(1)
Slide 13: Export Strategy
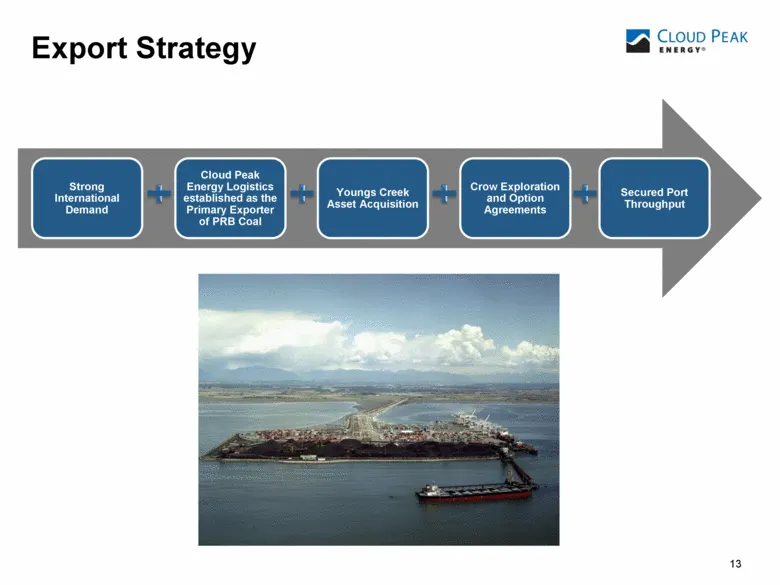
13 Export Strategy Strong International Demand Cloud Peak Energy Logistics established as the Primary Exporter of PRB Coal Youngs Creek Asset Acquisition Crow Exploration and Option Agreements Secured Port Throughput
Slide 14: International External Environment
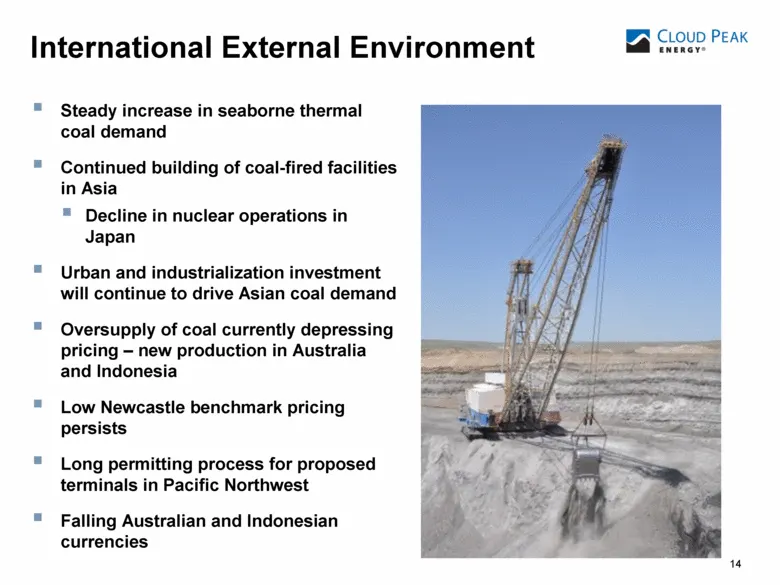
14 International External Environment Steady increase in seaborne thermal coal demand Continued building of coal-fired facilities in Asia Decline in nuclear operations in Japan Urban and industrialization investment will continue to drive Asian coal demand Oversupply of coal currently depressing pri
Slide 15: Increasing International Demand Supports PRB Exports
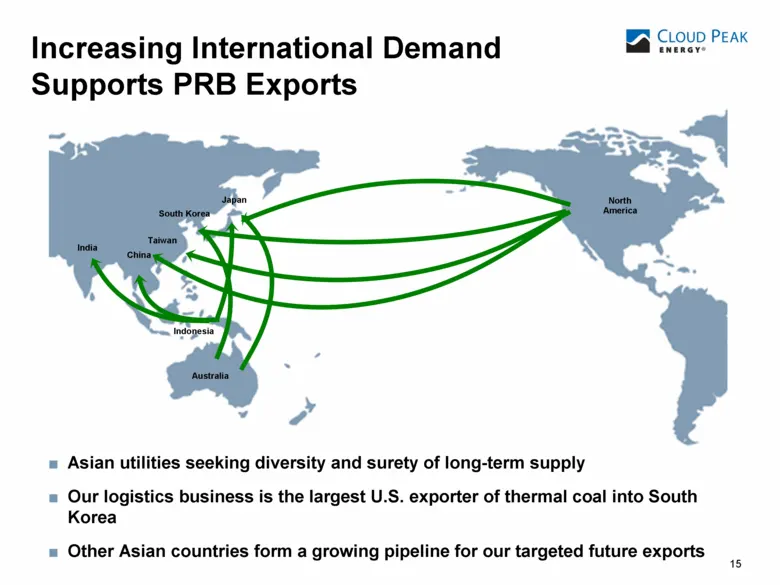
15 Asian utilities seeking diversity and surety of long-term supply Our logistics business is the largest U.S. exporter of thermal coal into South Korea Other Asian countries form a growing pipeline for our targeted future exports India Australia Indonesia China Taiwan South Korea Japan North Americ
Slide 16: Spring Creek Complex Export Assets – Geographic Advantage
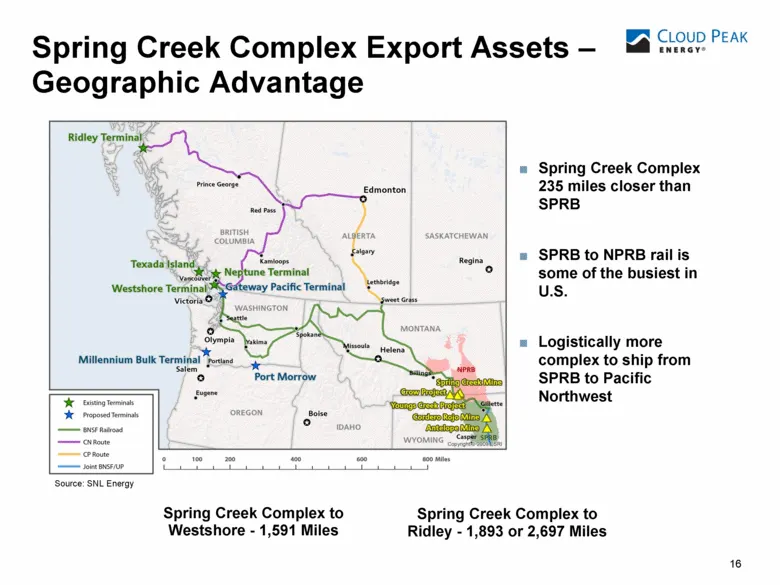
16 Spring Creek Complex Export Assets – Geographic Advantage Spring Creek Complex to Ridley - 1,893 or 2,697 Miles Spring Creek Complex to Westshore - 1,591 Miles Spring Creek Complex 235 miles closer than SPRB SPRB to NPRB rail is some of the busiest in U.S. Logistically more complex to ship from S
Slide 17: Spring Creek Complex – Export Quality Advantage
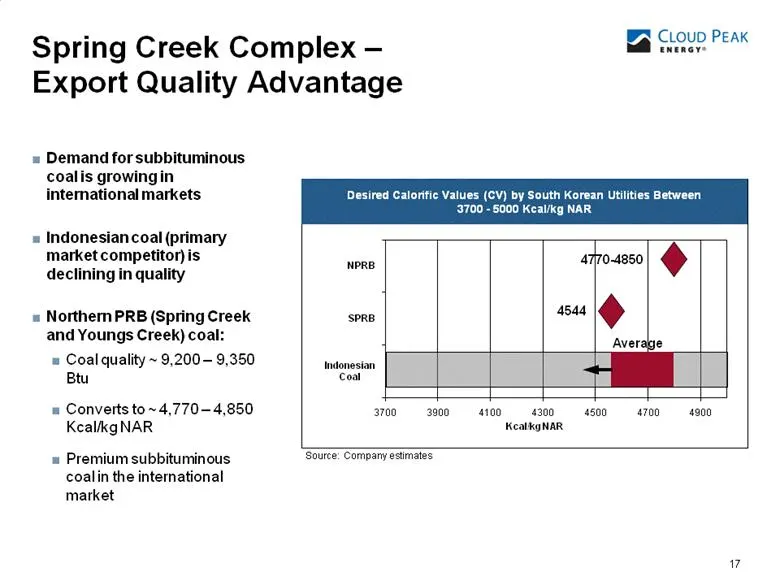
Spring Creek Complex – Export Quality Advantage 17 Demand for subbituminous coal is growing in international markets Indonesian coal (primary market competitor) is declining in quality Northern PRB (Spring Creek and Youngs Creek) coal: Coal quality ~ 9,200 – 9,350 Btu Converts to ~ 4,770 – 4,850 Kca
Slide 18: Key Projects
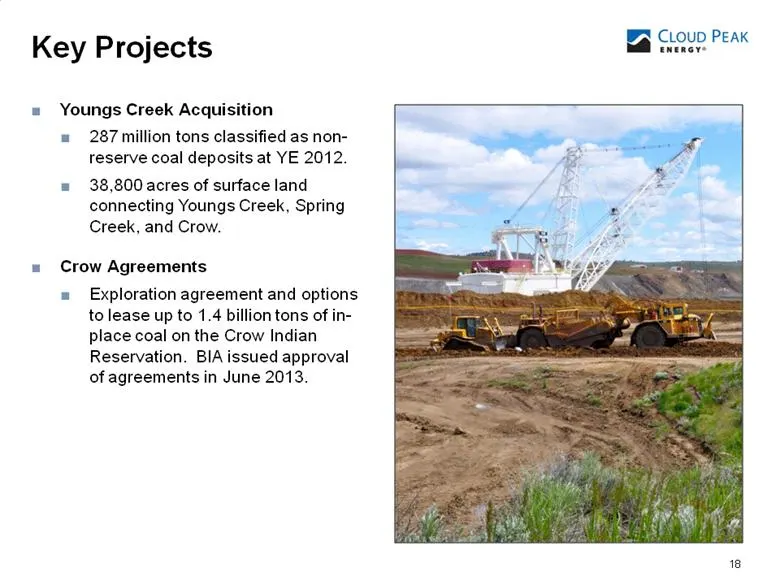
Key Projects 18 Youngs Creek Acquisition 287 million tons classified as non-reserve coal deposits at YE 2012. 38,800 acres of surface land connecting Youngs Creek, Spring Creek, and Crow. Crow Agreements Exploration agreement and options to lease up to 1.4 billion tons of in-place coal on the Crow I
Slide 19: Spring Creek Complex – Potential Development Options
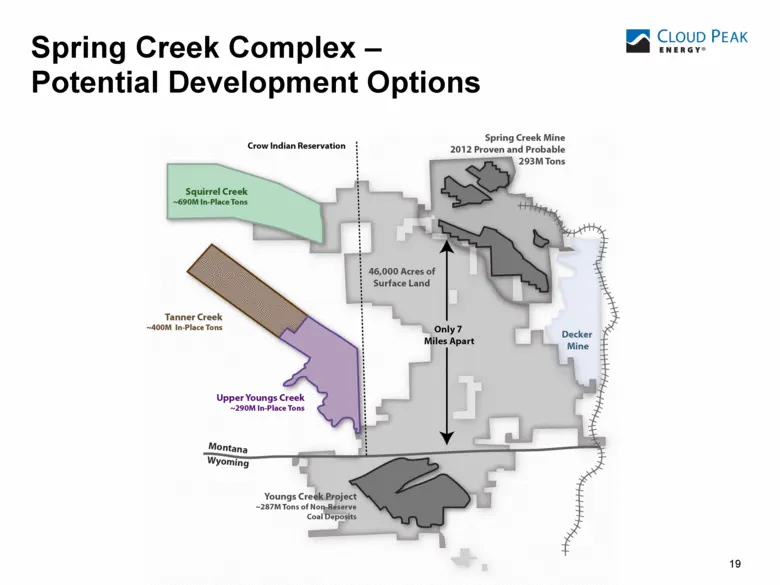
19 Spring Creek Complex – Potential Development Options
Slide 20: Cloud Peak Energy Port Position
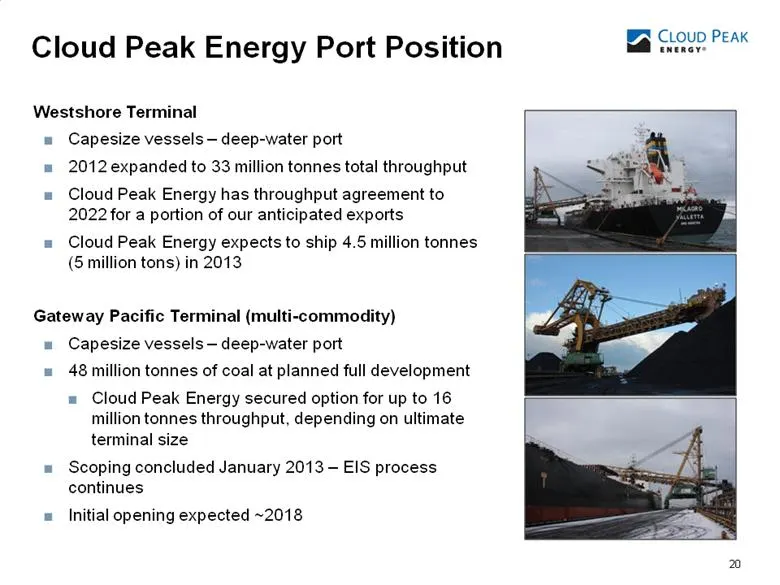
20 Cloud Peak Energy Port Position Westshore Terminal Capesize vessels – deep-water port 2012 expanded to 33 million tonnes total throughput Cloud Peak Energy has throughput agreement to 2022 for a portion of our anticipated exports Cloud Peak Energy expects to ship 4.5 million tonnes (5 million ton
Slide 21: Growing "Pro-Coal" Efforts
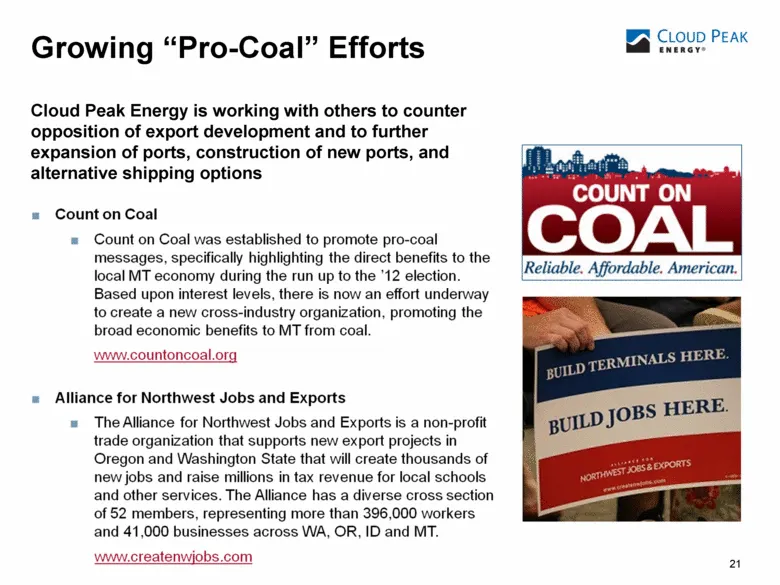
21 Growing “Pro-Coal” Efforts Cloud Peak Energy is working with others to counter opposition of export development and to further expansion of ports, construction of new ports, and alternative shipping options
Slide 22: Looking Forward
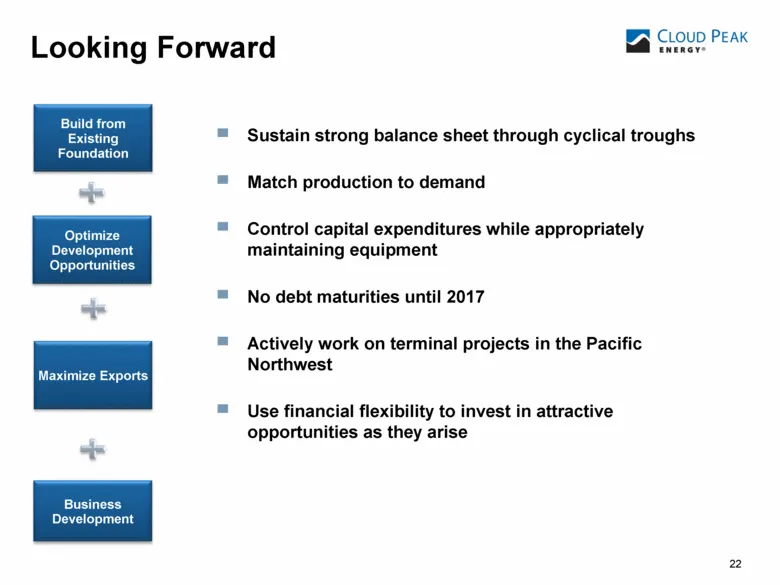
22 Looking Forward Sustain strong balance sheet through cyclical troughs Match production to demand Control capital expenditures while appropriately maintaining equipment No debt maturities until 2017 Actively work on terminal projects in the Pacific Northwest Use financial flexibility to invest in
Slide 23: Appendices
Appendices (Cloud Peak Energy Inc.)
Slide 24: 2013 Guidance – Estimates and 2012 Actuals
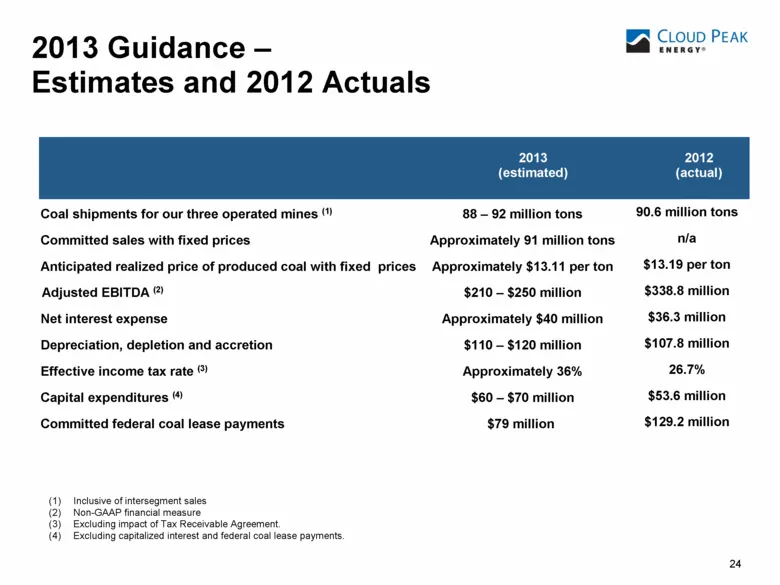
24 2013 Guidance – Estimates and 2012 Actuals 2013 (estimated) 2012 (actual) (1) Inclusive of intersegment sales (2) Non-GAAP financial measure (3) Excluding impact of Tax Receivable Agreement. (4) Excluding capitalized interest and federal coal lease payments. Coal shipments for our three operated
Slide 25: Average Cost of Produced Coal
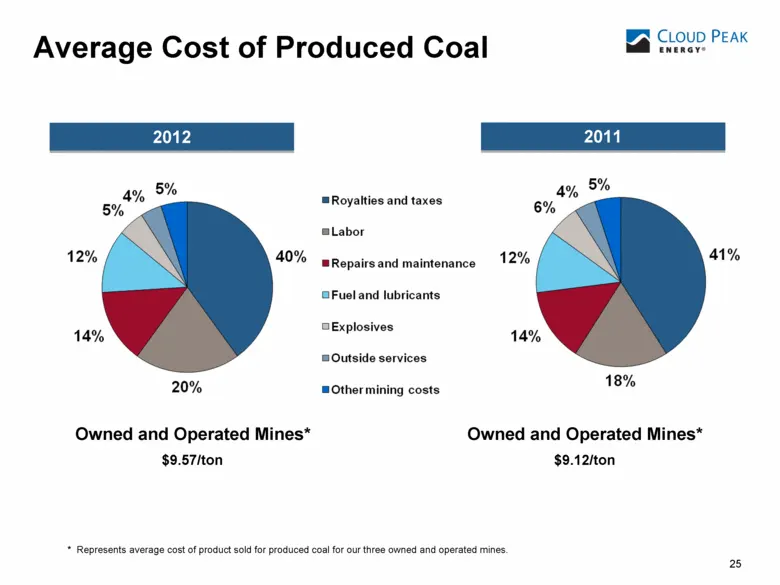
25 Average Cost of Produced Coal * Represents average cost of product sold for produced coal for our three owned and operated mines. Owned and Operated Mines* $9.57/ton Owned and Operated Mines* $9.12/ton 2011 2012
Slide 26: Operating Segments
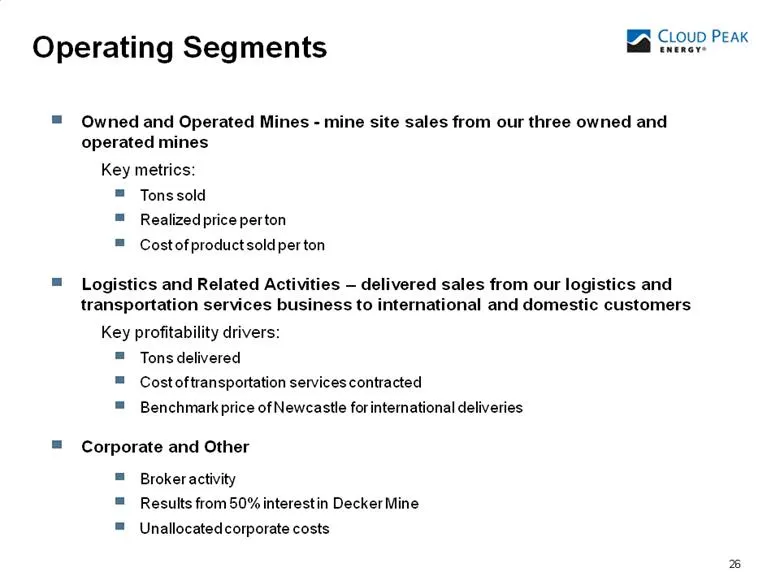
Operating Segments 26 Owned and Operated Mines - mine site sales from our three owned and operated mines Key metrics: Tons sold Realized price per ton Cost of product sold per ton Logistics and Related Activities – delivered sales from our logistics and transportation services business to internatio
Slide 27: Owned and Operated Mines
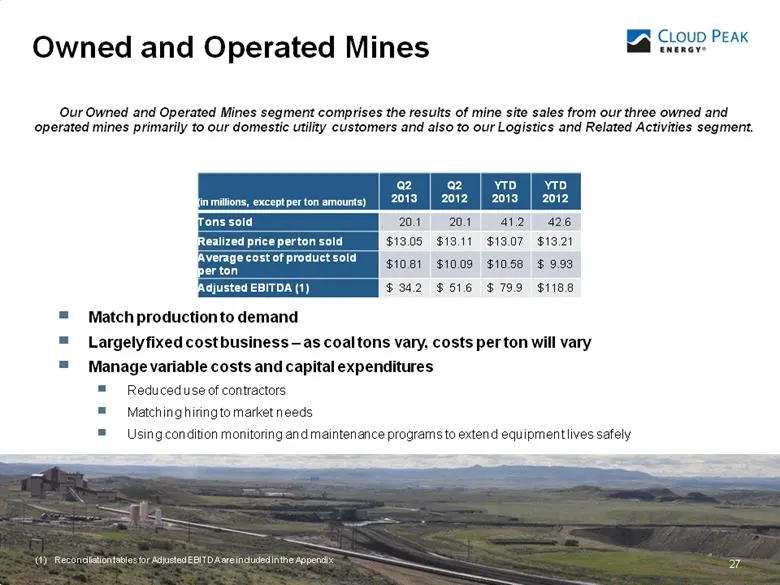
Owned and Operated Mines 27 Our Owned and Operated Mines segment comprises the results of mine site sales from our three owned and operated mines primarily to our domestic utility customers and also to our Logistics and Related Activities segment. (in millions, except per ton amounts) Q2 2013 Q2 201
Slide 28: Logistics and Related Activities
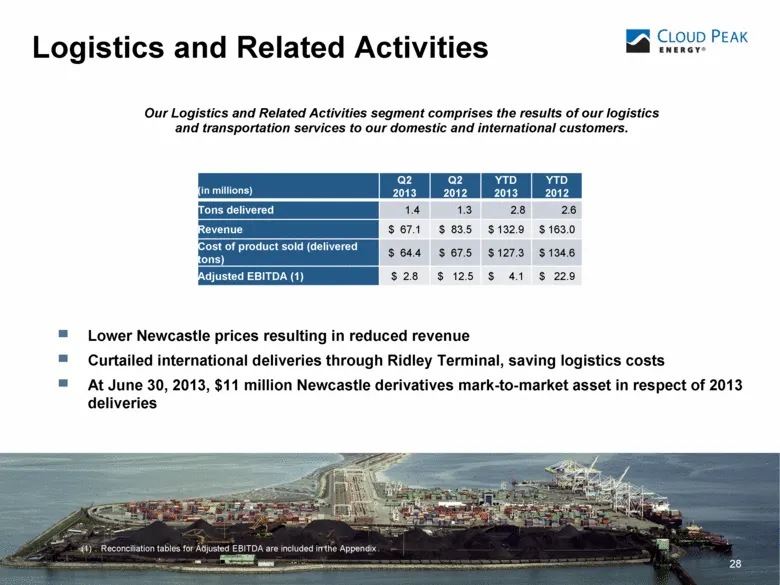
Logistics and Related Activities 28 Our Logistics and Related Activities segment comprises the results of our logistics and transportation services to our domestic and international customers. Lower Newcastle prices resulting in reduced revenue Curtailed international deliveries through Ridley Termi
Slide 29: Statement of Operations Data
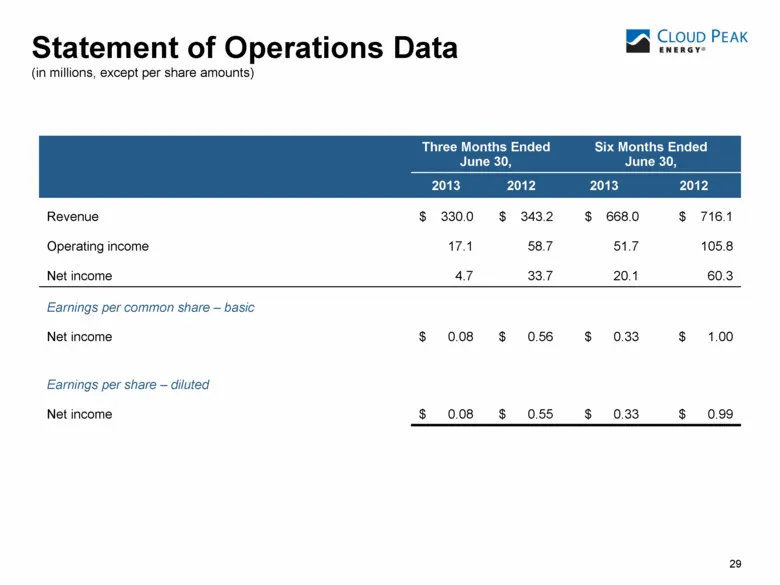
29 Statement of Operations Data (in millions, except per share amounts) Three Months Ended June 30, Six Months Ended June 30, 2013 2012 2013 2012 Revenue $ 330.0 $ 343.2 $ 668.0 $ 716.1 Operating income 17.1 58.7 51.7 105.8 Net income 4.7 33.7 20.1 60.3 Earnings per common share – basic Net income $
Slide 30: Statement of Operations Data
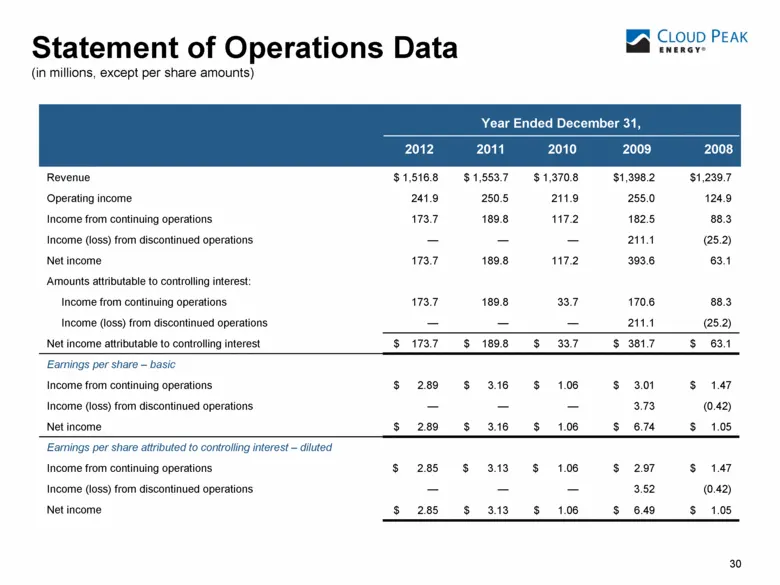
30 Statement of Operations Data (in millions, except per share amounts) Revenue $ 1,516.8 $ 1,553.7 $ 1,370.8 $1,398.2 $1,239.7 Operating income 241.9 250.5 211.9 255.0 124.9 Income from continuing operations 173.7 189.8 117.2 182.5 88.3 Income (loss) from discontinued operations — — — 211.1 (25.2)
Slide 31: Balance Sheet Data
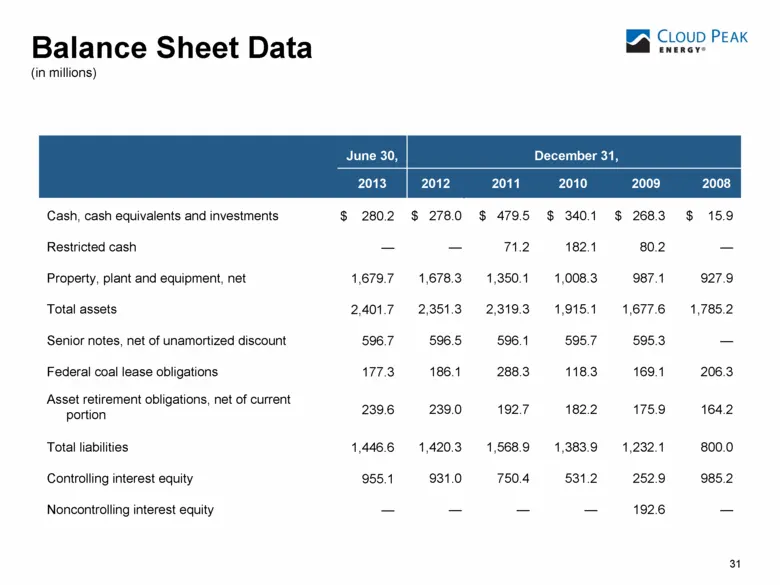
31 Balance Sheet Data (in millions) Cash, cash equivalents and investments $ 280.2 $ 278.0 $ 479.5 $ 340.1 $ 268.3 $ 15.9 Restricted cash — — 71.2 182.1 80.2 — Property, plant and equipment, net 1,679.7 1,678.3 1,350.1 1,008.3 987.1 927.9 Total assets 2,401.7 2,351.3 2,319.3 1,915.1 1,677.6 1,785.2
Slide 32: Reconciliation of Non-GAAP Measures – Adjusted EBITDA
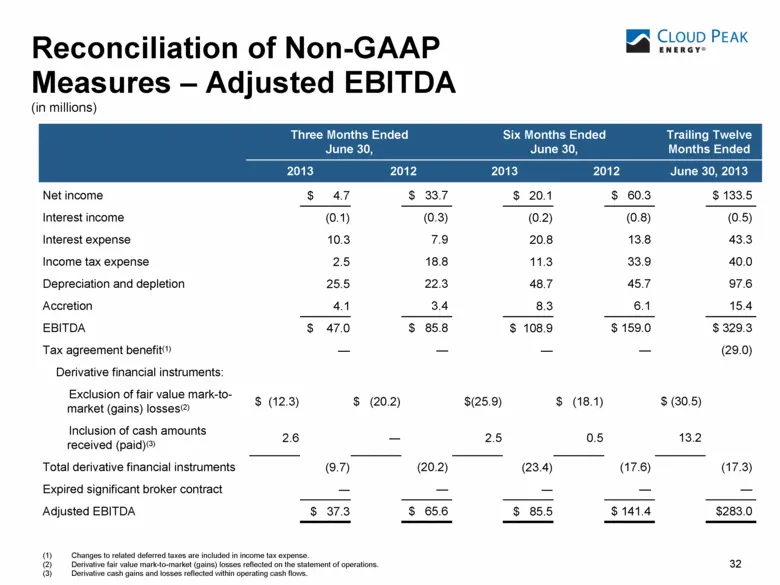
32 Reconciliation of Non-GAAP Measures – Adjusted EBITDA (in millions) (1) Changes to related deferred taxes are included in income tax expense. (2) Derivative fair value mark-to-market (gains) losses reflected on the statement of operations. (3) Derivative cash gains and losses reflected within ope
Slide 33: Reconciliation of Non-GAAP Measures – Adjusted EBITDA
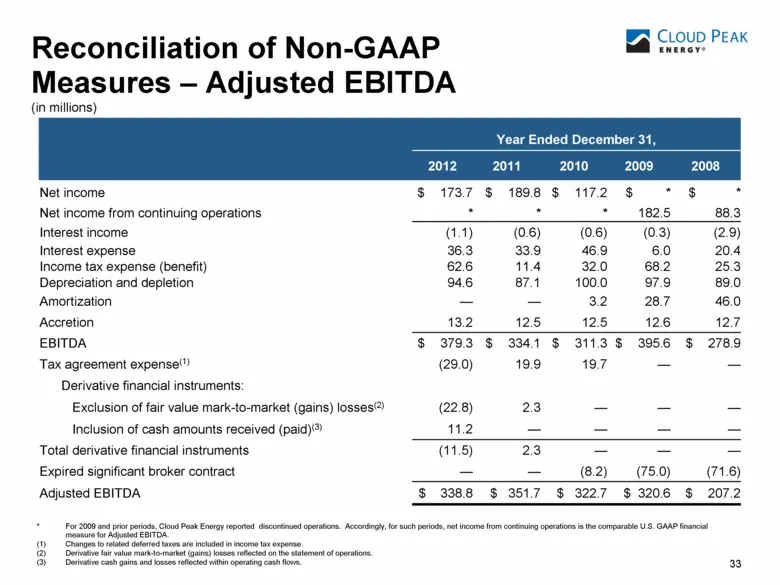
33 Reconciliation of Non-GAAP Measures – Adjusted EBITDA (in millions) Year Ended December 31, 2012 2011 2010 2009 2008 Net income $ 173.7 $ 189.8 $ 117.2 $ * $ * Net income from continuing operations * * * 182.5 88.3 Interest income (1.1) (0.6) (0.6) (0.3) (2.9) Interest expense 36.3 33.9 46.9 6.0
Slide 34: Reconciliation of Non-GAAP Measures – Adjusted EPS
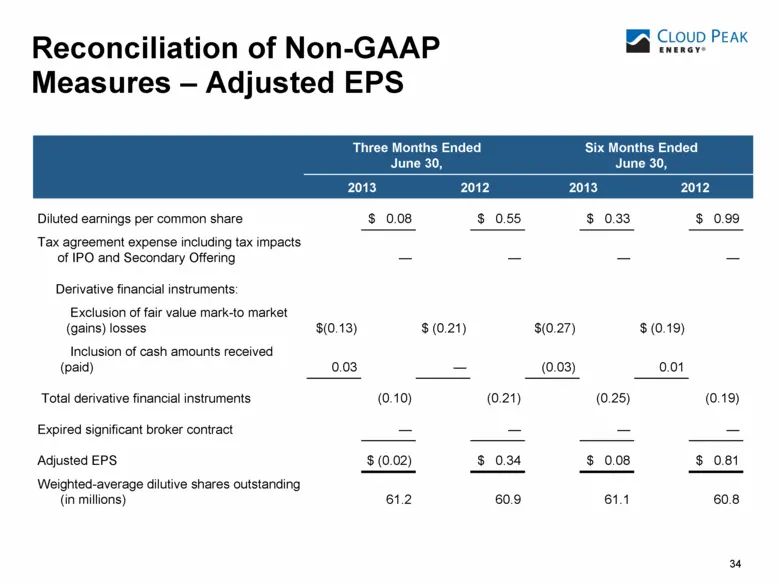
Three Months Ended June 30, Six Months Ended June 30, 2013 2012 2013 2012 34 Reconciliation of Non-GAAP Measures – Adjusted EPS Diluted earnings per common share $ 0.08 $ 0.55 $ 0.33 $ 0.99 Tax agreement expense including tax impacts of IPO and Secondary Offering — — — — Derivative financial instrum
Slide 35: Reconciliation of Non-GAAP Measures – Adjusted EPS
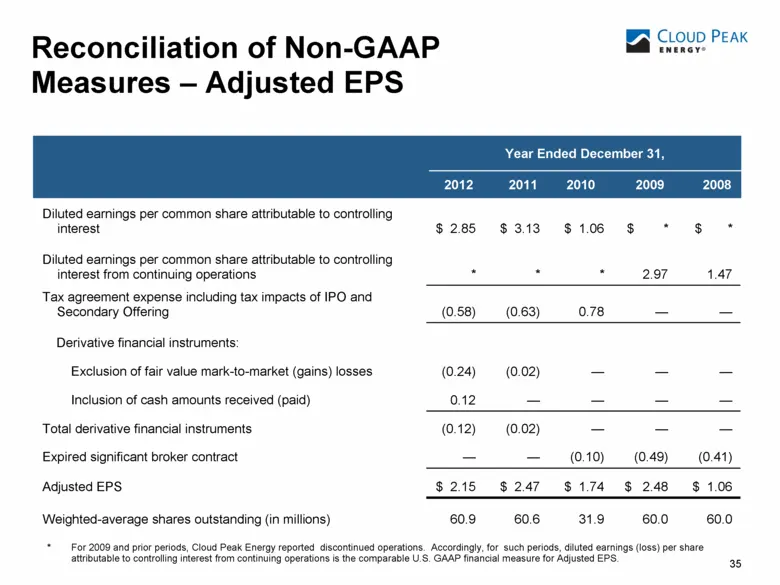
35 Diluted earnings per common share attributable to controlling interest $ 2.85 $ 3.13 $ 1.06 $ * $ * Diluted earnings per common share attributable to controlling interest from continuing operations * * * 2.97 1.47 Tax agreement expense including tax impacts of IPO and Secondary Offering (0.58) (0
Slide 36: Adjusted EBITDA by Segment
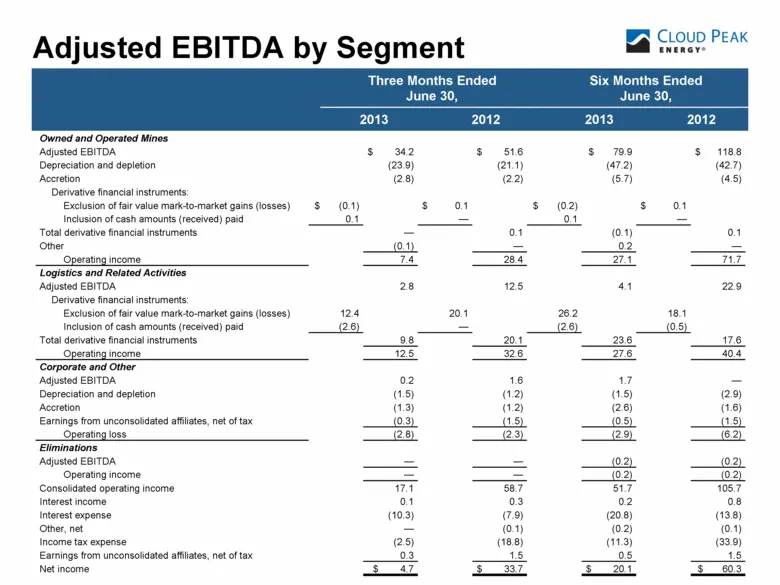
Adjusted EBITDA by Segment Three Months Ended June 30, Six Months Ended June 30, 2013 2012 2013 2012 Owned and Operated Mines Adjusted EBITDA $ 34.2 $ 51.6 $ 79.9 $ 118.8 Depreciation and depletion (23.9) (21.1) (47.2) (42.7) Accretion (2.8) (2.2) (5.7) (4.5) Derivative financial instruments: Exclus
Slide 37: Other Data
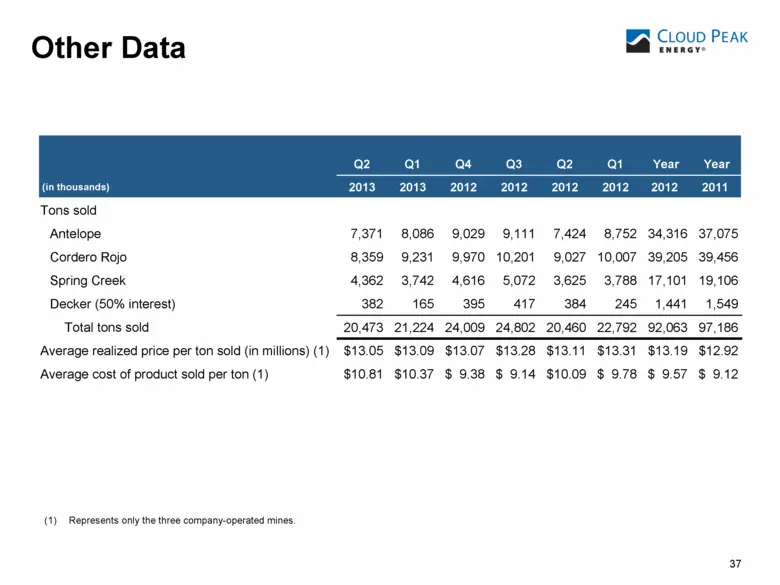
37 Other Data (1) Represents only the three company-operated mines. Q2 Q1 Q4 Q3 Q2 Q1 Year Year (in thousands) 2013 2013 2012 2012 2012 2012 2012 2011 Tons sold Antelope 7,371 8,086 9,029 9,111 7,424 8,752 34,316 37,075 Cordero Rojo 8,359 9,231 9,970 10,201 9,027 10,007 39,205 39,456 Spring Creek 4,
Slide 38: Other Data
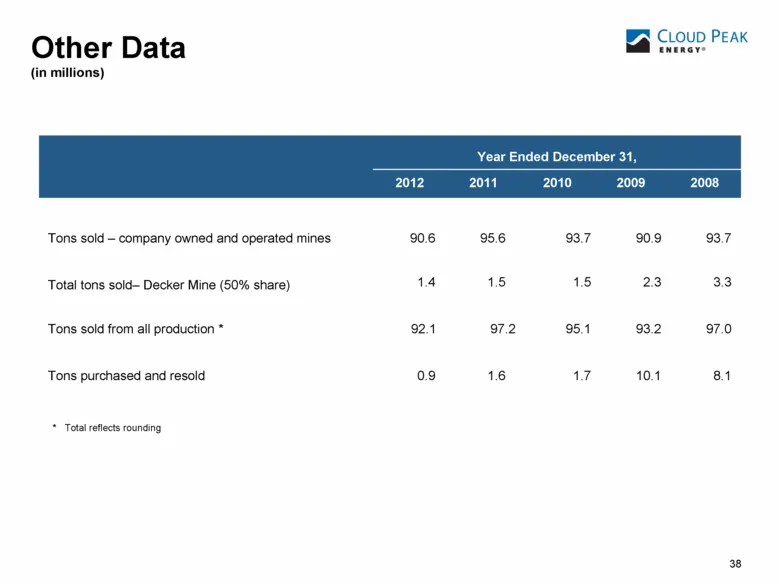
38 Other Data (in millions) Tons sold – company owned and operated mines 90.6 95.6 93.7 90.9 93.7 Total tons sold– Decker Mine (50% share) 1.4 1.5 1.5 2.3 3.3 Tons sold from all production * 92.1 97.2 95.1 93.2 97.0 Tons purchased and resold 0.9 1.6 1.7 10.1 8.1 Year Ended December 31, 2012 2011 201
Slide 39: Sulfur Content by Basin
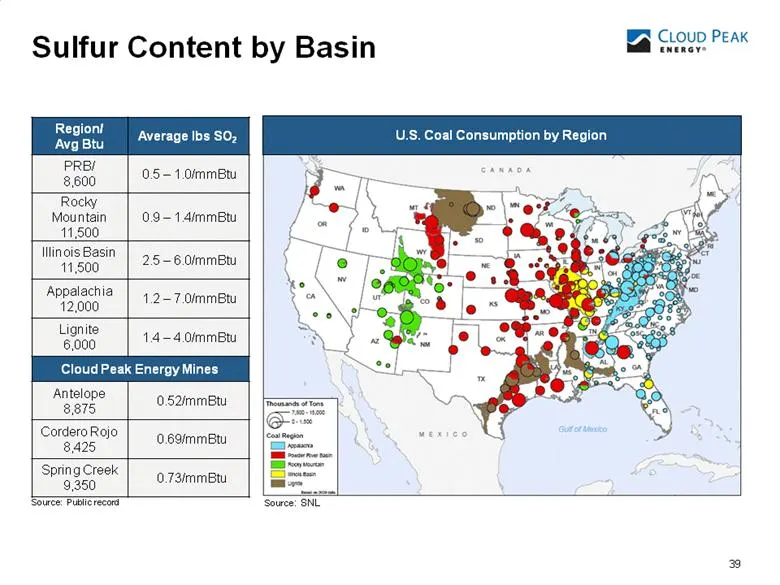
39 Sulfur Content by Basin Source: SNL U.S. Coal Consumption by Region Region/ Avg Btu Average lbs SO2 PRB/ 8,600 0.5 – 1.0/mmBtu Rocky Mountain 11,500 0.9 – 1.4/mmBtu Illinois Basin 11,500 2.5 – 6.0/mmBtu Appalachia 12,000 1.2 – 7.0/mmBtu Lignite 6,000 1.4 – 4.0/mmBtu Cloud Peak Energy Mines Antelo
Slide 40: Lease By Application
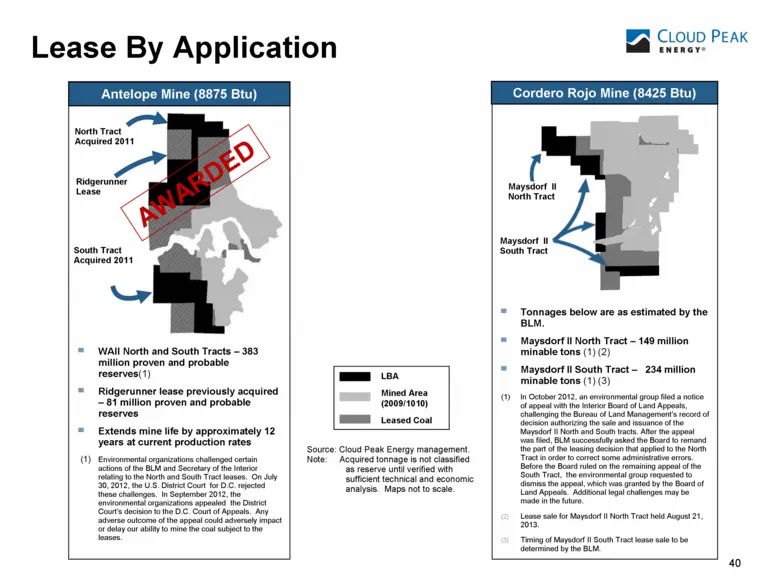
40 Lease By Application Source: Cloud Peak Energy management. Note: Acquired tonnage is not classified as reserve until verified with sufficient technical and economic analysis. Maps not to scale. Cordero Rojo Mine (8425 Btu) Maysdorf II North Tract Tonnages below are as estimated by the BLM. Maysdo
Source: SEC EDGAR · 8-K filed Sep 11, 2013
More decks from Cloud Peak Energy Inc
 Investor Presentation (May 2019)56 slides · May 10, 2019
 Q3 2018 Earnings Presentation41 slides · Oct 30, 2018
 Shareholder Meeting (May 2018)21 slides · May 9, 2018
 FY2017 Earnings Presentation41 slides · Feb 23, 2018
 Investor Presentation (November 2017)39 slides · Nov 7, 2017
 Investor Presentation (August 2017)40 slides · Aug 7, 2017