SunTrust Banks — Credit Suisse Financial Services Forum 2017
20 slides from SunTrust Banks's conference presentation, Feb 7, 2017
Slide 1: Credit Suisse Financial Services Forum
CREDIT SUISSE FINANCIAL SERVICES FORUM Aleem Gillani, Chief Financial Officer, SunTrust Banks, Inc. February 7, 2017 © 2017 SunTrust Banks, Inc. SunTrust is a federally registered trademark of SunTrust Banks, Inc.
Slide 2: The following should be read in conjunction with the financial statements, notes and other
2 The following should be read in conjunction with the financial statements, notes and other information contained in the Company’s forthcoming 2016 Annual Report on Form 10-K, Quarterly Reports on Form 10-Q, and Current Reports on Form 8-K. This presentation includes non-GAAP financial measures to
Slide 3: SunTrust Overview
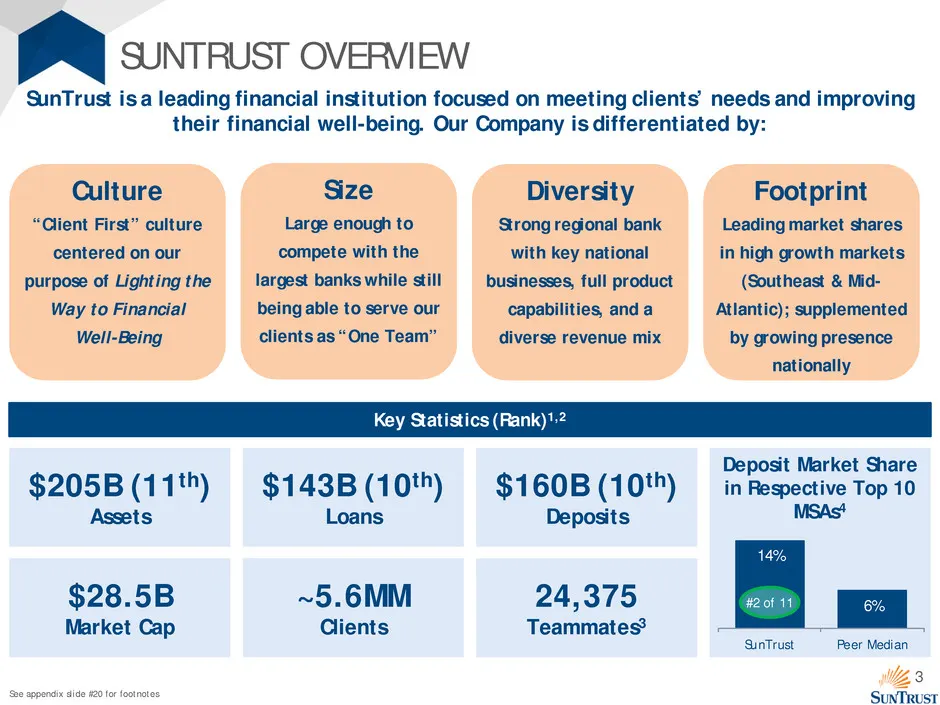
3 Deposit Market Share in Respective Top 10 MSAs4 14% 6% SunTrust Peer Median SUNTRUST OVERVIEW SunTrust is a leading financial institution focused on meeting clients’ needs and improving their financial well-being. Our Company is differentiated by: Size Large enough to compete with the largest bank
Slide 4: Geographic Presence
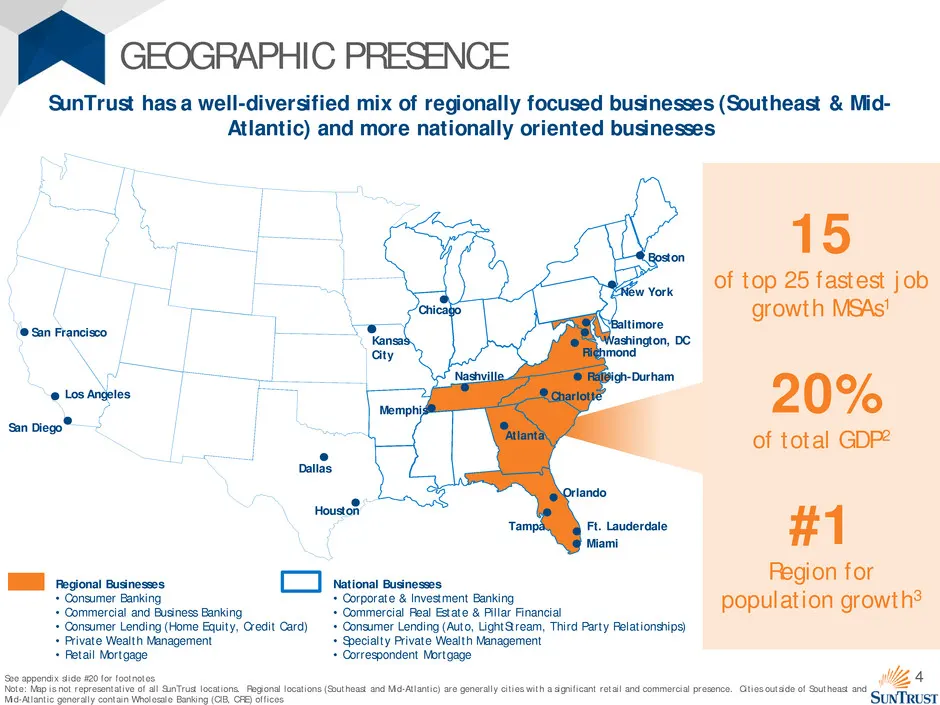
4 GEOGRAPHIC PRESENCE Regional Businesses • Consumer Banking • Commercial and Business Banking • Consumer Lending (Home Equity, Credit Card) • Private Wealth Management • Retail Mortgage National Businesses • Corporate & Investment Banking • Commercial Real Estate & Pillar Financial • Consumer Lendi
Slide 5: Investment Thesis
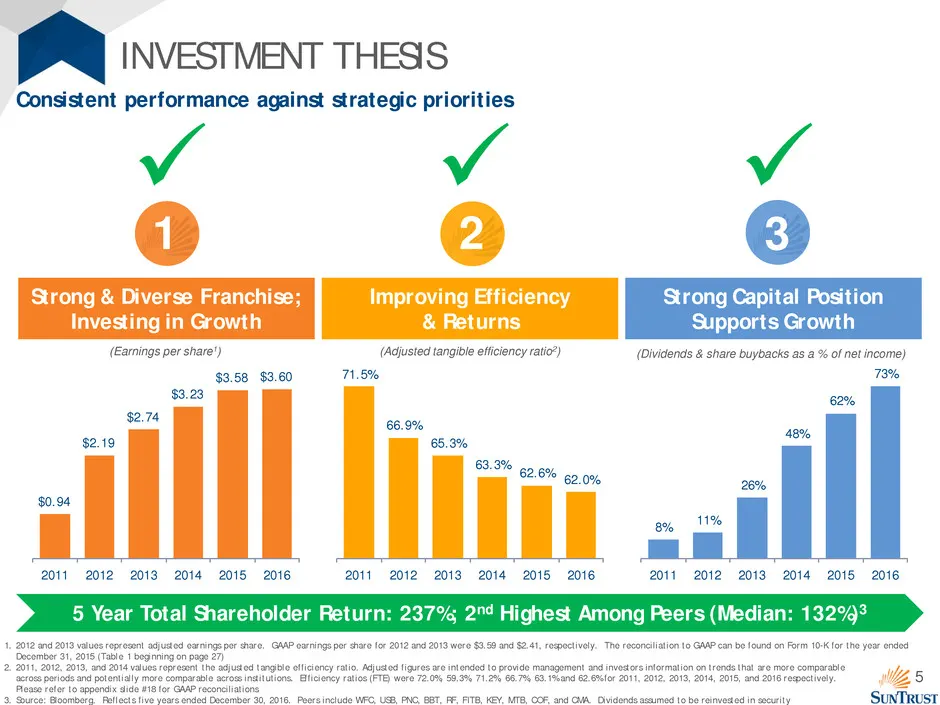
5 8% 11% 26% 48% 62% 73% 2011 2012 2013 2014 2015 2016 INVESTMENT THESIS Consistent performance against strategic priorities Strong & Diverse Franchise; Investing in Growth Improving Efficiency & Returns Strong Capital Position Supports Growth (Dividends & share buybacks as a % of net income)
Slide 6: Strong & Diverse Franchise: Investing in Growth
STRONG & DIVERSE FRANCHISE Investing in Growth 1
Slide 7: Making Investments in Growth
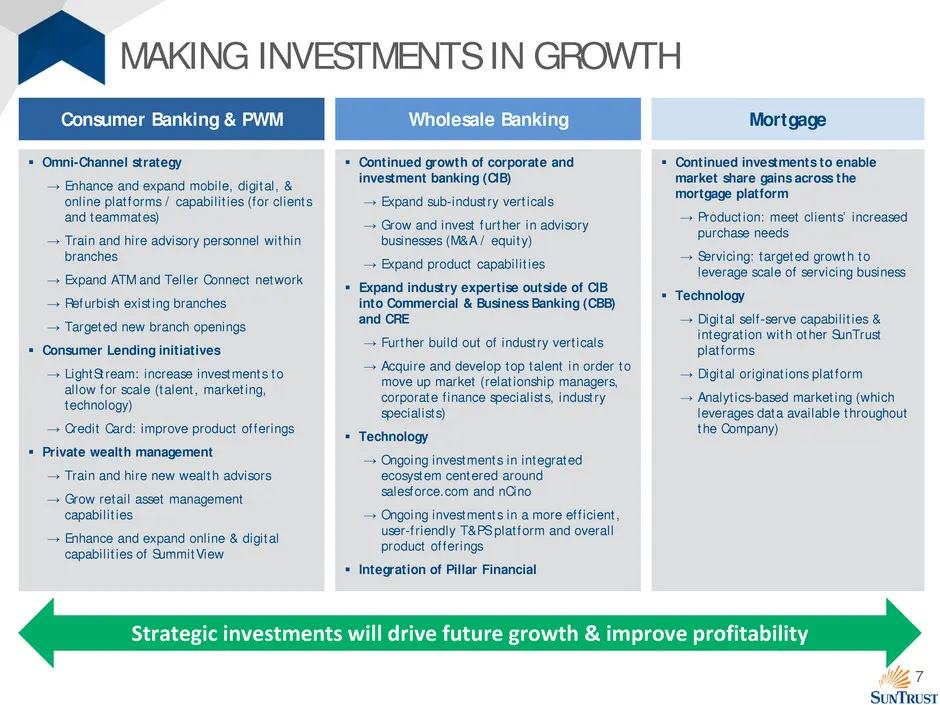
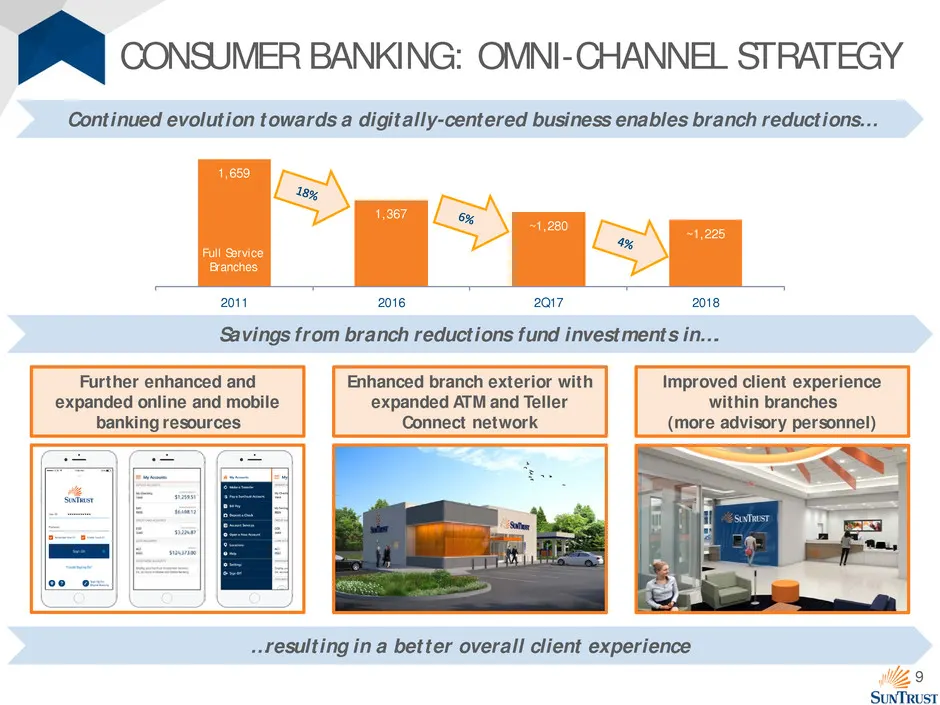
7 MAKING INVESTMENTS IN GROWTH Consumer Banking & PWM Omni-Channel strategy → Enhance and expand mobile, digital, & online platforms / capabilities (for clients and teammates) → Train and hire advisory personnel within branches → Expand ATM and Teller Connect network → Refurbish existing branches
Slide 8: Wholesale Banking
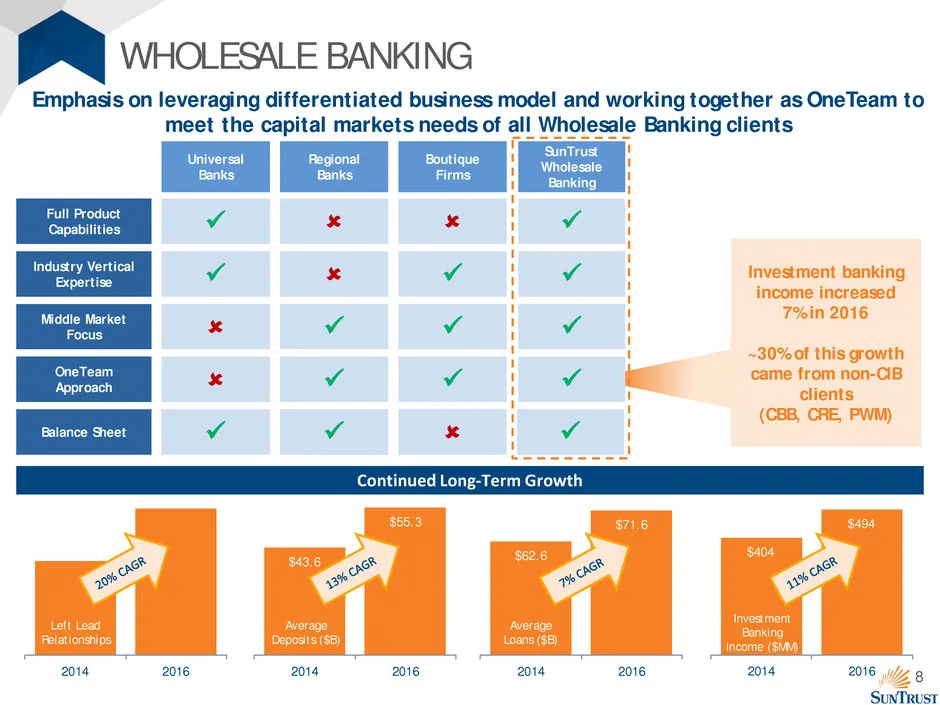
8 $404 $494 2014 20162014 2016 $62.6 $71.6 2014 2016 $43.6 $55.3 2014 2016 WHOLESALE BANKING Full Product Capabilities Industry Vertical Expertise Middle Market Focus OneTeam Approach Balance Sheet Universal Banks Regional Banks Boutique Firms SunTrust Wholesa
Slide 9: Consumer Banking: Omni-Channel Strategy
9 1,659 1,367 ~1,280 ~1,225 2011 2016 2Q17 2018 Savings from branch reductions fund investments in…. …resulting in a better overall client experience Enhanced branch exterior with expanded ATM and Teller Connect network Improved client experience within branches (more advisory personnel) Further enh
Slide 10: Spotlight on LightStream
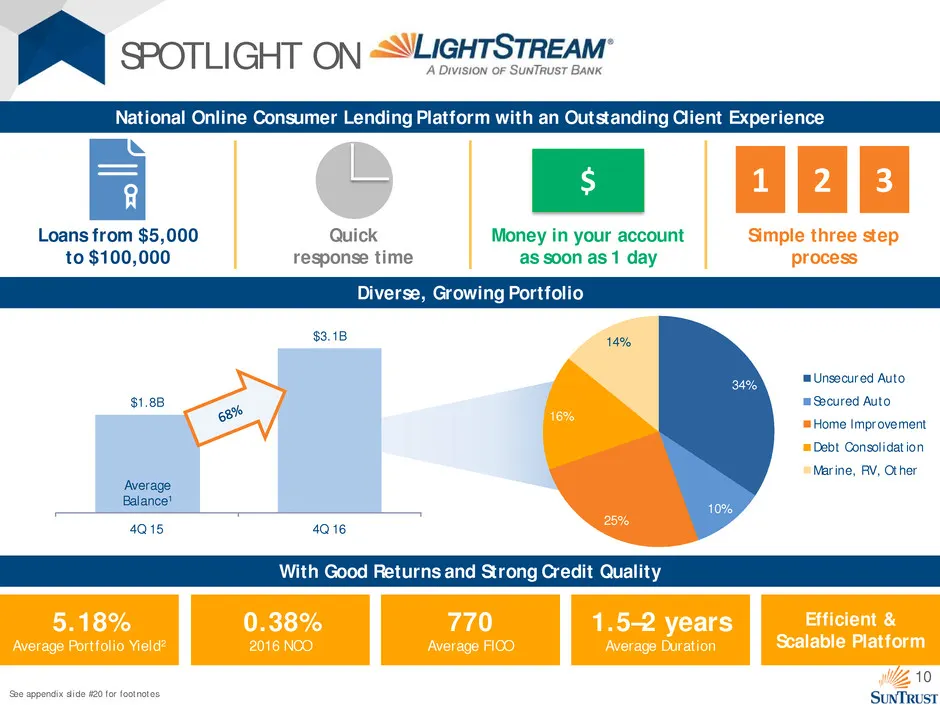
10 $1.8B $3.1B 4Q 15 4Q 16 SPOTLIGHT ON With Good Returns and Strong Credit Quality 5.18% Average Portfolio Yield2 0.38% 2016 NCO 770 Average FICO 1.5–2 years Average Duration Loans from $5,000 to $100,000 Quick response time $ Money in your account as soon as 1 day 1 2 3 Simple three step process N
Slide 11: Improving Efficiency & Returns
IMPROVING EFFICIENCY & RETURNS 2
Slide 12: Adjusted Tangible Efficiency Ratio: The Path to <60%
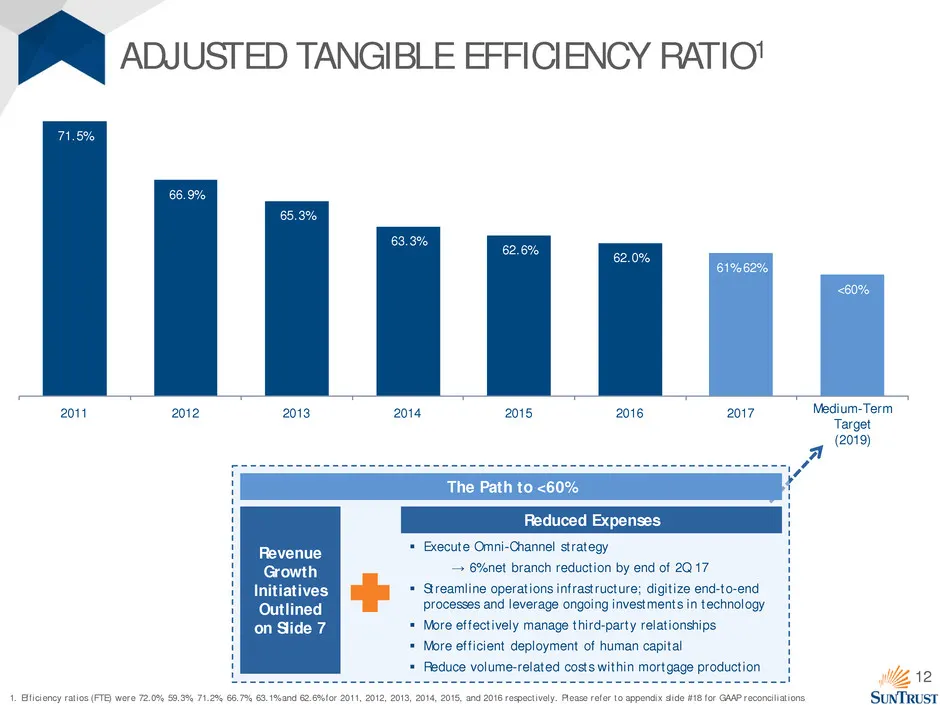
12 ADJUSTED TANGIBLE EFFICIENCY RATIO1 Revenue Growth Initiatives Outlined on Slide 7 Execute Omni-Channel strategy → 6% net branch reduction by end of 2Q 17 Streamline operations infrastructure; digitize end-to-end processes and leverage ongoing investments in technology More effectively mana
Slide 13: Optimizing the Balance Sheet to Enhance Returns
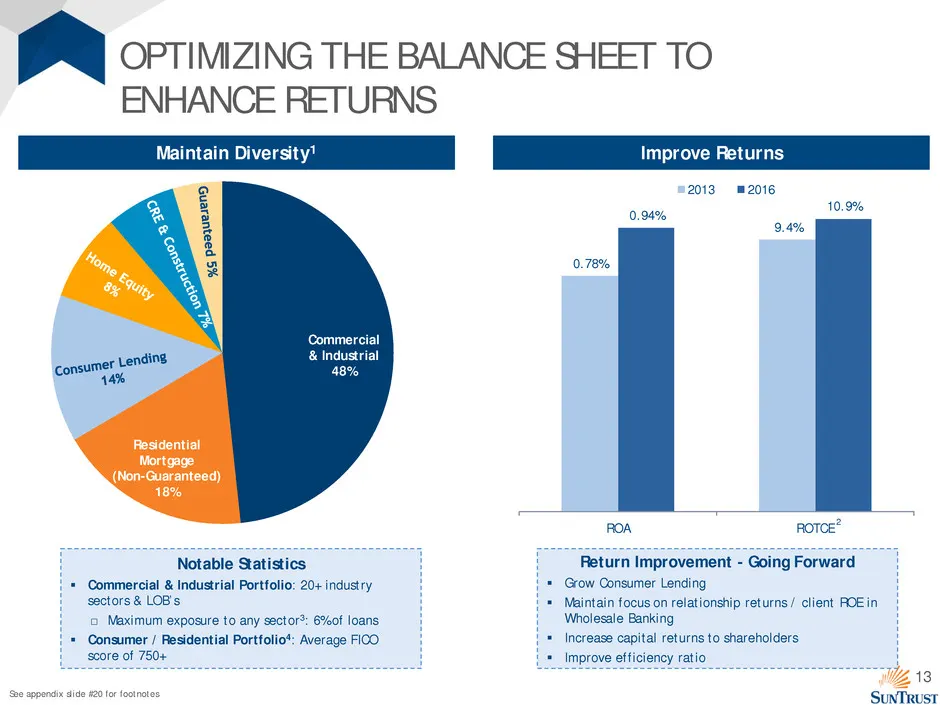
13 OPTIMIZING THE BALANCE SHEET TO ENHANCE RETURNS Notable Statistics Commercial & Industrial Portfolio: 20+ industry sectors & LOB’s □ Maximum exposure to any sector3: 6% of loans Consumer / Residential Portfolio4: Average FICO score of 750+ Return Improvement - Going Forward Grow Consumer Le
Slide 14: Strong Capital Position Supports Growth
3 STRONG CAPITAL POSITION SUPPORTS GROWTH
Slide 15: Strong Capital Position Supports Growth
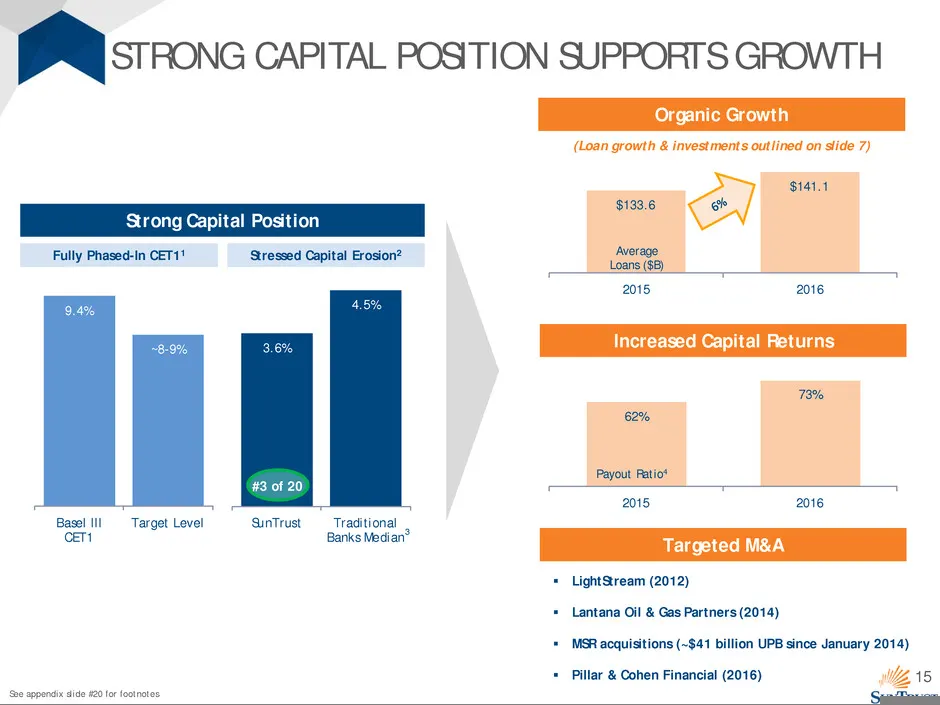
15 3.6% 4.5% SunTrust Traditional Banks Median STRONG CAPITAL POSITION SUPPORTS GROWTH Strong Capital Position 9.4% ~8-9% Basel III CET1 Target Level 62% 73% 2015 2016 Increased Capital Returns Targeted M&A LightStream (2012) Lantana Oil & Gas Partners (2014) MSR acquisitions (~$41 billion UPB
Slide 16: Recap: Why Invest in SunTrust?
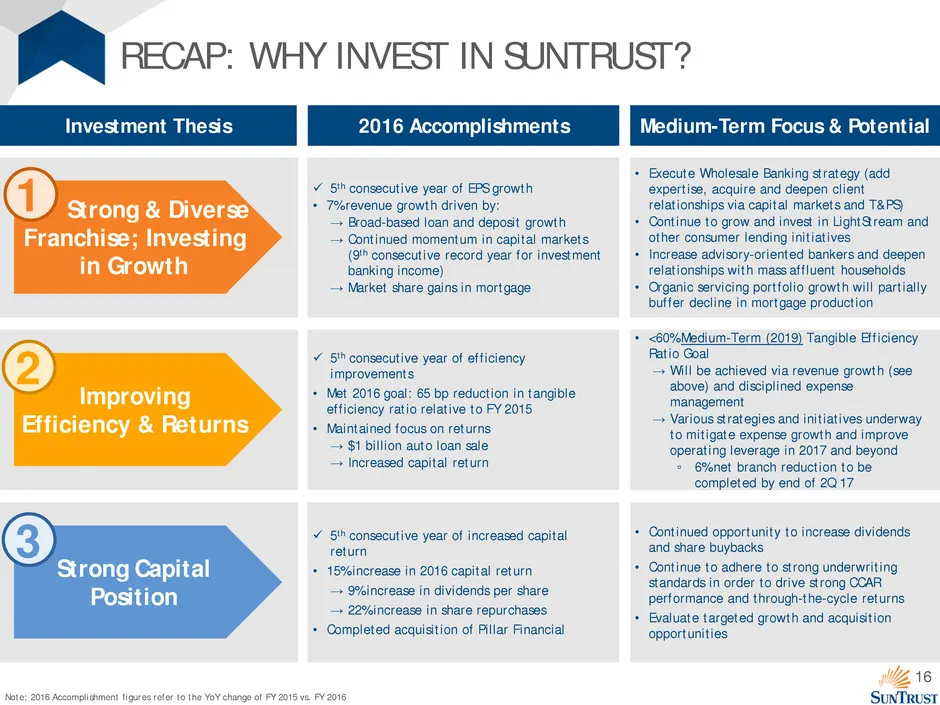
16 Note: 2016 Accomplishment figures refer to the YoY change of FY 2015 vs. FY 2016 RECAP: WHY INVEST IN SUNTRUST? • <60% Medium-Term (2019) Tangible Efficiency Ratio Goal → Will be achieved via revenue growth (see above) and disciplined expense management → Various strategies and initiatives underw
Slide 17: Appendix
APPENDIX SuNTRUST
Slide 18: Efficiency Ratio Reconciliation
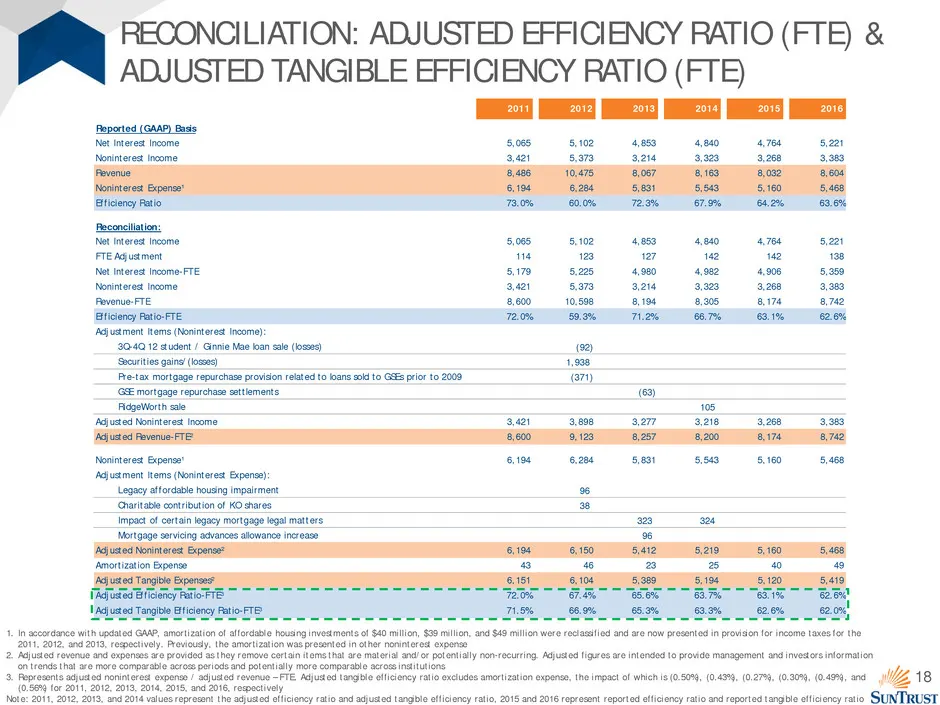
18 2011 2012 2013 2014 2015 2016 Reported (GAAP) Basis Net Interest Income 5,065 5,102 4,853 4,840 4,764 5,221 Noninterest Income 3,421 5,373 3,214 3,323 3,268 3,383 Revenue 8,486 10,475 8,067 8,163 8,032 8,604 Noninterest Expense¹ 6,194 6,284 5,831 5,543 5,160 5,468 Efficiency Ratio 73.0% 60.0% 72.
Slide 19: Reconciliation: Common Equity Tier 1 Ratio
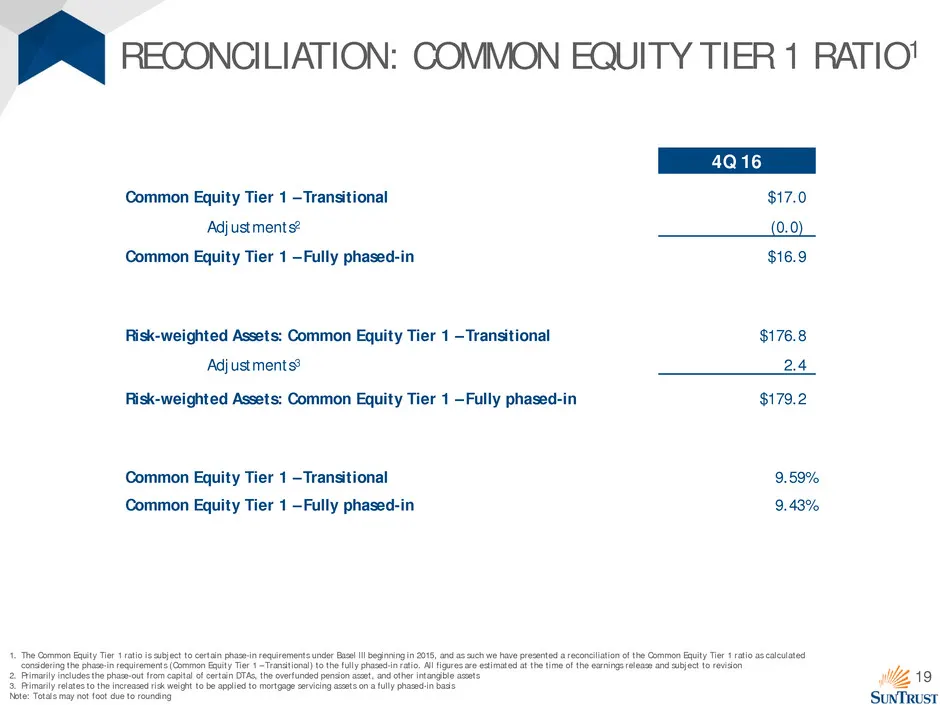
19 RECONCILIATION: COMMON EQUITY TIER 1 RATIO1 1. The Common Equity Tier 1 ratio is subject to certain phase-in requirements under Basel III beginning in 2015, and as such we have presented a reconciliation of the Common Equity Tier 1 ratio as calculated considering the phase-in requirements (Common
Slide 20: Footnotes
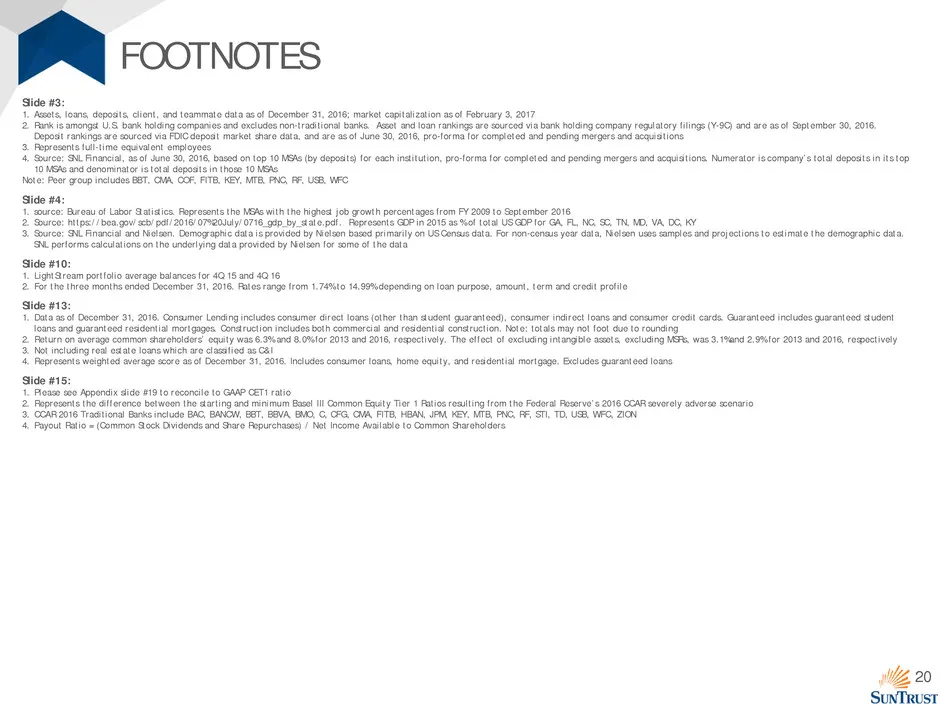
20 FOOTNOTES Slide #3: 1. Assets, loans, deposits, client, and teammate data as of December 31, 2016; market capitalization as of February 3, 2017 2. Rank is amongst U.S. bank holding companies and excludes non-traditional banks. Asset and loan rankings are sourced via bank holding company regulator
Source: SEC EDGAR · 8-K filed Feb 7, 2017
More decks from SunTrust Banks Inc
 Q3 2019 Earnings Presentation21 slides · Oct 17, 2019
 Q2 2019 Earnings Presentation22 slides · Jul 18, 2019
 Q1 2019 Earnings Presentation22 slides · Apr 18, 2019
 Merger or Acquisition (February 2019)38 slides · Feb 7, 2019
 Q4 2018 Earnings Presentation23 slides · Jan 18, 2019
 2018 Goldman Sachs US Financial Services Conference30 slides · Dec 4, 2018