Copano Energy L.L.C — 2011 Citigroup One-on-One MLP/Midstream Infrastructure Conference
43 slides from Copano Energy L.L.C's conference presentation, Aug 24, 2011
Slide 1: 2011 Citigroup One-on-One MLP/Midstream Infrastructure Conference
2011 Citigroup One-on-One MLP/Midstream Infrastructure Conference August 24 - 25, 2011 NASDAQ: CPNO
Slide 2: Disclaimer
Disclaimer This presentation includes “forward-looking statements,” as defined in the federal securities laws. Statements that address activities or events that Copano believes will or may occur in the future are forward-looking statements. These statements include, but are not limited to, statement
Slide 3: Introduction to Copano
Introduction to Copano Independent midstream company founded in 1992 ■ Producer focused ■ Entrepreneurial approach ■ Focus on long-term accretive growth ■ Publicly traded LLC ● No general partner or incentive distribution rights ● Tax benefits similar to MLPs, but with corporate governance of a C-co
Slide 4: Operating Segments
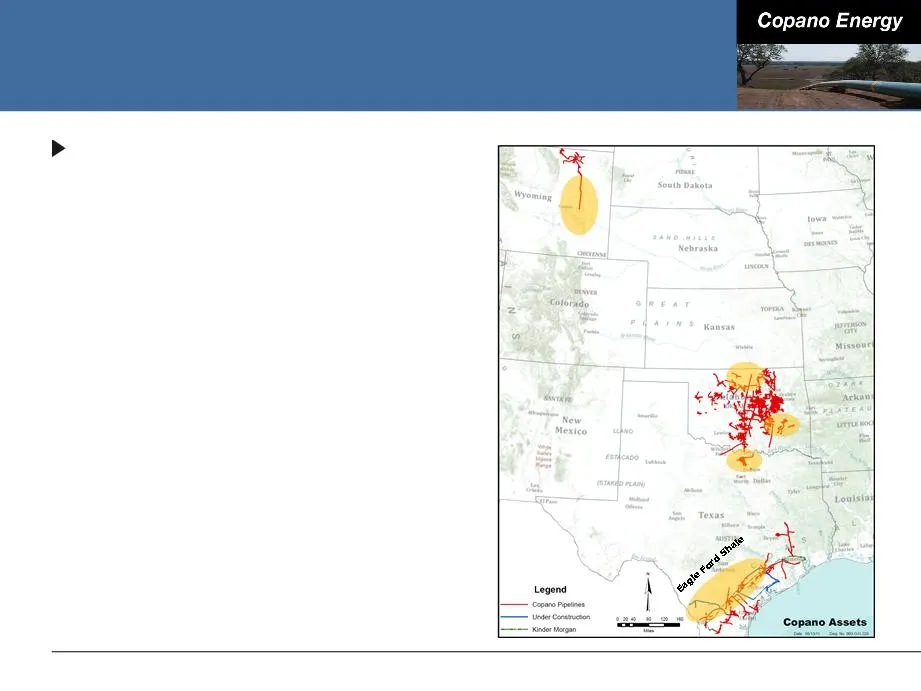
Operating Segments Operating segments ■ Texas ■ Oklahoma ■ Rocky Mountains ■ Copano currently has assets in five active U.S. resource plays ● Eagle Ford Shale ● North Barnett Shale Combo ● Woodford Shale ● Mississippi Lime ● Powder River Basin Niobrara Powder River Basin Niobrara Woodford Shale Miss
Slide 5: Executing On Our Business Strategy
Executing On Our Business Strategy Eagle Ford Shale, North Barnett Shale Combo, Woodford Shale and Mississippi Lime Acquisition of the Harrah and Davenport plants Organic Growth and Bolt-on Acquisitions Maintaining Strong Balance Sheet Reduce Sensitivity to Commodity Prices Flexibility in Operations
Slide 6: Agenda
Agenda Eagle Ford Shale Growth Projects Business Segment Outlook Financing and Commodity Price Sensitivity Conclusions
Slide 7: DK Pipeline and Extension
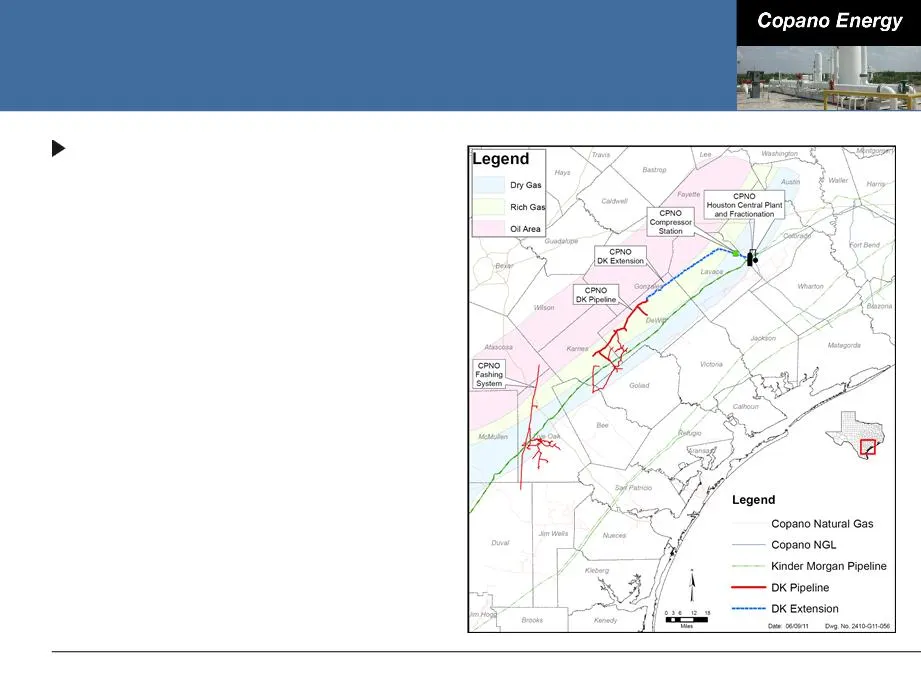
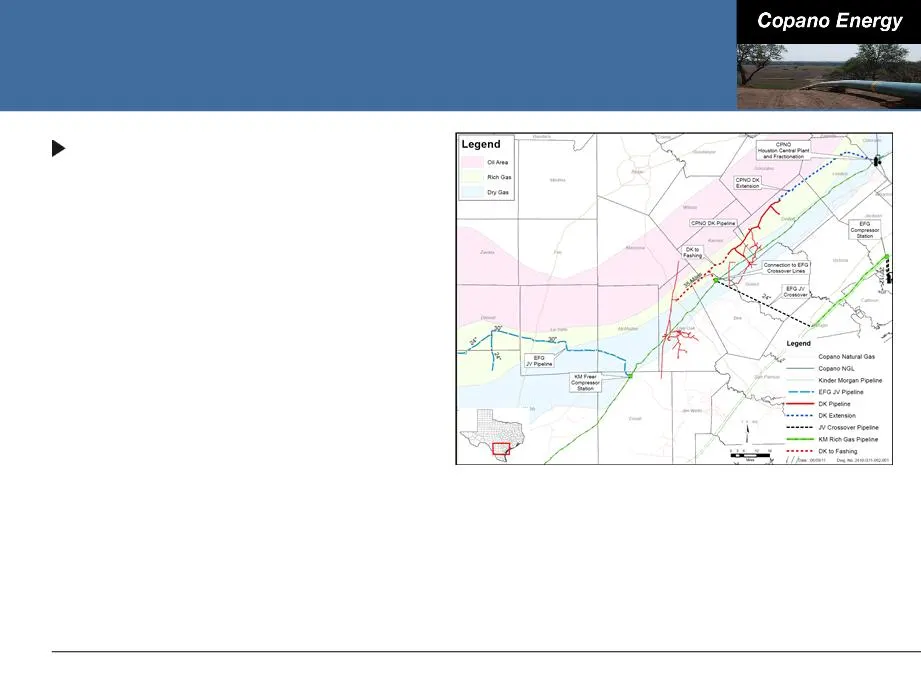
DK Pipeline and Extension DK extension ■ Key producer contracts with Abraxas, GeoSouthern, Petrohawk, Pioneer, Riley and others ■ Announced February 2011 ● 58 miles of 24” pipe ● Construction approximately 25% complete ■ Loops Kinder Morgan’s Index 50 pipeline, effectively boosting pipeline capacity
Slide 8: Southern Eagle Ford Shale
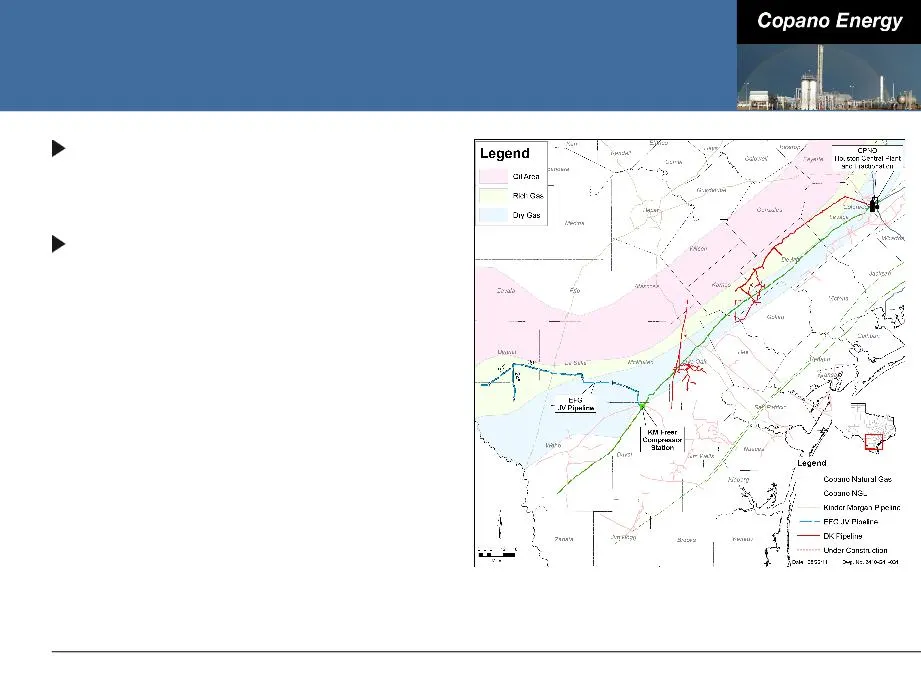
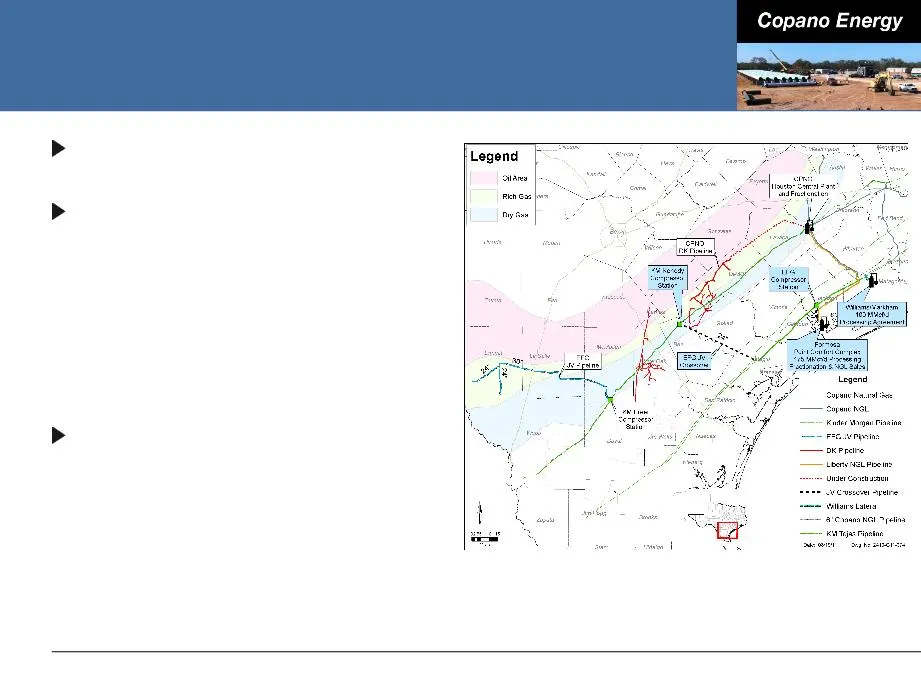
Southern Eagle Ford Shale Eagle Ford Gathering (EFG) ■ 50/50 JV with Kinder Morgan EFG Mainline ■ 117 miles of 30” and 24” pipe - nearing completion ■ 30” pipeline now accepting interruptible gas with full service expected early October ■ Nominal capacity of 600,000 MMBtu/d - expandable with compres
Slide 9: EFG Crossover
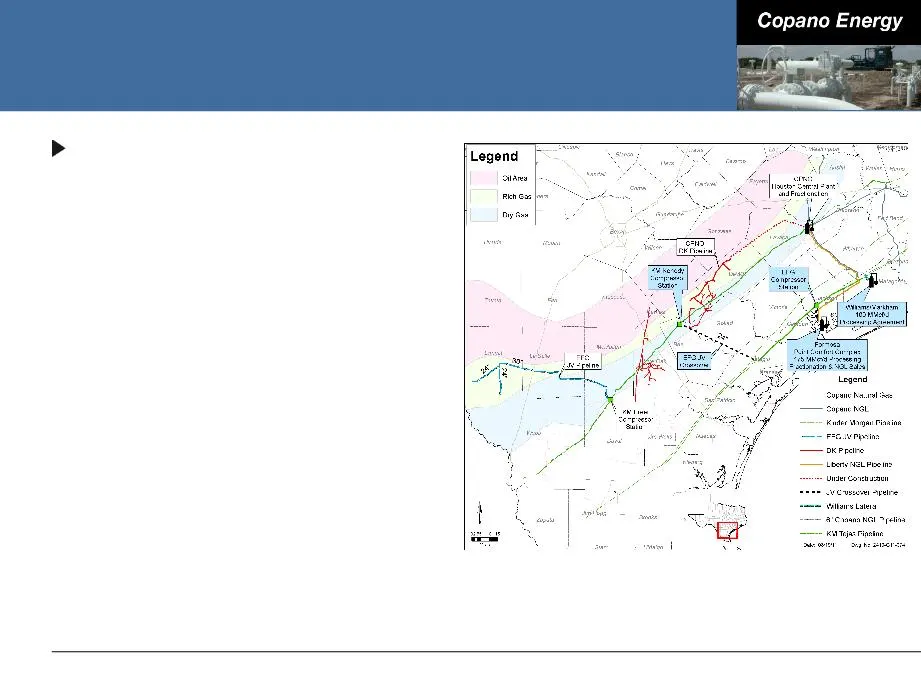
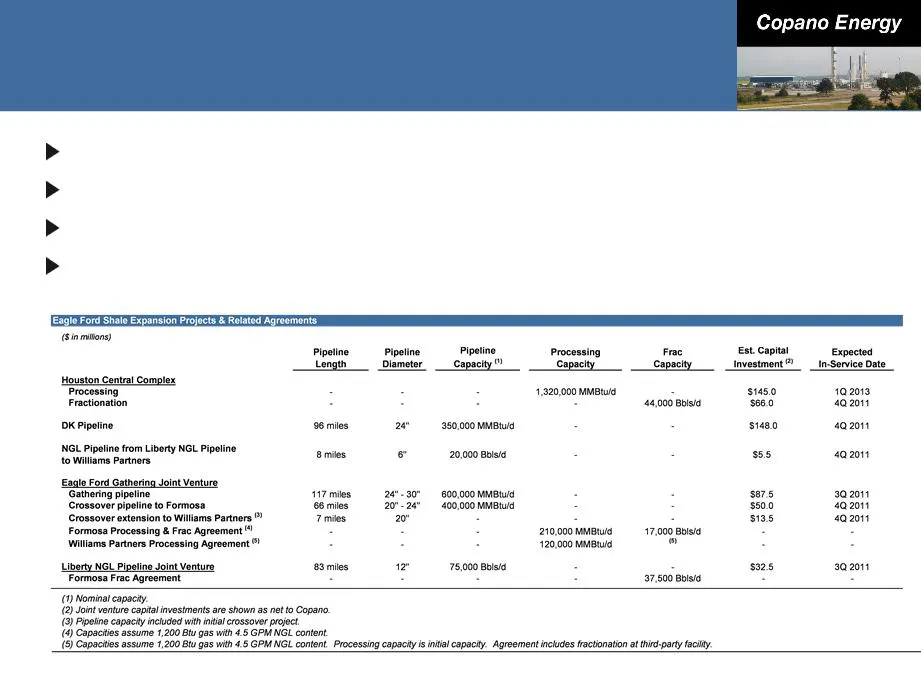
EFG Crossover Allows for full utilization of EFG Mainline pipeline 66 miles of 24” and 20” pipe connecting Kinder Morgan’s Index 50 and Tejas 30” pipelines to Formosa ■ Approximately 50% of 24” line constructed ■ Estimated capital investment of $50 million 7 miles of 20” pipe connecting Kinder Morga
Slide 10: EFG Crossover (cont’d)
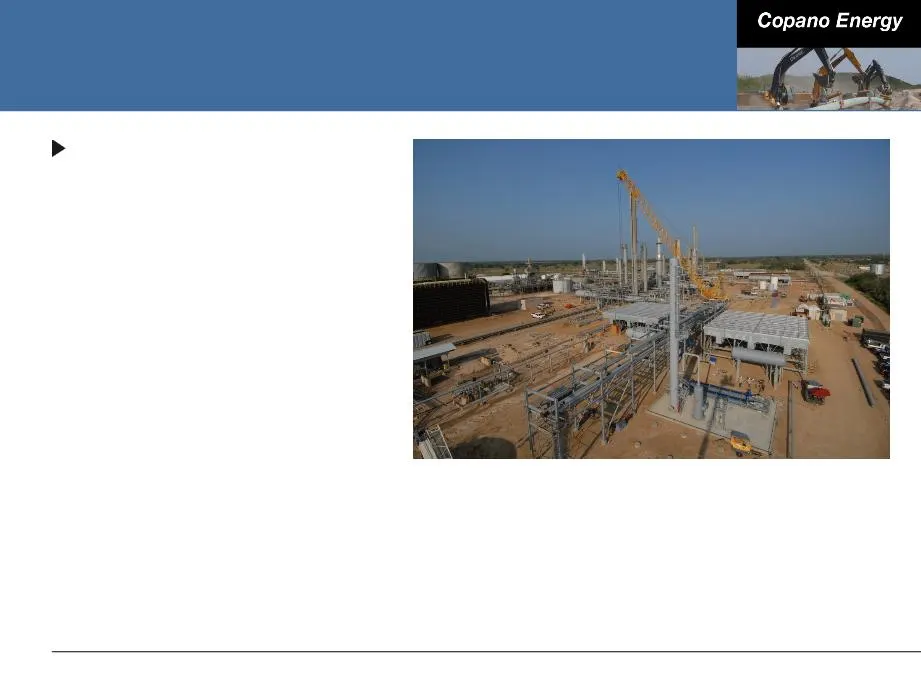
EFG Crossover (cont’d) Long-term contracts with Formosa and Williams Partners ■ Formosa - 175 MMcf/d of processing, fractionation and product sales ■ Williams Partners’ Markham - 100 MMcf/d processing and associated with fractionation, with an option to increase to 200 MMcf/d ● Copano to construct w
Slide 11: Houston Central Complex
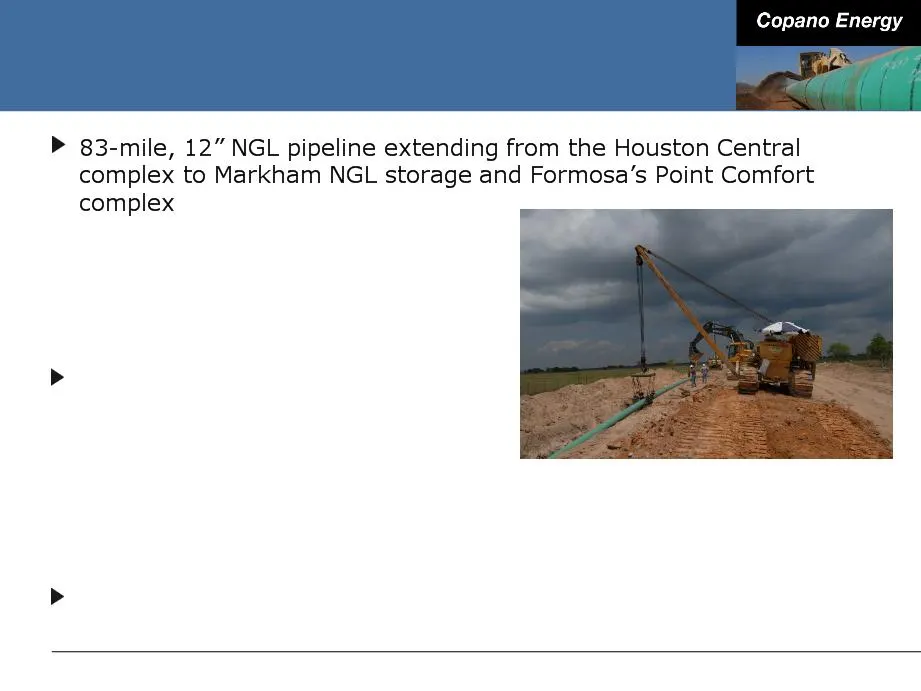
Houston Central Complex Fractionation expansion ■ Fractionation expansion from 22,000 Bbls/d to 44,000 Bbls/d ● All ethane and propane expected to move to Dow through Copano purity pipelines ■ Estimated capital investment of $66 million ● Includes fractionation facilities and related plant upgrades
Slide 12: Liberty NGL Pipeline
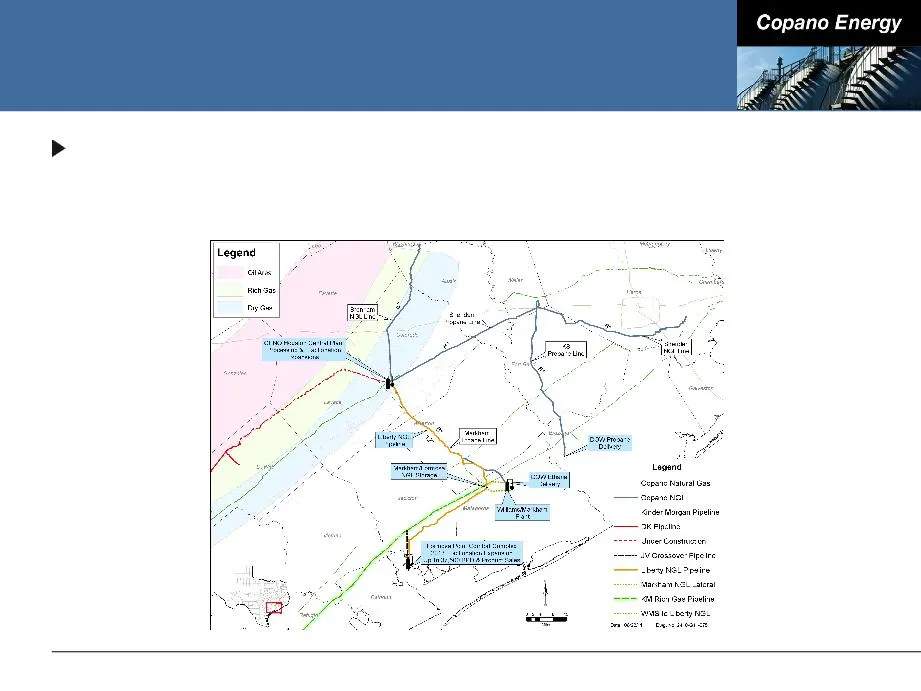
Liberty NGL Pipeline ■ Total capacity of 75,000 Bbls/d ■ Constructed through 50/50 JV with Energy Transfer ■ Houston Central to Clemville Storage was placed in-service in early August Long-term fractionation and product sales agreement with Formosa on favorable terms ■ Initial access to 7,000 Bbls/d
Slide 13: Houston Central NGL Infrastructure
Houston Central NGL Infrastructure Access to Dow and Formosa ■ Among the largest petrochemical users of NGLs in the U.S. ■ Long-term contracts with both Dow and Formosa
Slide 14: Summary of Eagle Ford Shale Infrastructure
Summary of Eagle Ford Shale Infrastructure Total capital investment of over $500 million In excess of 1 Bcf/d of pipeline and processing capacity Greater than 100,000 Bbls/d of fractionation capacity Access to multiple markets for residue gas and NGLs
Slide 15: Growth Opportunities - Eagle Ford Shale
Growth Opportunities - Eagle Ford Shale Potential extension of DK pipeline to Fashing / Live Oak system ■ Continues loop of Kinder Morgan’s Index 50 pipeline through the Eagle Ford Shale condensate window ● 34 miles of 24” pipe ● Allows for gathering of approximately 50,000 MMBtu/d from additional E
Slide 16: Growth Opportunities - Eagle Ford Shale
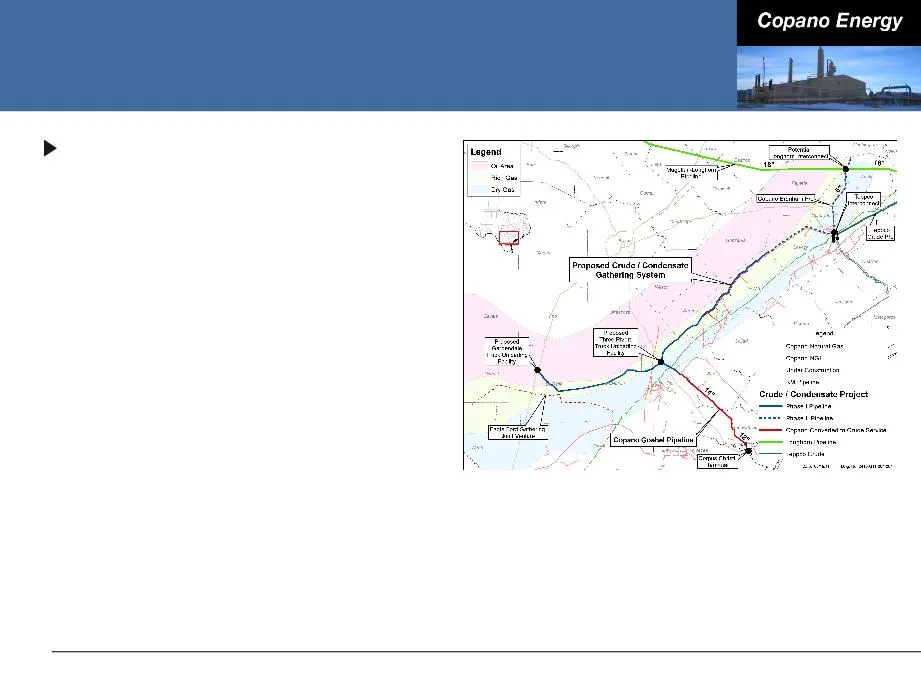
Growth Opportunities - Eagle Ford Shale Crude oil / condensate initiative ■ 100,000 Bbls/d capacity pipeline ■ Fee-based revenue ■ Working to complete definitive JV agreements and secure anchor shipper by 3Q 2011 ■ Convert existing 14” Copano Goebel line to crude service ■ Tie into markets, storage
Slide 17: Business Segment Outlook
Business Segment Outlook Eagle Ford Shale Growth Projects Business Segment Outlook Financing and Commodity Price Sensitivity Conclusions
Slide 18: Texas Recent Developments
Texas Recent Developments Saint Jo system - North Barnett Shale Combo ■ Gathering, treating and processing ■ Plant fully committed under long-term, fee-based contracts ■ System volumes have been averaging 110,000 MMBtu/d Eagle Ford Shale ■ Copano’s total Eagle Ford Shale volumes have been averaging
Slide 19: Texas Outlook
Texas Outlook Saint Jo system ■ Copano’s largest producer has 11 rigs running in the area and expects to run 11 - 12 rigs for the remainder of the year ● On track to connect approximately 150 wells in 2011 ■ Leasing activity continues ■ Evaluating opportunity to expand Saint Jo plant by 50,000 Mcf/d
Slide 20: Oklahoma Recent Developments
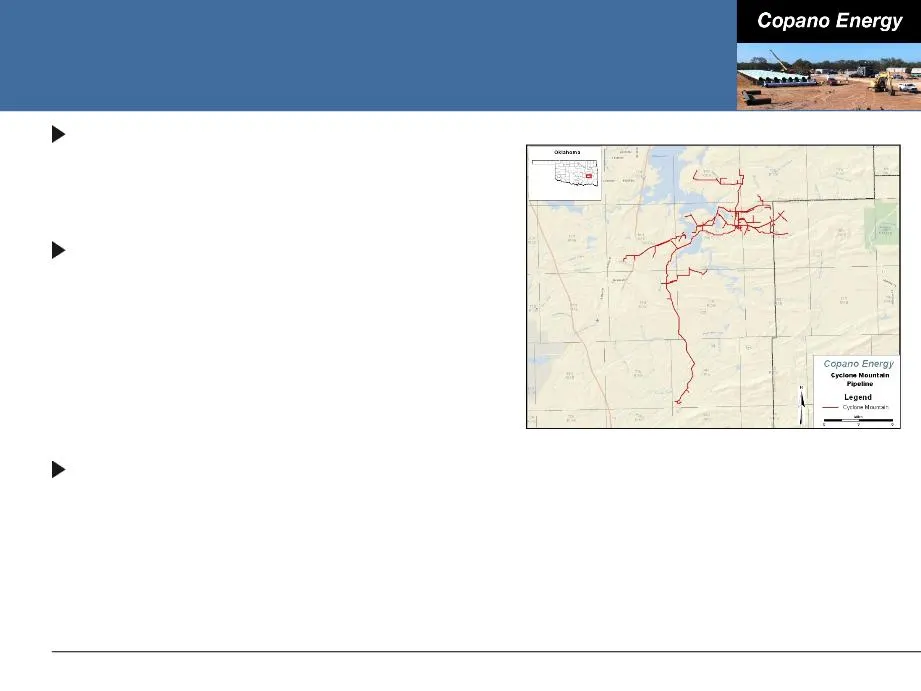
Oklahoma Recent Developments Acquisition of Harrah plant from Enogex (April 2011) ■ Contributed $1.5 million in gross margin in 2Q 2011 Strong drilling activity in the Woodford Shale around the Cyclone Mountain system ■ 2Q 2011 volumes increased an average of 4,500 Mcf/d compared to 1Q 2011 ■ Two ad
Slide 21: Oklahoma Outlook
Oklahoma Outlook Rich gas (primarily Hunton dewatering and Mississippi Lime) ■ Drilling activity has increased in 3Q 2011 compared to 2Q 2011 ■ 3 rigs running in the Hunton, 4 rigs in the Mississippi Lime and 13 rigs in other rich gas areas ■ Attractive processing upgrade and low geologic risk Lean
Slide 22: Rocky Mountains Outlook
Rocky Mountains Outlook Drilling and dewatering will be driven by commodity prices and producer economics 3Q 2011 volumes for Bighorn expected to be slightly lower vs. 2Q 3Q 2011 volumes for Fort Union expected to be higher vs. 2Q 2011 due to the Bison pipeline rupture Second half 2011 Adjusted EBIT
Slide 23: Financing and Commodity Price Sensitivity
Financing and Commodity Price Sensitivity Eagle Ford Shale Growth Projects Business Segment Outlook Financing and Commodity Price Sensitivity Conclusions
Slide 24: Liquidity and Capitalization
Liquidity and Capitalization At June 30, 2011: ■ $62 million cash ■ $700 million revolving credit facility ● Closed in June 2011 - added flexibility to existing financial covenants ● Approximately $360 million available ● Matures June 2016 ■ $609.5 million senior notes ● $360.0 million 7.125% senior
Slide 25: Shifting Contract Mix
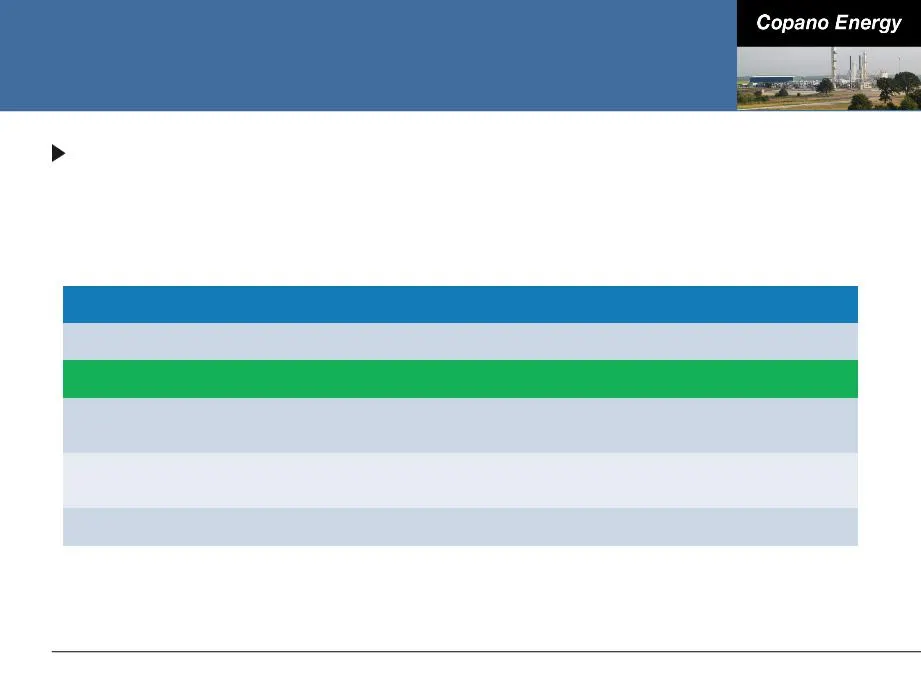
Shifting Contract Mix Contract Mix as a % of Gross Margin 1Q 2010 2Q 2010 3Q 2010 4Q 2010 1Q 2011 2Q 2011 Fee-based 27% 33% 37% 38% 41% 41% Percentage-of- proceeds 39% 31% 30% 32% 32% 33% Keep- whole/Other 36% 33% 29% 34% 39% 40% Net hedging -2% 3% 4% -4% -12% -14% Continued shift towards a more fee
Slide 26: Hedging Strategy
Hedging Strategy Continued focus on option-based, product-specific hedging strategy ■ Reliance on hedging will decrease as contract mix changes over time 2011 well hedged ■ Between 70% and 90% of ethane, propane, butane, natural gasoline and condensate exposure is hedged 2012 hedged near policy limi
Slide 27: Conclusions
Conclusions Eagle Ford Shale Growth Projects Business Segment Outlook Financing and Commodity Price Sensitivity Conclusions
Slide 28: Copano’s Key Strengths
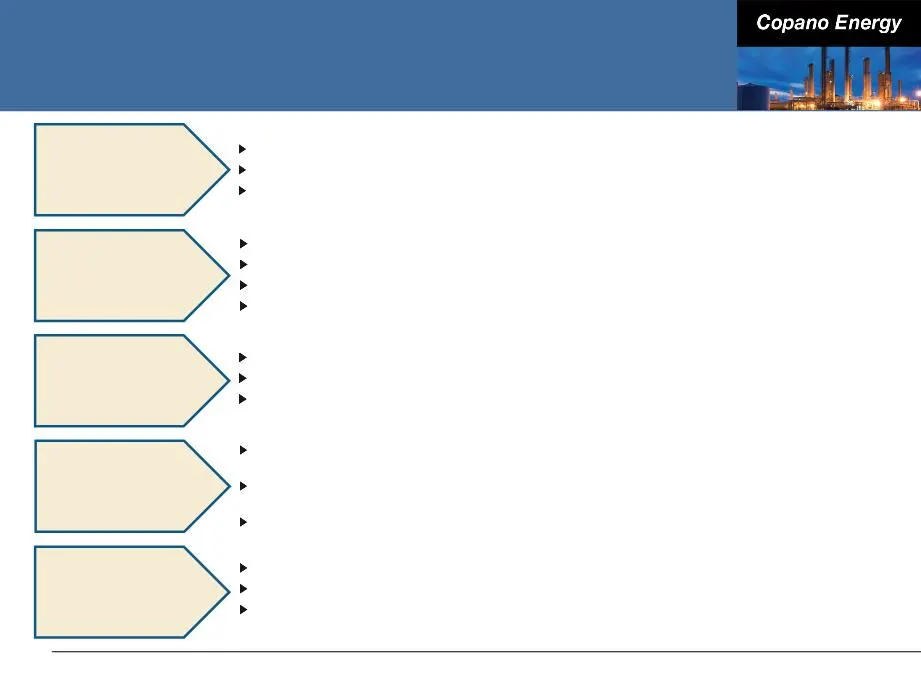
Copano’s Key Strengths Founded in 1992 as an independent midstream company Experienced operator in liquids-rich natural gas plays Six executive management members with 166 combined years of industry experience Experienced Operator / Seasoned Team Strong Balance Sheet with Access to Liquidity Strateg
Slide 29: Copano Energy
Copano Energy o- == I ie
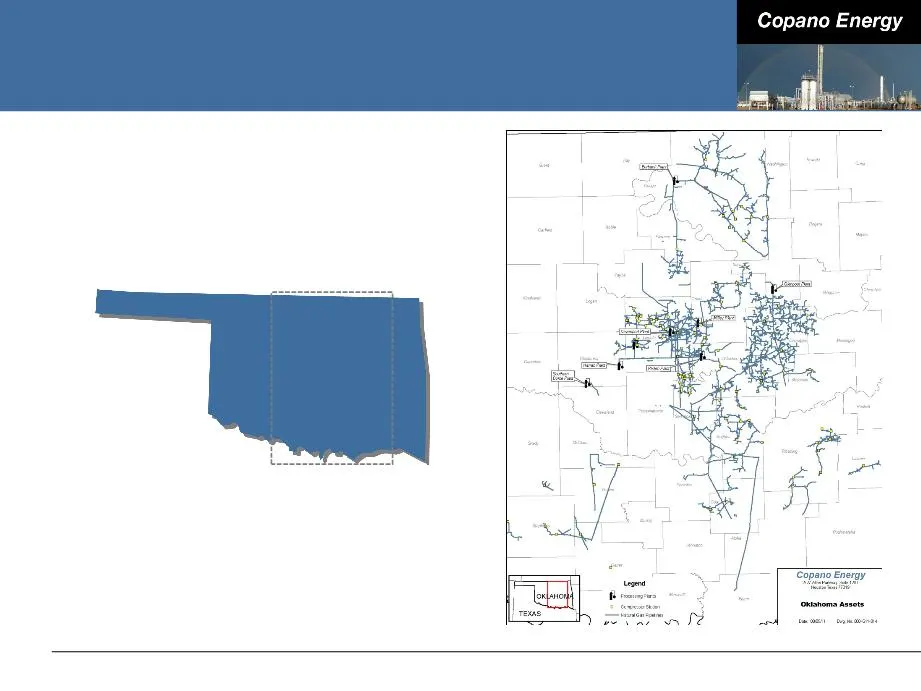
Slide 30: Oklahoma Assets
Oklahoma Assets OKLAHOMA
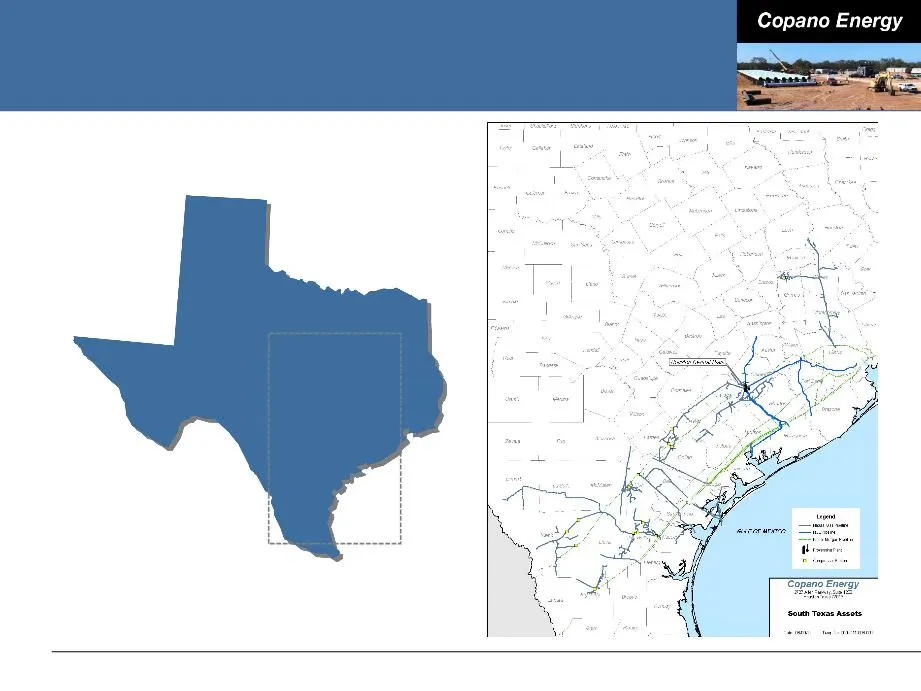
Slide 31: South Texas Assets
South Texas Assets TEXAS
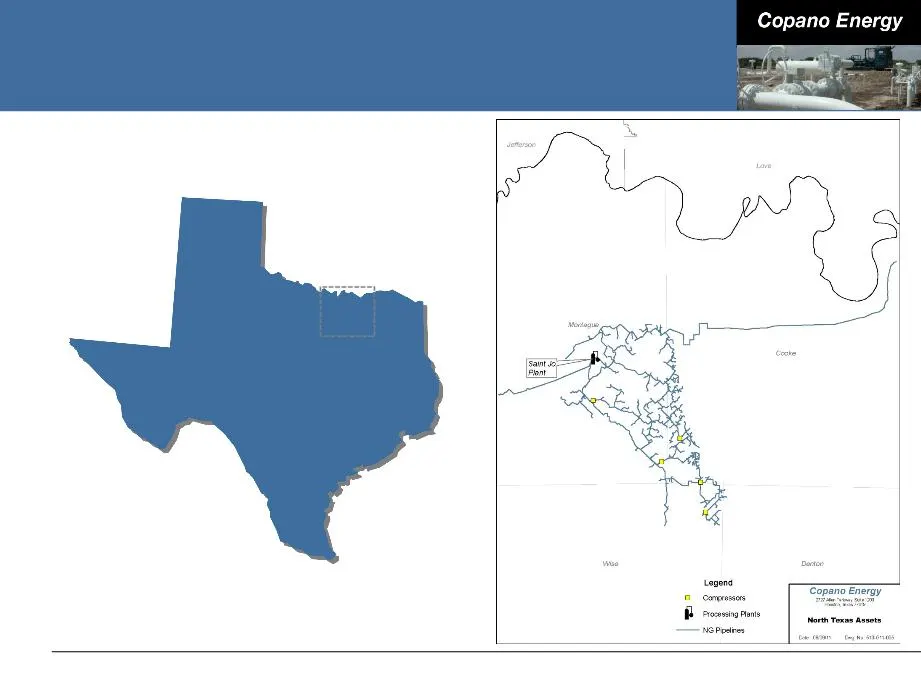
Slide 32: North Texas Assets
North Texas Assets TEXAS
Slide 33: Rocky Mountains Assets
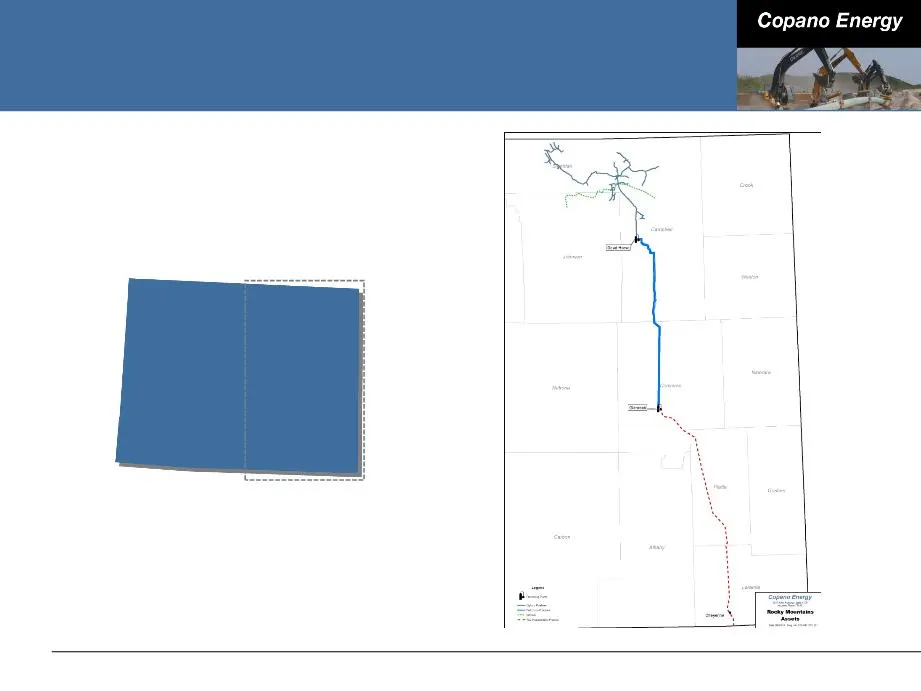
Rocky Mountains Assets WYOMING
Slide 34: Solid Core Business Growth
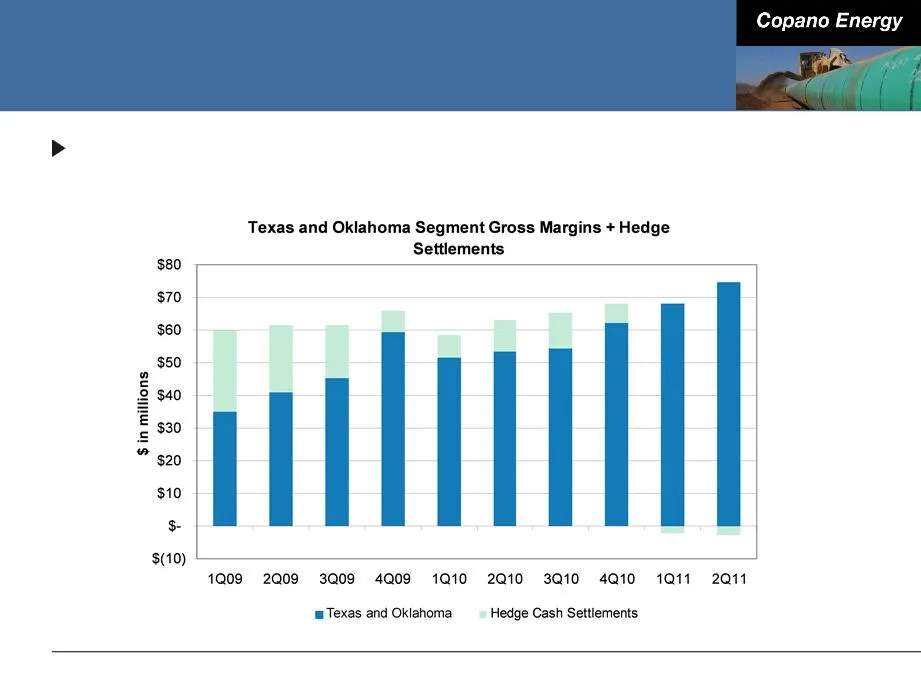
Solid Core Business Growth From 1Q 2009 to 2Q 2011, Texas and Oklahoma operating segment gross margins has increased approximately 114%
Slide 35: Commodity-Related Margin Sensitivities
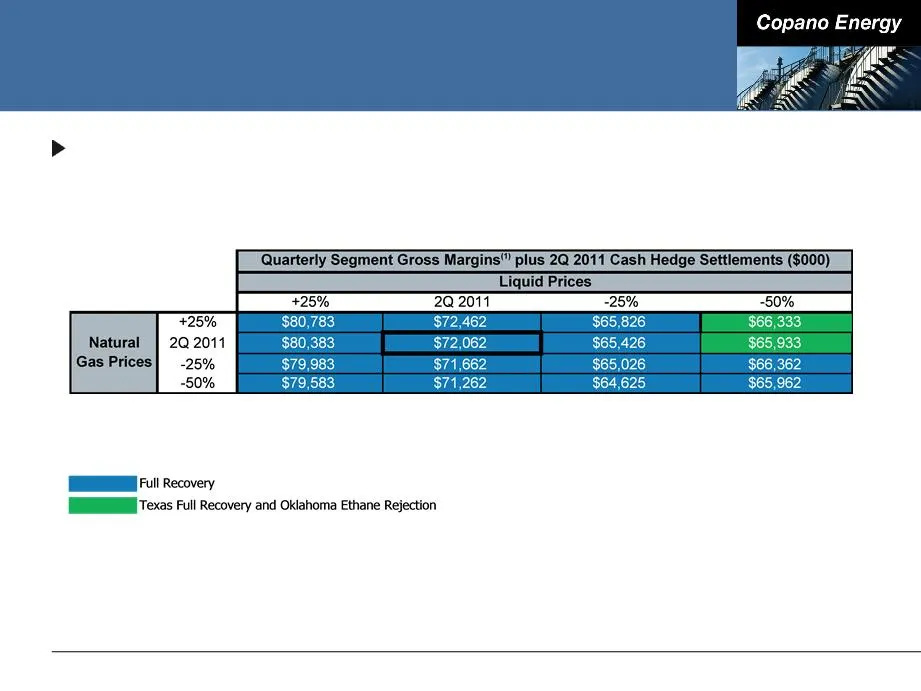
Commodity-Related Margin Sensitivities Matrix reflects 2Q 2011 wellhead and plant inlet volumes, adjusted using Copano’s 2011 planning model (1) Consists of Texas and Oklahoma Segment gross margins.
Slide 36: Oklahoma Net Commodity Exposure
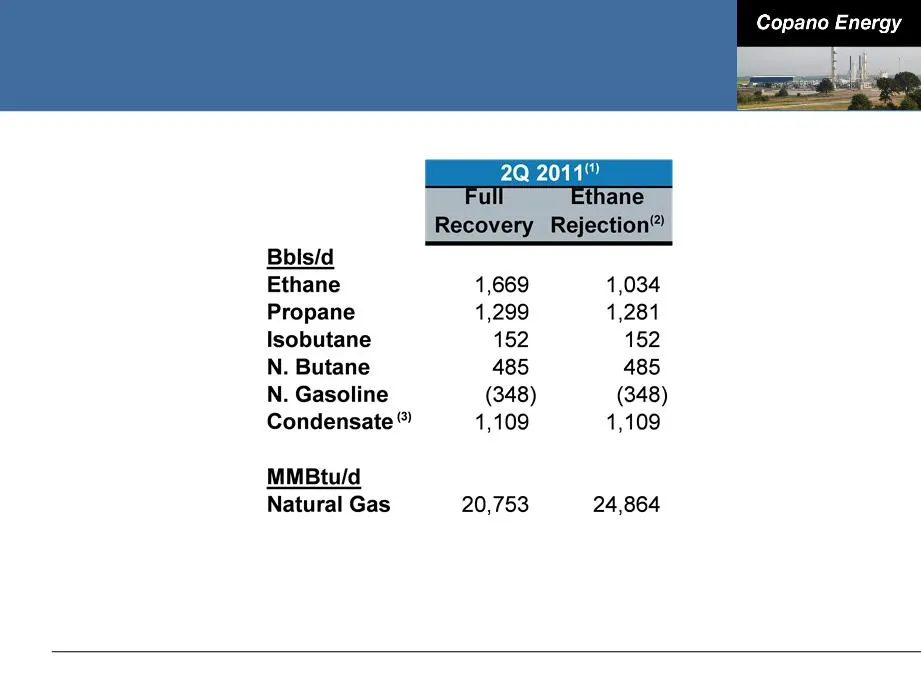
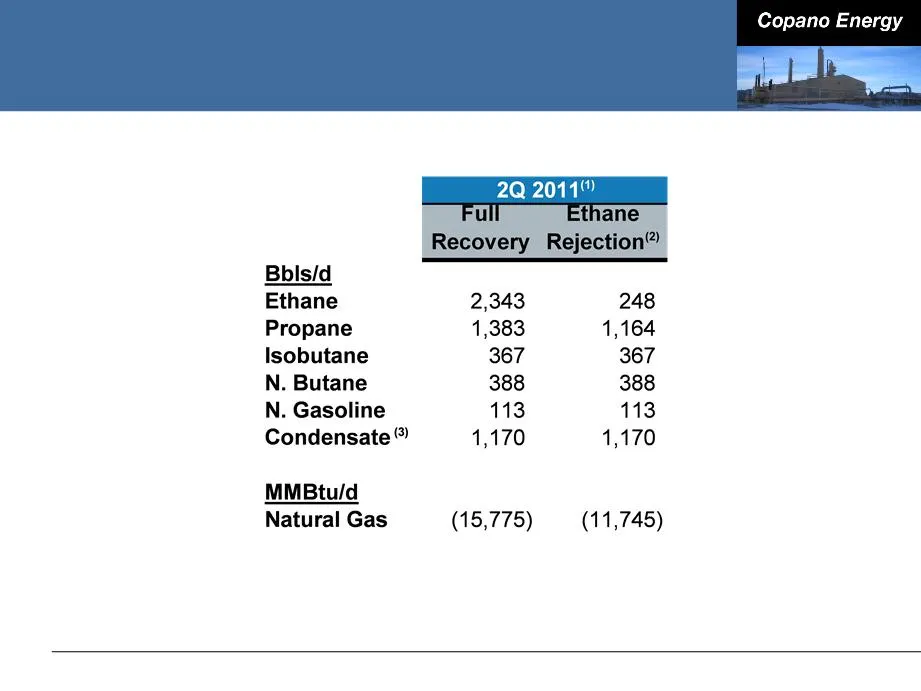
Oklahoma Net Commodity Exposure Note: See explanation of processing modes in this Appendix. Values reflect rounding. (1) Source: Copano Energy internal financial planning models. (2) Ethane rejection at Paden plant is limited by nitrogen rejection facilities. (3) Reflects impact of producer delivery
Slide 37: Oklahoma Commodity Price Sensitivities
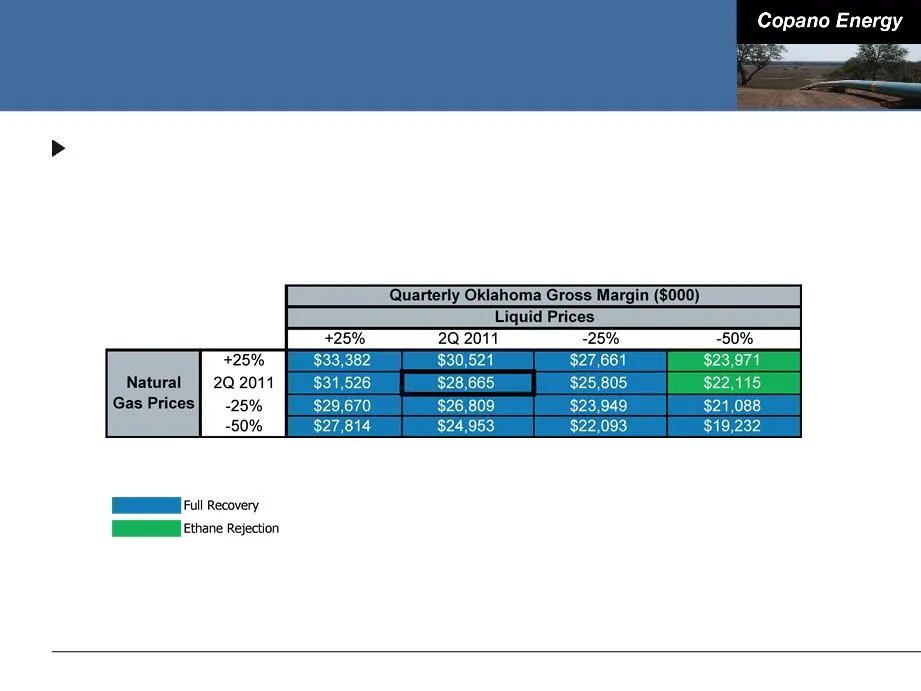
Oklahoma Commodity Price Sensitivities Oklahoma segment gross margins excluding hedge settlements ■ Matrix reflects 2Q 2011 volumes, adjusted using Copano’s 2011 planning model Note: Please see this Appendix for definitions of processing modes and additional details.
Slide 38: Texas Net Commodity Exposure
Texas Net Commodity Exposure Note: See explanation of processing modes in this Appendix. (1) Source: Copano Energy internal financial planning models. Based on 1Q 2011 daily wellhead/plant inlet volumes. (2) Fractionation at Houston Central complex permits significant reductions in ethane recoveries
Slide 39: Texas Commodity Price Sensitivities
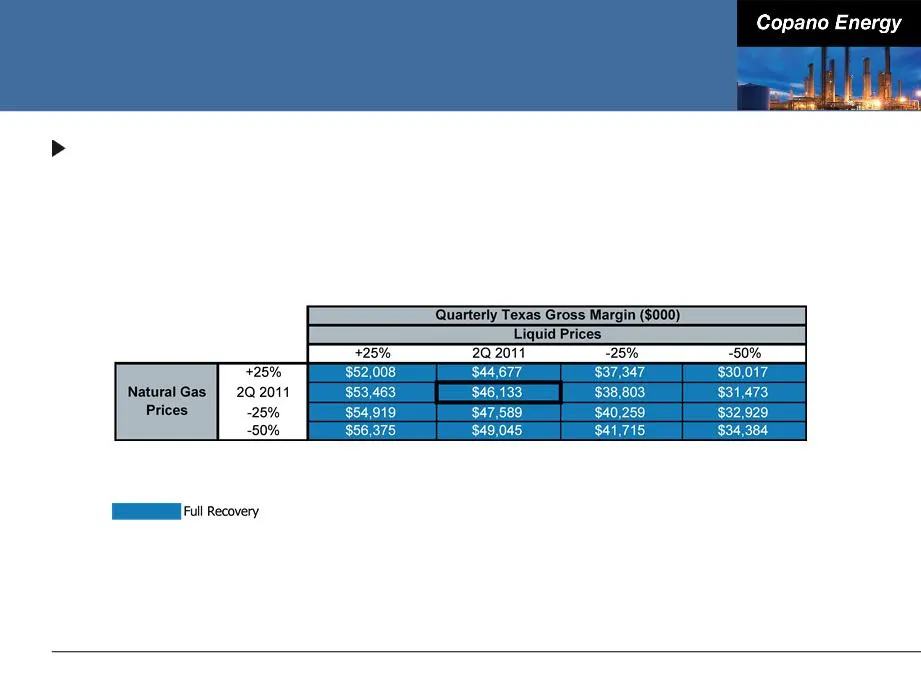
Texas Commodity Price Sensitivities Texas segment gross margins excluding hedge settlements ■ Matrix reflects 2Q 2011 volumes and operating conditions, adjusted using Copano’s 2011 planning model Note: Please see this Appendix for definitions of processing modes and additional details.
Slide 40: Rocky Mountains Sensitivities
Rocky Mountains Sensitivities 2Q 2011 Adjusted EBITDA volume sensitivity (positive or negative impact) ■ Bighorn: 10,000 MMBtu/d = $245,000 (1) ■ Fort Union: 10,000 MMBtu/d = immaterial impact until physical volumes exceed long-term contractual volume commitments ● 2Q 2011 pipeline throughput: 391,6
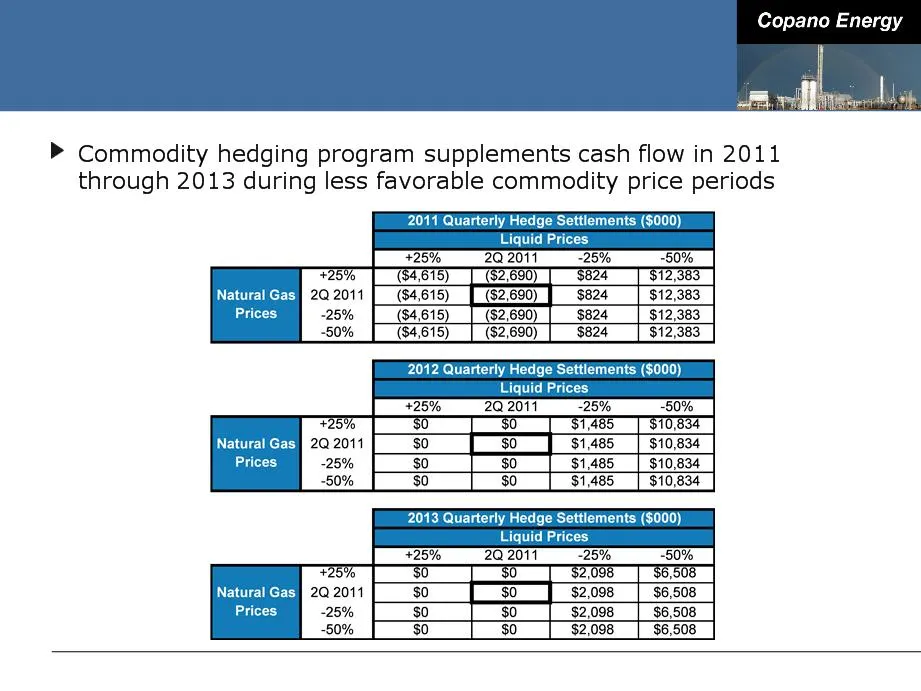
Slide 41: Hedging Impact of Commodity Price Sensitivities
Hedging Impact of Commodity Price Sensitivities
Slide 42: Processing Modes
Processing Modes Full Recovery Texas and Oklahoma - If the value of recovered NGLs exceeds the fuel and gas shrinkage costs of recovering NGLs Ethane Rejection Texas and Oklahoma - If the value of ethane is less than the fuel and shrinkage costs to recover ethane (in Oklahoma, ethane rejection at Pa
Slide 43: Reconciliation of Non-GAAP Financial Measures
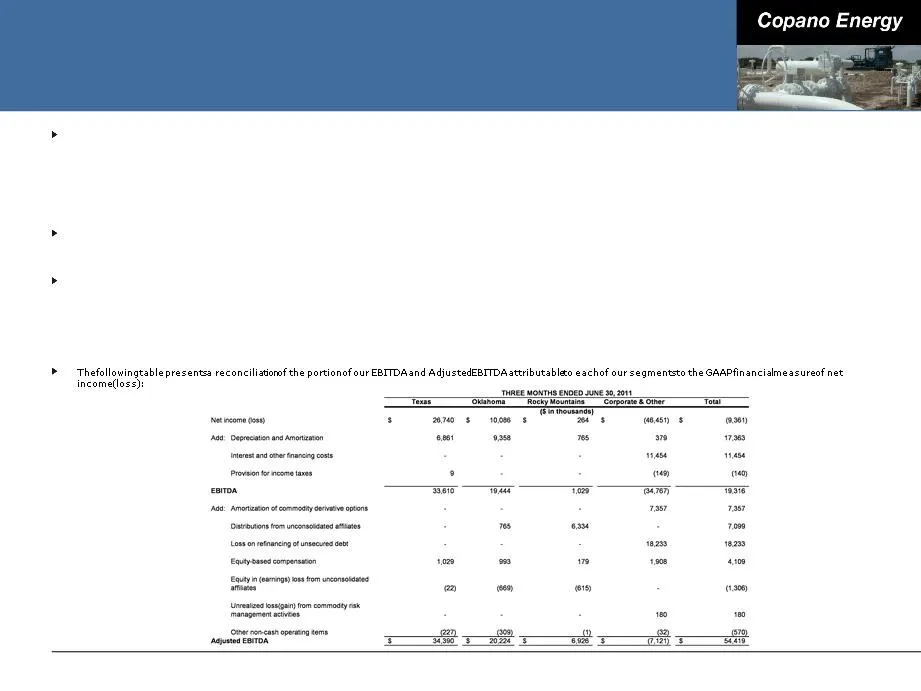
Reconciliation of Non-GAAP Financial Measures Adjusted EBITDA Commencing with the second quarter of 2011, we revised our calculation of adjusted EBITDA to more closely resemble that of many of our peers in terms of measuring our ability to generate cash. Our adjusted EBITDA (as revised) equals: ■ ne
Source: SEC EDGAR · 8-K filed Aug 24, 2011
More decks from Copano Energy L.L.C.
 2012 RBC Capital Markets MLP Conference35 slides · Nov 15, 2012
 2012 Citi One-on-One MLP/Midstream Infrastructure Conference35 slides · Aug 21, 2012
 Investor Presentation (June 2012)34 slides · Jun 18, 2012
 NAPTP 2012 MLP Investor Conference34 slides · May 22, 2012
 Morgan Stanley MLP and Diversified Natural Gas Corporate Access Day 201245 slides · Mar 7, 2012
 2011 RBC Capital Markets MLP Conference42 slides · Nov 17, 2011