CSI Compressco LP — Wells Fargo Securities 15th Annual Energy Symposium 2016
24 slides from CSI Compressco LP's conference presentation, Dec 7, 2016
Slide 1: Wells Fargo Securities 15th Annual Energy Symposium
Wells Fargo Securities 15th Annual Energy Symposium December 7, 2016 Tim Knox President Stu Brightman President & CEO TETRA Technologies, Inc. Exhibit 99.1
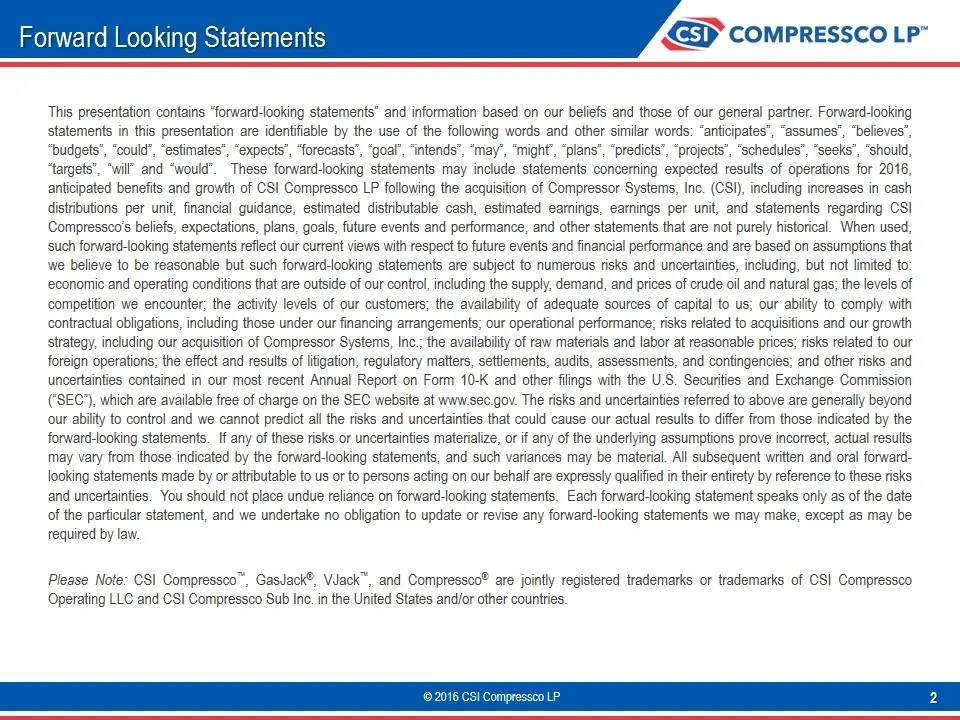
Slide 2: Forward-Looking Statements
This presentation contains “forward-looking statements” and information based on our beliefs and those of our general partner. Forward-looking statements in this presentation are identifiable by the use of the following words and other similar words: “anticipates”, “assumes”, “believes”, “budgets”,
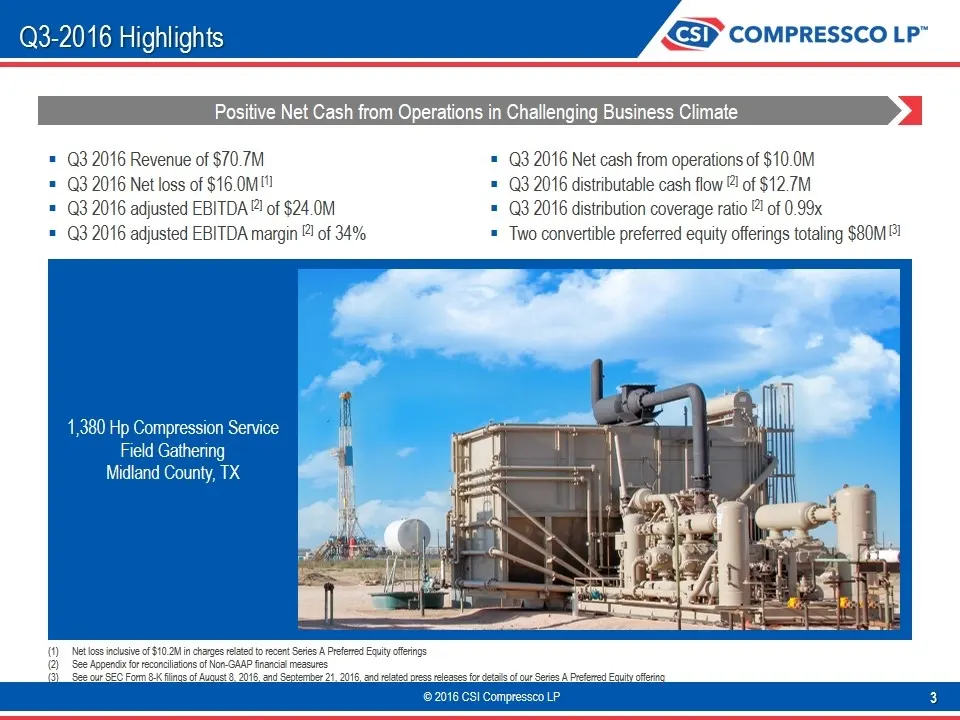
Slide 3: Q3-2016 Highlights
Q3-2016 Highlights Q3 2016 Revenue of $70.7M Q3 2016 Net loss of $16.0M [1] Q3 2016 adjusted EBITDA [2] of $24.0M Q3 2016 adjusted EBITDA margin [2] of 34% Positive Net Cash from Operations in Challenging Business Climate 1,380 Hp Compression Service Field Gathering Midland County, TX Net loss inclu
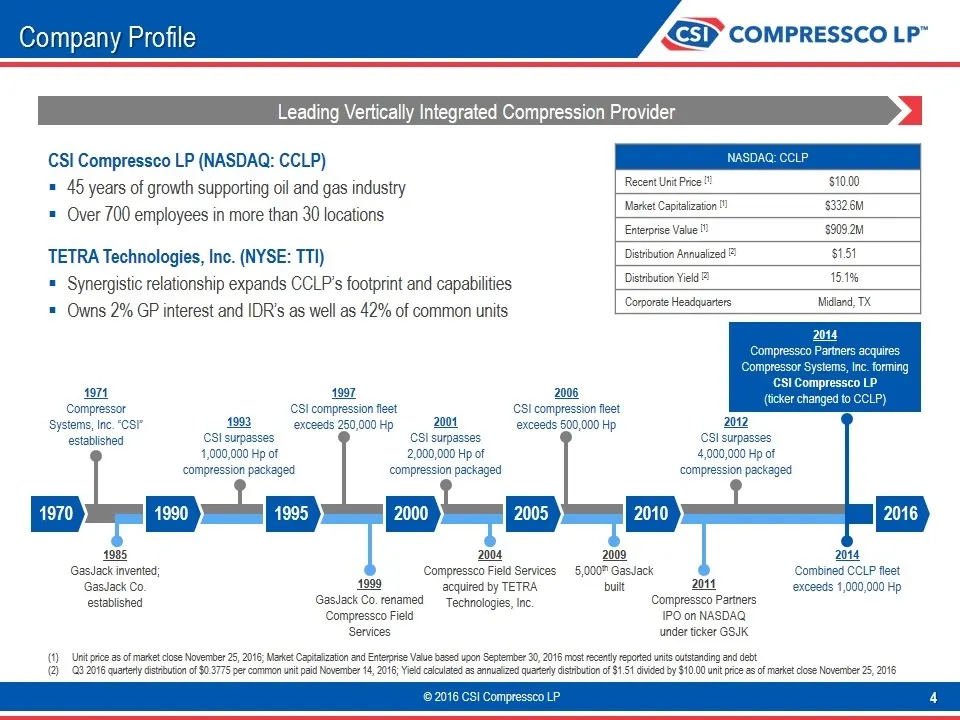
Slide 4: CSI Compressco LP Company Profile
CSI Compressco LP (NASDAQ: CCLP) 45 years of growth supporting oil and gas industry Over 700 employees in more than 30 locations TETRA Technologies, Inc. (NYSE: TTI) Synergistic relationship expands CCLP’s footprint and capabilities Owns 2% GP interest and IDR’s as well as 42% of common units Compan
Slide 5: Investment Highlights
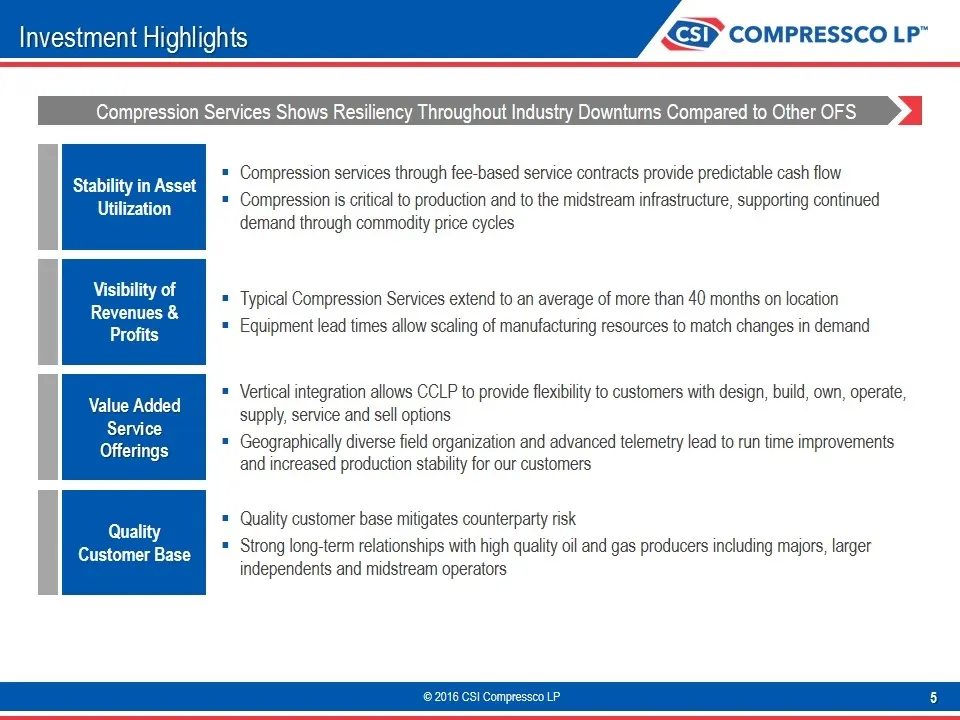
Investment Highlights Compression services through fee-based service contracts provide predictable cash flow Compression is critical to production and to the midstream infrastructure, supporting continued demand through commodity price cycles Stability in Asset Utilization Value Added Service Offeri
Slide 6: Compression Overview
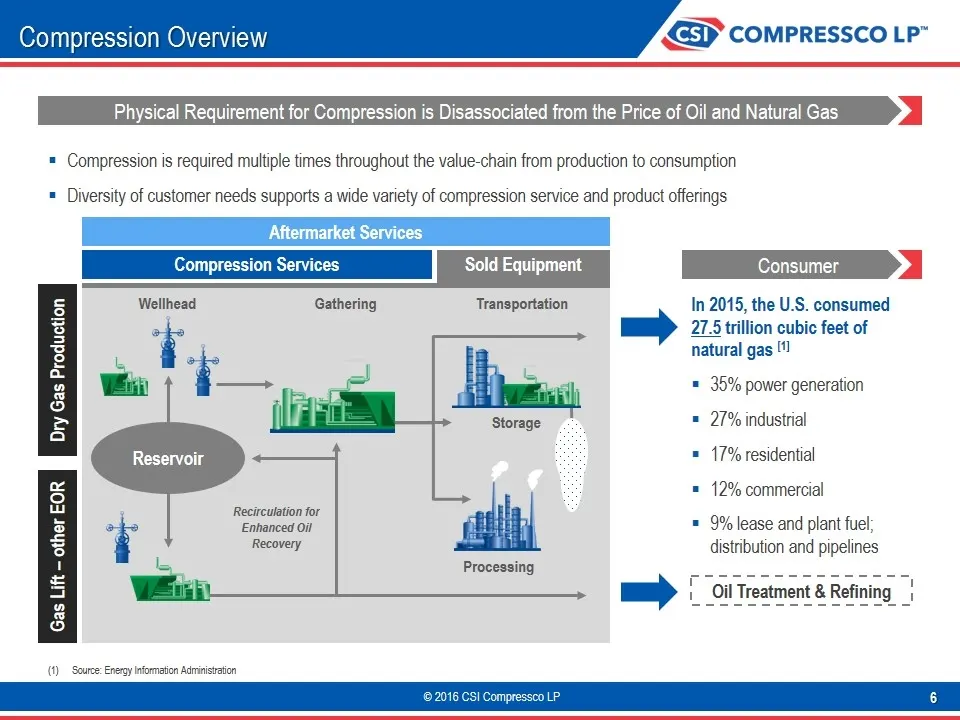
Compression Overview Compression is required multiple times throughout the value-chain from production to consumption Diversity of customer needs supports a wide variety of compression service and product offerings Source: Energy Information Administration In 2015, the U.S. consumed 27.5 trillion cu
Slide 7: Forecasted Demand and Production Growth
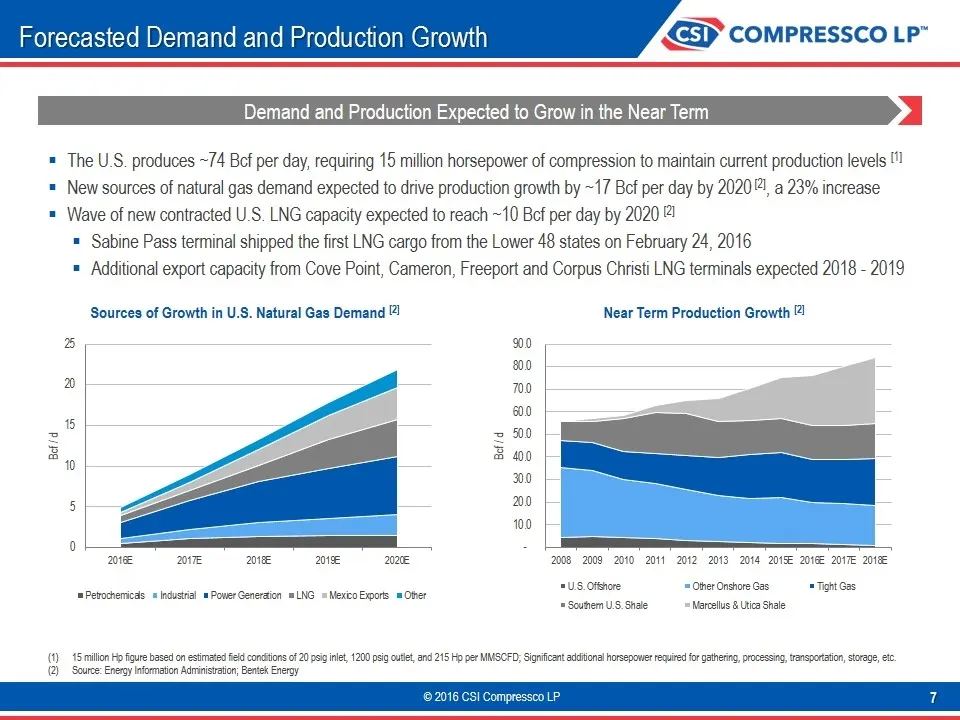
Forecasted Demand and Production Growth The U.S. produces ~74 Bcf per day, requiring 15 million horsepower of compression to maintain current production levels [1] New sources of natural gas demand expected to drive production growth by ~17 Bcf per day by 2020 [2], a 23% increase Wave of new contrac
Slide 8: Forecasted Infrastructure Demand and Growth
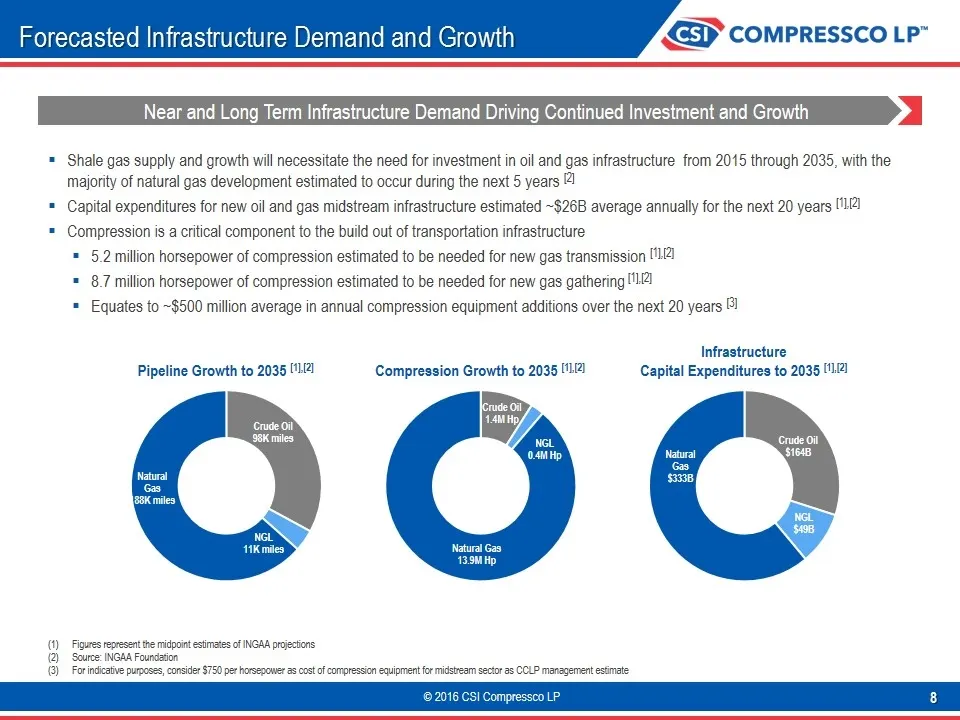
Forecasted Infrastructure Demand and Growth Shale gas supply and growth will necessitate the need for investment in oil and gas infrastructure from 2015 through 2035, with the majority of natural gas development estimated to occur during the next 5 years [2] Capital expenditures for new oil and gas
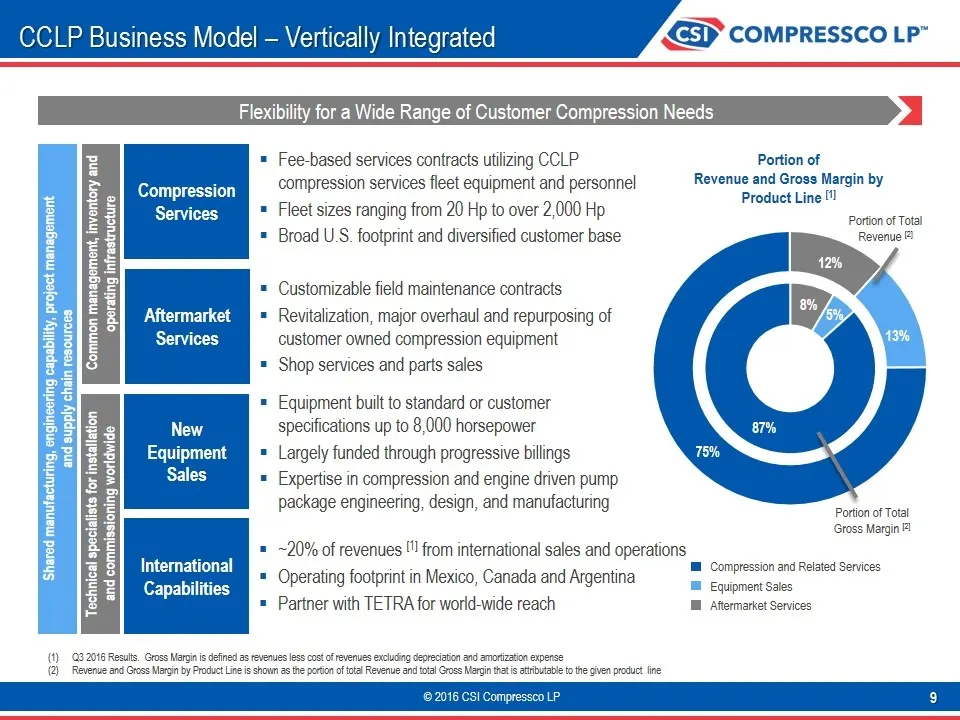
Slide 9: CCLP Business Model – Vertically Integrated
CCLP Business Model – Vertically Integrated Q3 2016 Results. Gross Margin is defined as revenues less cost of revenues excluding depreciation and amortization expense Revenue and Gross Margin by Product Line is shown as the portion of total Revenue and total Gross Margin that is attributable to the
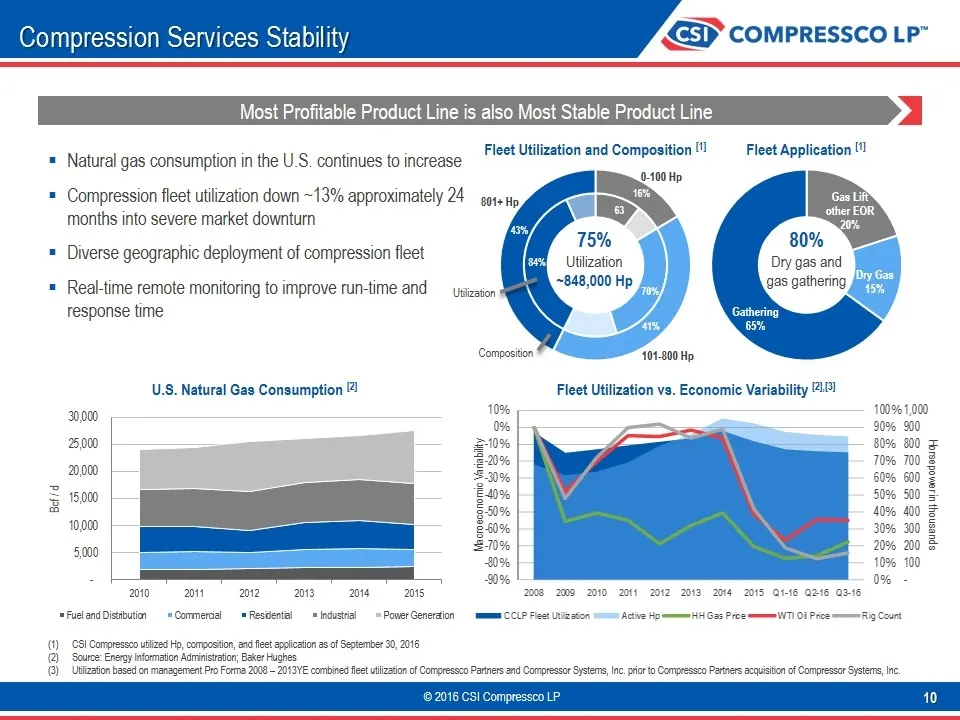
Slide 10: Compression Services Stability
Compression Services Stability Natural gas consumption in the U.S. continues to increase Compression fleet utilization down ~13% approximately 24 months into severe market downturn Diverse geographic deployment of compression fleet Real-time remote monitoring to improve run-time and response time U.
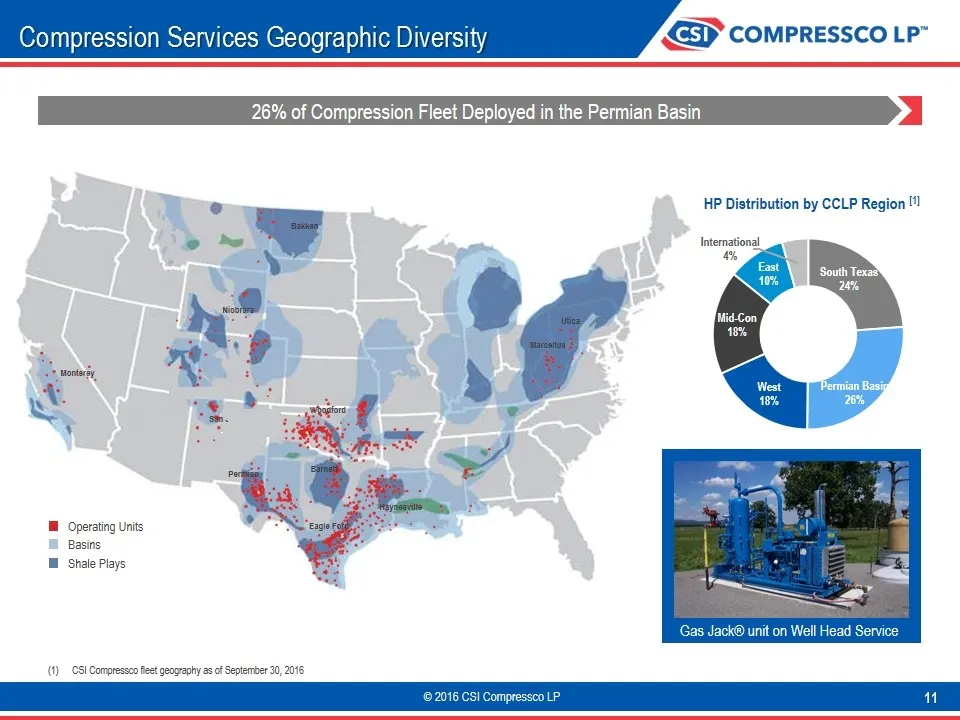
Slide 11: Compression Services Geographic Diversity
Eagle Ford Marcellus Utica Permian Barnett Haynesville Bakken Niobrara Monterey San Juan Woodford Compression Services Geographic Diversity 26% of Compression Fleet Deployed in the Permian Basin CSI Compressco fleet geography as of September 30, 2016 HP Distribution by CCLP Region [1] Operating Unit
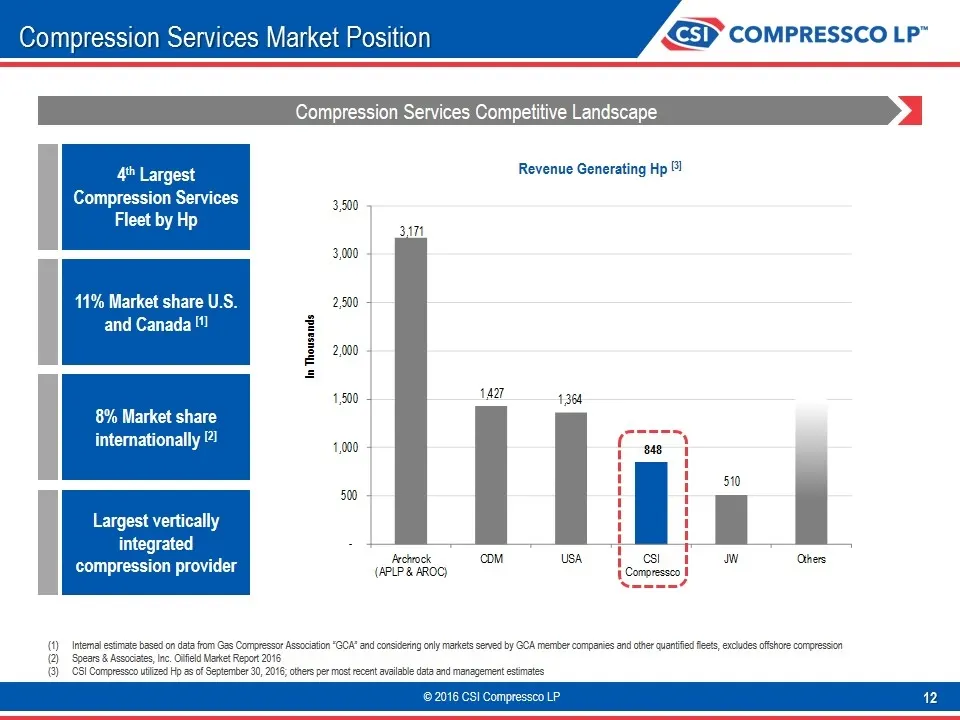
Slide 12: Compression Services Market Position
Compression Services Market Position 4th Largest Compression Services Fleet by Hp 11% Market share U.S. and Canada [1] 8% Market share internationally [2] Largest vertically integrated compression provider Revenue Generating Hp [3] Compression Services Competitive Landscape Internal estimate based o
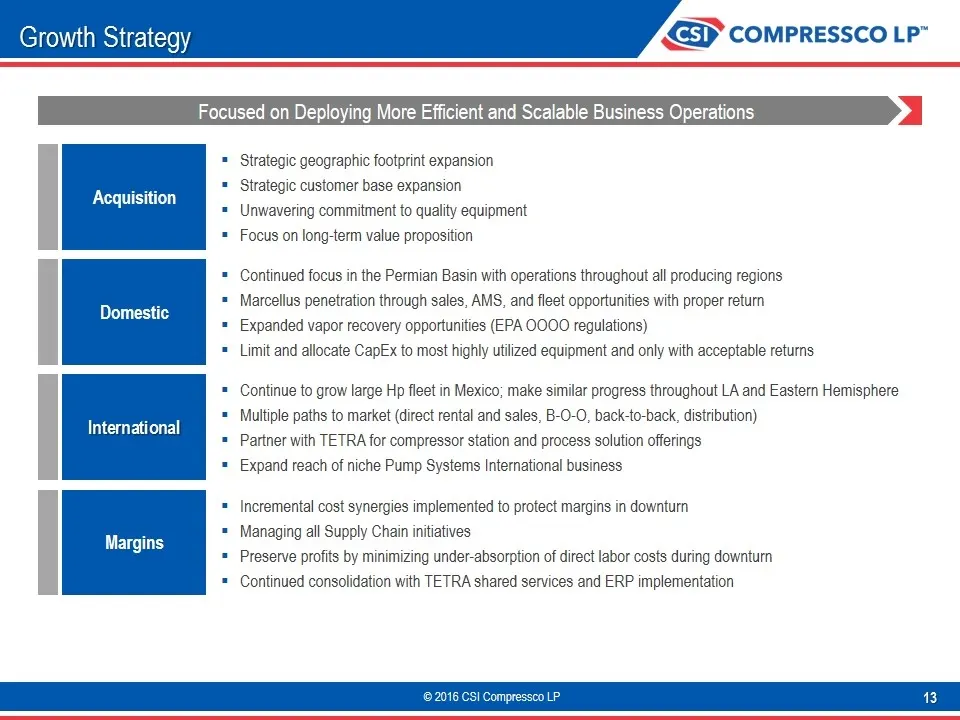
Slide 13: Growth Strategy
Growth Strategy Strategic geographic footprint expansion Strategic customer base expansion Unwavering commitment to quality equipment Focus on long-term value proposition Acquisition International Continue to grow large Hp fleet in Mexico; make similar progress throughout LA and Eastern Hemisphere M
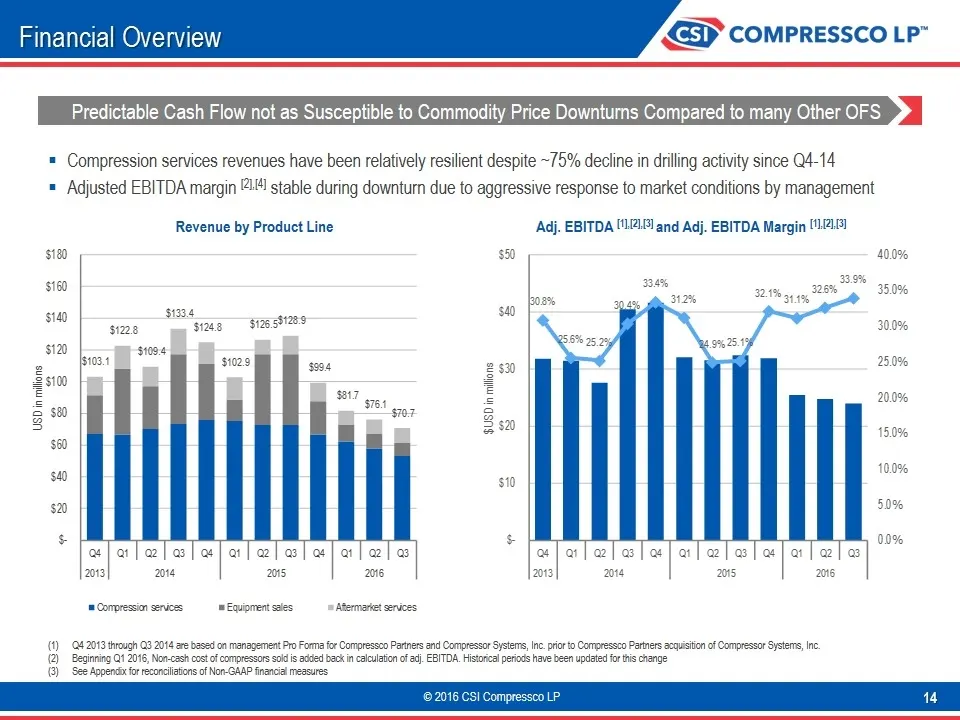
Slide 14: Financial Overview
Financial Overview Predictable Cash Flow not as Susceptible to Commodity Price Downturns Compared to many Other OFS Revenue by Product Line Adj. EBITDA [1],[2],[3] and Adj. EBITDA Margin [1],[2],[3] Compression services revenues have been relatively resilient despite ~75% decline in drilling activit
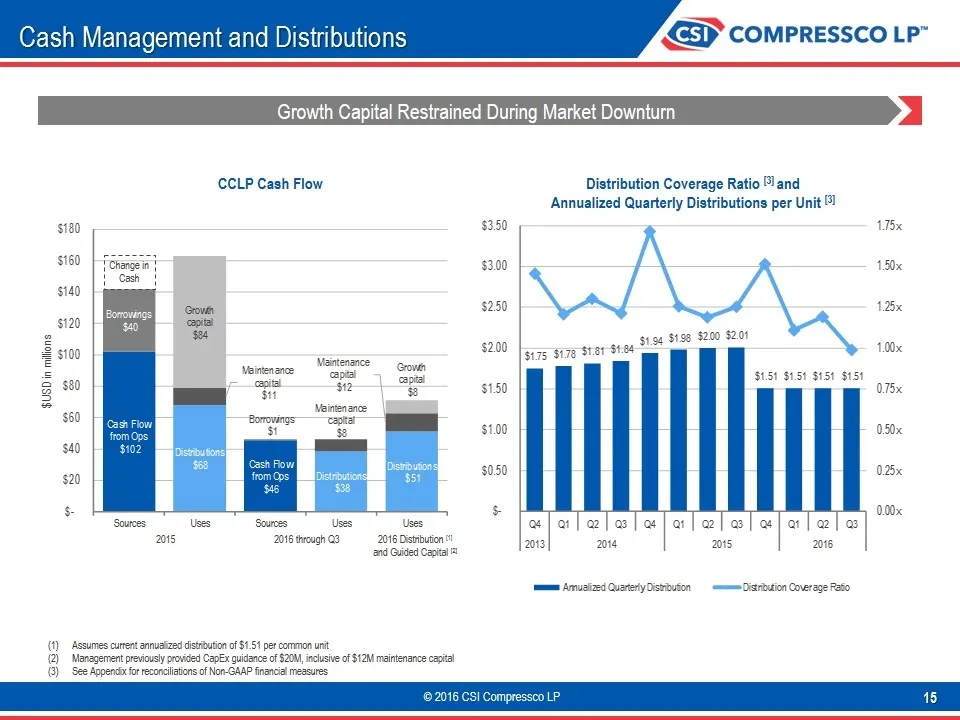
Slide 15: Cash Management and Distributions
Cash Management and Distributions Distribution Coverage Ratio [3] and Annualized Quarterly Distributions per Unit [3] CCLP Cash Flow Assumes current annualized distribution of $1.51 per common unit Management previously provided CapEx guidance of $20M, inclusive of $12M maintenance capital See Appen
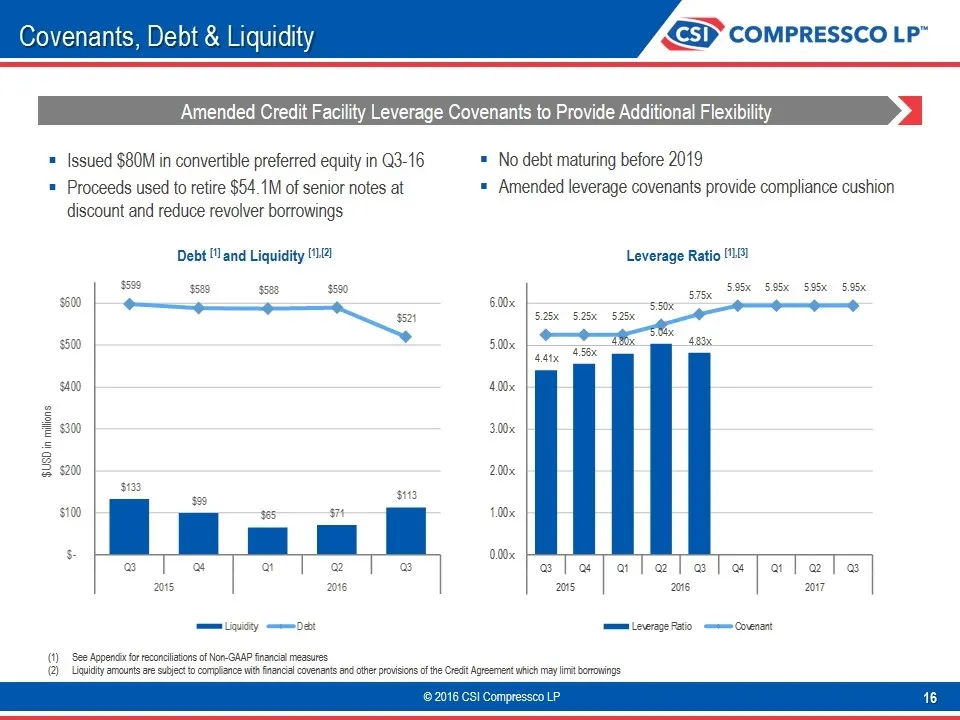
Slide 16: Covenants, Debt & Liquidity
Covenants, Debt & Liquidity Amended Credit Facility Leverage Covenants to Provide Additional Flexibility Issued $80M in convertible preferred equity in Q3-16 Proceeds used to retire $54.1M of senior notes at discount and reduce revolver borrowings Debt [1] and Liquidity [1],[2] Leverage Ratio [1],[3
Slide 17: Counterparty Risk
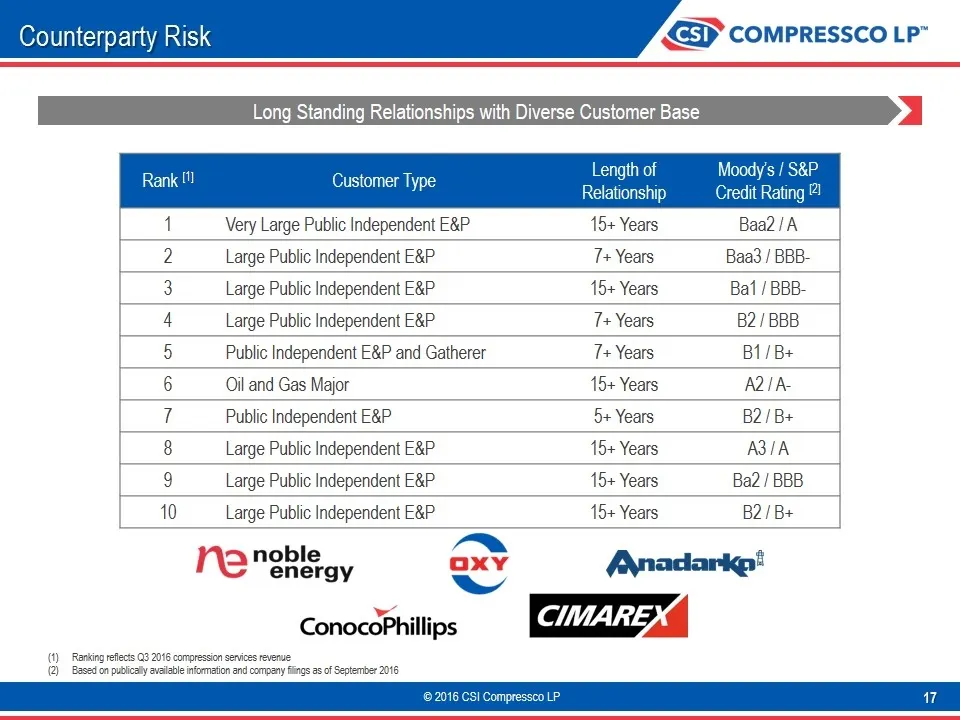
Counterparty Risk Long Standing Relationships with Diverse Customer Base Rank [1] Customer Type Length of Relationship Moody’s / S&P Credit Rating [2] 1 Very Large Public Independent E&P 15+ Years Baa2 / A 2 Large Public Independent E&P 7+ Years Baa3 / BBB- 3 Large Public Independent E&P 15+ Years B
Slide 18: 2016 Status
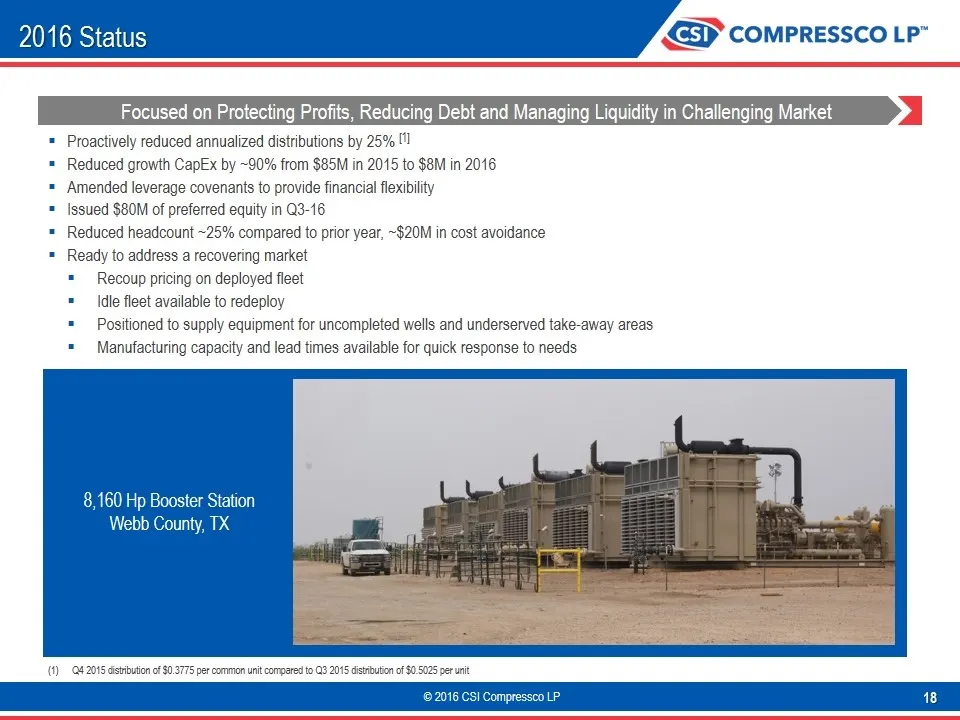
2016 Status 8,160 Hp Booster Station Webb County, TX Focused on Protecting Profits, Reducing Debt and Managing Liquidity in Challenging Market Proactively reduced annualized distributions by 25% [1] Reduced growth CapEx by ~90% from $85M in 2015 to $8M in 2016 Amended leverage covenants to provide f
Slide 19: Appendix
®D compressco LP” Appendix
Slide 20: Non-GAAP Financial Measures
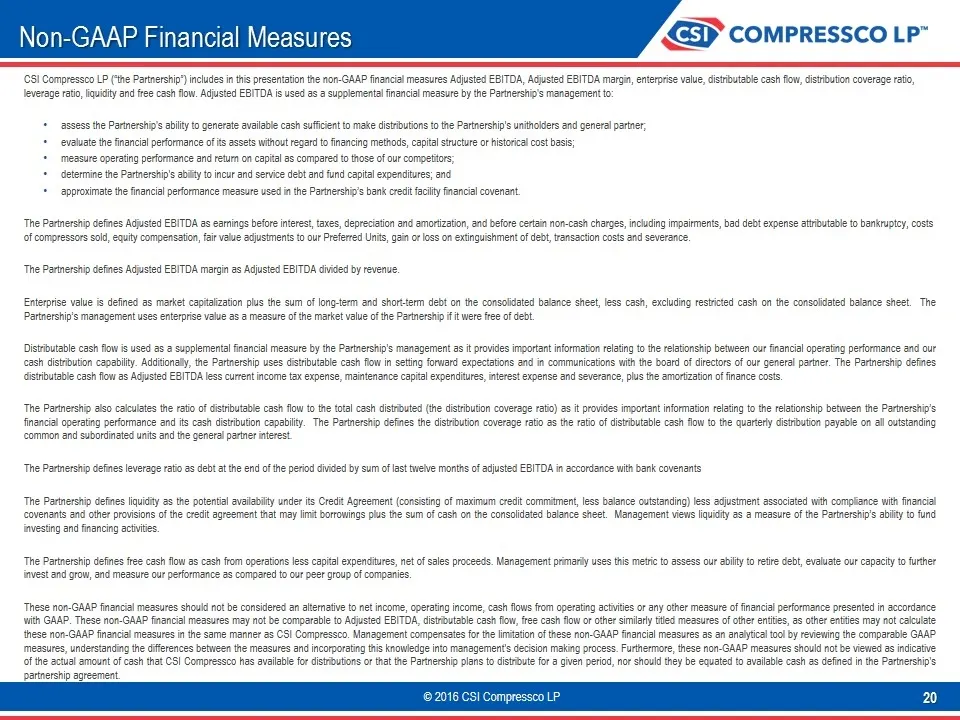
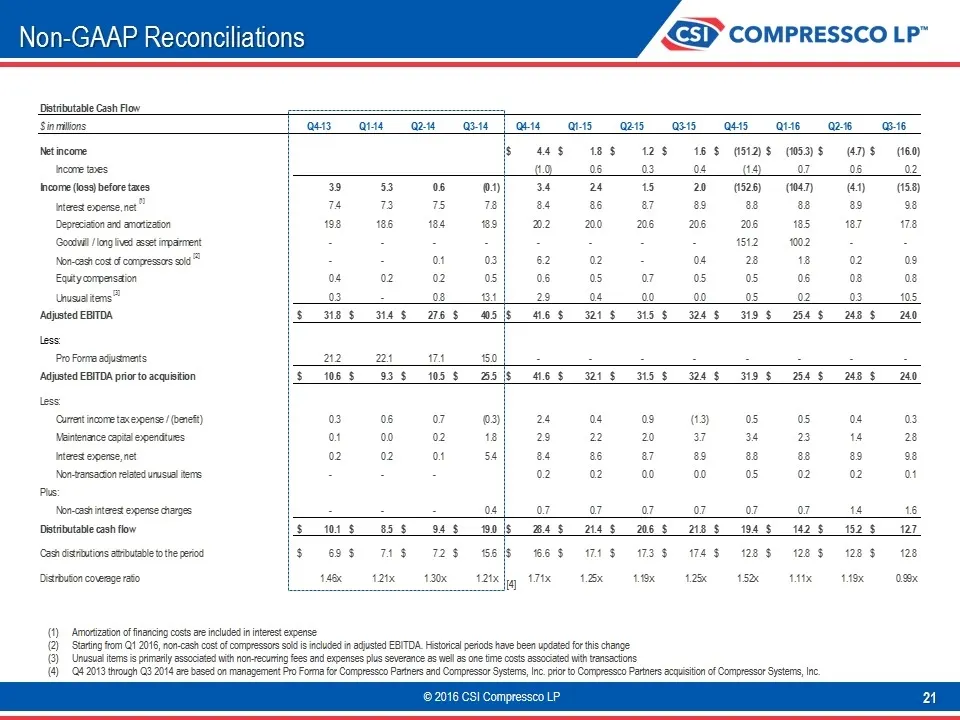
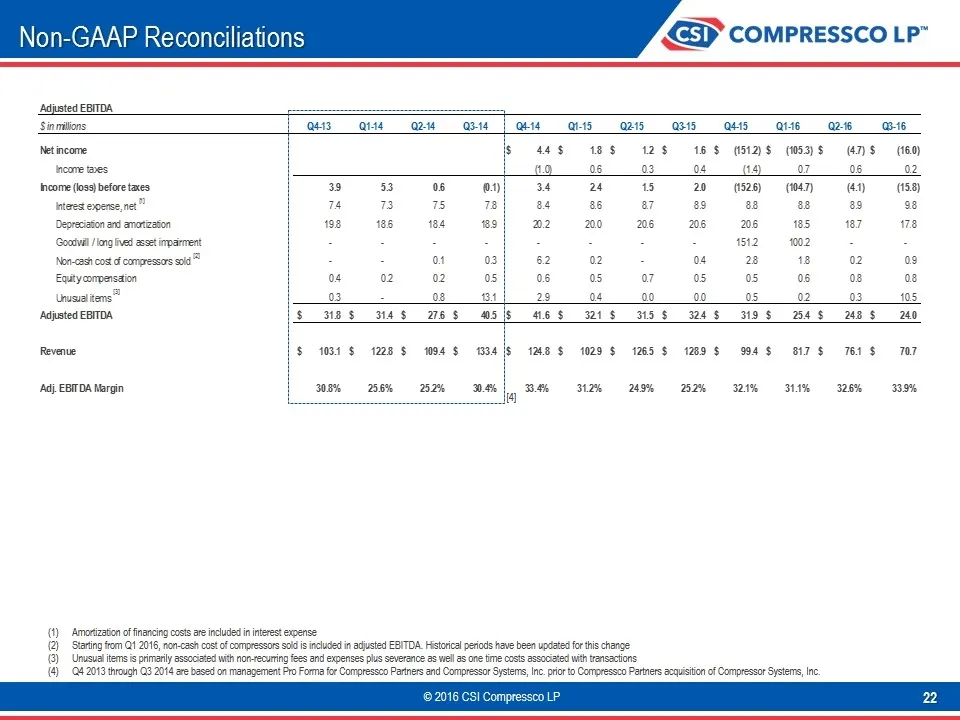
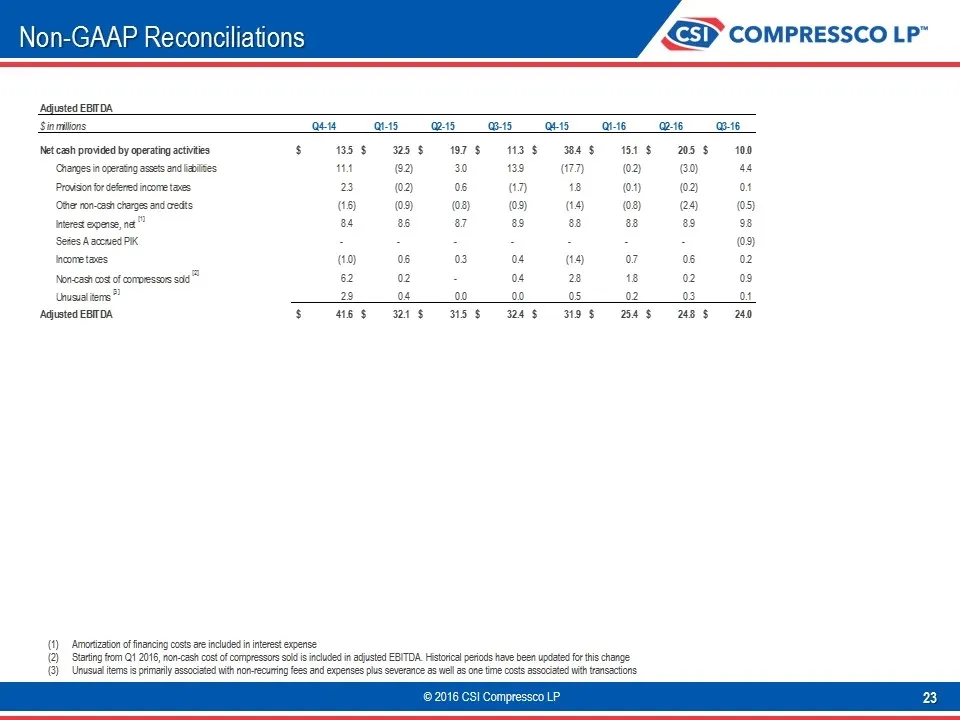
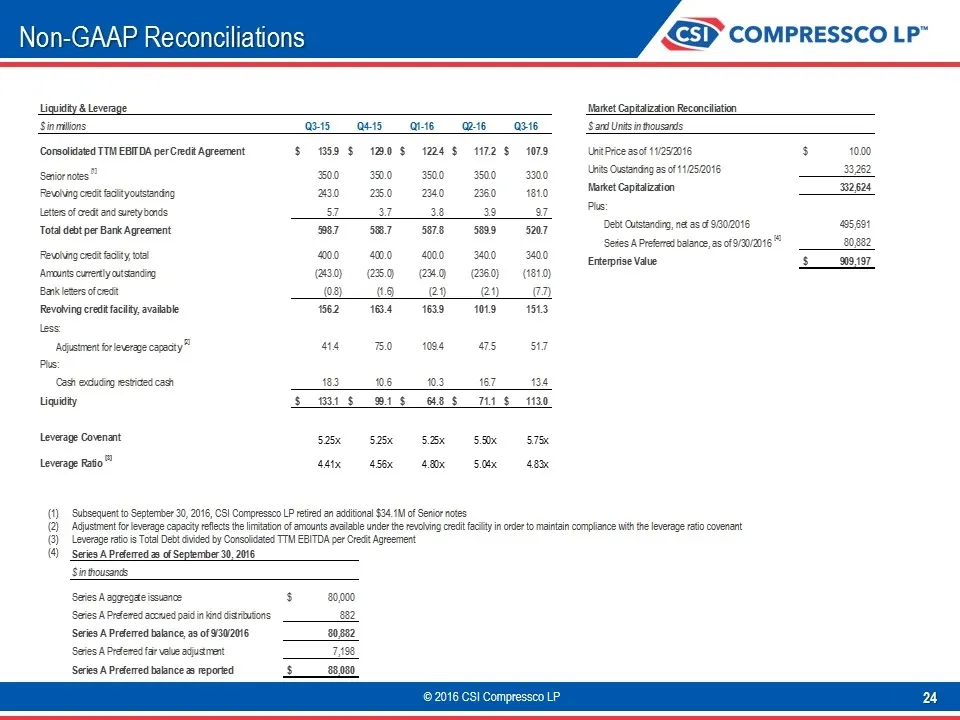
Non-GAAP Financial Measures CSI Compressco LP (“the Partnership”) includes in this presentation the non-GAAP financial measures Adjusted EBITDA, Adjusted EBITDA margin, enterprise value, distributable cash flow, distribution coverage ratio, leverage ratio, liquidity and free cash flow. Adjusted EBIT
Slide 21: Non-GAAP Reconciliations
Non-GAAP Reconciliations Amortization of financing costs are included in interest expense Starting from Q1 2016, non-cash cost of compressors sold is included in adjusted EBITDA. Historical periods have been updated for this change Unusual items is primarily associated with non-recurring fees and ex
Slide 22: Non-GAAP Reconciliations
Non-GAAP Reconciliations Amortization of financing costs are included in interest expense Starting from Q1 2016, non-cash cost of compressors sold is included in adjusted EBITDA. Historical periods have been updated for this change Unusual items is primarily associated with non-recurring fees and ex
Slide 23: Non-GAAP Reconciliations
Non-GAAP Reconciliations Amortization of financing costs are included in interest expense Starting from Q1 2016, non-cash cost of compressors sold is included in adjusted EBITDA. Historical periods have been updated for this change Unusual items is primarily associated with non-recurring fees and ex
Slide 24: Non-GAAP Reconciliations
Non-GAAP Reconciliations Subsequent to September 30, 2016, CSI Compressco LP retired an additional $34.1M of Senior notes Adjustment for leverage capacity reflects the limitation of amounts available under the revolving credit facility in order to maintain compliance with the leverage ratio covenant
Source: SEC EDGAR · 8-K filed Dec 7, 2016
More decks from CSI Compressco LP
 Merger or Acquisition (November 2021)18 slides · Nov 12, 2021
 Investor Presentation (December 2019)30 slides · Dec 3, 2019
 Investor Day (May 2018)116 slides · May 31, 2018
 4th Annual Credit Suisse MLP and Energy Logistics Conference 201624 slides · Jun 21, 2016
 Investor Presentation (November 2015)20 slides · Nov 12, 2015
 Investor Day (April 2015)34 slides · Apr 2, 2015