Sundance Energy — Sundance Energy Australia — Investor Presentation (February 2015)
15 slides from Sundance Energy's investor presentation, Feb 4, 2015
Slide 1: Execute – Deliver – Grow
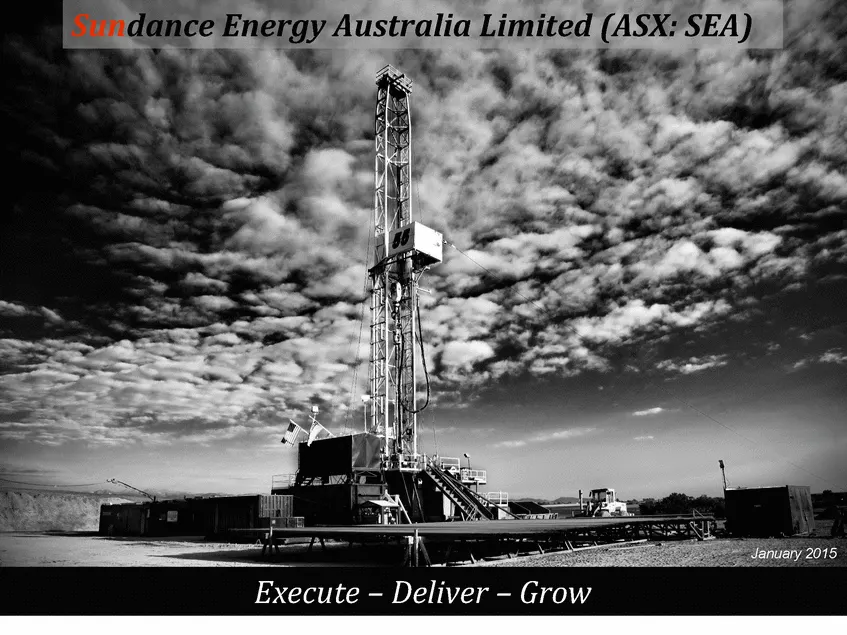
Sundance Energy Australia Limited (ASX: SEA) Execute – Deliver – Grow January 2015
Slide 2: Disclaimers
Disclaimers This presentation has been prepared by Sundance Energy Australia Limited (ABN 76 112 202 883). Summary information The following disclaimer applies to this document and any information contained in it (the “Information”). The Information in this presentation is of general background and
Slide 3: Disclaimers (continued)
Disclaimers (continued) Disclaimer Except as required by law, no representation or warranty (express or implied) is made as the fairness, accuracy, completeness, reliability or correctness of the Information, opinions and conclusions, or as to the reasonableness of any assumption contained in this d
Slide 4: Assets in Leading US Liquids Basins
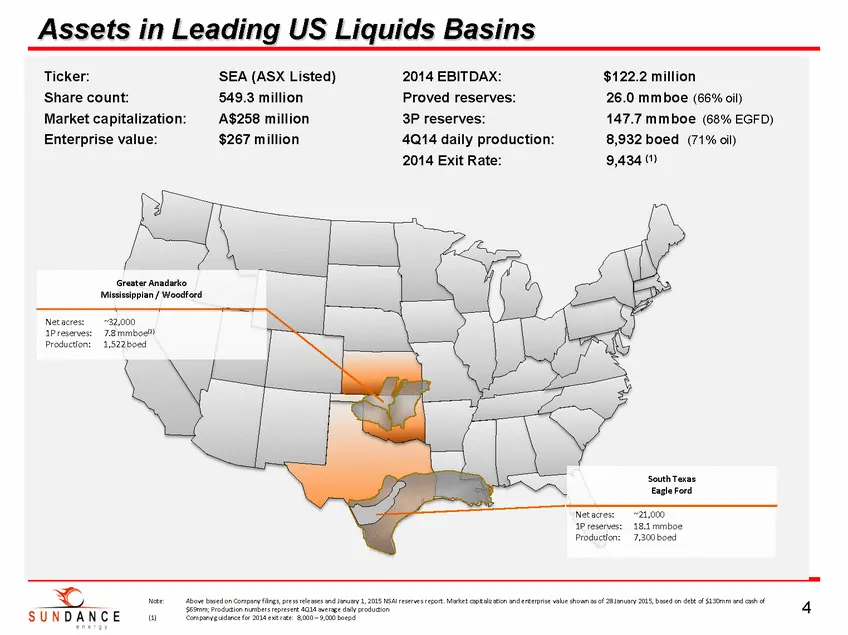
Net acres: ~21,000 1P reserves: 18.1 mmboe Production: 7,300 boed Assets in Leading US Liquids Basins 4 Ticker: SEA (ASX Listed) Share count: 549.3 million Market capitalization: A$258 million Enterprise value: $267 million Note: Above based on Company filings, press releases and January 1, 2015 NSA
Slide 5: Quarterly Overview
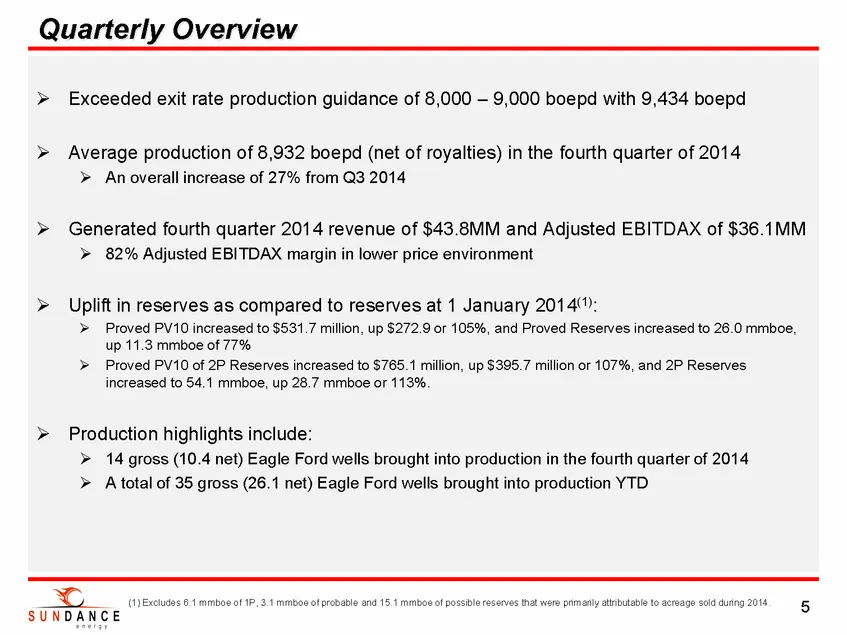
Quarterly Overview . Exceeded exit rate production guidance of 8,000 – 9,000 boepd with 9,434 boepd . Average production of 8,932 boepd (net of royalties) in the fourth quarter of 2014 . An overall increase of 27% from Q3 2014 . Generated fourth quarter 2014 revenue of $43.8MM and Adjusted EBITDAX o
Slide 6: Production and Revenue Trend
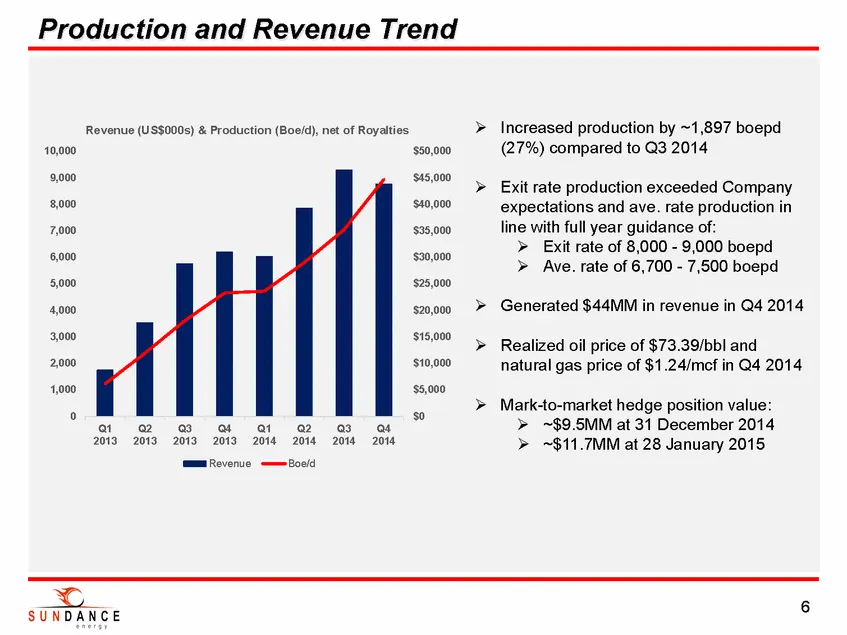
Production and Revenue Trend 6 .Increased production by ~1,897 boepd (27%) compared to Q3 2014 .Exit rate production exceeded Company expectations and ave. rate production in line with full year guidance of: .Exit rate of 8,000 - 9,000 boepd .Ave. rate of 6,700 - 7,500 boepd .Generated $44MM in reve
Slide 7: Adjusted EBITDAX Trend
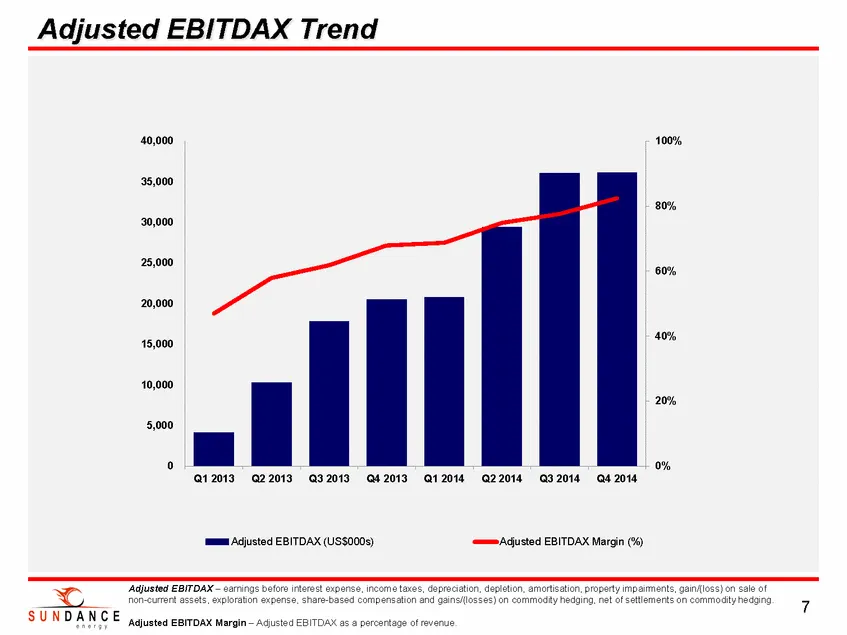
Adjusted EBITDAX Trend 7 Adjusted EBITDAX – earnings before interest expense, income taxes, depreciation, depletion, amortisation, property impairments, gain/(loss) on sale of non-current assets, exploration expense, share-based compensation and gains/(losses) on commodity hedging, net of settlement
Slide 8: Cash Costs per boe
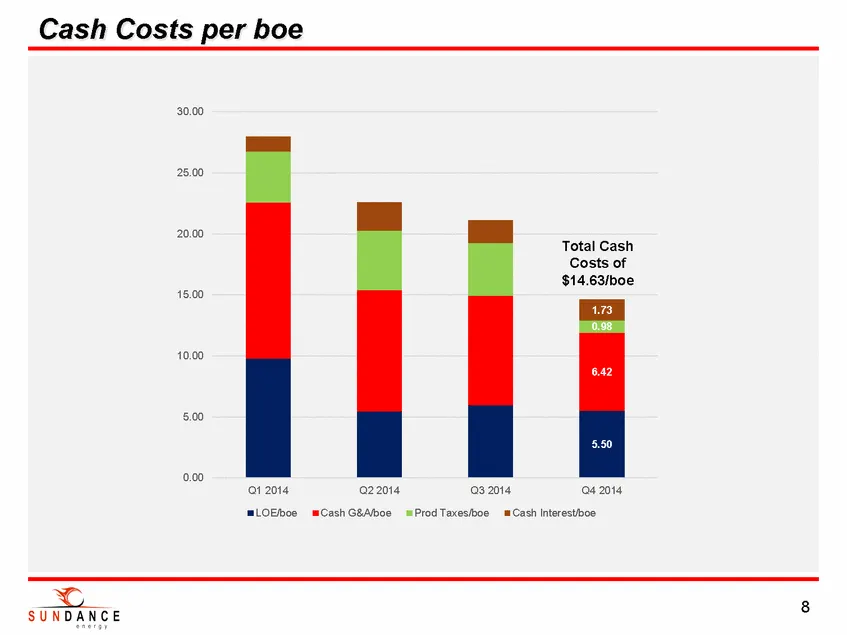
Cash Costs per boe 5.50 6.42 0.98 1.73 0.00 5.00 10.00 15.00 20.00 25.00 30.00 Q1 2014 Q2 2014 Q3 2014 Q4 2014 LOE/boe Cash G&A/boe Prod Taxes/boe Cash Interest/boe Total Cash Costs of $14.63/boe
Slide 9: Reserves Upgrade
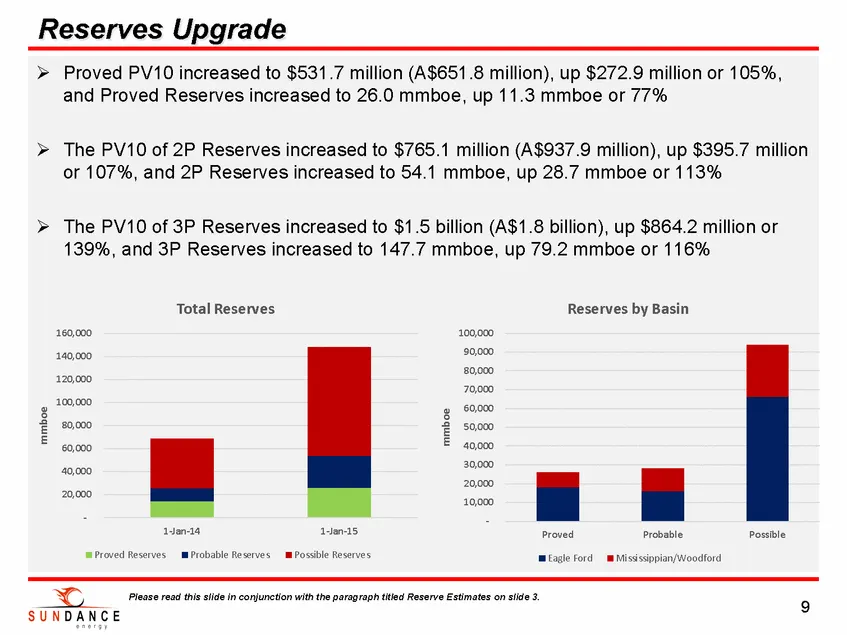
Reserves Upgrade . Proved PV10 increased to $531.7 million (A$651.8 million), up $272.9 million or 105%, and Proved Reserves increased to 26.0 mmboe, up 11.3 mmboe or 77% . The PV10 of 2P Reserves increased to $765.1 million (A$937.9 million), up $395.7 million or 107%, and 2P Reserves increased to
Slide 10: Eagle Ford Project
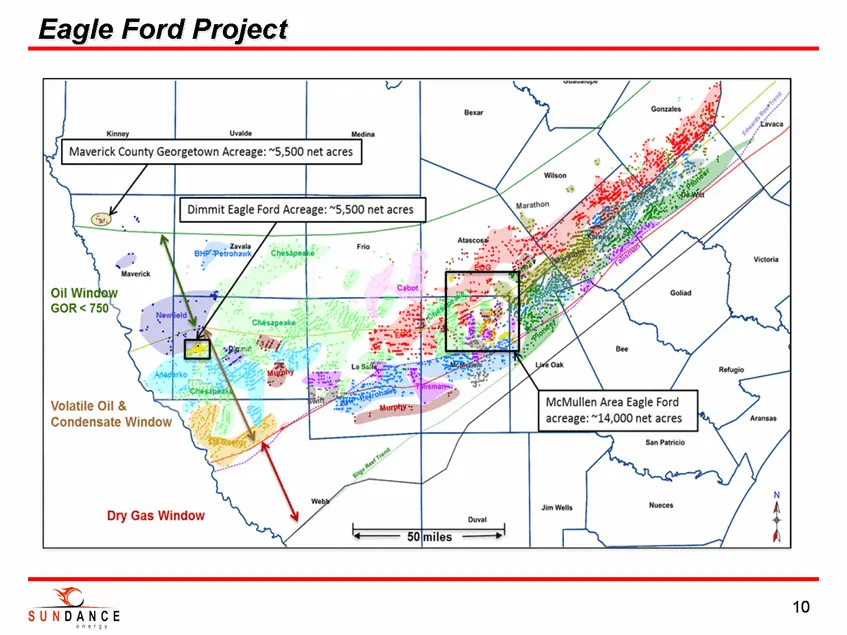
Eagle Ford Project Maverick County Georgetown, Dry Gas Window McMullen Area Eagle Ford ‘acreage: “14,000 net acres SUNDANCE 10
Slide 11: McMullen Project Overview
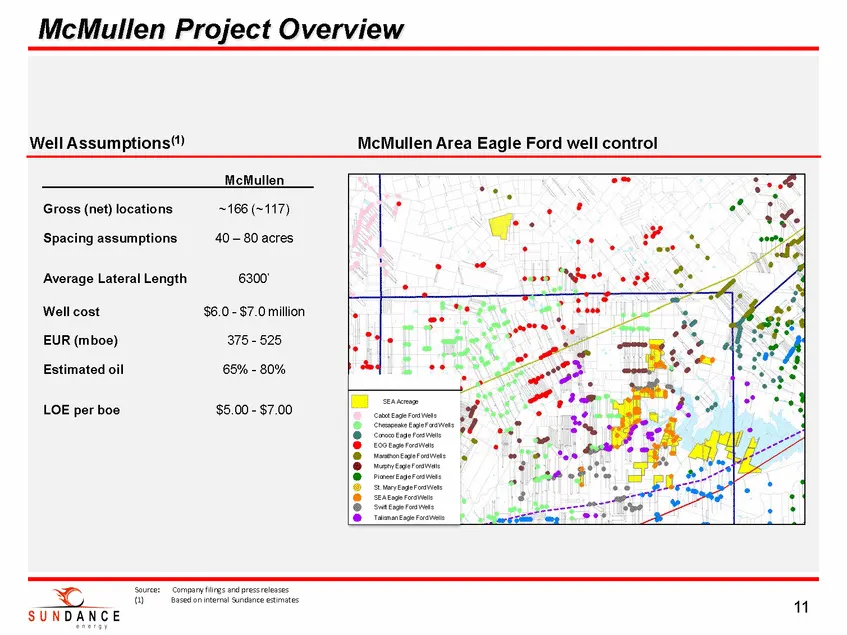
Well Assumptions(1) McMullen Project Overview 11 McMullen Gross (net) locations ~166 (~117) Spacing assumptions 40 – 80 acres Average Lateral Length 6300’ Well cost $6.0 - $7.0 million EUR (mboe) 375 - 525 Estimated oil 65% - 80% LOE per boe $5.00 - $7.00 LEGEND SEA Acreage Cabot Eagle Ford Wells Ch
Slide 12: Dimmit Eagle Ford Results
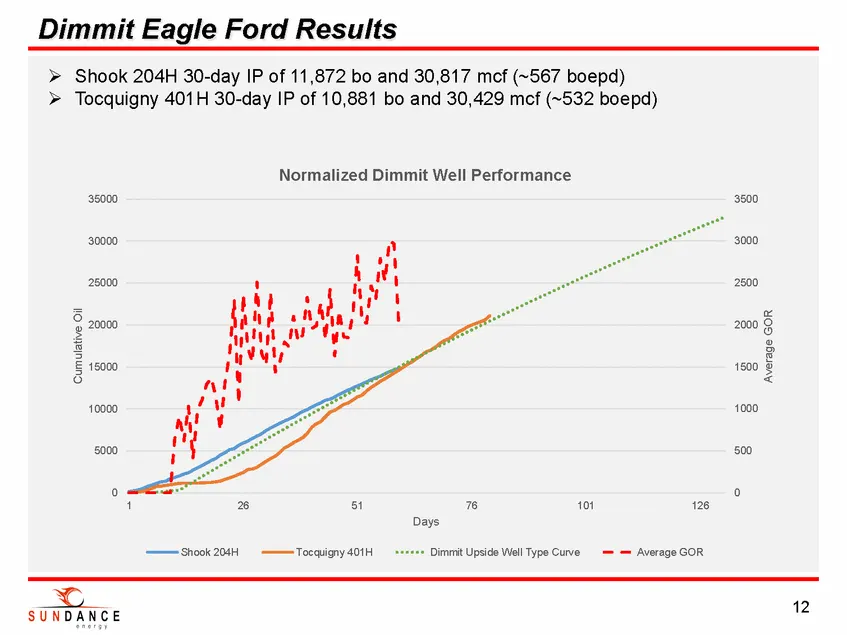
Dimmit Eagle Ford Results 0 500 1000 1500 2000 2500 3000 3500 0 5000 10000 15000 20000 25000 30000 35000 1 26 51 76 101 126 Average GOR Cumulative Oil Days Normalized Dimmit Well Performance Shook 204H Tocquigny 401H Dimmit Upside Well Type Curve Average GOR . Shook 204H 30-day IP of 11,872 bo and 3
Slide 13: Dimmit County Overview
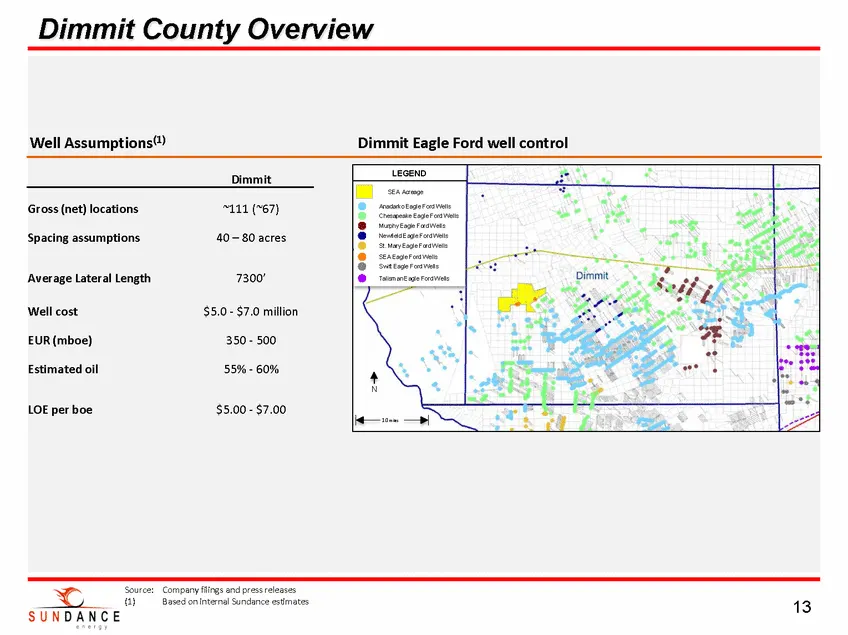
N Dimmit County Overview 13 Source: Company filings and press releases (1) Based on internal Sundance estimates Dimmit Eagle Ford well control Dimmit Gross (net) locations ~111 (~67) Spacing assumptions 40 – 80 acres Average Lateral Length 7300’ Well cost $5.0 - $7.0 million EUR (mboe) 350 - 500 Est
Slide 14: Appendix
SUNDANCE Appendix
Slide 15: Experienced Board and Management
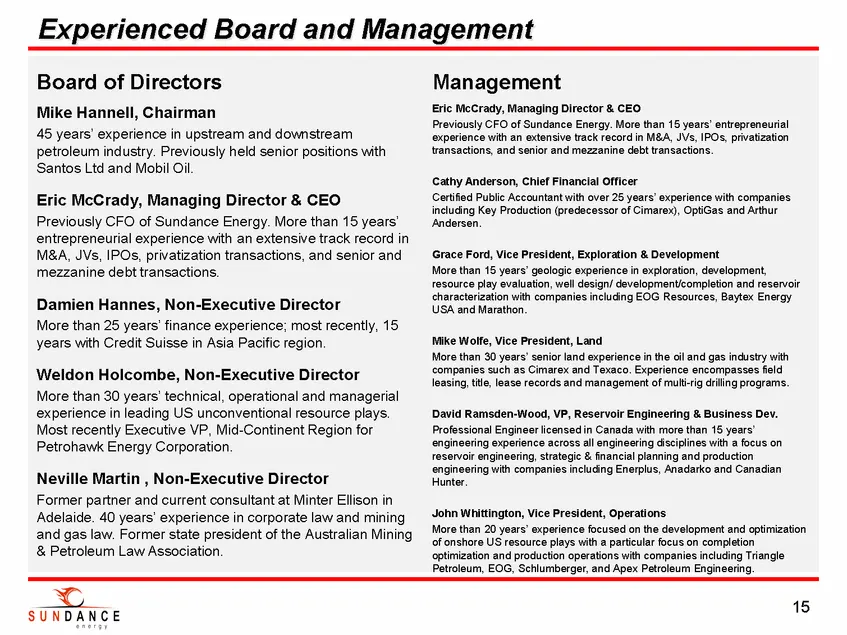
Experienced Board and Management Board of Directors Mike Hannell, Chairman 45 years’ experience in upstream and downstream petroleum industry. Previously held senior positions with Santos Ltd and Mobil Oil. Eric McCrady, Managing Director & CEO Previously CFO of Sundance Energy. More than 15 years’
Source: SEC EDGAR · 6-K filed Feb 4, 2015
More decks from Sundance Energy Inc
 Investor Presentation (February 2020)25 slides · Feb 10, 2020
 Sundance Energy Australia — Q3 2019 Earnings Presentation24 slides · Nov 18, 2019
 Sundance Energy Australia — Q2 2019 Earnings Presentation25 slides · Aug 16, 2019
 Sundance Energy Australia — Investor Presentation (July 2019)19 slides · Jul 24, 2019
 Sundance Energy Australia — Investor Presentation (June 2019)16 slides · Jun 3, 2019
 Sundance Energy Australia — Q1 2019 Earnings Presentation17 slides · May 21, 2019