Diamond Foods — BB&T Client Meetings February 2009
38 slides from Diamond Foods's conference presentation, Feb 17, 2009
Slide 1: Thriving Today. Investing for Tomorrow.
THRIVING TODAY. INVESTING FOR TOMORROW. BB&T Client Meetings February 2009 DF-Analyst_2-09-09
Slide 2: Important Information
Important Information This material contains forward-looking statements, including forecasts of growth, long- term financial goals, expanding margins, industry growth and our strategic plans, that involve known and unknown risks and uncertainties that may cause actual results, levels of activity, pe
Slide 3: Quality Brands That Retailers and Consumers Value and Trust
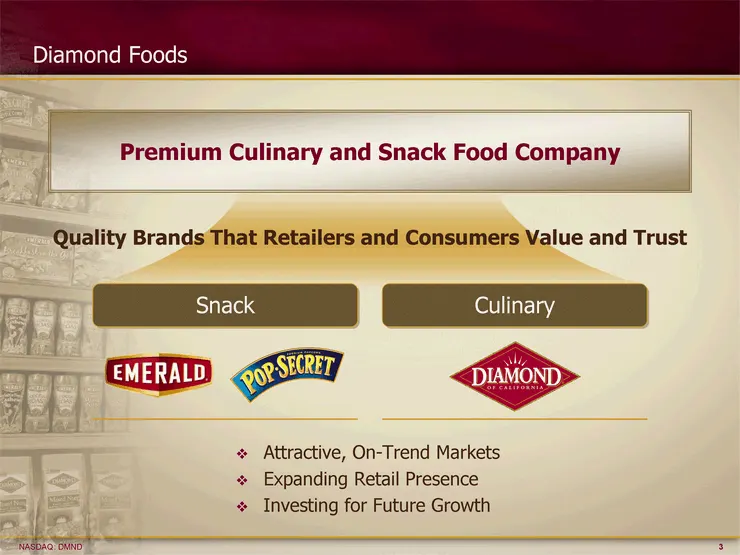
Quality Brands That Retailers and Consumers Value and Trust Premium Culinary and Snack Food Company Diamond Foods Attractive, On-Trend Markets Expanding Retail Presence Investing for Future Growth Snack Culinary
Slide 4: Snack: Bringing Excitement to the Category
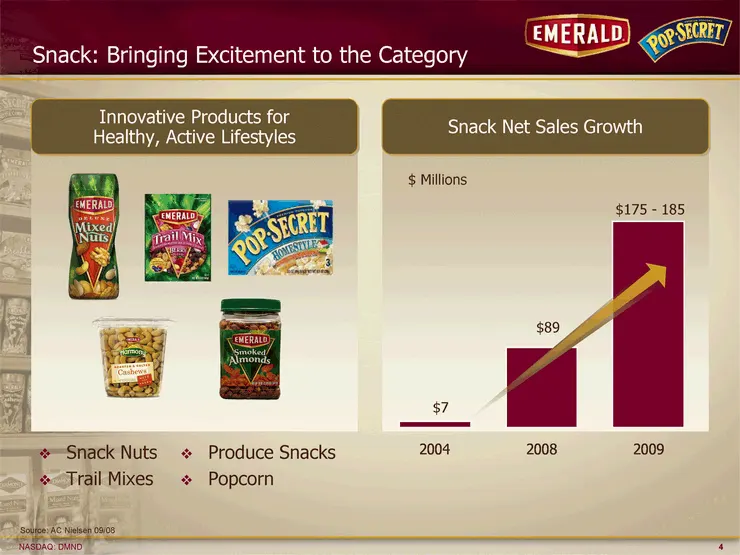
Snack Net Sales Growth Snack: Bringing Excitement to the Category Snack Nuts Trail Mixes 2004 2008 2009 snack 7 89 230 $7 $89 $175 - 185 Snack Net Sales Growth $ Millions Source: AC Nielsen 09/08 Innovative Products for Healthy, Active Lifestyles Produce Snacks Popcorn
Slide 5: Culinary: History of Quality and Commitment
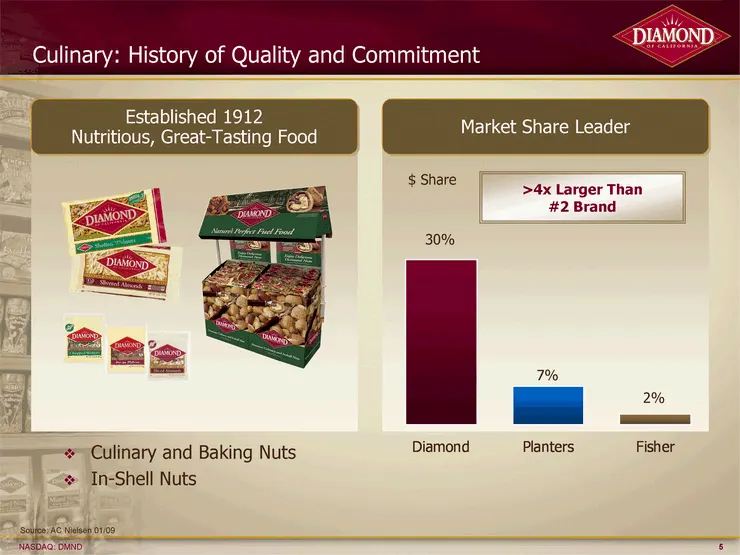
Culinary: History of Quality and Commitment Culinary and Baking Nuts In-Shell Nuts Diamond Planters Fisher snack 30 7 2 Market Share Leader $ Share Source: AC Nielsen 01/09 Established 1912 Nutritious, Great-Tasting Food 30% 7% 2% >4x Larger Than #2 Brand

Slide 6: Well-Positioned with Today's Consumers
Well-Positioned with Today's Consumers Low Cost, Filling, Whole-Grain Snack Complement to At-Home Entertainment Versatile and Protein-Rich Food Ingredient for Healthy, Speed-Scratch Meals Convenient Nutritious Snack Satiating Meal Replacement Consumer Value for Nutrition, Taste and Convenience
Slide 7: Large Addressable Retail Markets
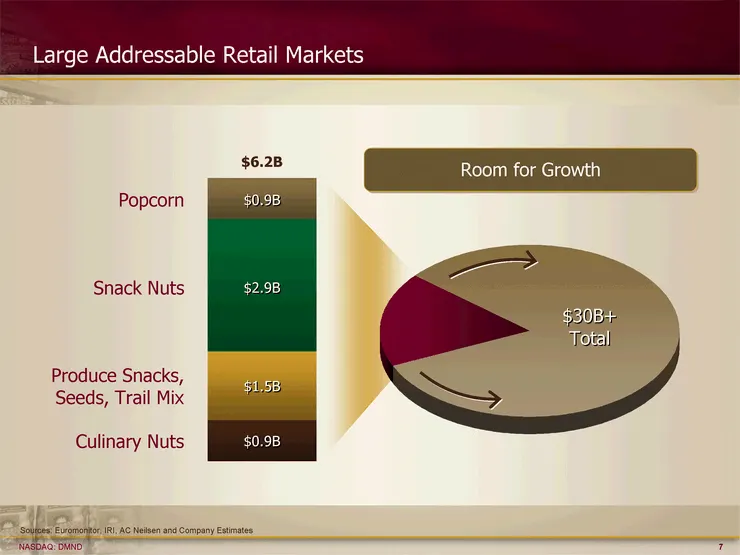
Large Addressable Retail Markets Produce Snacks, Seeds, Trail Mix Culinary Nuts Category total 24.7 Snack 5.3 $30B+ Total 0.9 1.5 2.9 0.9 $0.9B $1.5B $0.9B $6.2B Room for Growth Popcorn Snack Nuts $2.9B Sources: Euromonitor, IRI, AC Neilsen and Company Estimates
Slide 8: Multiple Paths to Growth
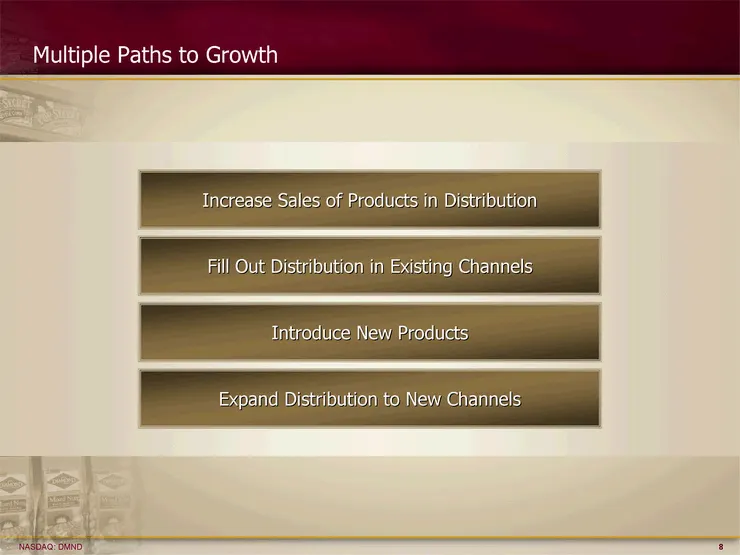
Multiple Paths to Growth Increase Sales of Products in Distribution Fill Out Distribution in Existing Channels Introduce New Products Expand Distribution to New Channels
Slide 9: Expanding Retail Presence
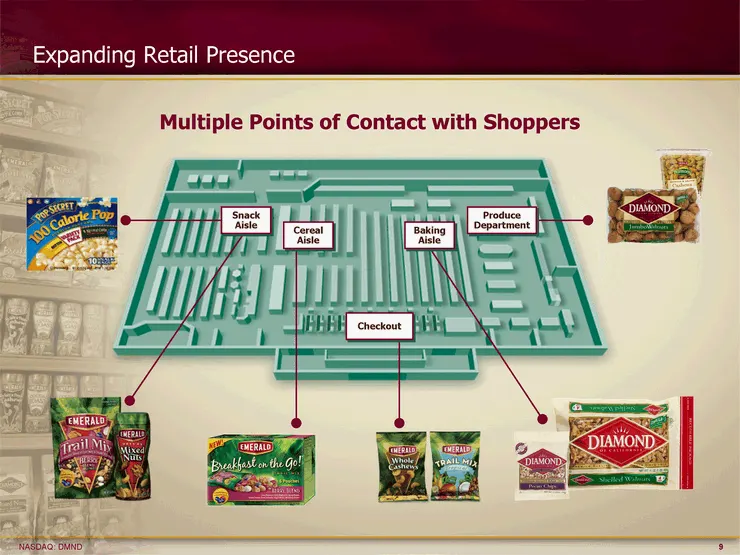
Expanding Retail Presence Multiple Points of Contact with Shoppers Cereal Aisle Checkout Baking Aisle Snack Aisle Produce Department
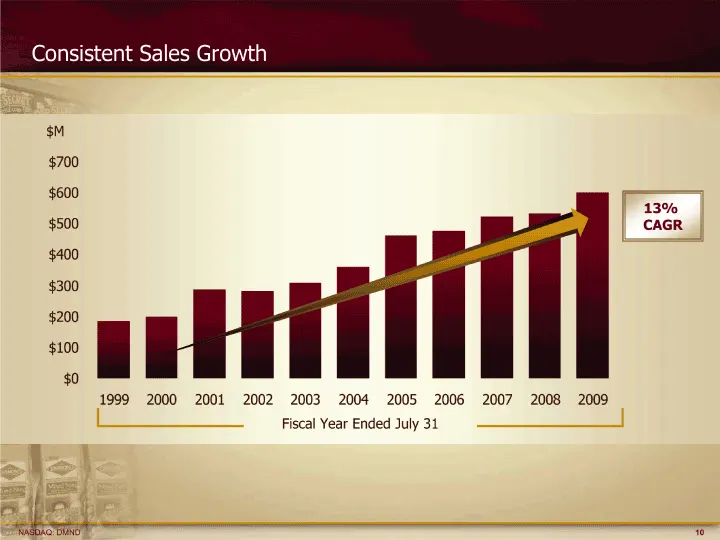
Slide 10: Consistent Sales Growth
Consistent Sales Growth 1999 184 2000 200 2001 287.729 2002 282.158 2003 308.45 2004 359.683 2005 462.548 2006 477.205 2007 522.585 2008 531.492 2009 600 Fiscal Year Ended July 31 13% CAGR $M
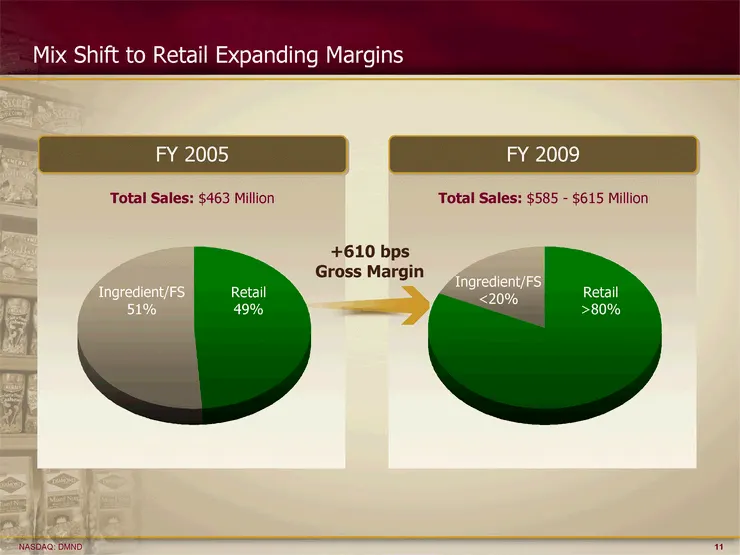
Slide 11: Mix Shift to Retail, Expanding Margins
Total Sales: $463 Million FY 2005 Total Sales: $585 - $615 Million FY 2009 Mix Shift to Retail Expanding Margins +610 bps Gross Margin Ret Non East 49 51 23 Ret Non East 82 18 23 Ingredient/FS 51% Retail 49% Ingredient/FS <20% Retail >80%
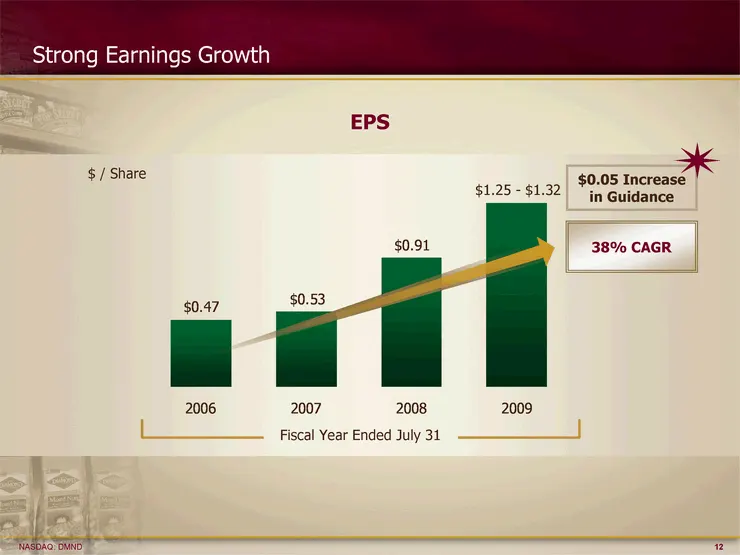
Slide 12: Strong Earnings Growth
Strong Earnings Growth 2006 2007 2008 2009 EPS 0.47 0.53 0.91 1.29 EPS 38% CAGR $ / Share Fiscal Year Ended July 31 $1.25 - $1.32 $0.05 Increase in Guidance
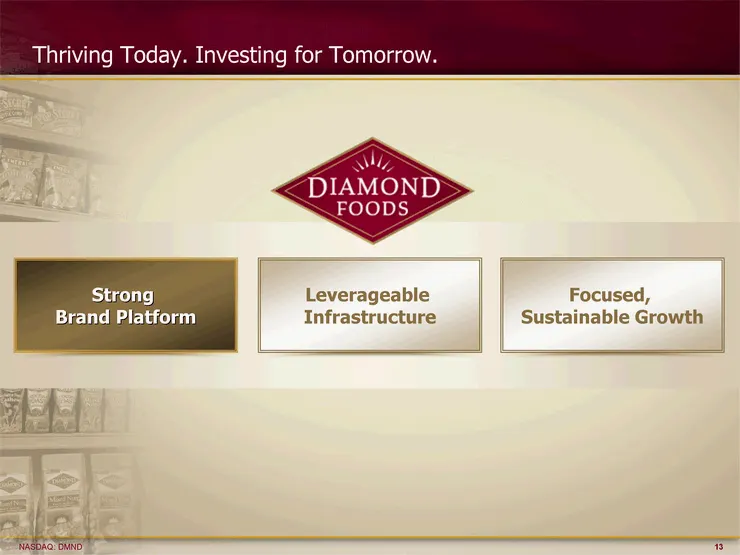
Slide 13: Focused, Sustainable Growth
Focused, Sustainable Growth Leverageable Infrastructure Strong Brand Platform Thriving Today. Investing for Tomorrow.
Slide 14: Focused Brand Platform
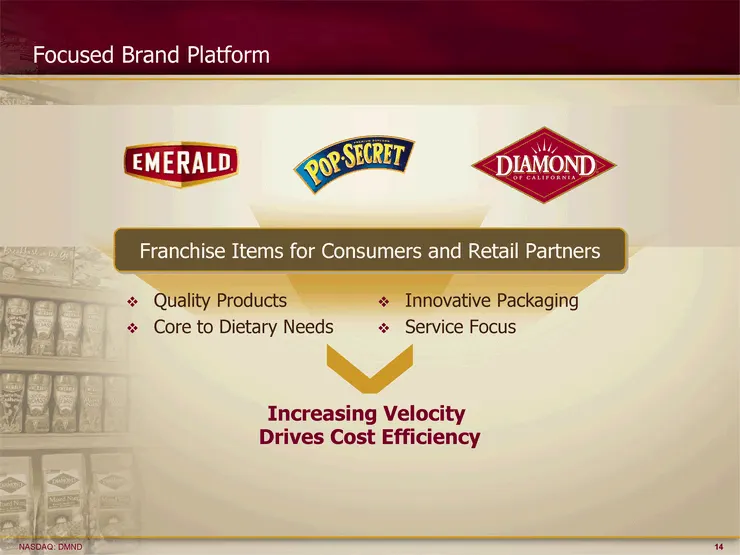
Focused Brand Platform Increasing Velocity Drives Cost Efficiency Franchise Items for Consumers and Retail Partners Quality Products Core to Dietary Needs Innovative Packaging Service Focus
Slide 15: Evolving Our Value Proposition
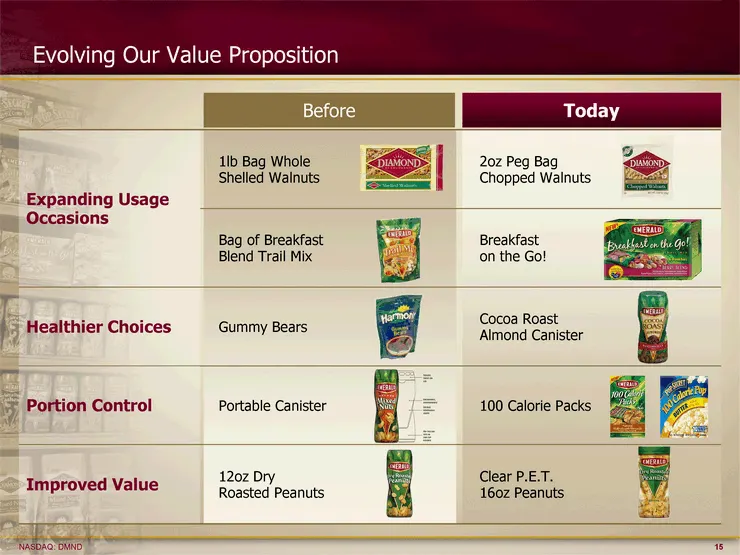
Evolving Our Value Proposition Before Today Clear P.E.T. 16oz Peanuts 12oz Dry Roasted Peanuts Improved Value Cocoa Roast Almond Canister Gummy Bears Healthier Choices Breakfast on the Go! Bag of Breakfast Blend Trail Mix 2oz Peg Bag Chopped Walnuts 1lb Bag Whole Shelled Walnuts Expanding Usage Occa
Slide 16: Pop Secret Revenue Mix
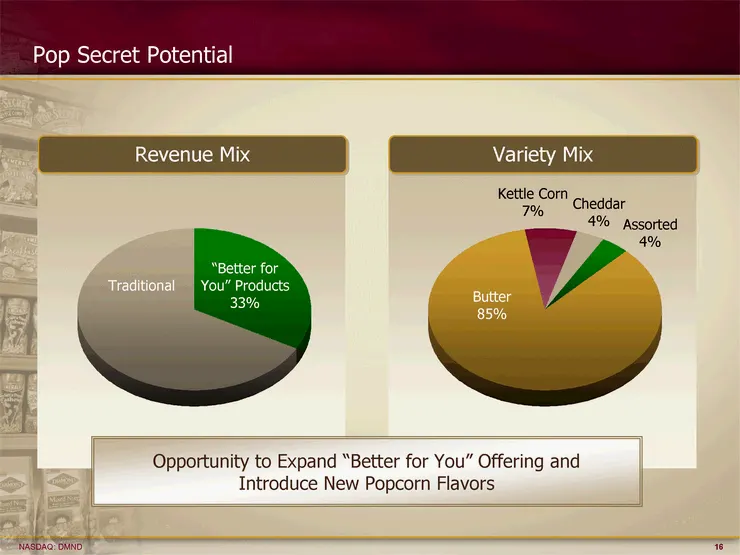
Revenue Mix Variety Mix Pop Secret Potential Traditional "Better for You" Products 33% Butter 85% Kettle Corn 7% Opportunity to Expand "Better for You" Offering and Introduce New Popcorn Flavors Cheddar 4% Assorted 4%
Slide 17: Popcorn Fit with Snack Trends
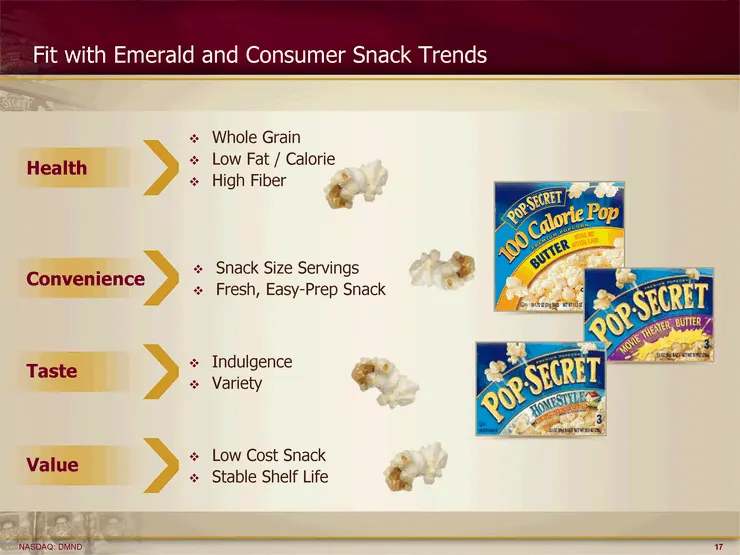
Whole Grain Low Fat / Calorie High Fiber Health Snack Size Servings Fresh, Easy-Prep Snack Convenience Indulgence Variety Taste Fit with Emerald and Consumer Snack Trends Low Cost Snack Stable Shelf Life Value
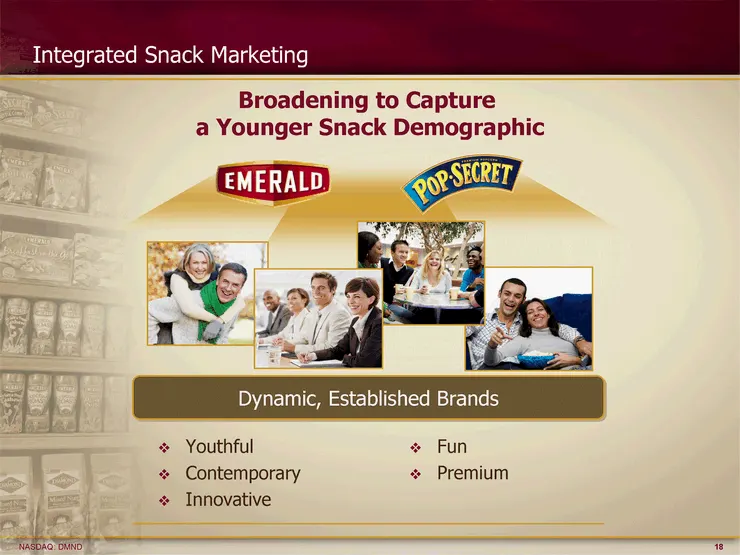
Slide 18: Integrated Snack Marketing
Integrated Snack Marketing Broadening to Capture a Younger Snack Demographic Youthful Contemporary Innovative Fun Premium
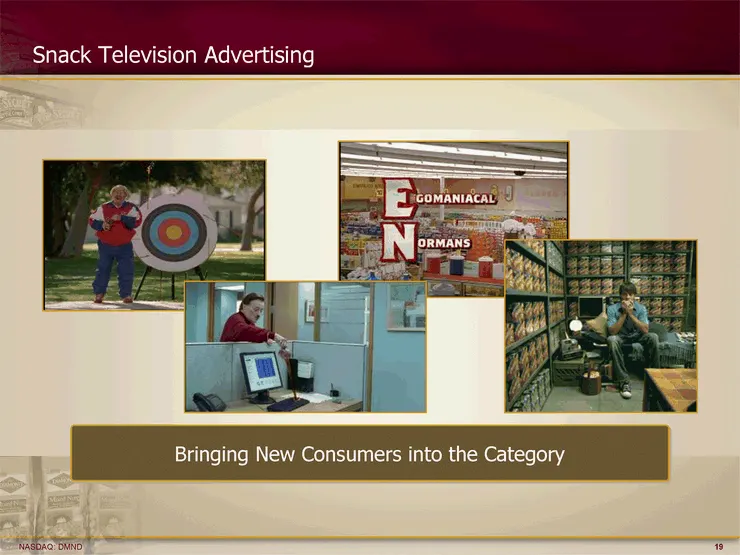
Slide 19: Snack Television Advertising
Snack Television Advertising Bringing New Consumers into the Category
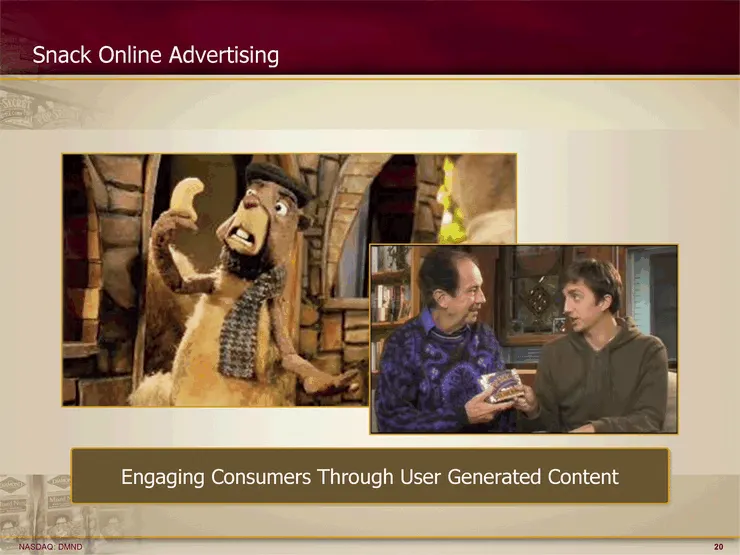
Slide 20: Snack Online Advertising
Snack Online Advertising Engaging Consumers Through User Generated Content
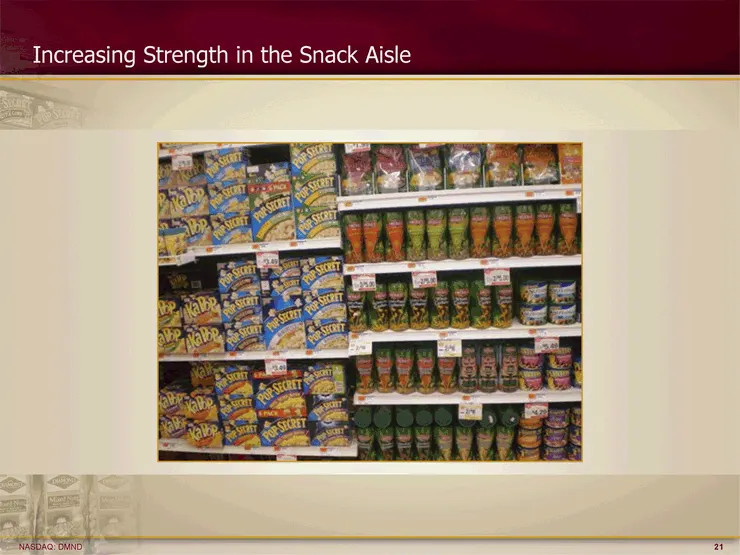
Slide 21: Increasing Strength in the Snack Aisle
Increasing Strength in the Snack Aisle
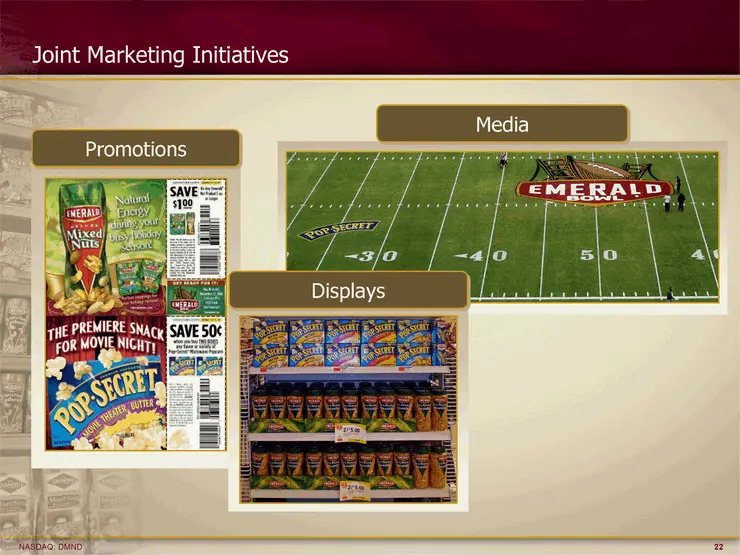
Slide 22: Joint Marketing Initiatives
Joint Marketing Initiatives Promotions Media Displays
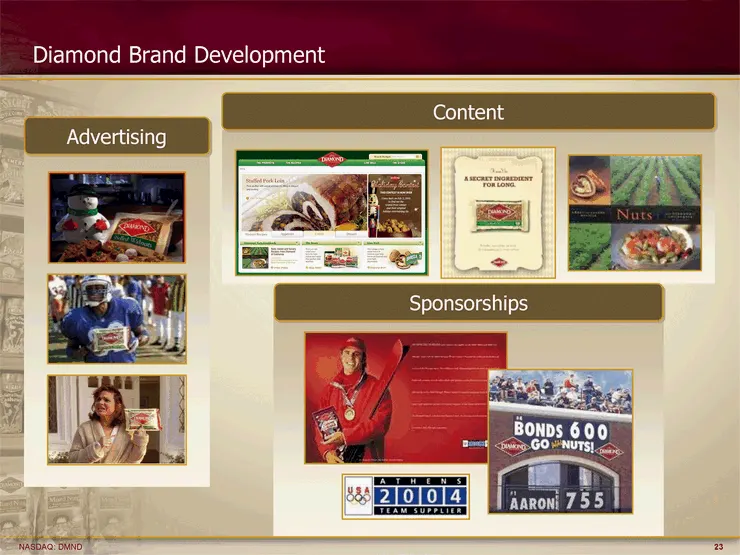
Slide 23: Diamond Brand Development
Diamond Brand Development Advertising Content Sponsorships
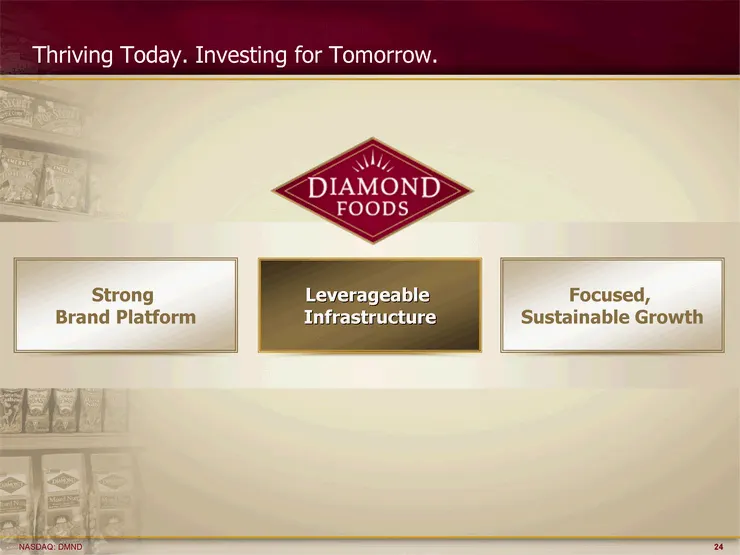
Slide 24: Focused, Sustainable Growth
Focused, Sustainable Growth Leverageable Infrastructure Strong Brand Platform Thriving Today. Investing for Tomorrow.
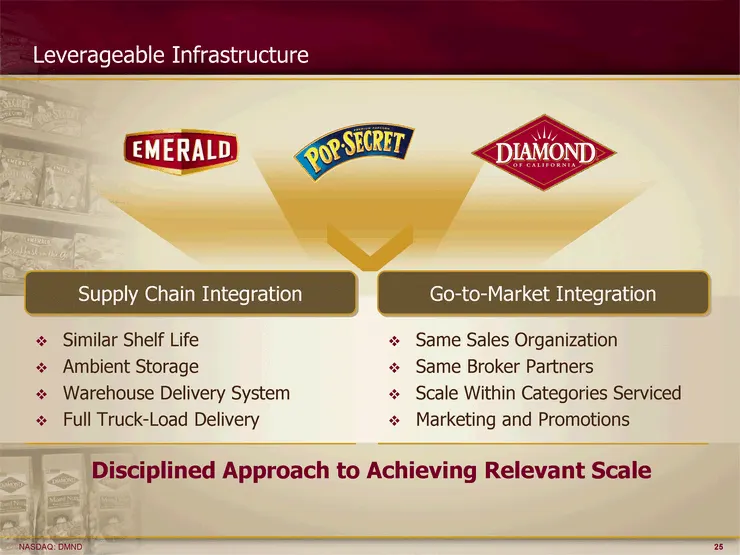
Slide 25: Leverageable Infrastructure
Leverageable Infrastructure Same Sales Organization Same Broker Partners Scale Within Categories Serviced Marketing and Promotions Go-to-Market Integration Similar Shelf Life Ambient Storage Warehouse Delivery System Full Truck-Load Delivery Supply Chain Integration Disciplined Approach to Achieving
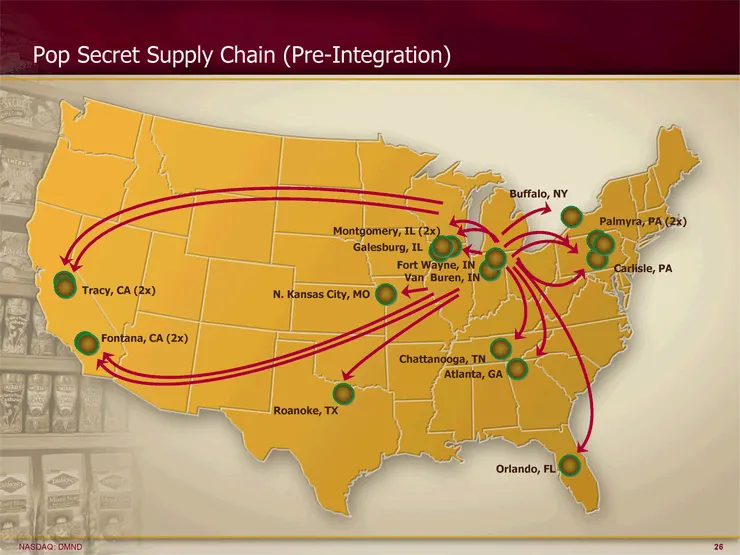
Slide 26: Pop Secret Supply Chain (Pre-Integration)
Pop Secret Supply Chain (Pre-Integration) Galesburg, IL Fort Wayne, IN Atlanta, GA Tracy, CA (2x) Carlisle, PA Van Buren, IN Fontana, CA (2x) Palmyra, PA (2x) Montgomery, IL (2x) Roanoke, TX Orlando, FL Chattanooga, TN Buffalo, NY N. Kansas City, MO
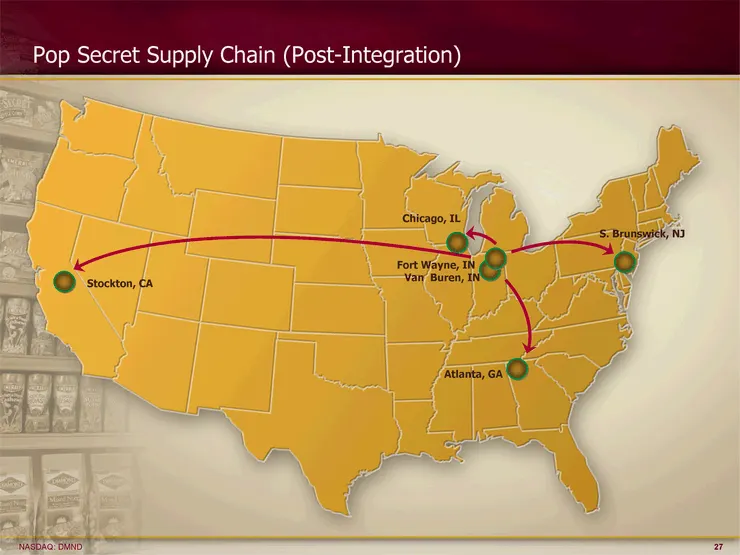
Slide 27: Pop Secret Supply Chain (Post-Integration)
Pop Secret Supply Chain (Post-Integration) Fort Wayne, IN Atlanta, GA Stockton, CA Van Buren, IN S. Brunswick, NJ Chicago, IL
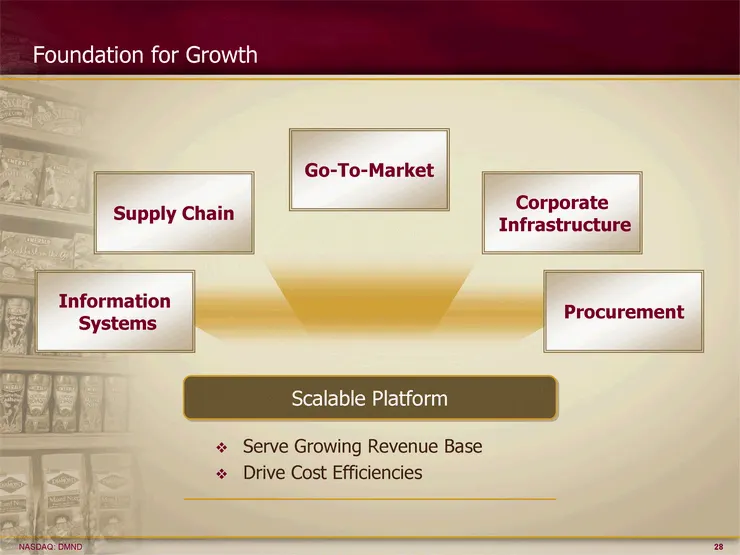
Slide 28: Foundation for Growth
Foundation for Growth Scalable Platform Serve Growing Revenue Base Drive Cost Efficiencies Information Systems Supply Chain Go-To-Market Corporate Infrastructure Procurement
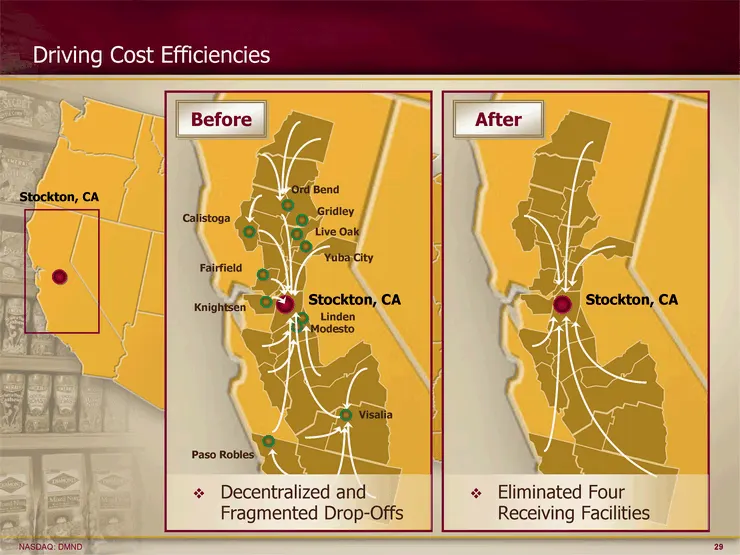
Slide 29: Stockton, CA Driving Cost Efficiencies
Stockton, CA Driving Cost Efficiencies Before Decentralized and Fragmented Drop-Offs After Eliminated Four Receiving Facilities
Slide 30: Focused, Sustainable Growth
Focused, Sustainable Growth Leverageable Infrastructure Strong Brand Platform Thriving Today. Investing for Tomorrow.
Slide 31: Consistent Quarterly Top Line Growth
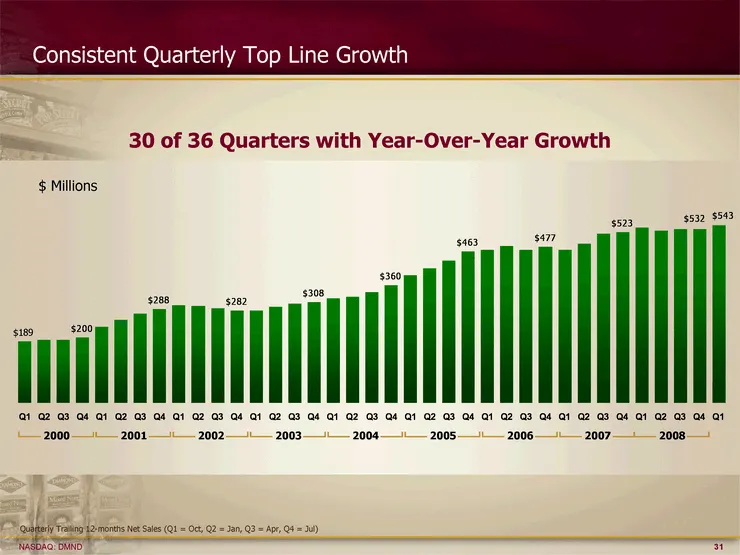
30 of 36 Quarters with Year-Over-Year Growth Consistent Quarterly Top Line Growth Sales Q1 189 Q2 193 Q3 194 Q4 200 Q1 234 Q2 253 Q3 272 Q4 288 Q1 298 Q2 296 Q3 289 Q4 282 Q1 282 Q2 293 Q3 303 Q4 308 Q1 319 Q2 325 Q3 340 Q4 360 Q1 390 Q2 412 Q3 435 Q4 463 Q1 468 Q2 480 Q3 468 Q4 477 Q1 468.7 Q2 488.
Slide 32: Consistent Quarterly Bottom Line Growth
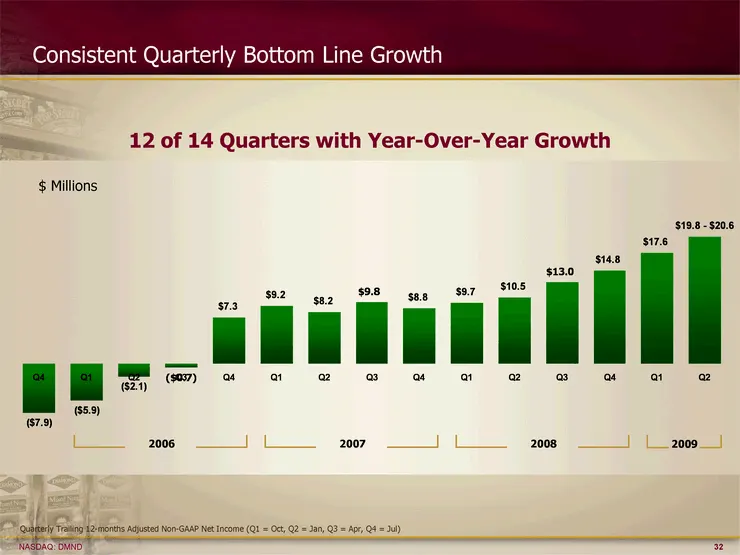
12 of 14 Quarters with Year-Over-Year Growth Consistent Quarterly Bottom Line Growth Sales Q4 -7.9 Q1 -5.9 Q2 -2.1 Q3 -0.7 Q4 7.3 Q1 9.2 Q2 8.2 Q3 9.8 Q4 8.8 Q1 9.7 Q2 10.5 Q3 13 Q4 14.8 Q1 17.6 Q2 20.2 $ Millions Quarterly Trailing 12-months Adjusted Non-GAAP Net Income (Q1 = Oct, Q2 = Jan, Q3 = Ap
Slide 33: Near-Term Financial Targets
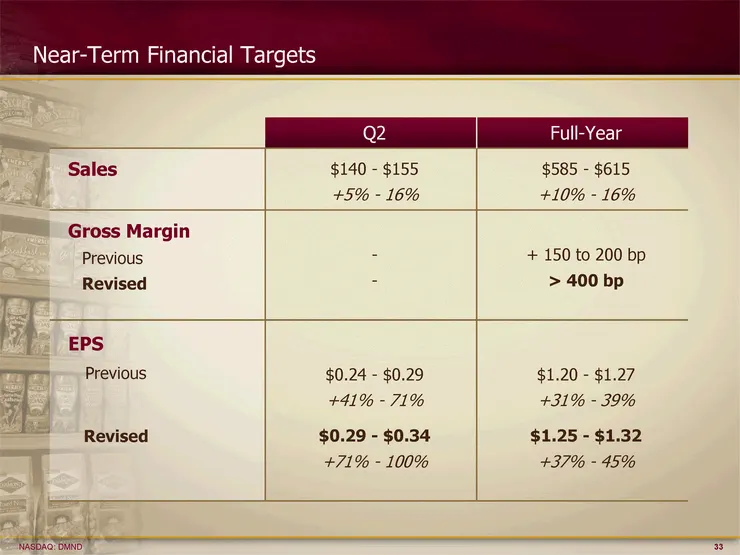
Near-Term Financial Targets Q2 Full-Year Sales $140 - $155 +5% - 16% $585 - $615 +10% - 16% Gross Margin Previous Revised - - - - + 150 to 200 bp > 400 bp EPS Previous Revised $0.24 - $0.29 +41% - 71% $0.29 - $0.34 +71% - 100% $1.20 - $1.27 +31% - 39% $1.25 - $1.32 +37% - 45%
Slide 34: Attractive Cash Flow Profile
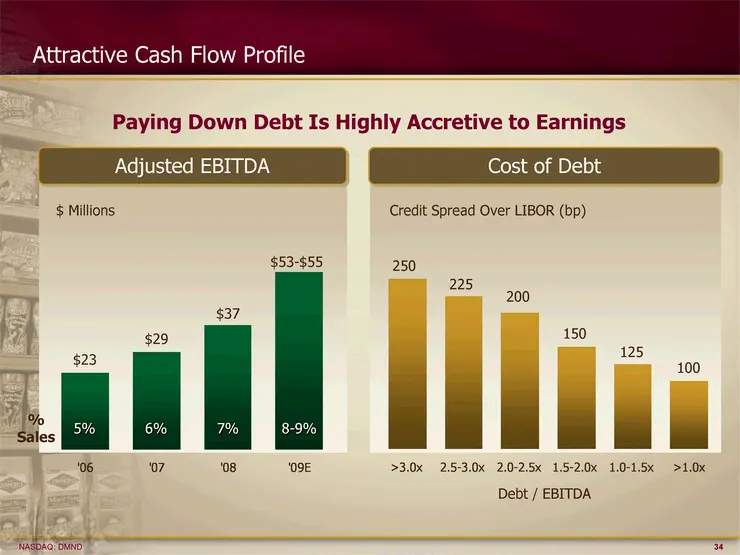
'06 '07 '08 '09E Adjusted 23 29 37 53 Attractive Cash Flow Profile $ Millions Adjusted EBITDA >3.0x 2.5-3.0x 2.0-2.5x 1.5-2.0x 1.0-1.5x >1.0x Debt 250 225 200 150 125 100 Cost of Debt $23 $53-$55 $29 $37 % Sales 5% 6% 7% 8-9% Paying Down Debt Is Highly Accretive to Earnings 250 225 200 150 125 100 C
Slide 35: Financial Summary
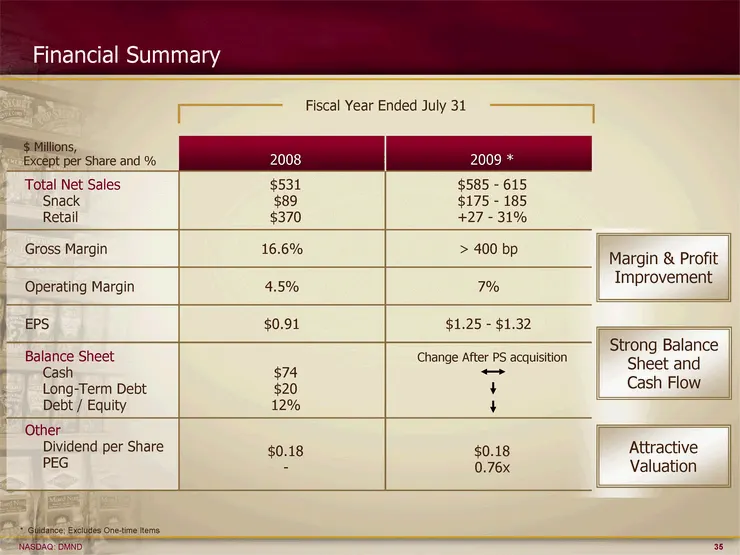
Financial Summary Margin & Profit Improvement Strong Balance Sheet and Cash Flow Attractive Valuation $ Millions, Except per Share and % 2008 2009 * Total Net Sales Snack Retail $531 $89 $370 $585 - 615 $175 - 185 +27 - 31% Gross Margin 16.6% > 400 bp Operating Margin 4.5% 7% EPS $0.91 $1.25 - $1.32
Slide 36: Sustainable Earnings Growth Drivers
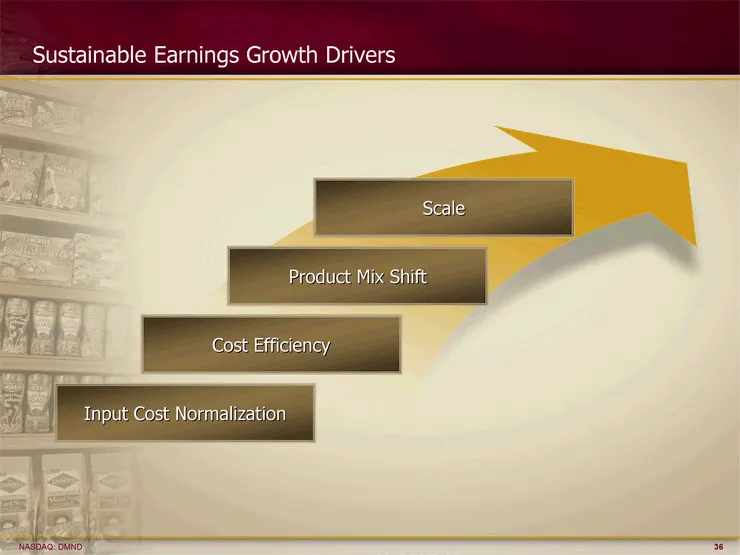
Sustainable Earnings Growth Drivers Input Cost Normalization Cost Efficiency Product Mix Shift Scale
Slide 37: A Transformational Company
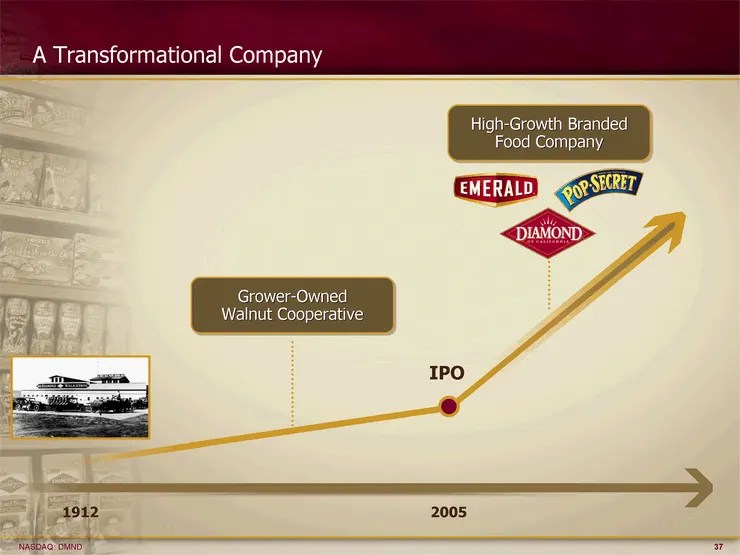
A Transformational Company 1912 2005 IPO Grower-Owned Walnut Cooperative High-Growth Branded Food Company

Slide 38: Thriving Today. Investing for Tomorrow.
THRIVING TODAY. INVESTING FOR TOMORROW.
Source: SEC EDGAR · 8-K filed Feb 17, 2009
More decks from Diamond Foods Inc
 Investor Presentation (June 2013)21 slides · Jun 17, 2013
 Investor Presentation (April 2013)21 slides · Apr 29, 2013
 Investor Presentation (February 2013)20 slides · Feb 26, 2013
 Q3 2012 Earnings Presentation18 slides · Nov 14, 2012
 Debt Investor Presentation (May 2012)18 slides · May 23, 2012
 Barclays Capital Back-to-School Consumer Conference 201141 slides · Sep 7, 2011